Use of Software on Modeling Hazardous Substance Release as a Support Tool for Crisis Management

 ,
, 

Abstract
1. Introduction
2. Materials and Methods
2.1. The Ability of a Building to Prevent the Dispersion of Dangerous Materials
- VW is whole volume of gas in the building,
- VA is air volume in the building before leakage of hazardous materials,
- VHM is hazardous materials volume in gas phase.
2.2. Addressing a Model Situation
3. Results of Modeling
3.1. The Classic Method (Without the Inclusion of Reserve of Hazardous Materials in the Building)
3.2. Alternative (Proposed) Method
4. Discussion
5. Conclusions
Author Contributions
Funding
Institutional Review Board Statement
Informed Consent Statement
Data Availability Statement
Acknowledgments
Conflicts of Interest
References
- Pech, M.; Vrchota, J. Classification of Small- and Medium-Sized Enterprises Based on the Level of Industry 4.0 Implementation. Appl. Sci. 2020, 10, 5150. [Google Scholar] [CrossRef]
- The Concept of Intelligent Industry for Slovakia. Available online: https://www.mhsr.sk/inovacie/strategie-a-politiky/smart-industry (accessed on 17 September 2020).
- Kiel, D.; Müller, J.; Arnold, C.; Voigt, K.-I. Sustainable Industrial Value Creation: Benefits and Challenges of Industry 4.0. Int. J. Innov. Manag. 2017, 21, 1740015. [Google Scholar] [CrossRef]
- Gibson, R. Beyond the Pillars: Sustainability assessment as a framework for effective integration of social, economic and ecological considerations in significant decision-making. J. Environ. Assess. Policy Manag. 2006, 8, 259–280. [Google Scholar] [CrossRef]
- Sridhar, K.; Jones, G. The three fundamental criticisms of the Triple Bottom Line approach. An empirical study to link sustainability reports in companies based in the Asia-Pacific region and TBL shortcomings. Asian J. Bus. Ethics 2013, 2, 91–111. [Google Scholar] [CrossRef]
- Sangwan, S.R.; Bhatia, M.P.S. Sustainable Development in Industry 4.0. In A Roadmap to Industry 4.0: Smart Production, Sharp Business and Sustainable Development; Advances in Science, Technology & Innovation; Anand, N., Akshi, K., Eds.; Springer: Cham, Switzerland, 2020; pp. 39–56. [Google Scholar]
- Müller, J.M.; Kiel, D.; Voigt, K.-I. What Drives the Implementation of Industry 4.0? The Role of Opportunities and Challenges in the Context of Sustainability. Sustainability 2018, 10, 247. [Google Scholar] [CrossRef]
- Brettel, M.; Friederichsen, N.; Keller, M.; Rosenberg, M. How Virtualization, Decentralization and Network Building Change the Manufacturing Landscape: An Industry 4.0 Perspective. Int. J. Mech. Aerosp. Ind. Mechatron. Eng. 2014, 8, 37–44. [Google Scholar]
- Hansen, E.G.; Grosse-Dunker, F.; Reichwald, R. Sustainability innovation cube—A framework to evaluate sustainability-oriented innovations. Int. J. Innov. Manag. 2009, 13, 683–713. [Google Scholar] [CrossRef]
- Çınar, Z.M.; Abdussalam Nuhu, A.; Zeeshan, Q.; Korhan, O.; Asmael, M.; Safaei, B. Machine Learning in Predictive Maintenance towards Sustainable Smart Manufacturing in Industry 4.0. Sustainability 2020, 12, 8211. [Google Scholar] [CrossRef]
- Kamble, S.; Gunasekaran, A.; Dhone, N.C. Industry 4.0 and lean manufacturing practices for sustainable organisational performance in Indian manufacturing companies. Int. J. Prod. Res. 2020, 58, 1319–1337. [Google Scholar] [CrossRef]
- Kagermann, H. Change through digitization—Value creation in the age of Industry 4.0. In Management of Permanent Change; Albach, H., Meffert, H., Pinkwart, A., Reichwald, R., Eds.; Springer Gabler: Wiesbaden, Germany, 2015; pp. 23–45. [Google Scholar]
- Tureková, I.; Gašpercová, S.; Brečka, P.; Valentová, M. Risk management applied in terms of practical training at university. In Proceedings of the 11th International Technology, Education and Development Conference, INTED 2017, Valencia, Spain, 6–8 March 2017; pp. 465–475. [Google Scholar]
- Grabowska, S.; Gajdzik, B.; Saniuk, S. The role and impact of industry 4.0 on business models. In Sustainable Logistics and Production in Industry 4.0. New Opportunities and Challenges; Grzybowska, K., Awasthi, A., Sawhney, R., Eds.; Springer: New York, NY, USA, 2020; pp. 31–50. [Google Scholar]
- Machado, C.G.; Winroth, M.P.; Ribeiro da Silva, E.H.D. Sustainable manufacturing in Industry 4.0: An emerging research agenda. Int. J. Prod. Res. 2020, 58, 1462–1484. [Google Scholar] [CrossRef]
- Gobbo, J.A.; Busso, C.M.; Gobbo, S.C.O.; Carreão, H. Making the links among environmental protection, process safety, and industry 4.0. Process Saf. Environ. Prot. 2018, 117, 372–382. [Google Scholar] [CrossRef]
- Tupa, J.; Simota, J.; Steinar, F. Aspects of Risk Management Implementation for Industry 4.0. Procedia Manuf. 2017, 11, 1223–1230. [Google Scholar] [CrossRef]
- Elattar, S.; Abed, A.M.; Alrowais, F. Safety Maintains Lean Sustainability and Increases Performance through Fault Control. Appl. Sci. 2020, 10, 6851. [Google Scholar] [CrossRef]
- Folch-Calvo, M.; Brocal-Fernández, F.; González-Gaya, C.; Sebastián, M.A. Analysis and Characterization of Risk Methodologies Applied to Industrial Parks. Sustainability 2020, 12, 7294. [Google Scholar] [CrossRef]
- Qiao, W.; Member, S.; Lu, D.; Member, S. A Survey on Wind Turbine Condition Monitoring and Fault Diagnosis—Part I: Components. IEEE Trans. Ind. Electron. 2015, 62, 6536–6545. [Google Scholar] [CrossRef]
- Jasiulewicz-Kaczmarek, M.; Gola, A. Maintenance 4.0 Technologies for Sustainable Manufacturing—An Overview. IFAC-PapersOnLine 2019, 52, 91–96. [Google Scholar] [CrossRef]
- Öcal, E.; Laptali, E.; Erdis, E. Crisis management in Turkish construction industry. Build. Environ. 2006, 41, 1498–1503. [Google Scholar] [CrossRef]
- Ritchie, B.W. Chaos, crises and disasters: A strategic approach to crisis management in the tourism industry. Tour. Manag. 2004, 25, 669–683. [Google Scholar] [CrossRef]
- Darling, J.; Hannu, O.; Raimo, N. Crisis management in international business: A case situation in decision making concerning trade with Russia. Finn. J. Bus. Econ. 1996, 4, 12–25. [Google Scholar]
- Burnett, J.J. A strategic approach to managing crises. Public Relat. Rev. 1998, 24, 475–488. [Google Scholar] [CrossRef]
- Kash, T.J.; Darling, J. Crisis management: Prevention, diagnosis and intervention. Leadersh. Organ. Dev. J. 1998, 19, 179–186. [Google Scholar] [CrossRef]
- Heath, R. Crisis management for managers and executives. In Financial Times Management; Pitman Publishing: London, UK, 1998. [Google Scholar]
- Paraskevas, A.; Quek, M. When Castro seized the Hilton: Risk and crisis management lessons from the past. Tour. Manag. 2019, 70, 419–429. [Google Scholar] [CrossRef]
- Rosenthal, U.; Kouzmin, A. Crises and Crisis Management: Toward Comprehensive Government Decision Making; Leiden University: Leiden, The Netherlands, 1997. [Google Scholar]
- Van Wart, M.; Kapucu, N. Crisis management competencies: The case of emergency managers in the USA. Public Manag. Rev. 2011, 13, 489–511. [Google Scholar] [CrossRef]
- Sanchez, E.Y.; Acquesta, A.A. CRISIS: A System for Risk Management. Systems 2013, 1, 3–26. [Google Scholar] [CrossRef]
- Tagarev, T.; Ratchev, V. A Taxonomy of Crisis Management Functions. Sustainability 2020, 12, 5147. [Google Scholar]
- International Organization for Standardization. Societal Security—Preparedness and Continuity Management Systems—Requirements; ISO 22301:2012; International Organization for Standardization: Geneva, Switzerland, 2012. [Google Scholar]
- McManus, S. Organisational Resilience in New Zealand; University of Canterbury: Christchurch, New Zealand, 2007. [Google Scholar]
- Vargo, J.; Stephenson, A.V. Measuring organizational resilience. In Proceedings of the 20th World Conference on Disaster Management, Toronto, ON, Canada, 20–23 June 2010. [Google Scholar]
- McManus, S.; Seville, E.; Vargo, J.; Brunsdon, D. A facilitated process for improving organizational resilience. Nat. Hazards Rev. 2008, 9, 81–90. [Google Scholar] [CrossRef]
- Hollá, K.; Moricová, V. Specifics of Monitoring and Analysing Emergencies in Information Systems. In Proceedings of the 13th International Scientific Conference on Sustainable, Modern and Safe Transport (TRANSCOM 2019), Žilina, Slovakia, 29–31 May 2019; Volume 40, pp. 1343–1348. [Google Scholar]
- Titko, M.; Ristvej, J. Assessing Importance of Disaster Preparedness Factors for Sustainable Disaster Risk Management: The Case of the Slovak Republic. Sustainability 2020, 12, 9121. [Google Scholar] [CrossRef]
- Zánická Hollá, K.; Ristvej, J.; Šimák, L. Systematic Method of Risk Assessment in Industrial Processes. WIT Trans. Inf. Commun. Technol. 2011, 43. [Google Scholar] [CrossRef]
- Eller, W.S.; Wandt, A.S. Contemporary policy challenges in protecting the homeland. Policy Stud. J. 2020, 48, S33–S46. [Google Scholar] [CrossRef]
- Paté-Cornell, M.-E.; Kuypers, M.; Smith, M.; Keller, P. Cyber risk management for critical infrastructure: A risk analysis model and three case studies. Risk Anal. 2018, 38, 226–241. [Google Scholar] [CrossRef]
- Stofkova, J.; Maris, L.; Soltes, V. To the Problem of Information Security within the Local Government. In Proceedings of the 7th International Conference on Education and New Learning Technologies (EDULEARN), Barcelona, Spain, 6–8 July 2015; pp. 6629–6635. [Google Scholar]
- Sventekova, E.; Luskova, M.; Dvorak, Z. Use of network analysis in conditions of critical infrastructure risk management. In Proceedings of the WMSCI 2016: The 20th World Multi-Conference on Systemics, Cybernetics and Informatics, Orlando, FL, USA, 5–8 July 2016; Volume II, pp. 247–250, ISBN 978-1-941763-43-8. [Google Scholar]
- Shaw, D.; Fattoum, A.; Moreno, J.; Bealt, J. A Structured Methodology to peer review disaster risk reduction activities: The viable system review. Int. J. Disaster Risk Reduct. 2020, 46, 101486. [Google Scholar] [CrossRef]
- Lee, Y.; Watanabe, K.; Li, W.-S. Public private partnership operational model—A conceptual study on implementing scientific-evidence-based integrated risk management at regional level. J. Disaster Res. 2019, 14, 667–677. [Google Scholar] [CrossRef]
- Wilkinson, E.; Mysiak, J.; Oliveira, C.S.; Peters, K.; Surminski, S. Managing disaster risk. In Science for Disaster Risk Management 2017: Knowing Better and Losing Less; Poljanšek, K., Ferrer, M.F., De Groeve, T., Clark, I., Eds.; European Commission: Brussels, Belgium, 2017; pp. 442–515. [Google Scholar]
- Booth, L.; Fleming, K.; Abad, J.; Schueller, L.A.; Leone, M.; Scolobig, A.; Baills, A. Simulating synergies between climate change adaptation and disaster risk reduction stakeholders to improve management of transboundary disasters in Europe. Int. J. Disaster Risk Reduct. 2020, 49, 101668. [Google Scholar] [CrossRef] [PubMed]
- Owen, G. What makes climate change adaptation effective? A systematic review of the literature. Glob. Environ. Chang. 2020, 62, 102071. [Google Scholar] [CrossRef]
- Tokakis, V.; Polychroniou, P.; Boustras, G. Crisis management in public administration: The three phases model for safety incidents. Saf. Sci. 2019, 113, 37–43. [Google Scholar] [CrossRef]
- Brezina, D.; Šimák, L.; Hudáková, M.; Masár, M. Application of multicriteria decision-making methods for the optimal evacuation. Transp. Res. Procedia 2019, 40, 963–969. [Google Scholar] [CrossRef]
- Bundy, J.; Pfarrer, M.D.; Short, C.E.; Coombs, W.T. Crises and Crisis Management: Integration. Interpret. Res. Dev. J. Manag. 2016, 43, 1661–1692. [Google Scholar]
- Barton, L. Crisis in Organizations II College Divisions South-Western; South-Western College Pub: Cincinati, OH, USA, 2001. [Google Scholar]
- Timothy Coombs, W.; Laufer, D. Global Crisis Management—Current Research and Future Directions. J. Int. Manag. 2018, 24, 199–203. [Google Scholar] [CrossRef]
- Nawaz, W.; Linke, P.; Koç, M. Safety and sustainability nexus: A review and appraisal. J. Clean. Prod. 2019, 216, 74–87. [Google Scholar] [CrossRef]
- Hedlund, F.H.; Astad, J. Solid biomass climate change interventions examined in a context of inherent safety, media shifting, and emerging risks. Hum. Ecol. Risk Assess. 2015, 21, 1410–1427. [Google Scholar] [CrossRef]
- Lewis, S. LewisLessons on corporate “sustainability” disclosure from deepwater horizon. New Solut. A J. Environ. Occup. Health Policy 2011, 21, 197–214. [Google Scholar] [CrossRef] [PubMed]
- Meshkati, N. Lessons of the chernobyl nuclear accident for sustainable energy generation: Creation of the safety culture in nuclear power plants around the world. Energy Sources Part A Recover Util. Environ. Eff. 2007, 29, 807–815. [Google Scholar]
- Sanchez, E.Y.; Represa, S.; Mellado, D.; Balbi, K.B.; Acquesta, A.D.; Lerner, J.E.C.; Porta, A.A. Risk analysis of technological hazards: Simulation of scenarios and application of a local vulnerability index. J. Hazard. Mater. 2018, 352, 101–110. [Google Scholar] [CrossRef]
- Rajeev, K.; Soman, S.; Renjith, V.R.; George, P. Human vulnerability mapping of chemical accidents in major industrial units in Kerala, India for better disaster mitigation. Int. J. Disaster Risk Reduct. 2019, 39, 101247. [Google Scholar] [CrossRef]
- AlRukaibi, F.; Alrukaibi, D.; Alkheder, S.; Alojaiman, S.; Sayed, T. Optimal route risk-based algorithm for hazardous material transport in Kuwait. J. Loss Prev. Process Ind. 2018, 52, 40–53. [Google Scholar] [CrossRef]
- Chen, S.Y.; Lin, M.S.; Hsiao, G.L.K.; Wang, T.C.; Kao, C.S. Underground Pipeline Leakage Risk Assessment in an Urban City. Int. J. Environ. Res. Public Health 2020, 17, 3929. [Google Scholar] [CrossRef]
- Kalatpoor, O.; Goshtasp, K.; Khavaji, S. Health, Safety and Environmental Risk of a Gas Pipeline in an Oil Exploring Area of Gachsaran. Ind. Health 2011, 49, 209–214. [Google Scholar] [CrossRef]
- Chen, H.N.; Mao, Z.L. The study on the results of hydrogen pipeline leakage accident of different factors. Int. Symp. Resour. Explor. Environ. Sci. 2017, 64, 012002. [Google Scholar] [CrossRef]
- Ahn, M.S.; Lee, H.E.; Cheon, K.S.; Joo, H.G.; Son, B.S. Feasibility Evaluation of Designated Quantities for Chemicals Requiring Preparation for Accidents in the Korean Chemical Accident Prevention System. Int. J. Environ. Res. Public Health 2020, 17, 1927. [Google Scholar] [CrossRef]
- Nuamkoksung, P.; Buayai, K.; Kongjeen, Y.; Bhumkittipich, K.; Kerdchen, K.; Mithulananthan, N. Impact of Fast Charging on Lithium-ion Battery in Electric Vehicle Application. In Proceedings of the 8th International Electrical Engineering Congress (iEECON), Chiang Mai, Thailand, 4–6 March 2020. Book Series: International Electrical Engineering Congress. [Google Scholar] [CrossRef]
- Orozco, J.L.; Van Caneghem, J.; Hens, L.; Gonzalez, L.; Lugo, R.; Diaz, S.; Pedroso, I. Assessment of an ammonia incident in the industrial area of Matanzas. J. Clean. Prod. 2019, 222, 934–941. [Google Scholar] [CrossRef]
- Mehrabani, M.A.; Ghiyasi, S. Modeling the consequences of accidents during the process of transferring waste thinner from the paint shop of an automotive industry using aloha software. Int. Arch. Health Sci. 2018, 5, 55–61. [Google Scholar] [CrossRef]
- Hammouya, A.; Kabouche, A.; Chaib, R. Study of Drain Barrier Effect on Hydrocarbons Hazards. J. Fail. Anal. Prev. 2019, 19, 1475–1486. [Google Scholar] [CrossRef]
- Lopes, T.J.; Barros, R.; dos Santos, N.L.; Costelli, M.C.; da Silva, A.; Cancelier, A. Risk Analysis Applied to Industrial Refrigeration Installations that use Ammonia. Rev. Eletron. Gest. Educ. E Tecnol. Ambient. 2015, 19, 160–166. [Google Scholar] [CrossRef]
- Jabbari, M.; Atabi, F.; Ghorbani, R. Key airborne concentrations of chemicals for emergency response planning in HAZMAT road transportation- margin of safety or survival. J. Loss Prev. Process Ind. 2020, 93, 103617. [Google Scholar] [CrossRef]
- ALOHA Software Version 5.4.7. Available online: http://www.epa.gov/oem/content/cameo/aloha.htm (accessed on 30 October 2020).
- Actual Weather Information. Available online: http://portal.chmi.cz (accessed on 30 October 2020).
- Makrowin Ltd. Proper Ventilation. Available online: https://www.makrowin.sk/en/products/proper-ventilation/ (accessed on 30 October 2020).
- Jasiulewicz-Kaczmarek, M.; Legutko, S.; Kluk, P. Maintenance 4.0 technologies—New opportunities for sustainability driven maintenance. Manag. Prod. Eng. Rev. 2020, 11, 74–87. [Google Scholar] [CrossRef]
- Traore, B.B.; Kamsu-Foguem, B.; Tangara, F.; Tiako, P. Software services for supporting remote crisis management. Sustain. Cities Soc. 2018, 39, 814–827. [Google Scholar] [CrossRef]


| Basic Information | |
|---|---|
| Hazardous substance | Ammonia |
| The temperature of the substance | Ambient |
| Pressure | atmospheric |
| Quantity | 3000 m3 |
| Initial event | Full-installation immediately destroys the brain |
| Phase leakage | Gas |
| Location tracking of concentration | 500 m from the source |
| Atmospheric Data | |
| Air temperature | 20 °C |
| Wind speed | 2 m/s |
| Stability Class | D |
| Cloudiness | Partly Cloudy |
| Humidity | 50% |
| The amount of hole leakage | 0 m |
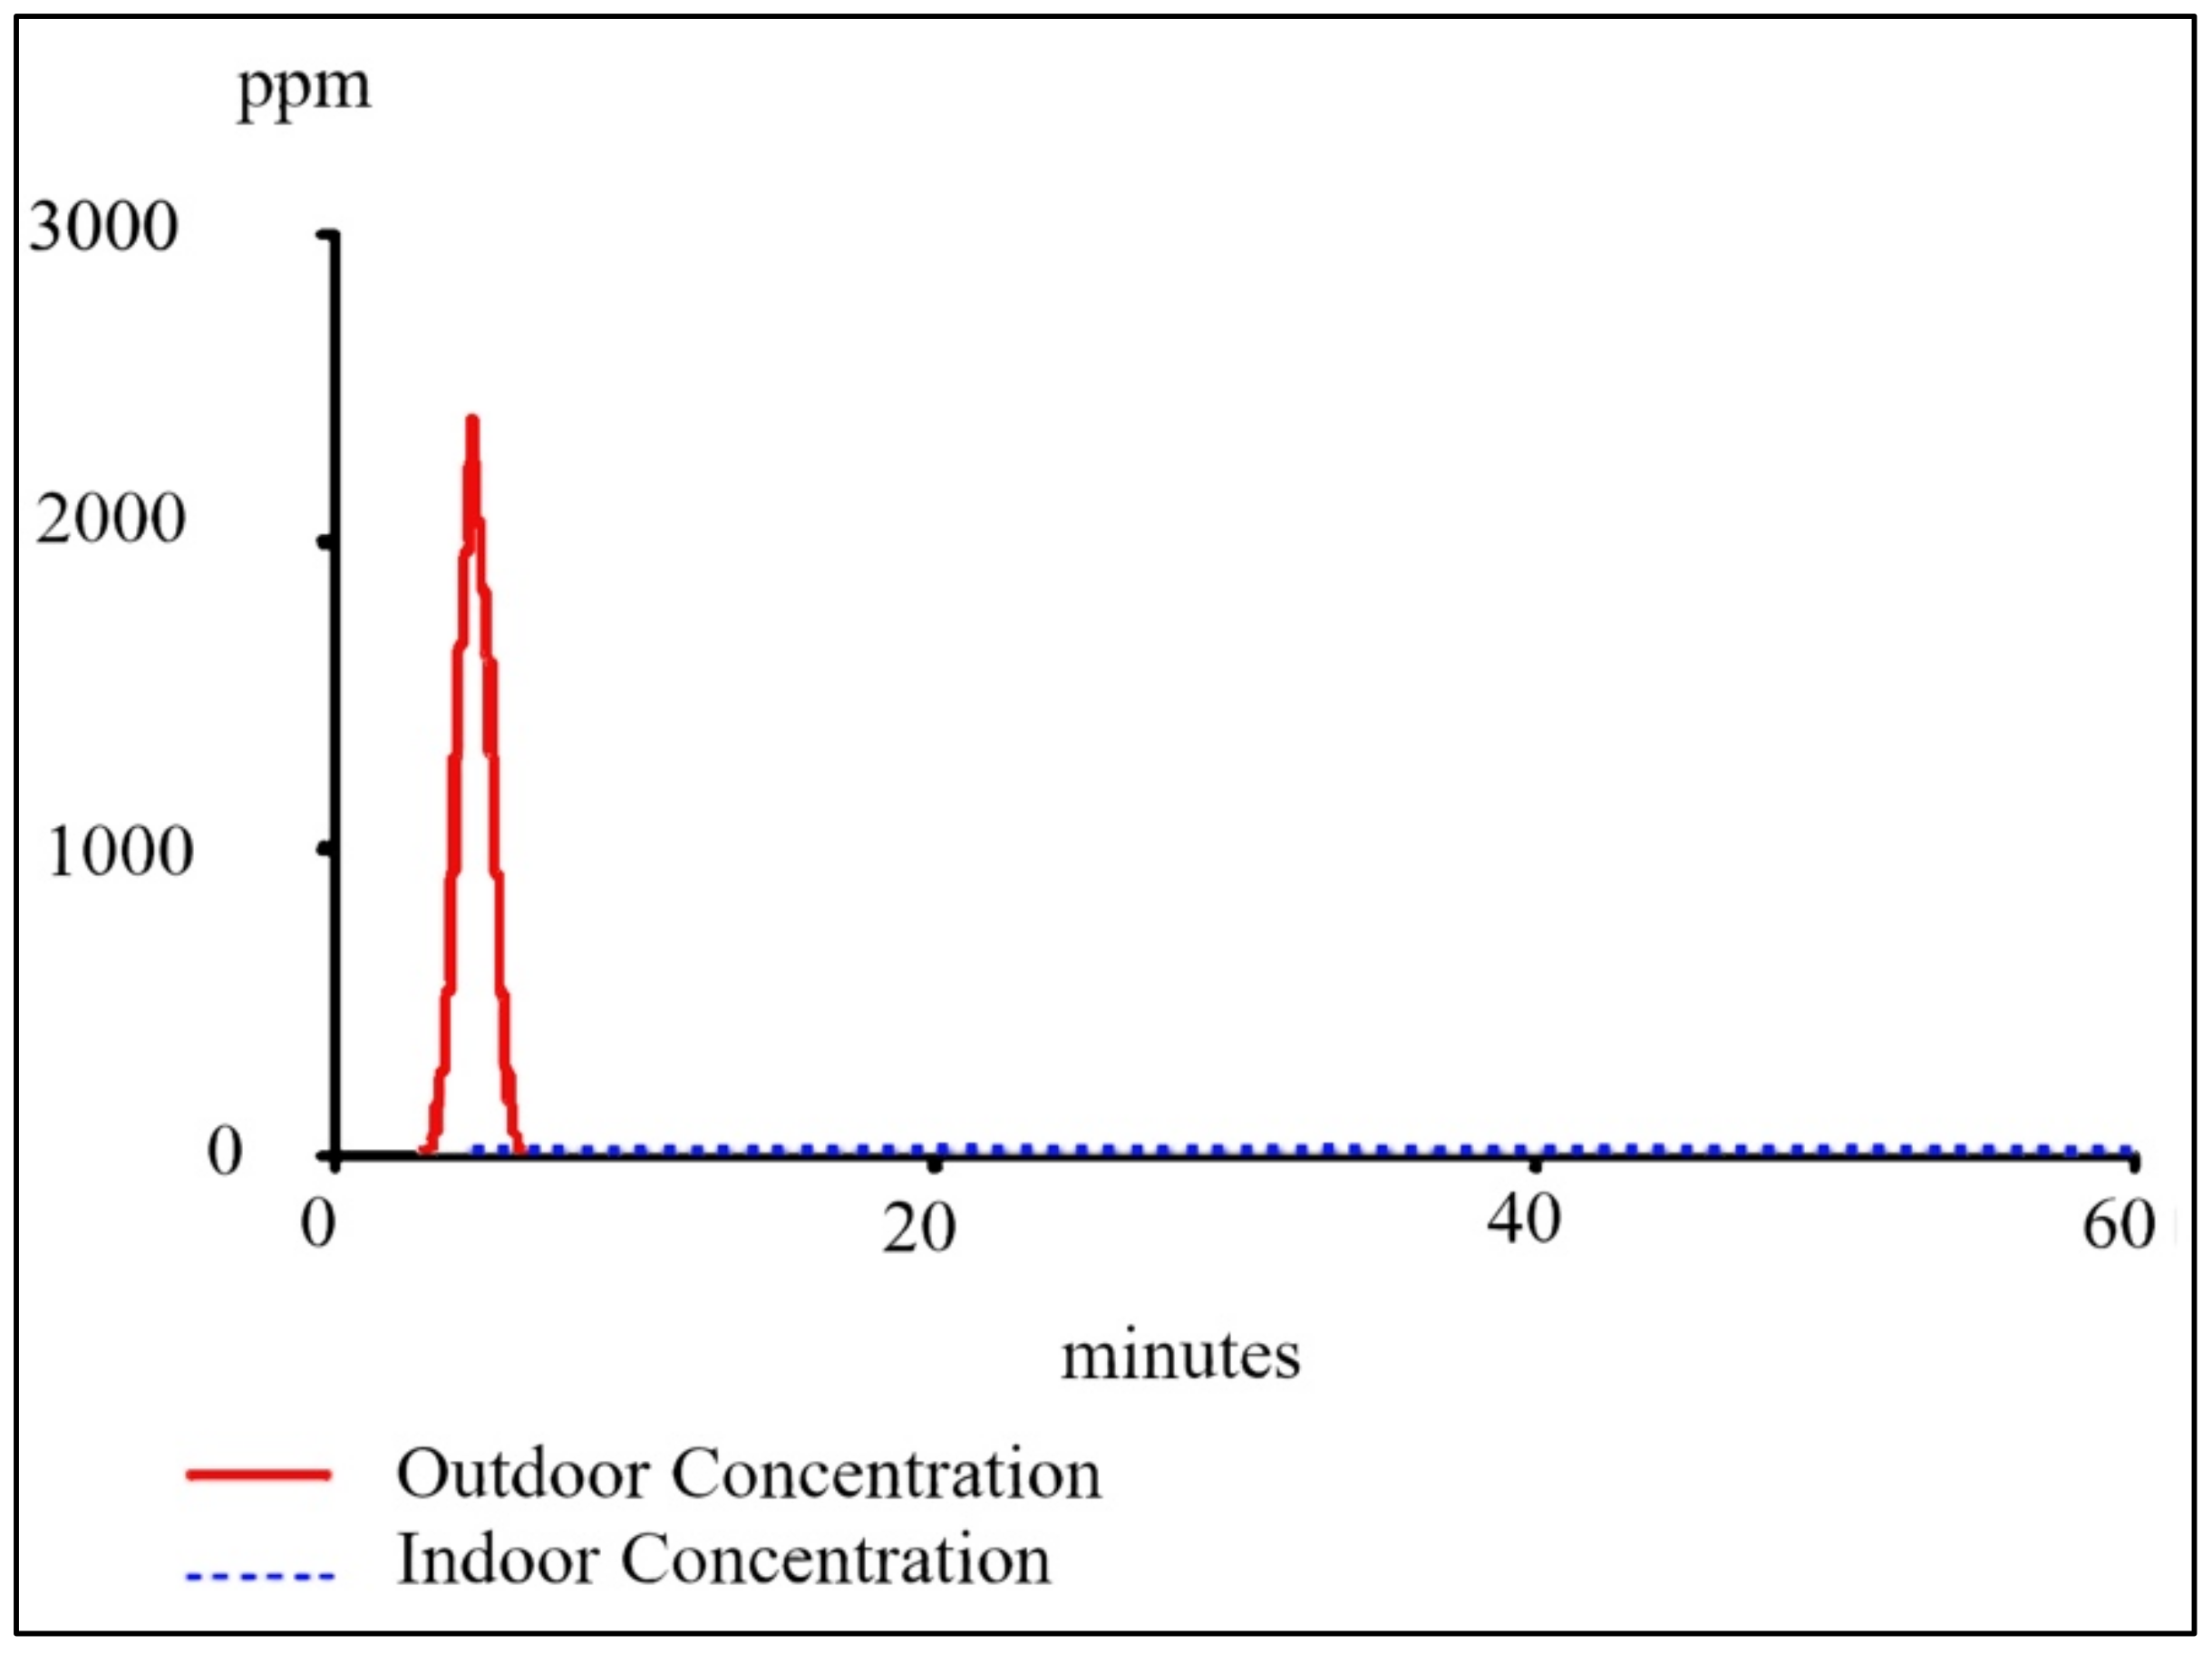
| Type of Release | Immediate |
|---|---|
| The amount of spillage | 3000 m3 (100%) |
| The average rate of leakage | 37.7 kg/s |
| Max. duration of brain | 1 min |
| Max. concentration in air | 2390 ppm |
| Max. concentration in buildings | 23.1 ppm |
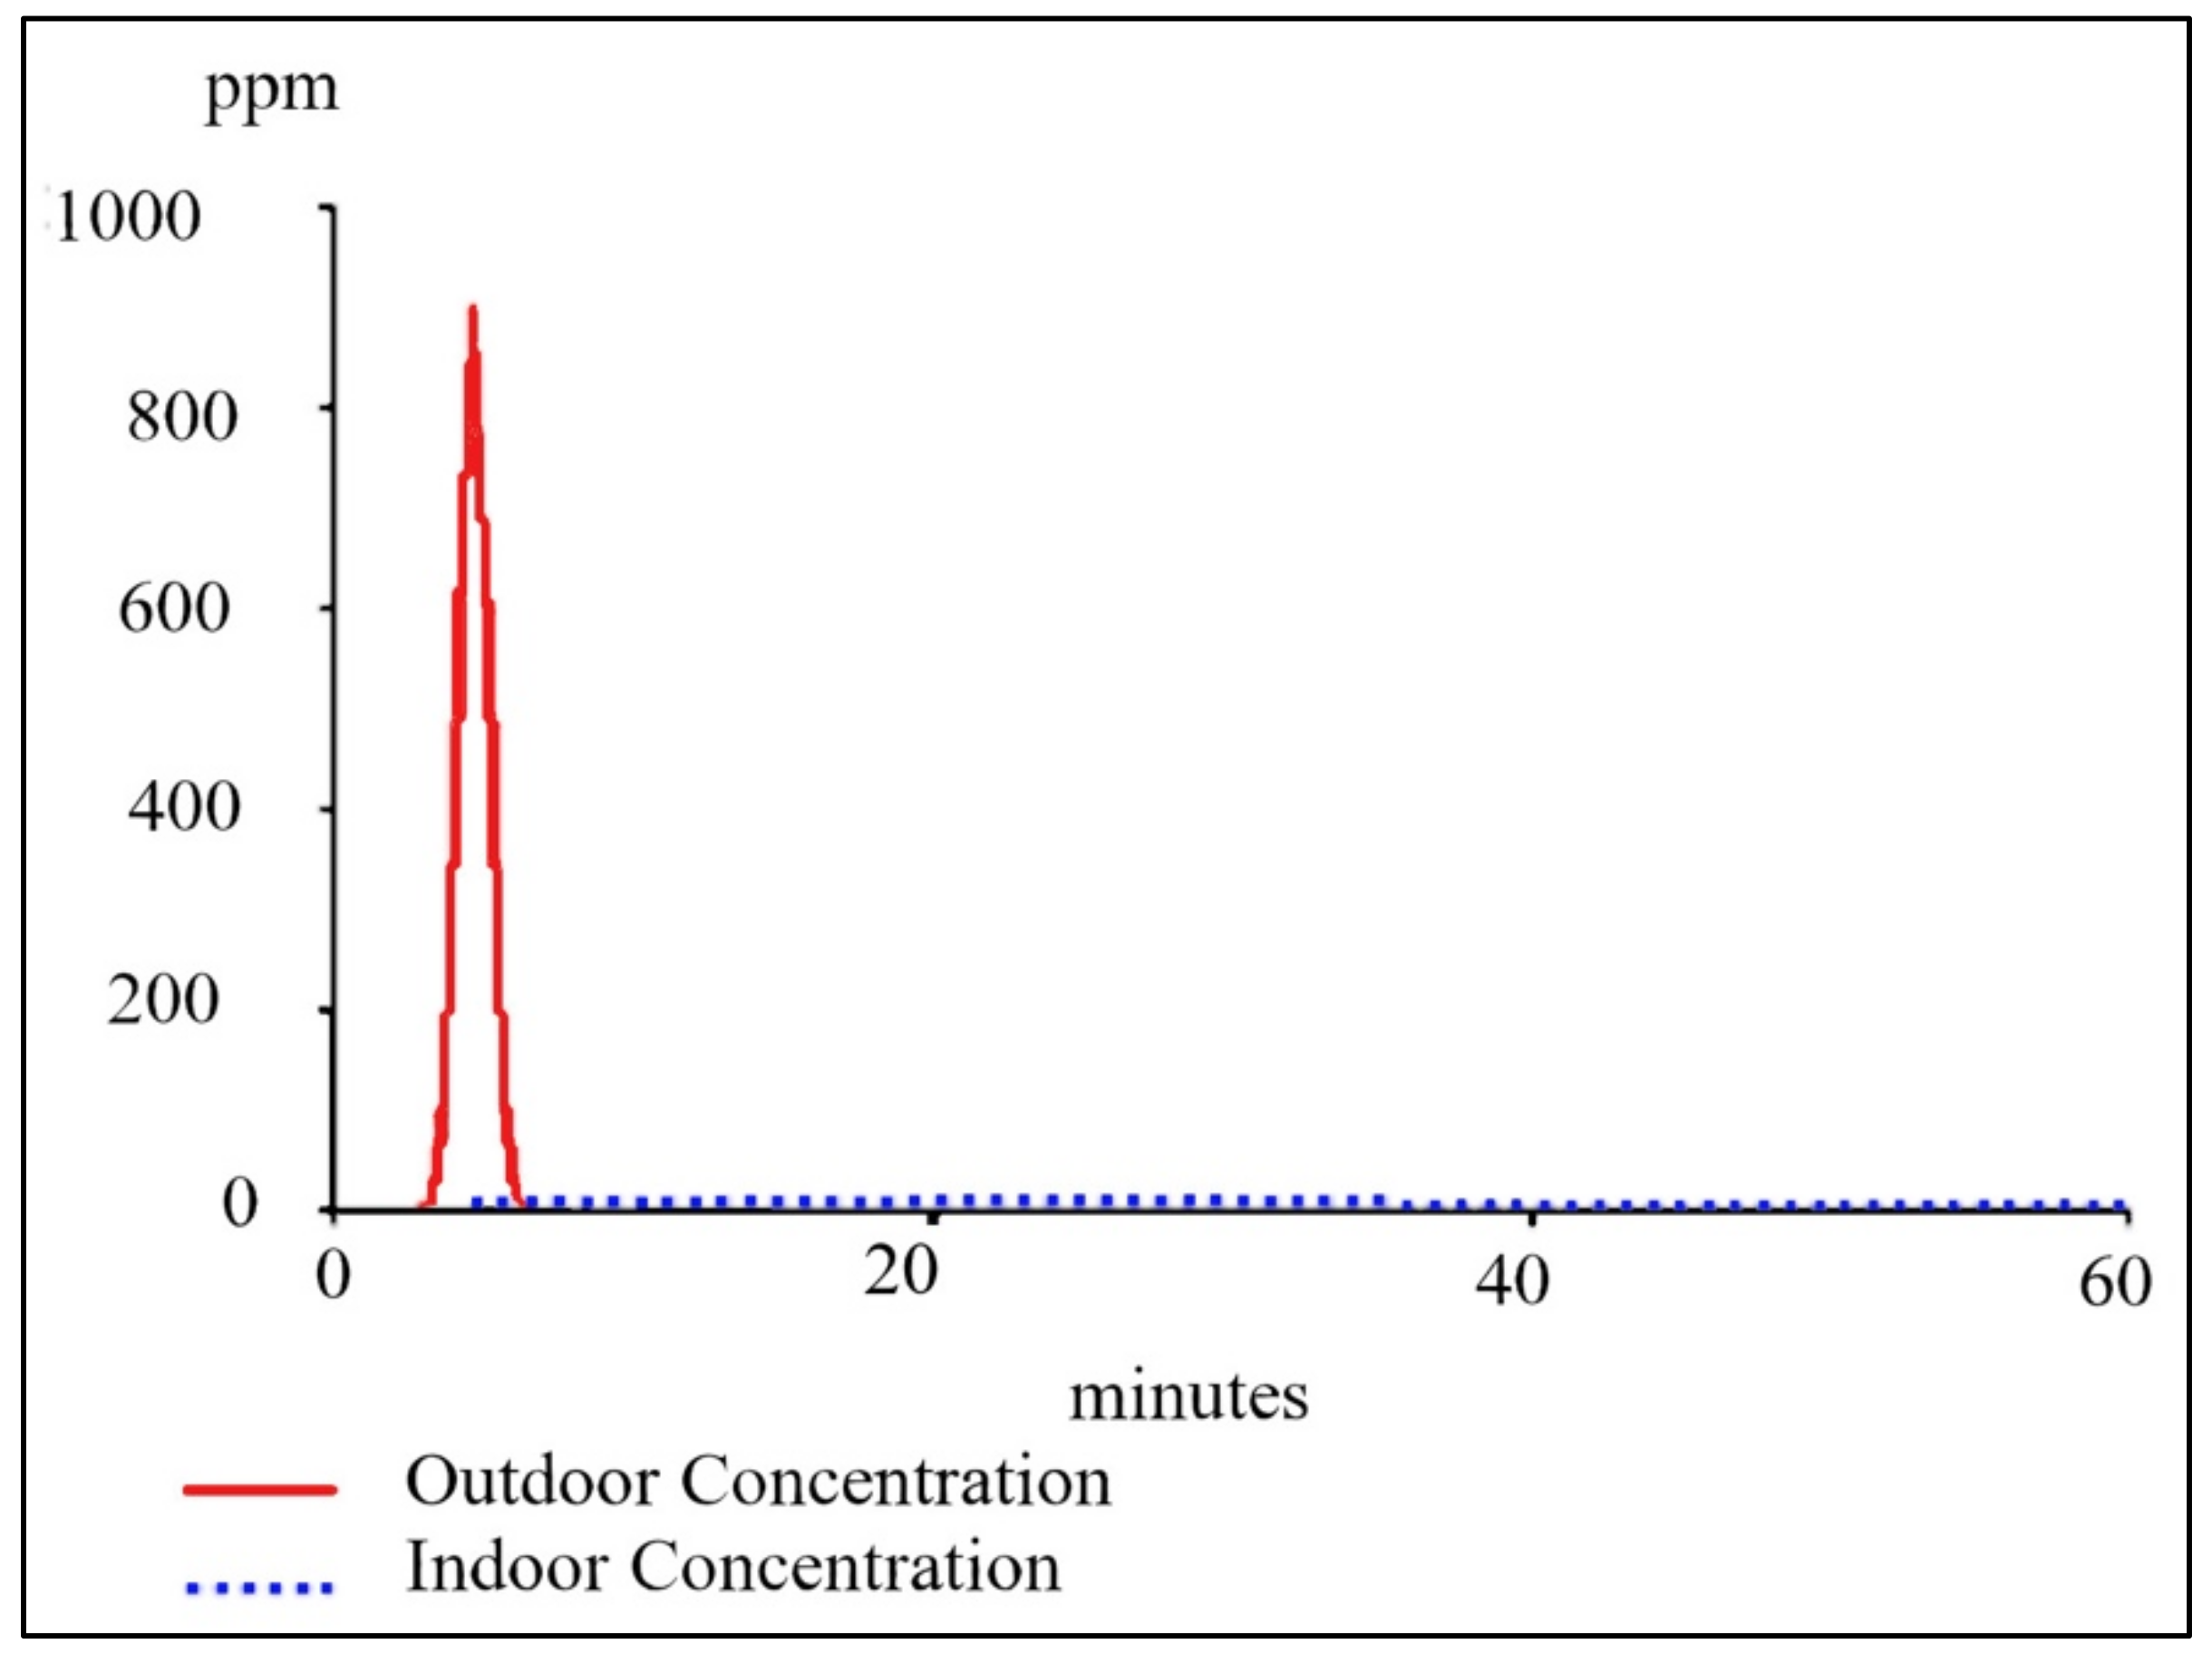
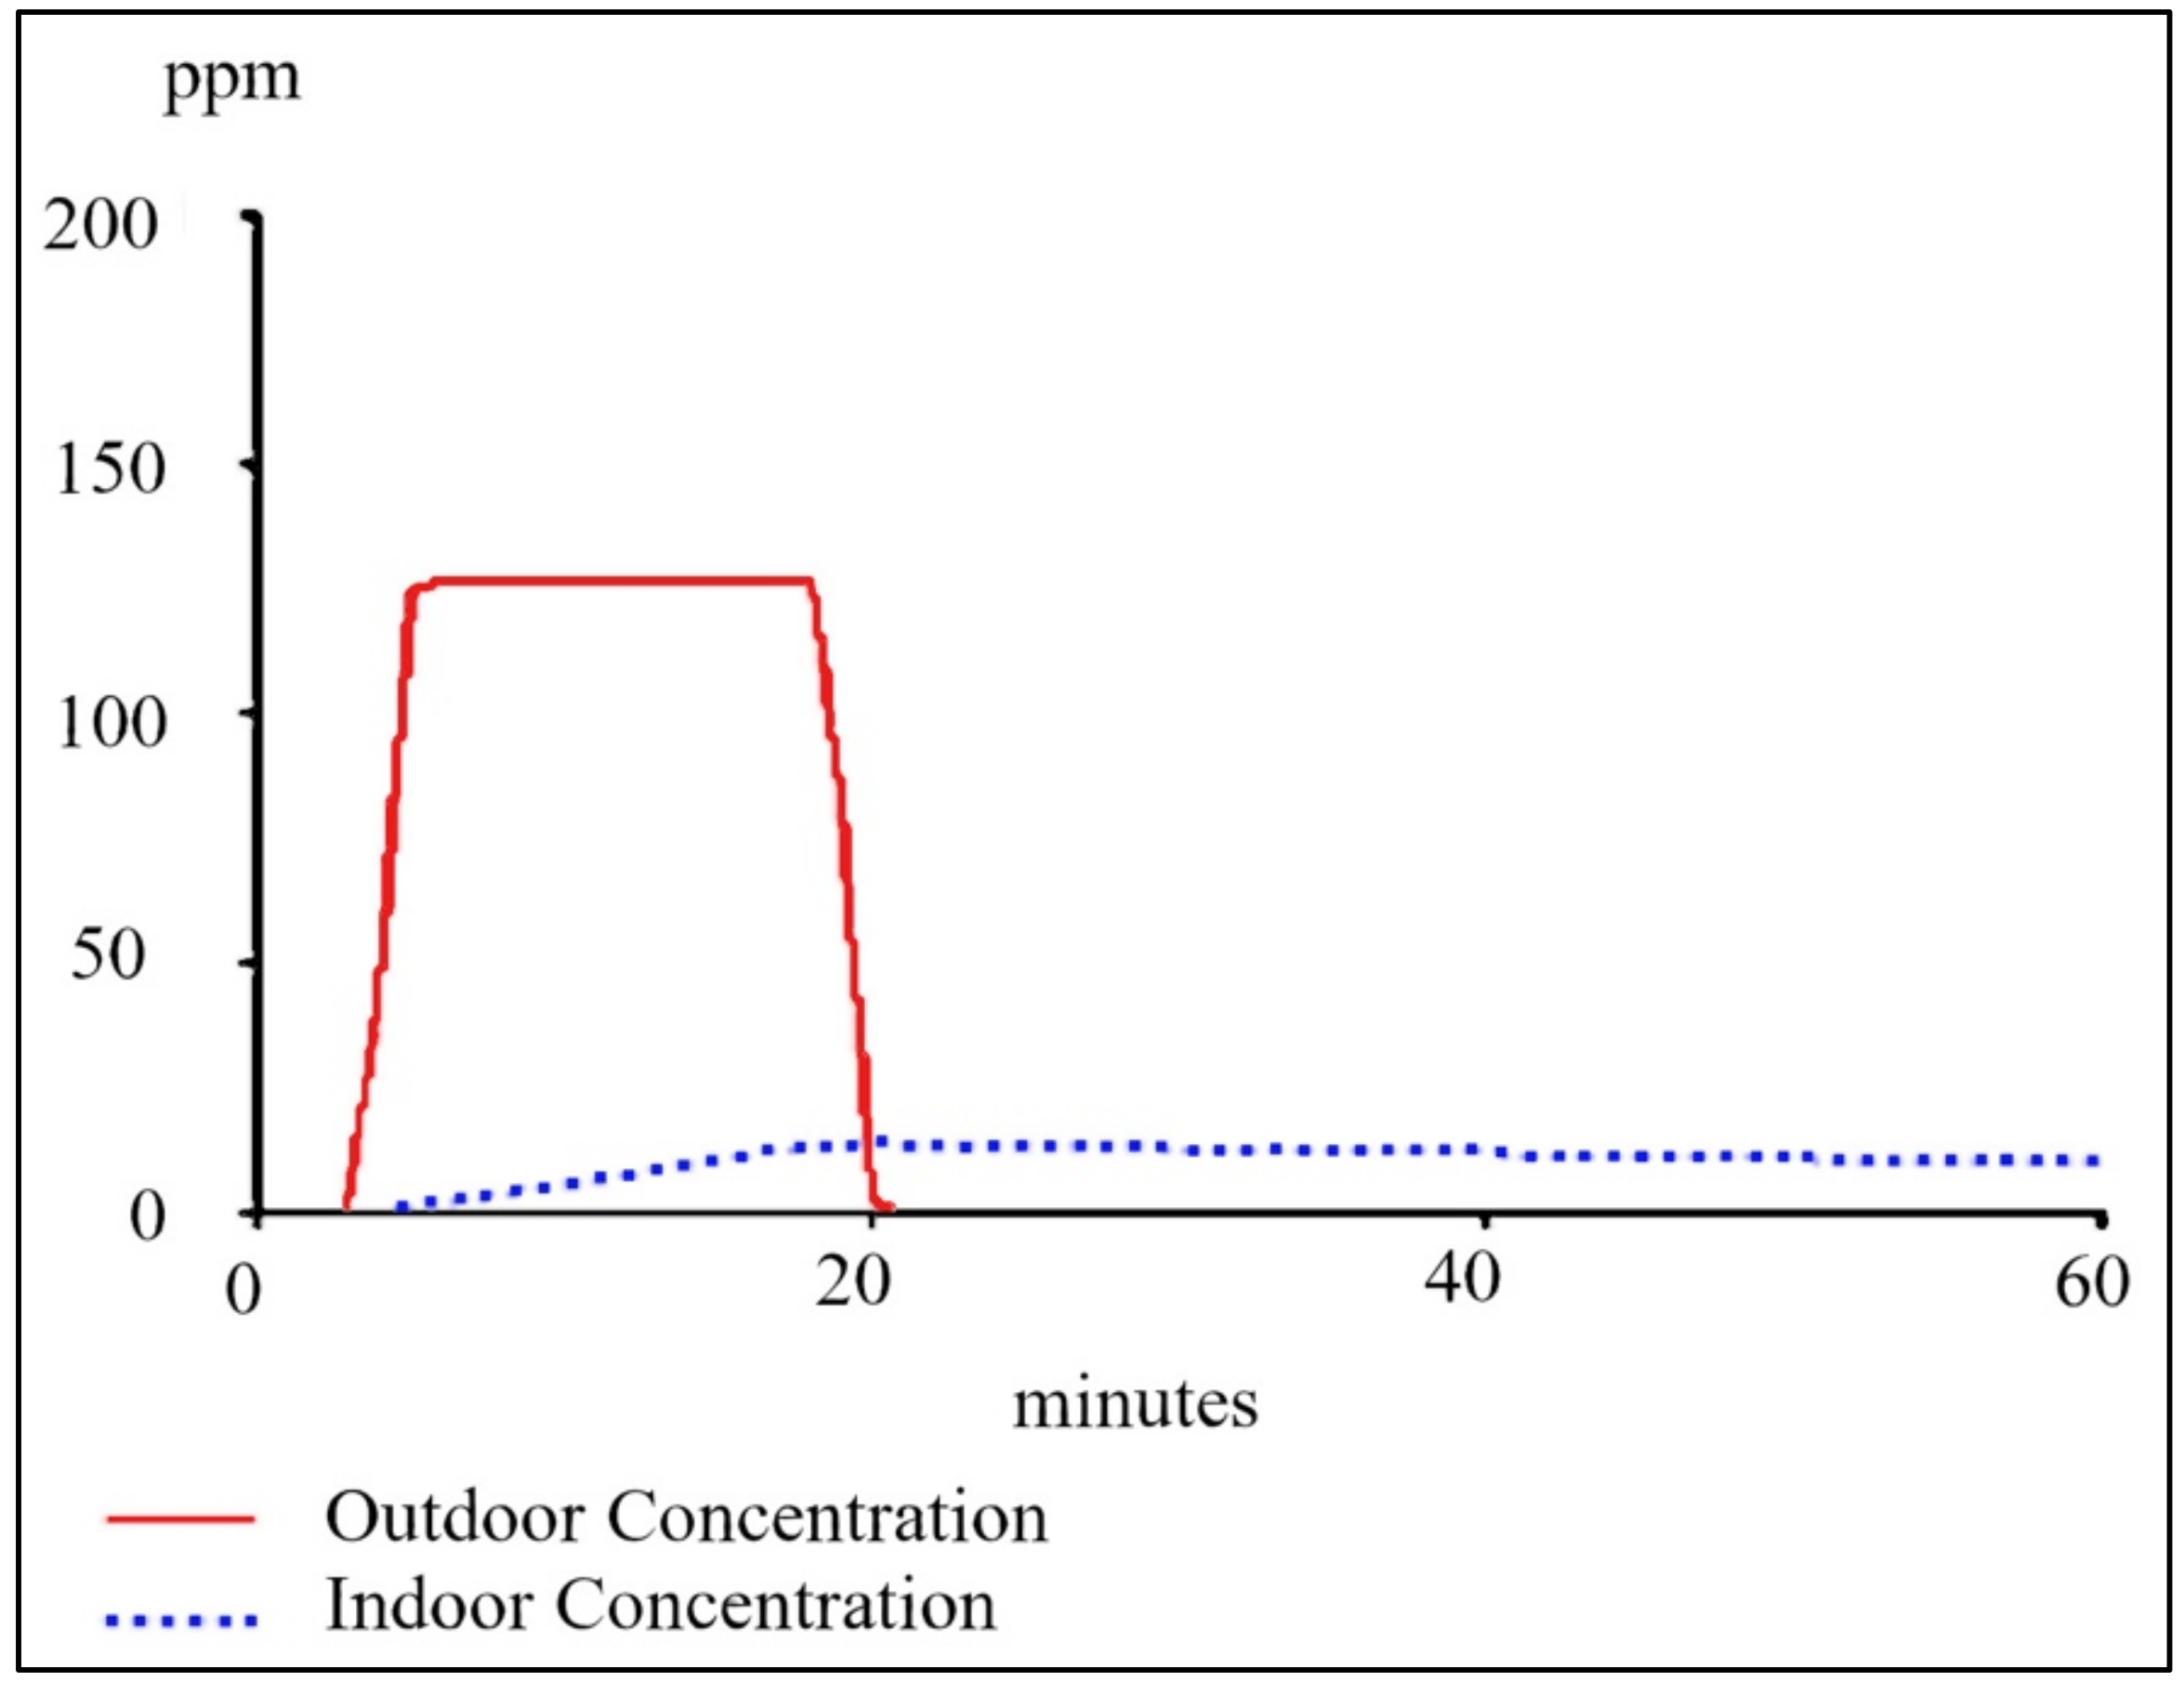
| Type of Release | Puff | Constant |
|---|---|---|
| The amount of spillage | 1125 m3 (37.5%) | 1875 m3 (62.5%) |
| The average rate of leakage | 14.2 kg/s | 94.4 kg/m |
| Max. duration of release | 1 min | 15 min * |
| Max. concentration in air | 898 ppm | 126 ppm |
| Max. concentration in buildings | 8.64 ppm | 13.7 ppm |
| Method of Modeling | Classic | Alternative |
|---|---|---|
| Concentration in air | 2390 ppm | 1024 ppm |
Publisher’s Note: MDPI stays neutral with regard to jurisdictional claims in published maps and institutional affiliations. |
© 2021 by the authors. Licensee MDPI, Basel, Switzerland. This article is an open access article distributed under the terms and conditions of the Creative Commons Attribution (CC BY) license (http://creativecommons.org/licenses/by/4.0/).
Share and Cite
Polorecka, M.; Kubas, J.; Danihelka, P.; Petrlova, K.; Repkova Stofkova, K.; Buganova, K. Use of Software on Modeling Hazardous Substance Release as a Support Tool for Crisis Management. Sustainability 2021, 13, 438. https://doi.org/10.3390/su13010438
Polorecka M, Kubas J, Danihelka P, Petrlova K, Repkova Stofkova K, Buganova K. Use of Software on Modeling Hazardous Substance Release as a Support Tool for Crisis Management. Sustainability. 2021; 13(1):438. https://doi.org/10.3390/su13010438
Chicago/Turabian StylePolorecka, Maria, Jozef Kubas, Pavel Danihelka, Katarina Petrlova, Katarina Repkova Stofkova, and Katarina Buganova. 2021. "Use of Software on Modeling Hazardous Substance Release as a Support Tool for Crisis Management" Sustainability 13, no. 1: 438. https://doi.org/10.3390/su13010438
APA StylePolorecka, M., Kubas, J., Danihelka, P., Petrlova, K., Repkova Stofkova, K., & Buganova, K. (2021). Use of Software on Modeling Hazardous Substance Release as a Support Tool for Crisis Management. Sustainability, 13(1), 438. https://doi.org/10.3390/su13010438