Article

Uptake Kinetics of \({\text{NH}_{4}^{+} }\), \({\text{NO}_{3}^{-} }\) and \({\text{H}_{2}\text{PO}_{4}^{-} }\) by Typha orientalis, Acorus calamus L., Lythrum salicaria L., Sagittaria trifolia L. and Alisma plantago-aquatica Linn

1
Beijing Municipal Research Institute of Environmental Protection, Beijing 100037, China
2
College of Resource Environment and Tourism, Capital Normal University, Beijing 100048, China
3
National Urban Environmental Pollution Control Engineering Research Center, Beijing 100037, China
*
Authors to whom correspondence should be addressed.
Sustainability 2021, 13(1), 434; https://doi.org/10.3390/su13010434
Submission received: 26 November 2020 / Revised: 29 December 2020 / Accepted: 30 December 2020 / Published: 5 January 2021
(This article belongs to the Section Environmental Sustainability and Applications)

Abstract

:
The emergent plants may differ in their capacity to assimilate nutrients from eutrophic water bodies, so the utilization of suitable emergent plants is the key part for successful restoration of shallow eutrophic lakes and rivers. This research applied the depletion method to study the kinetics of uptake of nutrient ( H 2 PO 4 , NH 4 + , NO 3 ) in different nutrient stresses by the five emergent aquatic plants (Acorus calamus L., Typha orientalis, Lythrum salicaria L., Sagittaria trifolia L., Alisma plantago-aquatica Linn) in the riverine zones of Dashi River (39°30′–39°40′ N, 115°59′–116°5′ E), a shallow eutrophic river located in Fangshan District, Beijing. The results showed that at the three phosphorus levels, A. calamus and A. plantago-aquatica had the highest maximum uptake rate values for NH 4 + under low to moderate phosphorus conditions, and high phosphorus, respectively. T. orientalis had the highest maximum uptake rate values for NO 3 at all phosphorus concentrations, while the Michaelis-Menten constant values of L. salicaria and A. plantago-aquatica were smaller. At the three nitrogen levels, the maximum uptake rate values for H 2 PO 4 were the greatest for A. plantago-aquatica at the low to moderate nitrogen levels and L. salicaria at high levels. Meanwhile, T. orientalis and L. salicaria had the smallest Michaelis-Menten constant values. In this study, nitrogen microbial transformations, such as nitrification, denitrification and their coupling were not measured and their role in measuring kinetics was not assessed. Thus, achieved results shall be considered as a synthesis of several processes mediated by plants, a theoretical guidance to the selection of plant species for phytoremediation of polluted water bodies with different nutrient stresses for quality improvement around the diverse rivers in Haihe River basin.

1. Introduction

Eutrophication of rivers and lakes is one of the relevant topics in the world today. Nitrogen (N) and phosphorus (P) are two important factors that cause eutrophication in freshwater lakes, and they are also the main nutrients for plant growth. High concentrations of nitrogen and phosphorus in water bodies can lead to an imbalance in the physiological function of submerged plants, inhibit their growth, and even cause their decline [1,2,3]. According to recent advances, high levels of nitrogen in lake water are closely linked to the retreat of submerged plants in shallow lakes [4]. High concentrations of ammonia nitrogen are of concern due to the physiological stress it causes on plant growth [5,6,7]. The use of aquatic plants to directly absorb and remove nitrogen and phosphorus from water bodies is one of the main mechanisms to control eutrophication in water bodies. In particular, the restoration of aquatic plants is attracting more attention as an important measure for restoring aquatic ecosystems and absorbing and purifying eutrophic substances from water bodies [8,9,10]. The kinetic approach to absorption is an effective method for studying the characteristics of nutrient uptake by plants. The study of nutrient uptake kinetics began in the early 1950s, with Epstein and Hagen pioneering in the use of enzyme reaction kinetic equations to study the uptake of ionic substances by plants [11]. In 1978, Nielsen and Barber modified the Michaelis-Menten equation to introduce the concept of minimum equilibrium concentrations, allowing the equation to quantitatively characterize the uptake of nutrients by roots [12]. Meanwhile, in terms of methodology, Classen and Barber first established the depletion method in 1974 to obtain various parameters of the kinetic equation (i.e., the dynamic process of determining the variation of ion concentrations in the culture medium with time after the plant hydroponic process) [13].
In the process of subsequent development, more and more scholars have studied the kinetics of nitrogen and phosphorus uptake on the basis of enzyme reaction kinetic theory for a variety of aquatic plants. The authors have also further elaborated the mechanism of nitrogen and phosphorus removal from water bodies by aquatic plants, and they have explored the theoretical and practical significance of the selection of aquatic plants in ecological restoration projects of eutrophic water bodies with different nutrient characteristics [14,15].
There are many studies on the kinetics of uptake of nutrient pollutants, such as nitrogen and phosphorus, by aquatic plants in the water column. Most of the studies focused on factors such as temperature, light, and pH [16,17,18]. The kinetics of ammonium nitrogen uptake by Potamogeton malaianus was studied by Liu et al. [19]. Chang et al. assessed the kinetic studies of the uptake of ammonium and nitrate nitrogen by aquatic plants such as Jussiaea stipulaceaohwe, Elodea nuttallii, and Eichhornia crassipes (hyacinth) [20]. Also, Chen et al. studied the kinetics of uptake of eutrophic pollutants of nitrogen and phosphorus by Hydrilla verticillata and Vallisneria asiatica [21]. Zhang et al. studied the uptake of ammonium nitrogen by Vallisneria natans and Myriophyllum spicatum under light and dark conditions [22].
However, the effects of nitrogen and phosphorus, two important factors in eutrophication of freshwater lakes, on aquatic plants are not controlled by one of these nutrients, and their interactions have been neglected. The present study found that N can promote H 2 PO 4 uptake over a range of concentrations, and as the concentration of N in solution increased, the degree of plant stress increased, thereby affecting H 2 PO 4 uptake. Cao and Ni found that excess ammonia nitrogen (>0.56 mg·L1) can lead to disruption of the metabolic balance of soluble carbohydrates and free amino acids in herbaceous plants. Also, this excess can inhibit plant growth and even lead to plant death [23]. A similar effect of P on plant uptake of   NH 4 + and NO 3 exists, where the hydrolysis products of NH 4 + enter cells by free diffusion with minimal energy expenditure [24]. Moreover, the cell membrane of the plant can be disrupted under severe phosphorus stress [6], affecting the uptake of NH 4 + . According to the monitoring results, the ammonia nitrogen and total phosphorus in the Dashi River are 2.836 mg·L1, 0.373 mg·L1, respectively, indicating that some water bodies of Dashi Rivers have a poor V water quality (water bodies in which one of the water quality indicators does not meet the V criteria of the Environmental quality standards for surface water) [25]. Similarly, as in the case of the main upstream water body of Xiongan New Area and Baiyangdian, the water quality and safety of the Daqing River basin (Beijing section) greatly affects the construction and development of the Baiyangdian and Xiongan New Areas. Therefore, we must adopt safe and effective phytoremediation technology to repair the water body of Dashi River. In the present study, T. orientalis, A. calamus, L. salicaria, S. trifolia, and A. plantago-aquatica were selected from the Dashi River Channel in the Daqing River basin to study the kinetic effects of different nitrogen to phosphorus (N:P) ratios on their nutrient uptake. T. orientalis, A. calamus, L. salicaria, Sagittaria trifolia L., and A. plantago-aquatica are common emergent plants in lakes and rivers in the Beijing Area of the Haihe River basin. They have a wide ecological adaptability, high pollutant uptake capacity, and easy community construction. Then, this study provided a theoretical basis for the selection of suitable plants for the restoration of river sections with different levels of pollution.

2. Materials and Methods

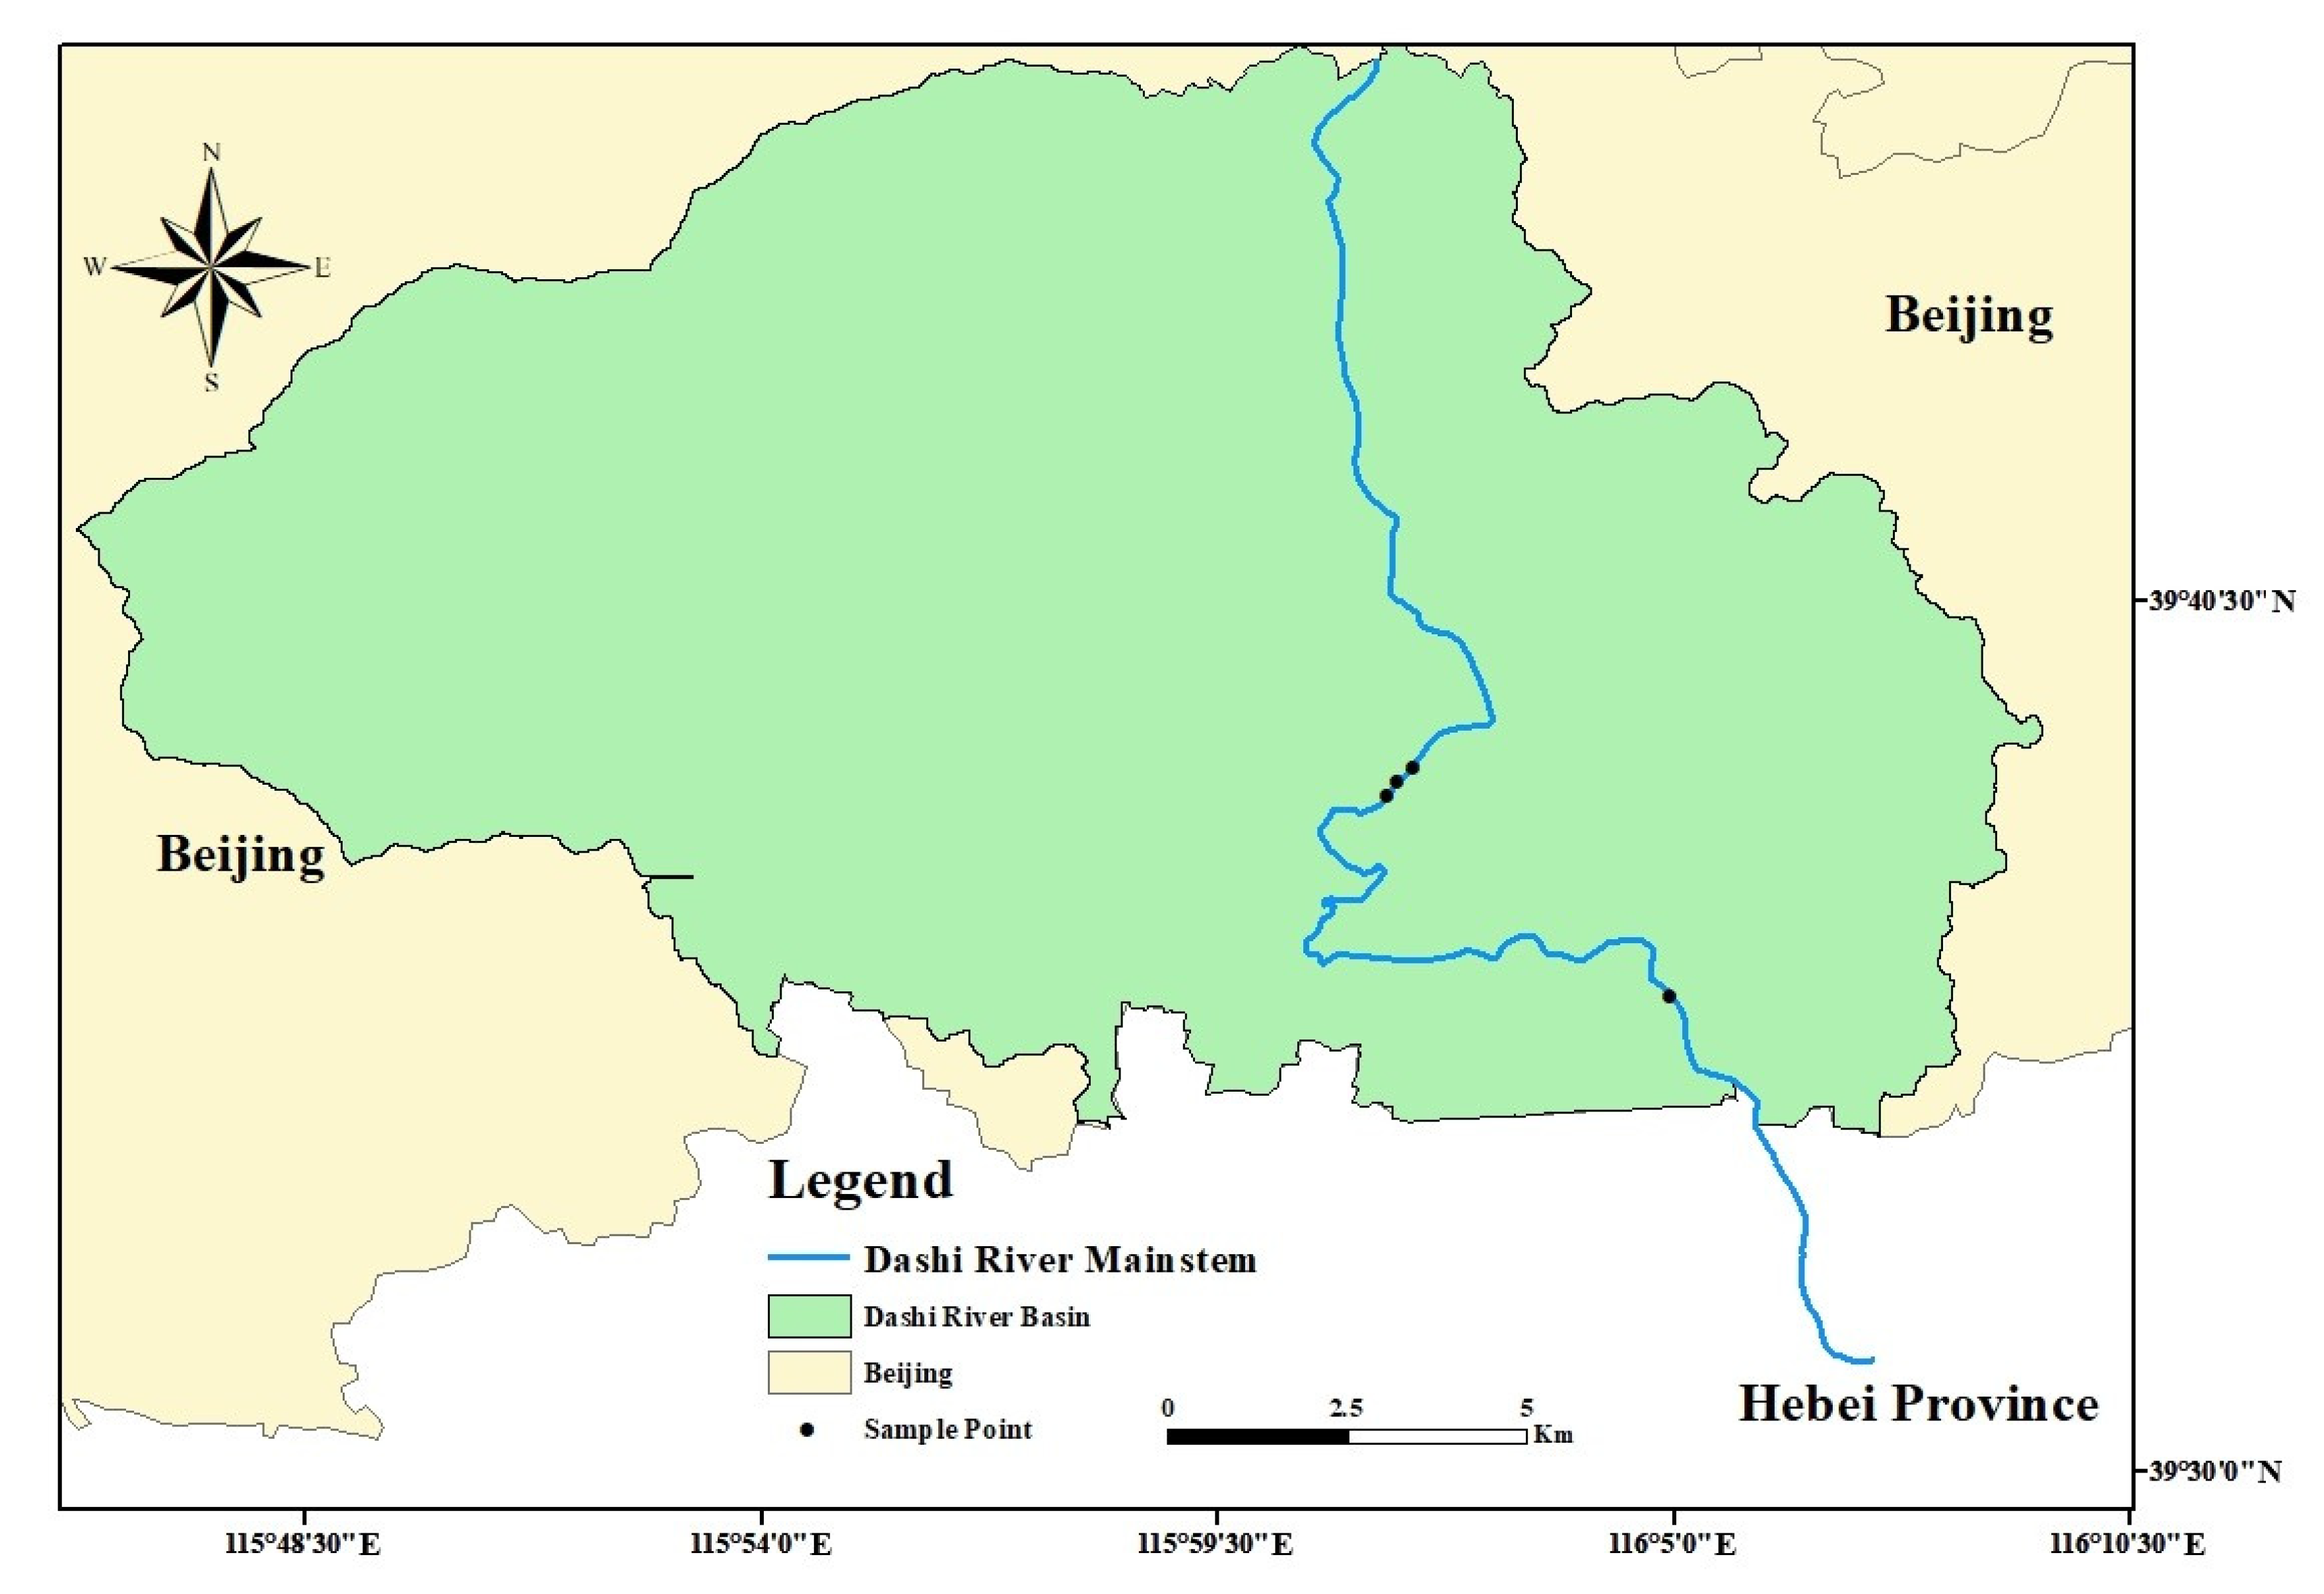
2.1. Experimental Design

Five species of aquatic plants, T. orientalis, A. calamus, L. salicaria, S. trifolia, and A. plantago-aquatica were obtained from the lower Dashi River (Figure 1). About 35 plants of each species were taken, and mock experiments were completed in September 2020 in the Aquatic Plant Culture Laboratory of Beijing Municipal Research Institute of Environmental Protection of China. The experiments were conducted in a greenhouse with a temperature of 20 °C–25 °C, a light intensity of 3000l×, and a relative humidity of 60–70%. Plants retrieved from the Dashi River channel were washed with deionized water and then incubated in 1/8 Hoagland nutrient solution (pH = 6.5) for 39 days, with the nutrient solution changed every 3 days. After 39 days of the hydroponic process, well-grown plants were selected for absorption kinetics experiments. The plants were removed at the end of hydroponics from the nutrient solution, rinsed with deionized water, transferred to a 0.2 mmol · L 1 CaSO 4   solution, and preincubated in the greenhouse for 24 h until starvation occurred.

2.2. Experimental Design

In this experiment, a three-level total phosphorus concentration gradient (0.04, 0.08, 0.5 mg · L 1 ) was set up to determine the uptake kinetic parameters of ammonium nitrogen and nitrate nitrogen in five plants under different P concentration stress conditions, considering the current water quality of the lower Dashi River. A three-stage total nitrogen concentration gradient (0.2, 0.6, 1.2 mg · L 1 ) was also set up to determine the kinetic parameters of H 2 PO 4 uptake by five plants under different N stress conditions. During this experiment, NH 4 + was made by NH 4 Cl   (CAS: 12125-02-9, GR, Shanghai Aladdin Bio-Chem Technology Co., LTD, Shanghai, China), NO 3 was made by KNO 3 (CAS: 7757-79-1, GR, Shanghai Aladdin Bio-Chem Technology Co., LTD, Shanghai, China), H 2 PO 4 was made by KH 2 PO 4 (CAS: 7778-77-0, GR, Shanghai Aladdin Bio-Chem Technology Co., LTD, Shanghai, China). The NH 4 + , NO 3 , and H 2 PO 4 concentrations used in this study are shown in Table 1.
NH 4 + , NO 3 , and H 2 PO 4 were measured by the methods specified in the standards of the People’s Republic of China [26,27,28]. After 24 h of starvation, the plants were transferred into 250 mL Erlenmeyer flasks with a gradient solution for nutrient uptake experiments. Three replicates were set up for each uptake experiment. The experiments were performed in an incubator at 23 °C with a light intensity of 3000l× and relative humidity of 65%. The culture medium was sampled at 0 h, 1 h, 2 h, 3 h, 4 h, 5 h, 6 h. After, 3 mL of the culture medium was added into 3 mL of deionized water, and the plants were taken out immediately after. The water on the surface of the plants was then dried with filter paper, and the fresh weight was measured. An absorption curve was done according to the measured concentrations of the nutrient solution and sampling time, and the kinetic parameters were then obtained based on the absorption curve equation.

2.3. Determination Method for Nutrient

Analyses of NH 4 + , NO 3 , and H 2 PO 4 were carried out according to Standard Methods by a discrete auto analyzer (Smartchem 200, AMS-Westco, Guidonia, Italy). The concentration of NH 4 + was determined by the Nessler’s reagent spectrophotometry (The detection limits were 0.01 mg·L1) [26]. The concentration of NO 3 was determined by ultraviolet spectrophotometry (The detection limits were 0.08 mg·L−1) [27]. The H 2 PO 4 concentration was determined by the molybdate ammonium spectrophotometric method (The detection limits were 0.01 mg·L−1) [28]. The relative standard deviations (RSD) of replicate standard measurements were 1.03%, 1.94%, 5.20% for NH 4 + , H 2 PO 4 and NO 3 , respectively.

2.4. Calculation of Dynamic Parameters

First, the ion depletion curve equation was obtained from the calculation [29,30,31]. The commonly used ion depletion curve equation is a univariate quadratic polynomial:
Y   =   a   +   b X   +   c X 2
where, X is the absorption time and Y is the ion concentration. A first-order derivative of this equation yields the following equation for the rate of change in concentration:
Y   =   b   +   2 c X
Equation (2) is considered as follows: as X approaches 0, Y   =   b , thus the maximum concentration change rate can be calculated. By considering the volume of the nutrient absorbent and the fresh weight of the plant, the maximum rate of uptake per unit mass can be obtained using the Equation (3):
V m a x   =   b × V / f r e s h   w e i g h t
where   V m a x reflects the intrinsic potential of the plant to absorb nutrients [12,13]. By substitute   Y   =   1 2 b into Equation (2), X can be obtained. Similarly, the substitution of X   into Equation (1) can get Y , which is the value of K m (i.e., the concentration of nutrient solution at 1 / 2 V m a x ). It is worth mentioning that the lower the K m value, the greater the affinity of the plant root absorption system of the ions [32].

2.5. Method of Data Analysis

The data were processed with the double reciprocal form of the Michaelis Menten dynamic equation [13] Lineweaver-Burk plot, also known as double-reciprocal plot (DRP). The kinetic parameters intrinsic potential of the plant to absorb nutrients (Vmax) and affinity of the plant root absorption system of the ions (Km) were then calculated. All data were statistically analyzed via one-way analyzes of variance using SPSS 22.0 software (SPSS Inc., Chicago, IL, USA), and significant differences were tested using the least significant difference and Duncan multiple comparisons. Standard errors obtained with the triplicate experiments were graphically shown when they exceeded 5%.

3. Results

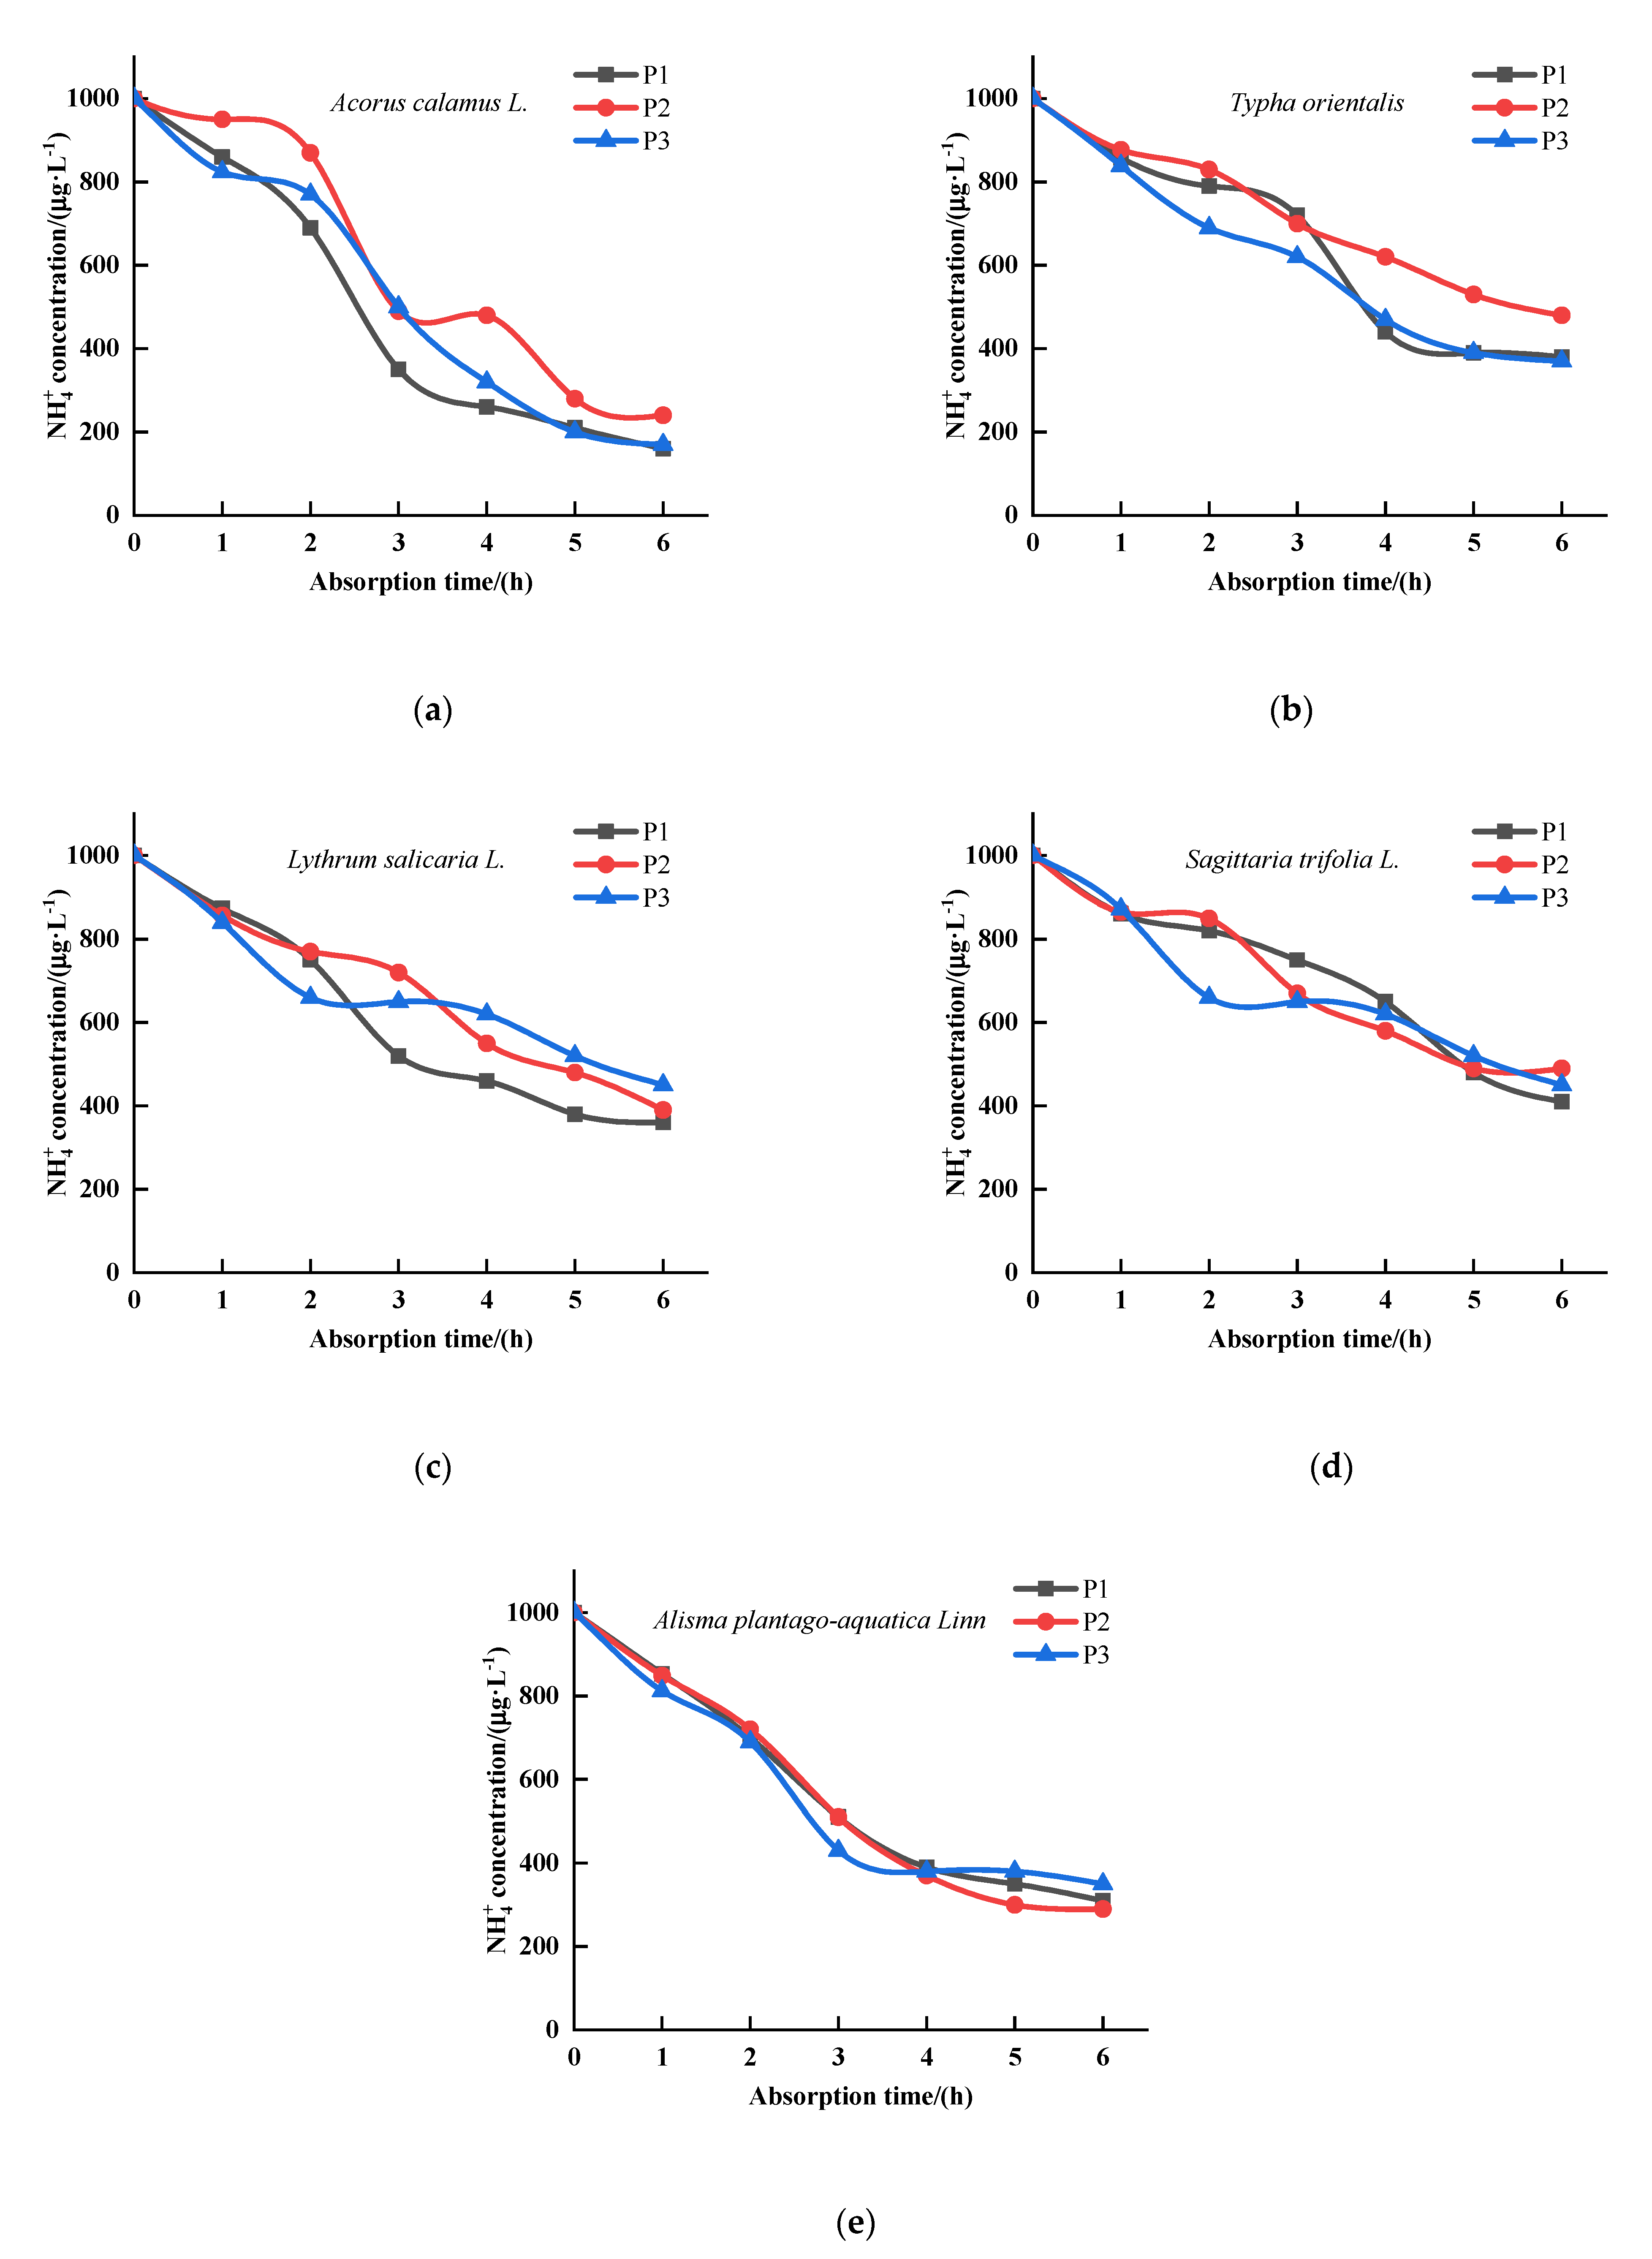
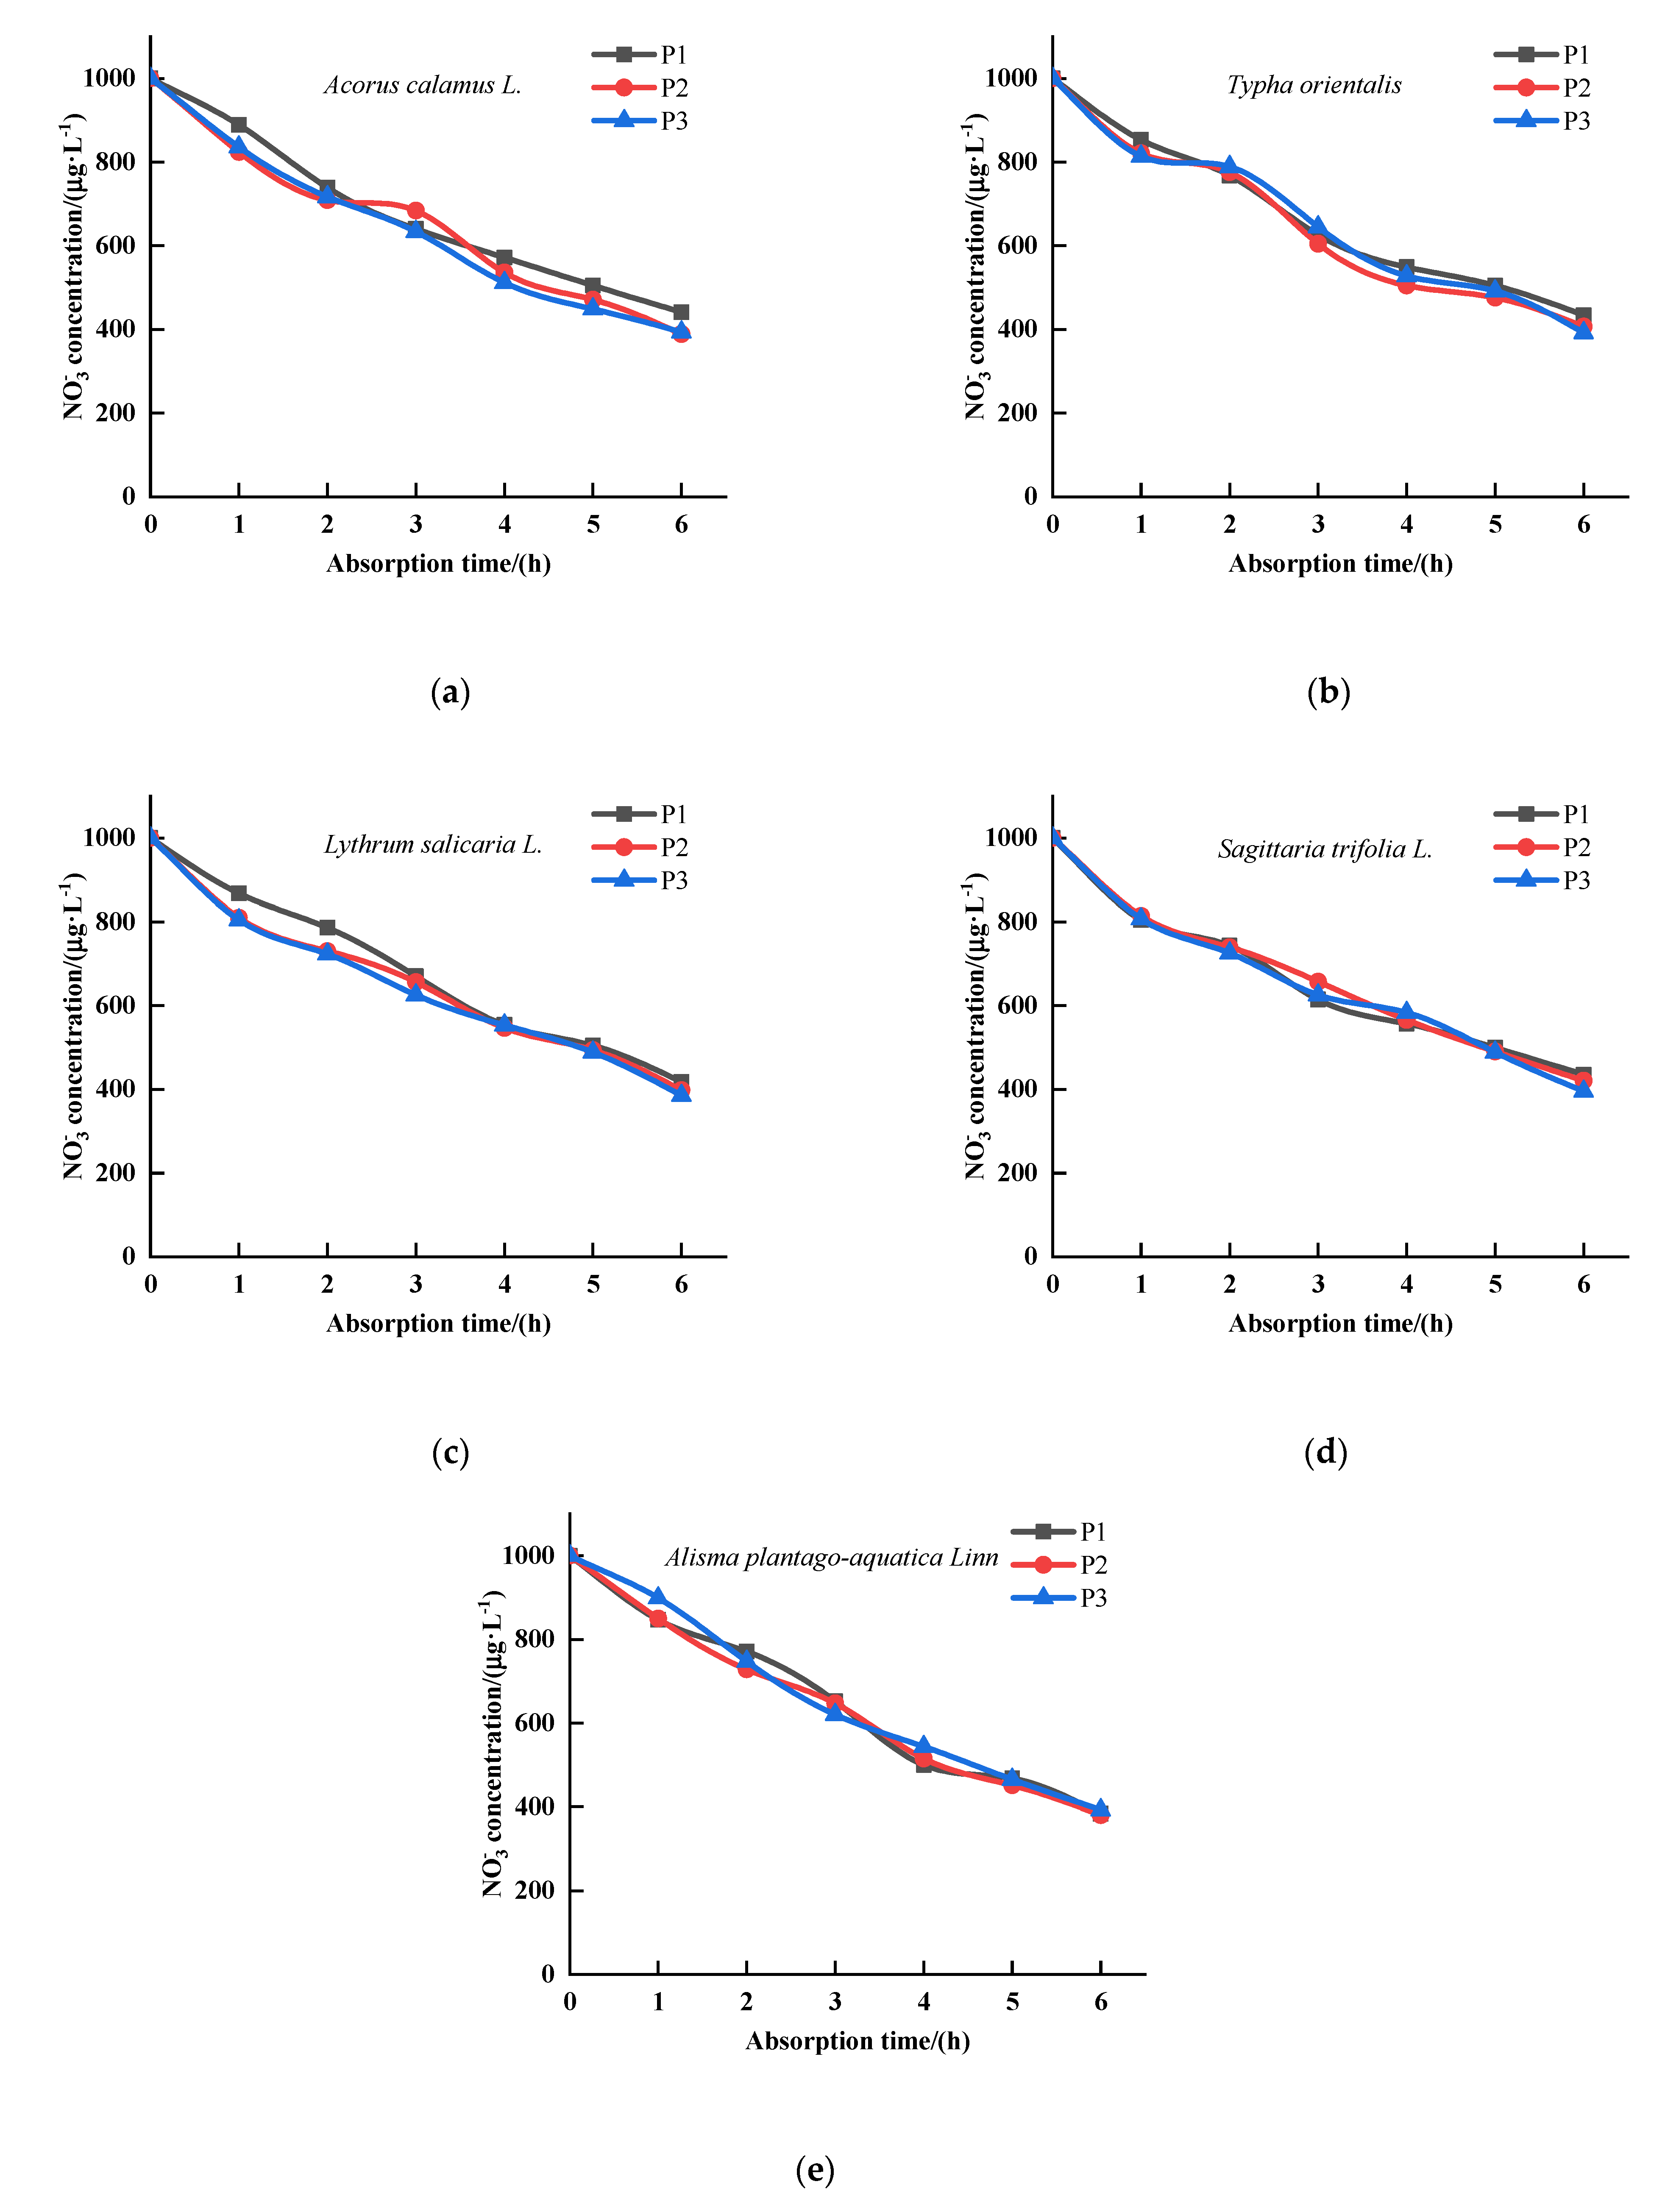
3.1. The Effects of P on the Kinetics of   N H 4 + Absorption by Five Emergent Plants

  NH 4 + absorption concentration of T. orientalis, A. calamus, L. salicaria, S. trifolia, and A. plantago-aquatica changes with time, as shown in Figure 2. The uptake of NH 4 + by the five emergent plants at three P concentrations showed different trends. The ion depletion equation for NH 4 + was obtained by fitting the uptake curves of the five emergent plants (Table 2). Based on the ion depletion equations, the kinetic parameters of NH 4 + uptake by plants were obtained (Table 3). Therefore, the Vmax values of these five plants under P1 condition were significantly different (p < 0.05), the plant with the greatest uptake of NH 4 + at P1 concentration was A. calamus with a maximum uptake of 0.3571 mg 1 · g 1 · h 1 , followed by L. salicaria with a maximum uptake of 0.3333 mg 1 · g 1 · h 1 , and T. orientalis with 0.1851 mg 1 · g 1 · h 1 ; A. calamus had the highest value of 0.2500 mg 1 · g 1 · h 1 for NH 4 + at the P2 concentration (p < 0.05), followed by A. plantago-aquatica, S.trifolia and L. salicaria, which had similar values of 0.2174 mg 1 · g 1 · h 1 , 0.2128 mg 1 · g 1 · h 1 and 0.2083 mg 1 · g 1 · h 1 , respectively (p > 0.05). However, T. orientalis had again the lowest uptake value (0.1491 mg 1 · g 1 · h 1 . At P3 concentration, A. plantago-aquatica had the highest NH 4 +   uptake (0.3571 mg 1 · g 1 · h 1 , p < 0.05), followed by T. orientalis and S. trifolia with values of 0.2174 mg 1 · g 1 · h 1 and 0.2083 mg 1 · g 1 · h 1 , respectively (p < 0.05). There was no significant difference in Vmax values between A. calamus and L. salicaria. (p > 0.05). T. orientalis had the lowest value with 0.1887 mg 1 · g 1 · h 1 (p < 0.05). The Km values between different plant species had obvious differences. The Km values of A. calamus, L. salicaria, S. trifolia gradually increased as the p concentration increased, indicating that the affinity of their roots for NH 4 + decreased as the p concentration increased. The lowest Km values were obtained for A. calamus under P1 and P2 conditions with 0.2121 mg 1 · L 1 and 0.2242 mg 1 · L 1 , respectively (p < 0.05). Under P3 condition, the lowest Km value was 0.1692 mg 1 · L 1 (p < 0.05) for A. plantago-aquatica, indicating that the roots of A. plantago-aquatica had a greater affinity for NH 4 + under this condition.

3.2. The Effects of P on the Kinetics of N O 3 Absorption by Five Emergent Plants

NO 3 absorption concentration of T. orientalis, A. calamus, L. salicaria, S. trifolia, and A. plantago-aquatica changes with time, as show in Figure 3. The concentration of NO 3 in the culture medium of all five emergent plants changed in time. In general, the NO 3 concentrations in the culture medium of all five plants decreased as the uptake time increased. The ion depletion equations (Table 4) and absorption kinetic parameters (Table 5) for NO 3 were obtained by fitting the absorption curves to the five plants. The Vmax values of the five plants had significant differences under P1 concentration. The plants with the highest NO 3 uptake was T. orientalis with a maximum uptake rate of 0.4000 mg 1 · g 1 · h 1 , followed by A. calamus (0.3333 mg 1 · g 1 · h 1 ), and L. salicaria with a Vmax of 0.1818 mg 1 · g 1 · h 1 (p < 0.05). Under P2 condition, the highest Vmax was 0.8333 mg 1 · g 1 · h 1 and 0.4167 mg 1 · g 1 · h 1 (p < 0.05) for T. orientalis and A. calamus, respectively, followed by S. trifolia, A. plantago-aquatica and L. salicaria. (0.2083 mg 1 · g 1 · h 1 , 0.2083 mg 1 · g 1 · h 1 , 0.1923 mg 1 · g 1 · h 1 , respectively) which had insignificant difference (p > 0.05). Under P3 condition, the Vmax values of these five plants had significant differences (p < 0.05). The highest maximum uptake rates were 0.6667 mg 1 · g 1 · h 1 and 0.3846 mg 1 · g 1 · h 1 for T. orientalis and A. calamus, respectively. S. trifolia and L. salicaria had values of 0.2381 mg 1 · g 1 · h 1 and 0.2083 mg 1 · g 1 · h 1 , respectively. The lowest maximum uptake rate for A. plantago-aquatica was 0.1852 mg 1 · g 1 · h 1 . The Km values between different plant species had obvious differences. The lowest Km values were obtained for A. plantago-aquatica, L. salicaria under P1 and P3 conditions with 0.3362 mg 1 · L 1 and 0.3801 mg 1 · L 1 , respectively (p < 0.05). Under P2 condition, the lowest Km value were 0.3541 mg 1 · L 1 and 0.3885 mg 1 · L 1 for A. plantago-aquatica, L. salicaria, respectively, which had significant difference from the other plants (p < 0.05), indicating that the roots of A. plantago-aquatica and L. salicaria had a greater affinity for NO 3 under this condition.

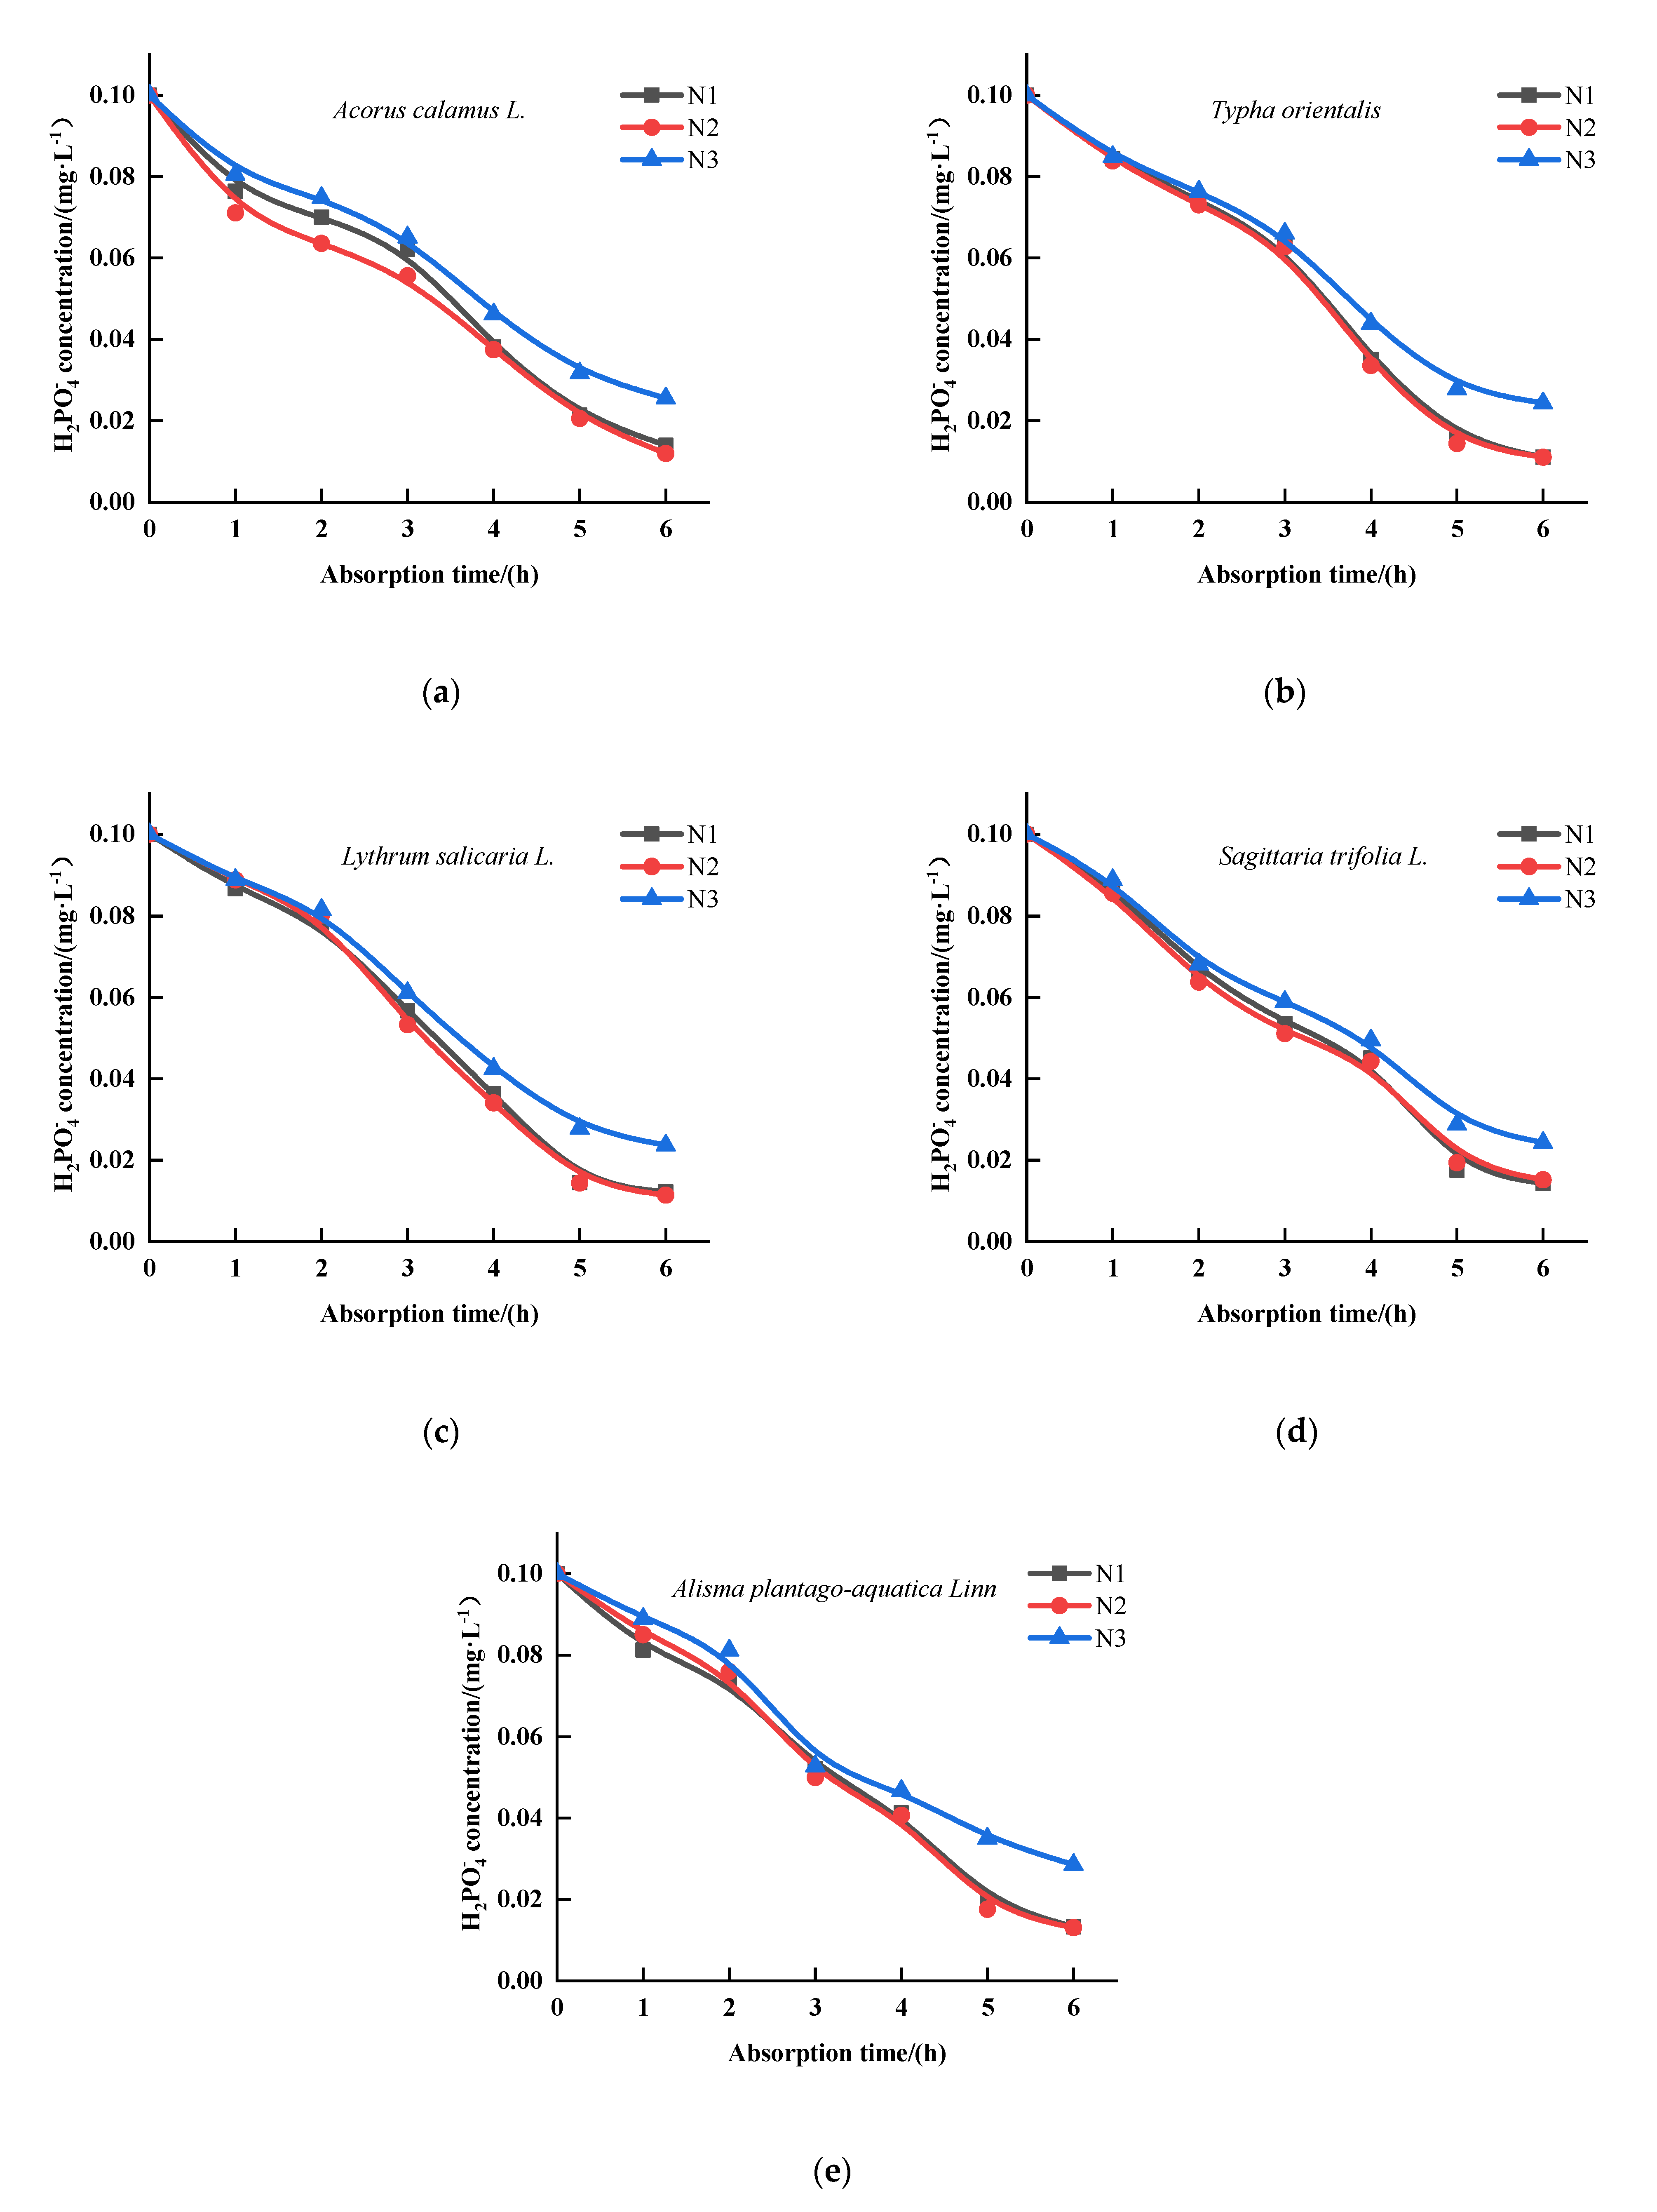
3.3. The Effect of N on the Kinetics of the H 2 P O 4 Absorption by Five Emergent Plants

The concentration of H 2 PO 4 in all five plant cultures decreased with increasing time (Figure 4). The maximum rate of uptake varied for each plant. The ion depletion equations (Table 6) were calculated for the five plants according to Figure 4. After, the absorption kinetic parameters (Table 7) were obtained. Table 7 shows that A. plantago-aquatica and A. calamus were significantly different from the other emergent plants (p < 0.05), which had the maximum H 2 PO 4 uptake values (0.0212 mg 1 · g 1 · h 1 , 0.0189 mg 1 · g 1 · h 1 ) under N1 condition. Under N2 condition, the maximum H 2 PO 4 uptake value for A. plantago-aquatica was 0.0191 mg 1 · g 1 · h 1 , which was significantly different from the other emergent plants (p < 0.05). There was no significant difference between A. calamus and S. trifolia (p > 0.05), their values were 0.0191 mg 1 · g 1 · h 1 , 0.0179 mg 1 · g 1 · h 1 , respectively. Under N3 condition, there was no significant difference between the other four plants (p < 0.05), except for S. trifolia. The Vmax values of the four plants were similar, with the top Vmax values being 0.0171 mg 1 · g 1 · h 1 and 0.0170 mg 1 · g 1 · h 1 for L. salicaria and A. calamus, respectively, followed by 0.0165 mg 1 · g 1 · h 1 and 0.0164 mg 1 · g 1 · h 1 , 0.0163 mg 1 · g 1 · h 1 for A. plantago-aquatica, T. orientalis and S. trifolia, respectively. Meanwhile, the lowest Km values were obtained for T. orientalis under N1 and N2 conditions with 0.0017 mg 1 · L 1 and 0.0014 mg 1 · L 1 , respectively (p < 0.05). Under N3 condition, the lowest Km values were 0.0018 mg 1 · L 1 and 0.0016 mg 1 · L 1 for T. orientalis, L. salicaria, respectively, which had significant difference from the other emergent plants (p < 0.05), indicating that the roots of T. orientalis and L. salicaria had a greater affinity for H 2 PO 4 under this condition.

4. Discussion

Fageria et al. found that plant uptake of nutrient ions is regulated by a combination of a high affinity mechanism at low concentrations and a low affinity mechanism at high concentrations [33]. Cacco et al. suggest that different genotypes may result in an “affinity strategy” (low Km) or a “speed strategy” (high Vmax). In fact, they proposed a theory for the use of the parameters Km and Vmax to evaluate the adaptation of different plant species to environmental nutrient status, which includes the following statements: (1) plants with high Vmax and low Km values are adapted to a wide range of nutrient conditions; (2) plants with high Vmax and high Km values are adapted to high levels of nutrient conditions; (3) plants with low Vmax and low Km values are adapted to low levels of nutrient conditions; and (4) plants with low Vmax and high Km values are unfavorable at all nutrient concentration conditions [34]. The first scenario is the ideal model, but in reality, the genotype of this combination is very difficult to discover.
In the present study, it was found that the uptake of NH 4 + ,   NO 3 and H 2 PO 4 by five species of plants, A. calamus, T, orientalis, L, salicaria, S. trifolia, and A. plantago-aquatica, differed in their respective ranges of applicability. T. orientalis and L. salicaria had the highest Vmax values for NH 4 + under P1 conditions, which is suitable for the removal of ammonium nitrogen in low P water bodies; T. orientalis and A. plantago-aquatica had the highest Vmax values for NH 4 + under P3 conditions, which can have good removal effect in high P water bodies. The maximum Vmax values of A. calamus and T. orientalis for NO 3 under P2 and P3 concentrations indicated that they had a considerable NO 3 uptake at medium and high phosphorus levels. Meanwhile, A. calamus and T. orientalis had the highest Vmax values under P1 conditions, indicating that these two plants also had good uptake of NO 3 under low phosphorus concentrations and they could be used for the removal of NO 3 from phosphorus-polluted water bodies at different levels. Although L. salicaria and A. plantago-aquatica had low Vmax values at the three phosphorus levels, their small Km values indicated that they had a strong affinity for NO 3 and were able to adapt to low NO 3 environments. Moreover, both plants can be considered for maintaining water quality after restoration of A. calamus and T. orientalis. A. plantago-aquatica had the highest Vmax values at N1 and N2 levels, and it was suitable for phosphorus removal in low to moderate nitrogen-polluted waters. L. salicaria and A. calamus had the highest Vmax values at N3 conditions, thus, both plants were more effective in phosphorus uptake when nitrogen concentrations in the aqueous environment were considerably high. Although the Vmax values of T. orientalis and L. salicaria were low, their Km values were at low levels and had the highest affinity for H 2 PO 4 . Therefore, these plants can be suitable for deeper purification of water bodies with low phosphorus levels.
Emergent plants repair eutrophic water bodies, mainly through uptake by the plant roots. Among the five species of plants, A. calamus has a large and well-developed root system with a large surface area and, therefore, a rapid uptake rate. When choosing the right plant for water purification, the root growth should be considered. In addition, Km and Vmax values are greatly influenced by the environment. Brix et al. found that the pH value and nitrogen content of the plant root environment can affect the uptake of ammonium nitrogen and nitrate nitrogen by T. orientalis. This fact is also related to the different growing season of the plant [18,35,36,37,38]. Zhang et al. found that the light intensity had a significant effect on the Vmax value of NH 4 + uptake by V. natans (i.e., the Vmax value of NH 4 + uptake under light conditions was 1.44 times higher than that under dark conditions) [22]. Due to the limitations of the conditions, only conventional treatments were set up in this experiment, and the effect of different temperatures or light exposures on the kinetic parameters of nutrient uptake could be set up in subsequent experiments.

5. Conclusions

In conclusion, this paper argued that nitrogen and phosphorus are two important nutrients necessary for plant growth, and nitrogen to phosphorus ratio is very important in the process of plant uptake. In this study, it was not possible to measure important nitrogen microbial transformations, as nitrification, denitrification, and their coupling, which occur in a plant-sediment system, like the one under study, both at the level of roots and in the biofilms covering the plants. Although these nitrogen pathways may have exerted a significant role in the nitrogen kinetics in the presence of different plants, we have considered them as part of the plant system and ascribed to it, for the applicative purposes of the study. In this view, the results of this study clearly suggest that: (1) There are differences in the kinetic characteristics of five plants in absorbing nutrients in experimental water; (2) Under the three phosphorus levels, A. calamus and A. plantago-aquatica are suitable for the removal of ammonia nitrogen at low to moderate and high phosphorus levels, respectively, while T. orientalis has the strongest absorption of nitrate nitrogen at all phosphorus levels; (3) Under the three nitrogen levels, A. plantago-aquatica and L. salicaria are suitable for the removal of phosphorus at low to moderate and high nitrogen levels, respectively; (4) It can be seen from the Michaelis-Menten constant values that A. calamus and A. plantago-aquatica have the strongest barren tolerance to ammonia nitrogen and nitrate nitrogen. Meanwhile, T. orientalis and L. salicaria have the same phenomenon to phosphorus. Therefore, they can be used to maintain water quality with a low nitrogen to phosphorus ratio. Consequently, this study can be applied for further clarifying the mechanism of nitrogen and phosphorus removal from water bodies, and for selecting of emergent plants in ecological restoration projects for eutrophic water bodies with different nutritional characteristics.

Author Contributions

Conceptualization, C.S., G.L. and K.W.; methodology, C.S. and K.W.; software, K.W. and Q.H.; validation, Y.W. and H.Y.; formal analysis, Y.W.; investigation, K.W. and Q.H.; data curation, K.W.; writing—original draft preparation, K.W.; writing—review and editing, C.S. and G.L.; visualization, Q.H. and H.Y.; project administration, G.L.; funding acquisition, C.S. and G.L. All authors have read and agreed to the published version of the manuscript.

Funding

This research received no external funding.

Institutional Review Board Statement

Not applicable.

Informed Consent Statement

Not applicable.

Data Availability Statement

The data presented in this study are available on request from the corresponding author. The data are not publicly available due to data which also forms part of an ongoing study.

Acknowledgments

The authors would like to thank Ling Wencui and Fang Yaoyao for providing the laboratory space, Li Huanli for providing pharmaceutical help, Wu Yalin for providing the testing equipment. What’s more the authors would like to express their gratitude to EditSprings (https://www.editsprings.com/) for the expert linguistic services provided.

Conflicts of Interest

The authors declare no conflict of interest.

References

  1. Cao, T.; Ni, L.Y. The response of the antioxidant enzymein Ceratophyllum on inorganic nitrogen increased in water. Acta Hydroecologica Sin. 2004, 28, 299–302. [Google Scholar]
  2. Been, A.; Ni, L. Effects of water column nutrient enrichment on the growth of Potamogeton maackianus. J. Aquat. Plant Manag. 2001, 39, 83–87. [Google Scholar]
  3. Arts, G.H.P. Deterioration of Atlantic soft water macrophyte communities by acidification, eutrophication and alkalinization. Aquat. Bot. 2002, 73, 373–393. [Google Scholar]
  4. Sagrario, M.A.G.; Jeppesen, E.; Goma, J.; Sondergaars, M.; Jensen, J.P.; Lauridsen, T.; Landkildehus, F. Does high nitrogen loading prevent clear-water conditions in shallow lakes at moderately high phosphorus concentrations? Freshw. Biol. 2005, 50, 27–41. [Google Scholar]
  5. Carr, G.M.; Duthine, H.C.; Taylor, W.D. Model of aquatic plant productivity: A review of that influence growth. Aquat. Bot. 1997, 59, 195–215. [Google Scholar]
  6. Xiong, H.; Tan, Q.; Hu, C. Structural and metabolic responses of Ceratophyllum demersum to eutrophic condition. Afr. J. Biotechnol. 2010, 9, 5722–5729. [Google Scholar]
  7. Farnsworth-Lee, L.A.; Baker, L.A. Conceptual model of aquatic plant decay and ammonia toxicity for shallow lakes. J. Environ. Eng. 2000, 126, 199–207. [Google Scholar]
  8. Chen, G.Y.; Li, G.X.; Tang, K. Kinetics of nitrogen and phosphorus uptake by root system of Iris pseudacorus L. and Typha angustifolia L. Chin. J. Environ. Eng. 2013, 7, 4638–4642. [Google Scholar]
  9. Zhang, X.L.; Wang, L.X.; Liu, H.M.; Qing, H.; Liu, D.W.; Wang, W.; Liang, C.Z.; Friedrich, R. Kinetics of nutrient uptake by three emergent plants, Phragmites australis, Typha orientalis and Scirpus triqueter. Acta Ecol. Sin. 2014, 34, 2238–2245. [Google Scholar]
  10. Xie, J.; Lv, X.W.; Li, H. Uptake dynamics of N and P in polluted water by 6 different wetland plants. Chin. J. Environ. Eng. 2016, 10, 4067–4072. [Google Scholar]
  11. Epstein, E.; Hagen, C.E. A kinetic study of the absorption of alkaline canons by barley roots. Plant Physiol. 1952, 27, 457–474. [Google Scholar] [PubMed] [Green Version]
  12. Nielsen, N.E.; Barber, S.A. Differences among genotypes of corn in the kinetics of P uptake. Agron. J. 1978, 70, 695–698. [Google Scholar]
  13. Classen, N.; Barber, S.A. A method for characterizing the relation between nutrient concentration and flux into roots of intact plants. Plant Physiol. 1974, 54, 564–568. [Google Scholar]
  14. Cai, S.M.; Liu, W.T.; Zhang, Z.; Bai, Y.C.; Qian, X.Q. Phosphorus uptake kinetics of different types of duckweed. J. Ecol. Rural Environ. 2011, 27, 48–52. [Google Scholar]
  15. Chen, S.Y.; Xu, C.; Yao, Y.; Huang, L.Z.; Zhang, Y.T. Uptake kinetics of ammonia, nitrate and phosphorus by submerged macrophytes Hydrilla veticillata and Vallisneria natans. Environ. Sci. Technol. 2010, 16, 407–412. [Google Scholar]
  16. Tang, Y.X.; Zheng, J.M.; Lou, L.P. Comparisons of NH 4 + , NO 3 and H 2 PO 4 uptake kinetics in three different macrophytes in waterlogged condition. Chin. J. Eco-Agric. 2011, 19, 614–618. [Google Scholar]
  17. Shen, G.X.; Yao, F.; Ni, W.Z. The kinetics of ammonium and nitrate uptake by duckweed plant. Chin. J. Soil Sci. 2006, 37, 505–508. [Google Scholar]
  18. Jampeetong, A.; Brix, H. Nitrogen nutrition of Salvinia natans: Effects of inorganic nitrogen from on growth, morphology, nitrate reductase activity and uptake kinetics of ammonium and nitrate. Aquat. Bot. 2009, 90, 67–73. [Google Scholar]
  19. Liu, F.; Li, H.L. A preliminary study under on NH 4 + uptake kinetics of Potamogeton different nutrient. J. Wuhan Bot. Res. 2009, 27, 98–101. [Google Scholar]
  20. Chang, H.Q.; Li, N.; Xu, X.F. NH 4 + and NO 3 uptake kinetics of three aquatic macrophytes. Ecol. Environ. 2008, 17, 511–514. [Google Scholar]
  21. Chen, S.Y.; Xu, C.; Yao, Y. Uptake Kinetics of Ammonia Nitrate and Phosphorus by Submerged Macrophytes Hydrilla verticillate and Vallisneria natas. Environ. Sci. Technol. 2012, 35, 34–36. [Google Scholar]
  22. Zhang, A.W.; Cao, T.; Zhang, M. Uptake of ammonium by Vallisneria natans and dark regimes spicatum under light. J. Lake Sci. 2013, 25, 289–294. [Google Scholar]
  23. Cao, T.; Ni, L.Y. The role of NH 4 + toxicity in the decline of the submersed macrophyte Vallisneria natans in lakes of the Yangtze River basin, China. Mar. Freshw. Res. 2007, 58, 581–587. [Google Scholar] [CrossRef] [Green Version]
  24. Runcie, J.W.; Ritchie, R.J.; Larkum, A.W.D. Uptake kinetics and assimilation of inorganic nitrogen by Catenella nipae and Ulva lactuca. Aquat. Bot. 2003, 76, 155–174. [Google Scholar] [CrossRef]
  25. Ministry of Environmental Protection of the People’s Republic of China. Environmental Quality Standards for Surface Water; China Environmental Science Press: Beijing, China, 2002; Available online: https://wenku.baidu.com/view/911e9f3c195f312b3169a5e8.html (accessed on 15 November 2020).
  26. Ministry of Environmental Protection of the People’s Republic of China. Water Quality-Determination of Ammonia Nitrogen-Nessler’s Reagent Spectrophotometry; China Environmental Science Press: Beijing, China, 2009; Available online: https://www.yunzhan365.com/50616095.html (accessed on 15 November 2020).
  27. Ministry of Environmental Protection of the People’s Republic of China. Water Quality-Determination of Nitrate Nitrogen-Ultraviolet Spectrophotometry; China Environmental Science Press: Beijing, China, 2007; Available online: https://www.yunzhan365.com/87559483.html (accessed on 15 November 2020).
  28. Ministry of Environmental Protection of the People’s Republic of China. Water Quality-Determination of Total Phosphorus-Ammonium Molybdate Spectrophotometric Method; China Environmental Science Press: Beijing, China, 1989; Available online: https://www.yunzhan365.com/30053506.html (accessed on 15 November 2020).
  29. Santos, L.A.; Santos, W.A.; Sperandio, M.V.L.; Bucher, C.A.; de Souza, S.R.; Fernandes, M.S. Nitrate uptake kinetics and metabolic parameters in two rice varieties grown in high and low nitrate. J. Plant Nutr. 2011, 34, 988–1002. [Google Scholar] [CrossRef]
  30. Zhang, K.; Chen, Y.P.; Zhang, T.T.; Zhao, Y.; Shen, Y.; Huang, L.; Gao, X.; Guo, J.S. The logistic growth of duckweed (Lemna minor) and kinetics of ammonium uptake. Environ. Technol. 2014, 35, 562–567. [Google Scholar] [CrossRef] [PubMed]
  31. Jiang, T.H.; Zheng, S.J.; Shi, J.Q.; Hu, A.T.; Shi, R.H.; Xu, M. Several considerations in kinetic research on nutrients uptake by plants. Plant Nutr. Fertil. Sci. 1995, 1, 11–17. [Google Scholar]
  32. Zhang, Z.H.; Rengel, Z.; Meney, K. Kinetics of ammonium, nitrate and phosphorus uptake by Canna indica and Schoenoplectus validus. Aquat. Bot. 2009, 91, 71–74. [Google Scholar] [CrossRef]
  33. Fageria, N.K. Kinetics of phosphate absorption by intact rice plants. Aust. J. Agric. 1974, 25, 395–400. [Google Scholar] [CrossRef]
  34. Cacco, G.; Ferrari, G.; Saccomani, M. Pattern of sulfate uptake during root elongation in maize: Its correlation with productivity. Physiol. Plant. 2006, 48, 375–378. [Google Scholar] [CrossRef]
  35. Brix, H.; Dyhr-Jensen, K.; Lorenzen, B. Root-zone acidity and nitrogen source affects Typha latifolia L. growth and uptake kinetics of ammonium and nitrate. J. Exp. Bot. 2002, 53, 2441–2450. [Google Scholar] [CrossRef] [PubMed] [Green Version]
  36. Fang, Y.Y.; Babourina, O.; Rengel, Z.; Yang, X.E.; Pu, P.M. Ammonium and nitrate uptake by the floating plant Landoltia punctata. Ann. Bot. 2007, 99, 365–370. [Google Scholar] [CrossRef] [PubMed] [Green Version]
  37. Chen, W.Y.; Chen, Z.H.; He, Q.F.; Wang, X.Y.; Wang, C.R.; Chen, D.F.; Lai, Z.L. Root growth of wetland plants with different toot types. Acta Ecol. Sin. 2007, 27, 450–457. [Google Scholar] [CrossRef]
  38. Chen, S.P. Advances in biological fundamental studies on artificial wetland wastewater treatment system. J. Lake Sci. 1996, 8, 268–272. [Google Scholar]
Figure 1. Plant sampling point.
Sustainability 13 00434 g001
Figure 2. Changes of NH4+ concentrations in culture solution for the five emergent plants. (a) Acorus calamus L., (b) Typha orientalis, (c) Lythrum salicaria L., (d) Sagittaria trifolia L., (e) Alisma plantago-aquatica Linn. (P1—0.04 mg·L−1, P2—0.08 mg·L−1, P3—0.5 mg·L−1, n = 3).
Sustainability 13 00434 g002
Figure 3. Changes of NO3 concentrations in culture solution for the five emergent plants. (a) Acorus calamus L., (b) Typha orientalis, (c) Lythrum salicaria L., (d) Sagittaria trifolia L., (e) Alisma plantago-aquatica Linn. (P1—0.04 mg·L−1, P2—0.08 mg·L−1, P3—0.5 mg·L−1, n = 3).
Sustainability 13 00434 g003
Figure 4. Changes of H2PO4 concentrations in culture solution for the five emergent plants. (a) Acorus calamus L., (b) Typha orientalis, (c) Lythrum salicaria L., (d) Sagittaria trifolia L., (e) Alisma plantago-aquatica Linn. (N1—0.2 mg·L−1, N2—0.6 mg·L−1, N3—1.2 mg·L−1, n = 3).
Sustainability 13 00434 g004
Table 1. The concentration of   NH 4 + , NO 3 , and H 2 PO 4 .
Total Phosphorus Level Total Nitrogen Level
P1P2P3 N1N2N3
NH 4 +
1 mg · L 1
0.04 mg · L 1 0.08 mg · L 1 0.5 mg · L 1 H 2 PO 4 0.1   mg · L 1 0.2 mg · L 1 0.6 mg · L 1 1.2 mg · L 1
NO 3
1 mg · L 1
0.04 mg · L 1 0.08 mg · L 1 0.5 mg · L 1
Table 2. Equations of NH4+ concentration versus uptake time for the five emergent plants.
Plant SpeciesP1P2P3
Acorus calamus L. y = 0.085 x 2 0.425 x + 1.2 y = 0.15 x 2 0.53 x + 1.3 y = 0.108 x 2 0.378 x + 1.094
Typha orientalis y = 0.001 x 2 0.071 x + 0.928 y = 0.0415 x 2 0.1715 x + 1.007 y = 0.0395 x 2 0.2675 x + 1.067
Lythrum salicaria L. y = 0.0535 x 2 0.2835 x + 1.103 y = 0.0185 x 2 0.1425 x + 0.981 y = 0.0085 x 2 0.435 x + 1.19
Sagittaria trifolia L. y = 0.0145 x 2 0.0845 x + 0.931 y = 0.0825 x 2 0.2625 x + 1.045 y = 0.101 x 2 0.515 x + 1.286
Alisma plantago-aquatica Linn y = 0.0185 x 2 0.2085 x + 1.043 y = 0.0405 x 2 0.2505 x + 1.059 y = 0.069 x 2 0.329 x + 1.072
P1—0.04 mg·L−1, P2—0.08 mg·L−1, P3—0.5 mg·L−1, n = 3.
Table 3. Kinetic parameters of NH4+ absorption by the five emergent plants.
Plant SpeciesVmax (mg−1·g−1·h1)Km (mg·L1)
P1P2P3P1P2P3
Acorus calamus L.0.3571 ± 0.0039   a 0.2500 ± 0.0012   a 0.1887 ± 0.0034   d 0.2121 ± 0.0030   d 0.2242 ± 0.0019   e 0.2616 ± 0.0008   d
Typha orientalis0.1851 ± 0.0045   d 0.1491 ± 0.0026   c 0.2174 ± 0.0029   b 0.3594 ± 0.0026   b 0.3949 ± 0.0018   c 0.3077 ± 0.0023   c
Lythrum salicaria L.0.3333 ± 0.0038   b 0.2083 ± 0.0037   b 0.1843 ± 0.0024   d 0.3490 ± 0.0031   b 0.4406 ± 0.0022   b 0.4677 ± 0.0025   b
Sagittaria trifolia L.0.2222 ± 0.0053   c 0.2128 ± 0.0034   b 0.2083 ± 0.0027   c 0.5308 ± 0.0045   a 0.5683 ± 0.0027   a 0.6078 ± 0.0027   a
Alisma plantago-aquatica Linn0.1961 ± 0.0022   d 0.2174 ± 0.0032   b 0.3571 ± 0.0014   a 0.2498 ± 0.0053   c 0.2388 ± 0.0029   d 0.1692 ± 0.0030   e
Note: Values are reported as mean ± standard error. Different letters (a, b, c, d, e) indicate significantly different values at a particular concentration between different plant species at the same level (p < 0.05). P1—0.04 mg·L−1, P2—0.08 mg·L−1, P3—0.5 mg·L−1, n = 3.
Table 4. Equations of NO3 concentration versus uptake time for the five emergent plants.
Plant SpeciesP1P2P3
Acorus calamus L. y = 0.0255 x 2 0.2265 x + 1.093 y = 0.045 x 2 0.25 x + 1.029 y = 0.018 x 2 0.173 x + 0.991
Typha orientalis y = 0.0285 x 2 0.1705 x + 0.995 y = 0.063 x 2 0.243 x + 0.992 y = 0.0595 x 2 0.2035 x + 0.958
Lythrum salicaria L. y = 0.0175 x 2 0.1335 x + 0.984 y = 0.0025 x 2 0.0865 x + 0.894 y = 0.0085 x 2 0.1065 x + 0.903
Sagittaria trifolia L. y = 0.034 x 2 0.163 x + 0.934 y = 0.0035 x 2 0.0855 x + 0.897 y = 0.007 x 2 0.105 x + 0.906
Alisma plantago-aquatica Linn y = 0.0215 x 2 0.1405 x + 0.966 y = 0.0205 x 2 0.1835 x + 1.013 y = 0.0125 x 2 0.1895 x + 1.076
P1—0.04 mg·L−1, P2—0.08 mg·L−1, P3—0.5 mg·L−1, n = 3.
Table 5. Kinetic parameters of NO3 absorption by the five emergent plants.
Plant Species Vmax (mg−1·g−1·h−1)Km (mg·L−1)
P1P2P3P1P2P3
Acorus calamus L.0.3333 ± 0.0021   a 0.4167 ± 0.0226   b 0.3846 ± 0.0019   b 1.2592 ± 0.0008   b 1.1920 ± 0.0017   a 1.2175 ± 0.0027   b
Typha orientalis0.400 ± 0.0020   b 0.8333 ± 0.0012   a 0.6667 ± 0.0026   a 1.5271 ± 0.0025   a 1.0808 ± 0.0009   b 1.382 ± 0.0006   a
Lythrum salicaria L.0.1818 ± 0.0013   c 0.1923 ± 0.0011   c 0.2083 ± 0.0027   d 0.3872 ± 0.0025   d 0.3885 ± 0.0015   d 0.3716 ± 0.0027   e
Sagittaria trifolia L.0.2703 ± 0.0010   d 0.2083 ± 0.0026   c 0.2381 ± 0.0023   c 0.5077 ± 0.0019   c 0.5537 ± 0.0018   c 0.5288 ± 0.0021   c
Alisma plantago-aquatica Linn0.2272 ± 0.0021   e 0.2083 ± 0.0027   c 0.1852 ± 0.0027   e 0.3362 ± 0.0020   e 0.3541 ± 0.0006   d 0.3801 ± 0.0023   d
Note: Values are reported as mean ± standard error. Different letters (a, b, c, d, e) indicate significantly different values at a particular concentration between different plant species at the same level (p < 0.05). P1—0.04 mg·L−1, P2—0.08 mg·L−1, P3—0.5 mg·L−1, n = 3.
Table 6. Equations of H2PO4 concentration versus uptake time for the five emergent plants.
Plant SpeciesN1N2N3
Acorus calamus L. y = 0.0008 x 2 0.0087 x + 0.0843 y = 0.00025 x 2 0.00825 x + 0.0791 y = 0.0020 x 2 0.0117 x + 0.0902
Typha orientalis y = 0.00035 x 2 0.01125 x + 0.0953 y = 0.00025 x 2 0.01155 x + 0.0952 y = 0.0009 x 2 0.0112 x + 0.0952
Lythrum salicaria L. y = 0.0068 x 2 0.0286 x + 0.1085 y = 0.0091 x 2 0.036 x + 0.1158 y = 0.0066 x 2 0.0271 x + 0.1094
Sagittaria trifolia L. y = 0.0042 x 2 0.0336 x + 0.1166 y = 0.00455 x 2 0.03545 x + 0.1165 y = 0.0062 x 2 0.0437 x + 0.1264
Alisma plantago-aquatica Linn y = 0.0074 x 2 0.0293 x + 0.1031 y = 0.0084 x 2 0.0343 x + 0.1109 y = 0.0103 x 2 0.0385 x + 0.1172
N1—0.2 mg·L−1, N2—0.6 mg·L−1, N3—1.2 mg·L−1, n = 3.
Table 7. Kinetic parameters of H2PO4 absorption by the five emergent plants.
Plant Species Vmax (mg−1·g−1·h−1)Km (mg·L−1)
N1N2N3N1N2N3
Acorus calamus L.0.0189 ± 0.00036   b 0.0191 ± 0.00011   b 0.0171 ± 0.00024   a 0.0047 ± 0.00028   b 0.0037 ± 0.00014   c 0.0091 ± 0.00012   a
Typha orientalis0.0174 ± 0.00026   c 0.0179 ± 0.00040   c 0.0164 ± 0.00026   a 0.0017 ± 0.00014   d 0.0014 ± 0.00012   e 0.0018 ± 0.00010   d
Lythrum salicaria L.0.0166 ± 0.00031   c 0.0175 ± 0.00017   c 0.0170 ± 0.00020   a 0.0021 ± 0.00003   c 0.0017 ± 0.00008   d 0.0016 ± 0.00015   d
Sagittaria trifolia L.0.0168 ± 0.00024   c 0.0186 ± 0.00026   b 0.0163 ± 0.00014   b 0.0063 ± 0.00014   a 0.0042 ± 0.00008   b 0.0062 ± 0.00012   c
Alisma plantago-aquatica Linn0.0212 ± 0.00017   a 0.0206 ± 0.00012   a 0.0164 ± 0.00032   a 0.0060 ± 0.00017   a 0.0065 ± 0.00012   a 0.0077 ± 0.00017   b
Note: Values are reported as mean ± standard error. Different letters (a, b, c, d, e) indicate significantly different values at a particular concentration between different plant species at the same level (p < 0.05). N1—0.2 mg·L−1, N2—0.6 mg·L−1, N3—1.2 mg·L−1, n = 3.
Publisher’s Note: MDPI stays neutral with regard to jurisdictional claims in published maps and institutional affiliations.

