Abstract
Imbalance of development and resources allocation can emerge during the rapid expansion of social commerce enterprises, which significantly reduces their competitiveness and sustainability. In this paper, we put forward the concept of social commerce ecosystem and propose a model composed of macro-niche and micro-niche to empirically analyze the performance of different social commerce enterprises in China. The results show that: (1) The social sharing e-commerce sub-industry is a monopoly market while the social retail e-commerce sub-industry tends to be a perfectly competitive market; (2) Compared with using only macro-niche or micro-niche, our model shows a more comprehensive insight of enterprise competitiveness, which provides a better niche evaluation for other industries.
1. Introduction
In the new round of digital transformation, the social characteristics of network information ecology and e-commerce ecological evolution drive the vigorous development of social commerce [1,2]. The social commerce industry is a branch of the e-commerce industry, a new type of e-commerce model that reflects the social value in network socialization. Specifically, it refers to the business activities based on social network service or tools including community, social network and other social media software [3]. In 2019, China’s social commerce became the fastest-growing part of e-commerce, with an overall scale of more than 2 trillion yuan (an increase of 63.2%), accounting for more than 20% of online retail and 71% of penetration rate [4]. Besides, many giant enterprises have developed social commerce, such as Alibaba’s new app “Taoxiaopu”, Jingdong’s new independent social commerce platform “Jingxi”, TikTok’s new social commerce function, and so on. Social commerce has become one of the frontier business models of the digital economy that drives future business and economic prosperity [5,6]. However, many enterprises have rushed for the exit since November 2019. Especially, more than 500 social commerce platforms in Guangzhou and Yiwu closed down in 2020 [7,8]. The main reasons are the fierce competition, fast iteration of the business model and overwhelming flow advantage of giant enterprises. Meanwhile, many social commerce enterprises have problems in the process of rapid expansion, such as unbalanced development and resource allocation [9]. These problems significantly affect the competitiveness and sustainable development of social commerce enterprises, which makes the whole industry a relatively unstable state. Therefore, in order to solve these development problems and improve survivability, it is imperative to evaluate the entire social commerce ecosystem.
The literature on social commerce mainly focuses on the following three aspects: The first is on the business model of social commerce, studying the innovative applications of the business process, co-design and value creation, which are different from traditional e-commerce [10,11,12,13]. The business model innovation combined with the practical application has spawned many successful cases, such as Pinduoduo, which focuses on low-quality and low-cost products and provides massive subsidies [14,15] and Mogu, which attaches importance to user content sharing on women’s wear [16]. The second is research on consumer behavior in social commerce, involving intentions and behaviors of adopting, using, buying, sharing and trusting on the social e-commerce platform [17,18,19,20,21,22]. On this basis, it provides guidance and suggestions for social commerce marketing. Besides, due to the natural communication advantage of social commerce, research on information dissemination in social commerce has also attracted much attention [23,24,25]. It is found that there are few studies on the competition of social commerce enterprises, and most of them focus on the competition game strategy [26,27], while no research focuses on the entire social commerce ecosystem. In the future, network and ecosystem perspectives will be the new entry points for the research on the three aspects above, such as optimization of social commerce service process network from the perspective of process mining [28], customer value flow from the perspective of consumer network [29] and the distribution of interests from the perspective of stakeholder network [30,31].
By reviewing the literature on enterprise niche, we find that some scholars have studied the enterprise niche mostly by case analysis [32,33], or simulated the development of niche elements in the way of co-evolution [34,35,36], without involving numerical measurement. The measurement of enterprise niche mainly involves niche value and niche breadth, niche fitness and niche overlap, which are used to analyze the survivability of enterprises [37,38], the rationality of enterprise resource allocation [39], and the degree of market competition [40] respectively. Based on niche evaluation, many enterprise competition strategies have been put forward, such as the niche integration strategy of two cross-industries after the deep competition and cooperation [41], the co-evolution balance strategy based on capital allocation efficiency and financing niche [35], four optimization strategies for different evolution stages of niche separation, niche expansion, niche selection, and niche alliance [36]. Scholars’ understanding of enterprise niche can be divided into macro and micro. The macro-niche represents the resource combination that the enterprise population relies on to survive in the competition with other groups [42], and thus can be used to judge the immediate environment for the survival and development of the enterprise. The micro-niche represents the resources and production capacity needed for the existence and development of the enterprise individual, so it can be used to analyze all the extension behaviors of the enterprise [43]. It is found that, at present, the relevant research on enterprise niche is generally from the perspective of only macro-niche or micro-niche, and the research content only involves one or two of niche value, niche breadth, niche fitness, and niche overlap. However, since there may be different insights from the perspectives of macro-niche and micro-niche, single niche evaluation can cause the one-side conclusion of the enterprise performance. Therefore, this paper instead considers both macro and micro perspectives and includes four parts of content: niche value, niche breadth, niche fitness and niche overlap, as shown in Table 1.

Table 1.
Research perspective and content of enterprise niche measurement.
We believe that niche theory is very suitable for the evaluation of social commerce for the following reasons: Firstly, the digital service platform connects many stakeholders and thus is a complex ecosystem [50], and social commerce is a digital platform with service as the core to reflect social value. Secondly, there are sub-industries with significant differences in business models in the social commerce industry and these enterprise groups conform to the concept of population in ecology [51]. In addition, future research trends in the field of value co-creation mainly include the construction of business ecosystem framework and the enterprise niche [52]. As the core research field of value co-creation, social commerce is fully applicable to the prediction. Furthermore, some previous scholars have studied the enterprise niche of e-commerce platform [37]. Therefore, it is appropriate to construct the social commerce ecosystem and evaluate the enterprise niche. At the same time, we put forward the following two research questions:
- How is the competitive performance of enterprise roles (macro-niche) and their leading enterprises (micro-niche) in the social commerce ecosystem?
- What is the difference between macro-niche and micro-niche of social commerce enterprises? Could the combination of macro-niche and micro-niche evaluation be better than the single niche evaluation?
Through the combination of macro-niche and micro-niche, we expect to discover some interesting “contradictory phenomena”, and try to explore the industry essence that has not been paid attention to.
The main contributions of this paper are that we put forward the concept of social commerce ecosystem, propose a model composed of macro-niche and micro-niche to comprehensively evaluate the social commerce ecosystem, and present the comparison between our model and the single niche evaluation. The results show that the social sharing e-commerce sub-industry is a monopoly market while the social retail e-commerce sub-industry tends to be a perfectly competitive market. Compared with using the single niche evaluation, our model shows a more comprehensive insight into enterprise competitiveness, which provides a better niche evaluation for other industries.
The rest of this paper is organized as follows: Section 2 provides the research framework of this paper and the construction of the macro and micro index system of social commerce. Section 3 describes data acquisition and processing of social commerce enterprises in China, as well as the niche evaluation methods used in this paper. The results and analysis are shown in Section 4. The conclusions and management implications are presented in Section 5.
2. Construction of Index System for Evaluating the Ecological Niche of Social Commerce
2.1. Research Framework
The research framework of the study is shown in Figure 1.
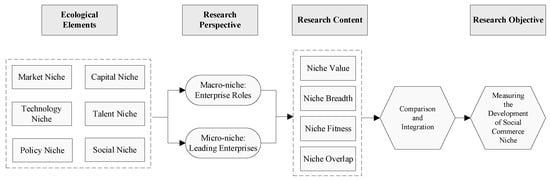
Figure 1.
Research framework.
We respectively take the enterprise roles and the leading enterprises as the research objects, and construct the macro-niche and micro-niche evaluation models to analyze the performance of different sub-industries and leading enterprises. Furthermore, the macro-niche and micro-niche are integrated to evaluate the development of social commerce ecosystem comprehensively.
2.2. Design of Macro-Niche Evaluation System
According to niche theory and ecosystem view, the social commerce ecosystem is defined as a dynamic balance system with service as the core, reflecting the value transferring of socialization. It contains all participants’ interaction in the external environment, including social commerce enterprise groups, businesses, and consumers [3]. The social commerce enterprise groups consist of four main participants: social retail e-commerce (SRE), social sharing e-commerce (SSE), social content e-commerce (SCE), and social e-commerce service provider (SESP) [53]. These participants jointly promote the rapid development of the social commerce industry. According to previous research [38], we consider the macro-niche of social commerce enterprises composed of five niche elements: capital, talent, market, technology and policy, as shown in Figure 2.
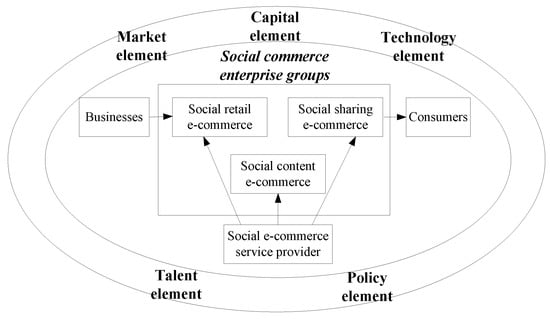
Figure 2.
Social commerce ecosystem.
Based on the principles of scientific credibility, concise representation, feasibility and usability, and combined with the previous research [38,39], niche evaluation indexes from five aspects are selected to investigate the niche performance of social commerce enterprises with different roles. The evaluation index of social commerce macro-niche is shown in Table 2.
Table 2.
Evaluation index of social commerce macro-niche.
2.3. Design of Micro-Niche Evaluation System
Based on the above evaluation index of social commerce’s macro-niche, we consider the social attribute of social commerce users and add the social niche. Social niche represents the level of interaction between social commerce enterprises and users. Due to the high propagation brought by the social network, the social commerce’s growth of user scale and transaction scale is more significant, compared with other industries. Therefore, this paper selects user scale, annual growth of users and annual increase in transaction scale to reflect the social niche status of social commerce enterprises. Furthermore, enhancing the richness of the secondary index, the micro-niche evaluation model of social commerce leading enterprises is constructed, as shown in Table 3.
Table 3.
Evaluation index of social commerce micro-niche.
3. Materials and Methods
With the rapid development of social e-commerce in China, it has begun to take shape. There are well-developed leading enterprises in each sub-industry, which meet the data requirements of macro-niche and micro-niche. Therefore, this paper selects China’s social commerce enterprises as examples, expecting to evaluate the entire social commerce ecosystem through our model.
3.1. Data Preparation
3.1.1. Data Acquisition of Social Commerce Enterprise Roles
In order to evaluate the current situation of social commerce ecosystem, this paper classifies social commerce enterprises by the project descriptions in Tianyancha database. This database is a business query platform under the National Development Fund of China for small and medium-sized enterprises. It contains more than 180 million social entities with more than 90 dimensions of real-time information. Specifically, 1026 social commerce enterprises are selected from this database, filtered by keywords of “social commerce”, “social e-commerce” and “community e-commerce” (excluding cancellation and revocation). These enterprises are classified into corresponding roles by the structured content analysis method [54,55]:
Firstly, one coder put labels for each enterprise according to its brand description from Tianyancha database, such as social sharing e-commerce corresponds to the following description: group buying, shopping guide, rebate, or coupon, as shown in Table 4.
Table 4.
An example of a matching process from enterprise introduction to the role.
Inspired by the labels and project descriptions from Tianyancha database, we attempt to describe the enterprise role in social commerce, as shown in Table 5.
Table 5.
Enterprise roles and descriptions in the social commerce ecosystem.
Then, based on these labels, a second evaluator matches each enterprise to its corresponding role. All authors confirm the final code of each enterprise and discuss the differences among them, which will help to eliminate individual bias.
Finally, we identify four types of general enterprise roles, social retail e-commerce (SRE), social sharing e-commerce (SSE), social content e-commerce (SCE) and social e-commerce service providers (SESP). Information of 1026 enterprises is shown in Table 6.
Table 6.
Information of 1026 sample enterprises.
The paid-in capital and number of employees of 1026 social commerce enterprises are from the Chinese National Enterprise Credit Information Publicity System (NECIPS). Their patent counts, software copyright number, work copyright number and website filing information are from the Chinese National Intellectual Property Administration (NIPA). Their financing quota data come from the publicly disclosed news information. The tax rate is formulated according to the Income Tax Law of the People’s Republic of China, with 15% tax rate for high-tech enterprises and 20% for small and micro enterprises. We also use web crawler to collect the corresponding App scores and comments of 1026 social commerce enterprises on the four platforms of Huawei App Market, Apple App Store, Xiaomi App Mall and Tencent App Store. In order to ensure the integrity of the data, the final App score of enterprises is obtained by the weighted average of the four platforms’ data.
3.1.2. Data Acquisition of Social Commerce Leading Enterprises
We select five leading listed enterprises, namely Pinduoduo, Mogu, Yunji, Youzan and Weimob, which are representative enterprises of SSE, SCE, SRE and SESP, respectively. The data sources of App score, patents and copyrights, and tax rate are consistent with those of macro-niche evaluation indexes. The market cap comes from the stock market’s real-time data on 16 July 2020, and the market cap of enterprises listed in Hong Kong’s stock market and the American stock market are converted into RMB market cap. The market share is calculated by the proportion of the annual transaction scale of each enterprise. For example, the scale of China’s social commerce market would exceed 200 billion yuan in 2019 [56]. Pinduoduo’s 2019 annual report shows that its annual transaction scale is 1006.6 billion yuan, so its market share is 50.33%. The data of the user scale, the annual growth of users and the annual increase in transaction scale come from the news information disclosed by enterprises. The indexes of capital niche, the number of employees and the research output-input ratio can be calculated from the 2019 annual report of each enterprise. For example, the research output-input ratio is calculated by the proportion of R&D expenses to operating revenue.
3.2. Methods
3.2.1. Index Weight
According to the Catastrophe Progression Method, to evaluate the upper indexes, the lower indexes should be first sorted by their importance from large to small [37]. To avoid the subjective ranking, we use the Entropy Method to calculate weights for each index, representing their contribution to upper indexes. The specific calculation method is as follows:
- Step 1: To ensure the unity of index units, we first normalize the original data:where is the original value of the th evaluation object under the th index, is the normalized value of the th evaluation object under the th index.
- Step 2: Calculate the index weight of the th evaluation object under the th index as:where the entropy value of th index is calculated as:
- Step 3: Calculate the utility value , the weight of th index is:according to the principle of entropy additivity, the upper index’s weight value in the multi-level structure evaluation index system can be expressed by the sum of the lower index weights.
3.2.2. Niche Value
The normalization formula of the standard catastrophe system model is expressed as where is the niche value of upper index M, and represents its corresponding lower niche value sorted by entropy weights. is the number of lower indexes, which is an integer greater than 0.
3.2.3. Niche Breadth
Social commerce’s niche breadth refers to the sum of various resources used by the evaluation object of social commerce enterprises for survival and development. This can be used to measure its diversity of resource utilization, which reflects its potential ability to adapt to the environment and utilize resources. The wider the niche breadth of social commerce, the higher its characterization [47], representing the stronger competitiveness. We use the Shannon-Wiener Exponential Formula [57] proposed by Levin to measure social commerce’s niche breadth as:
where represents the social commerce’s niche breadth of evaluation object , is the number of evaluation indexes, and represents the proportion of th resource used by evaluation object in its total resources.
3.2.4. Niche Fitness
Social commerce’s niche fitness refers to the similarity between the real niche of social commerce and the optimal niche. According to the above social commerce evaluation index system, we construct the measurement model of social commerce’s niche fitness as:
where represents the niche fitness value of the th evaluation object, and it fluctuates between the interval [0,1]. The larger the value, the more suitable the niche development of the evaluation object is. is the weight of each ecological factor, is the real niche of each evaluation object, is the optimal niche of each evaluation object, and is the model parameter.
- Measurement of the most suitable value . With reference to Zhu’s assumption, this paper proposes that the social commerce ecological factors follow the normal distribution approximately and the optimal value can be calculated by the sum of the mean and the standard deviation [45]. Set , , where is the mean, and is the standard deviation, . Then is the optimal value of the ecological factor .
- Measurement of model parameter . We refer to Li’s method of measuring parameter [58]. Set (), the maximum value, minimum value, and mean value of are respectively . If and = 0.5, then .
3.2.5. Niche Overlap
The niche overlap model of social commerce is constructed to analyze the similarity of ecological resources that evaluation objects rely on. The higher the degree of niche overlap, the higher the degree of sharing the same ecological resources, the more intense the competition. In this paper, we use the Pianka Model [59] to measure social commerce’s niche overlap and use the normalized data matrix () when calculating the niche breadth, then:
where is the niche overlap value of evaluation object and evaluation object , and the value range is [0,1]. represents the proportion of the th resource used by evaluation object in its total resource utilization, represents the proportion of the th resource used by evaluation object in its total resource utilization.
4. Results and Discussion
4.1. Results and Discussion of Macro Dimension Analysis
4.1.1. Niche Value
We sum the secondary index of enterprises in the same role in social commerce to obtain the original data, where each role represents a population. The weights of primary and secondary indexes evaluated by the Entropy Methods are shown in Table 7.
Table 7.
Index weights of macro-niche evaluation system of social commerce.
According to the Catastrophe Progression Method, the four enterprise roles’ niche values are calculated, as shown in Table 8.
Table 8.
Niche value results of social commerce’s macro-niche.
It is found that social retail e-commerce (SRE) occupies the first place in the comparison of the four enterprise roles. Three of the five primary niche indexes occupy the first place, but the market niche performance is poor. In the secondary niche index comparison, its financing quota is lower than that of social sharing e-commerce (SSE) and social e-commerce service providers (SESP). Meanwhile, its App score is lower than that of social sharing e-commerce (SSE) and social content e-commerce (SCE). It can be seen that SRE, as the primary form of social commerce—“socialization of retail e-commerce”, has a low entry threshold and the largest number of enterprises. In the early stage of the development of the social commerce industry, it has occupied a dominant position in all aspects. However, the development of the social commerce industry has entered a new stage. The investment funds are inclined to the SSE, a relatively new social commerce model. The industry has begun to realize the importance of SESP’s innovation and development. Simultaneously, the consumer agglomeration phenomenon of SRE is significant, and consumers have a low evaluation of the uneven application.
In the comparison of the primary niche index of SSE, the market niche ranks first. Its capital niche and technology niche also have good performance, second only to SRE, while the policy niche performs poorly and ranks the last. When comparing the secondary niche index, the niche performance of financing quota and App score is the best. Except for the poor performance of software copyright and tax rate, the other indexes perform well on the whole, which is consistent with the second ranking in the total niche comparison. SSE led by “Pinduoduo” has developed rapidly in recent years. Although it cannot compete with SRE in the number of enterprises, its leading effect is significant, which drives the rapid development of the SSE sub-industry.
Although SCE is not dominant in total niche comparison, its policy niche and market niche perform well, especially the niche of the tax rate, which is the best among all roles, showing the greatest policy support. The values of the capital niche and talent niche are the lowest, and there is a large space for improvement.
SESP ranks second or third in comparing the five primary indexes except for market niche, which is consistent with its total niche performance. The secondary index does not perform well in terms of App score and patent counts, ranking the last. The reason is that SESP, as a supporting role in the social commerce industry, mainly focuses on enterprise services, and its technical basis is mostly from the e-commerce and communication industry. The development space of patent innovation combined with the characteristics of social commerce is vast.
4.1.2. Niche Breadth
We calculate the proportion of the th resource used by each enterprise role in its total resource utilization . The niche breadth of four enterprise roles in social commerce can be calculated by substituting it into the Formula (6), as shown in Table 9.
Table 9.
Niche breadth, niche fitness and niche overlap of social commerce’s macro-niche.
Niche breadth values of the four enterprise roles in social commerce are more significant than 1, indicating that each role has a good performance in resource utilization. The niche breadth value of SRE is greater than 2, ranking the first, while SSE and SESP are ranked second and third with a slight gap. SCE is at the bottom of the list. The ranking and numerical differences of niche breadth of the above social commerce enterprise roles are consistent with their niche values.
4.1.3. Niche Fitness
The normalized evaluation index data is substituted into Formula (7) to calculate model parameter and optimum value . Combined with the index weight which is calculated previously, the social commerce’s niche fitness is measured, as shown in Table 9. The four enterprise roles are sorted. In this paper, we refer to Zhu [45] to set five levels of fitness: when , unfitness; when , low fitness; when , fitness; when , moderate fitness; when , high fitness.
This paper finds that social commerce’s macro-niche fitness is relatively high, and there are no unfitness and low fitness. Except for the niche fitness of SSE, the other three enterprise roles’ niche fitness is moderate. The lower fitness of SSE may be due to the unbalanced resource allocation caused by the rapid development of the shopping e-commerce platform led by Pinduoduo in a short period. In general, social commerce’s macro-niche meets the needs of social commerce development. Its resource allocation is relatively reasonable, but there is still room for progress.
4.1.4. Niche Overlap
The proportion of the th resource used by each enterprise role in its total resource utilization is substituted into Formula (8) to calculate the niche overlap, as shown in Table 9. It is found that the changing range of the four enterprise roles’ niche overlap in social commerce is [0.2990, 0.6629], and the proportion of low, medium and high competition is 1:3:2. In general, there is moderate competition in the niche overlap of enterprise roles. That is, the similarity degree of enterprise roles in resource utilization is moderate, and the degree of competition is moderate. The reason is that there is a big difference in the business model among four enterprise roles. The reason for the high niche overlap between SESP and SCE providers is that some service providers undertake the function of guiding to the platform. To a certain extent, they have some business overlapping with the guiding-flow SCE. The niche overlap of SRE and SESP is moderate, which is since most of the two enterprise roles are transformed from traditional retail platforms or e-commerce service providers and their essential resources are similar.
4.1.5. Macro-Niche Analysis
Based on the niche breadth and niche fitness of each enterprise role, we find that social retail e-commerce (SRE) and social sharing e-commerce (SSE) have strong survivability and weak resource allocation ability, while social e-commerce service providers (SESP) and social content e-commerce (SCE) have weak survivability and strong resource allocation ability. We refer to this as the inversion phenomenon of survivability and resource allocation ability in the social commerce industry.
4.2. Results and Discussion of Micro Dimension Analysis
4.2.1. Niche Value
In this paper, the Entropy method is used to calculate the weight of each evaluation index of micro-niche, as shown in Table 10.
Table 10.
Index weights of micro-niche evaluation system of social commerce.
According to the Catastrophe Progression Method above, the niche values of evaluation indexes of the five leading enterprises are calculated, as shown in Table 11.
Table 11.
Niche value results of social commerce’s micro-niche.
Among them, Pinduoduo occupies the first place in the total niche comparison of five social commerce enterprises, which is far higher than the other four. In the comparison of the primary indexes, the market niche, social niche, talent niche and policy niche of Pinduoduo rank first, while the capital niche and technical niche are not dominant. Its capital niche lags behind Mogu and Weimob, and its technical niche is lower than that of Mogu. From the view of secondary evaluation indexes, the App score and asset-liability ratio rank the last, and the profit growth ranks the fourth. The reason is that the low-quality and low-price product gathering in Pinduoduo platform inevitably leads to the problem of word-of-mouth differentiation, which makes its App score low. Its product gathering characteristic limits the space of Pinduoduo’s profit growth.
Compared with the five social commerce enterprises, Mogu ranks fourth in the total niche. Among all its primary niches, the market niche, social niche and talent niche rank the last. In contrast, the policy niche, capital niche and technology niche rank first. From all indexes of Mogu, we find that its niche value is either the largest or the smallest. It shows the polarization problem and the uneven development of Mogu in the social commerce ecosystem. In the future, without damaging the dominant niches, efforts should be made to make up for the inferior niche, such as absorbing outstanding talents and strengthening the social interaction with users.
The total niche of Yunji ranks the last, and its social niche ranks the second while its other primary indexes are basically the last but one. The annual growth of users is the largest, while the other secondary indexes are almost the second last.
Youzan’s performance of policy niche and capital niche is deficient in the primary index comparison, ranking the last. It is worth mentioning that Youzan has the most extensive research output-input ratio. It can be seen that despite the lack of funds in Youzan, it attaches great importance to R&D.
Weimob ranks first or second in most primary indexes, which is consistent with its total niche performance of the second ranking. However, the performance of the social niche is poor, ranking the fourth, and the secondary index of user scale is even the last. Besides, among the secondary indexes, the research output-input ratio is the lowest. It can be seen that Weimob has advantages in most resources, but it still needs to strengthen user interaction and increase R&D investment.
4.2.2. Niche Breadth
According to the above niche breadth model of social commerce, the niche breadth of five leading enterprises is calculated, as shown in Table 12.
Table 12.
Niche breadth, niche fitness and niche overlap of social commerce’s micro-niche.
From Table 12, the niche breadth of the five leading enterprises of social commerce is about 2, which indicates that they all have nice performance in resource utilization. Specifically, the niche breadth of Pinduoduo is 2.3976, ranking first. It is followed by Weimob, 2.2 and Mogu, 2.081; Youzan and Yunji are lower than the first three, which are 1.9298 and 1.8368 respectively. The ranking and numerical differences of niche breadth of the above five leading enterprises in social commerce are consistent with their total niche values.
4.2.3. Niche Fitness
The niche fitness of five listed leading enterprises is measured according to Formula (7) and are ranked, as shown in Table 12. Under the five levels of fitness, the niche fitness of Yunji is the highest, reaching moderate fitness; the niche fitness of Mogu is the lowest, which is low fitness; the niche fitness of the other three leading enterprises all belong to fitness. Combined with the above analysis of the niche breadth of leading enterprises, we find that the niche breadth of Yunji is the lowest, while its niche fitness is the highest, which indicates its “small and fit” business model. The niche fitness of Mogu belongs to low fitness, which is related to the severe polarization of various resources, and the low fitness of Mogu is consistent with its low niche breadth.
4.2.4. Niche Overlap
According to the above niche overlap model of social commerce, we can calculate the niche overlap of five listed leading enterprises, as shown in Table 12. The changing range of five leading enterprises’ niche overlap is [0.3169, 0.6881], and the proportion of low, medium and high competition is 0:7:3. In general, the competition among these five leading enterprises is moderate. The reason is that the five leading enterprises of social commerce belong to four different enterprise roles. Moreover, there is no evident homogenization among different enterprise roles’ business model. The reason for the low niche overlap of Youzan and Weimob, which both belong to SESP, is that Weimob mainly relies on WeChat system to provide omni-channel mini programs as e-commerce solutions for businesses. Therefore, Weimob mainly adopts the agent mode for promotion. However, Youzan mainly adopts the free trial and the local promotion mode to attract businesses. These are apparent differences between the two business models.
4.2.5. Micro-Niche Analysis
Based on the niche breadth and fitness of leading enterprises, we can summarize their survivability and resource allocation abilities as follows: Among them, Yunji (SRE) has the weak survivability and the strong resource allocation ability. Pinduoduo (SSE), on the contrary, has strong survivability and the weaker resource allocation ability. The resources relied on by Mogu (SCE) are seriously polarized. Youzan and Weimob (SESP) adopt differentiation strategies, carving up market share “peacefully”.
4.3. Macro and Micro Combination Analysis
This paper makes a comparative study on the macro-niche according to the enterprise roles and the micro-niche represented by leading enterprises. The micro-niche of SESP is computed by averaging the niche values of Youzan and Weimob. The integrated results are shown in Table 13.
Table 13.
Combination of the macro-niche and micro-niche of social commerce.
We can consider the macro-niche value of the sub-industry as its average level to a certain extent and hence show both macro-niche and micro-niche in the same graph as Figure 3.
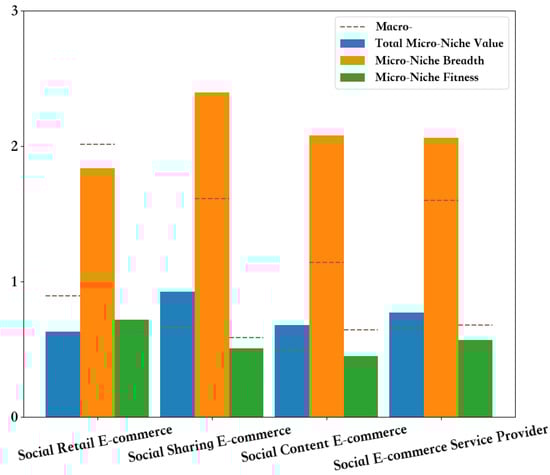
Figure 3.
Visualized comparison between the macro-niche and micro-niche of social commerce.
In Figure 3, the bars with different colors represent the micro-niche index values of corresponding sub-industries, and the dotted lines represent the corresponding macro-niche values. From Table 13 and Figure 3, the niche breadth of SRE is the first, but its niche fitness is low. Surprisingly, Yunji (SRE) ranks the last in niche breadth and ranks first in niche fitness. It is related to the large number of SRE enterprises, indicating fierce competition. Yunji’s rationality of resource allocation is high, but it does not occupy an oligopoly position in the SRE sub-industry. Therefore, we believe that the SRE sub-industry tends to be a perfectly competitive market. Besides, the niche breadth of Pinduoduo (SSE) ranks first, and its competitiveness is far higher than the average industry level and other leading enterprises. However, the niche breadth of SSE still ranks second. It can explain, to a certain extent, that Pinduoduo is dominant in the SSE sub-industry, and the development level of other SSE enterprises is trivial. Therefore, we suggest that SSE sub-industry is a monopoly market. Moreover, the niche fitnesses of Mogu, Youzan and Weimob are lower than those of their average industry levels, so their rationalities of resource allocation need to be strengthened.
The niche overlap of social commerce’s macro-niche is similar to that of micro-niche, which can be seen in that their niche overlap ranges are similar, [0.2990, 0.6629] and [0.3169, 0.6881] respectively. The competitions between most of the evaluation objects are moderate, no matter from macro-niche or micro-niche evaluation.
In this paper, macro-niche and micro-niche with niche value, breadth and fitness are integrated as the comprehensive competitiveness evaluation of each sub-industry in social commerce, as shown in Figure 4.
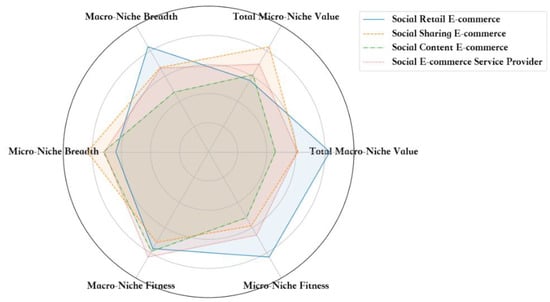
Figure 4.
Comprehensive niche performance of social commerce.
From Figure 4, it is found that the order of the hexagon area is SRE, SSE, SEEP and SCE from large to small. Among them, the last three are mutually included in turn, while SRE and the other three have significant differences in the performance of each dimension. On the whole, we suggest that the competitiveness of SRE and SSE is in the leading position, while the competitiveness of SESP is stronger than that of SCE.
Due to the significant individual differences among the leading enterprises, it is not representative to only use micro-niche to evaluate the competitiveness of the social commerce industry. Therefore, we only compare the results of our model and the single macro-niche evaluation. The radar chart of macro-niche evaluation is shown in Figure 5.
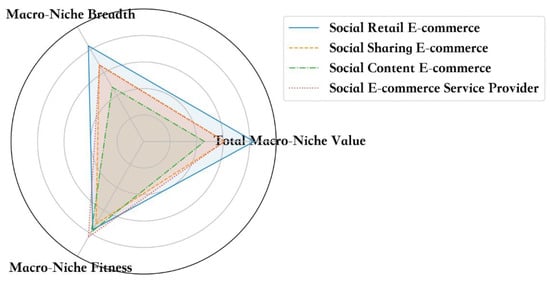
Figure 5.
Macro-niche performance of social commerce.
From Figure 5, we can suggest that SRE is in the leading position, SESP in the second place is slightly superior to SSE, and SCE has the worst performance among them. However, our model further considers the significant influence of leading enterprises. As a result, SSE surpasses SESP in the second place due to the excellent performance of Pinduoduo (SSE). Therefore, we believe that our model can correct the one-sided evaluation from the single niche perspective and provide more information about the competitiveness of the social commerce industry.
5. Conclusions
In this paper, we put forward the concept of social commerce ecosystem and propose a model composed of macro-niche and micro-niche to empirically analyze the performance of different social commerce enterprises in China. Conclusions can be drawn as follows:
- (1)
- The evaluation of social commerce macro-niche shows that the survivability of social retail e-commerce (SRE) and social sharing e-commerce (SSE) is leading, while the resource allocation rationality of social e-commerce service providers (SESP) and social content e-commerce (SCE) is better, which shows an inversion phenomenon.
- (2)
- The evaluation of social commerce micro-niche shows that the Pinduoduo (SSE) has superior survivability, Yunji (SRE) and Mogu (SCE) have balanced and polarized resource allocation respectively, and Youzan and Weimob (SESP) adopt differentiation strategies.
- (3)
- The combination of macro-niche and micro-niche shows that SSE is a monopoly market, while SRE tends to be a perfectly competitive market. This integrated method shows more comprehensive results, which is better than the single niche evaluation method.
Based on these conclusions, aiming at the individual problems of leading enterprises and the common problems of each enterprise role in social commerce, this paper provides the following suggestions:
- (1)
- A single supervision mode is not conducive to the sustainable development of the social commerce industry. Targeted and effective industrial policies should be adopted for different characteristics of social commerce sub-industries. For example, the SSE sub-industry belongs to a monopoly market, and hence, incentive policies should be introduced to vigorously support the development of small and medium-sized enterprises and encourage benign competition of the industry. On the other hand, SRE tends to be a perfectly competitive market and subdivision supervision policies should be adopted to prevent the risk of vicious competition.
- (2)
- In the rapid development of social commerce enterprises, the imbalance of resource allocation is severe. When the enterprise develops to a certain stage, the development focus should be shifted from “speed” to “balance”. For example, the polarized resource allocation of Mogu (SCE) seriously restricts its development sustainability. Therefore, in the future, its attention should be paid to absorbing industry talents and enhancing the interaction between products and users.
- (3)
- Social commerce enterprises should pay special attention to the development of differentiation strategy, so as to reduce the overlap between the enterprise roles and even between the leading enterprises in the same role. For example, Youzan and Weimob, both in the SESP sub-industry, adopt different business models and profit models. Therefore, when seizing the market share, they could avoid the fierce conflict, which is beneficial to the sustainable development of the whole sub-industry.
Although this study has some innovation among studies of the same type, it still has some limitations. For example, due to the short development time of social commerce, research can only be carried out from the static perspective, without considering the change of indexes over time. The second limitation is the lack of data of small and medium-sized enterprises in social commerce, which makes it hard to cover a large number of macro-niche evaluation indexes, especially indexes of social attributes. Besides, this study is based on the China region, which is representative of the development of social commerce, but it can still cause a lack of model universality. The future research will further consider the evolution law of social commerce niche from a dynamic perspective and extend the model to other countries or regions.
Author Contributions
Conceptualization, Y.W. and X.C.; methodology, X.C.; validation, X.C., Y.W. and R.Z.; formal analysis, X.C.; data curation, R.Z.; writing—original draft preparation, X.C.; writing—review and editing, Y.W.; visualization, R.Z. All authors have read and agreed to the published version of the manuscript.
Funding
This research was funded by the National Natural Science Foundation of China (grant number 71071070, 71572058) and the National Social Science Foundation of China (grant number 16BGL190).
Institutional Review Board Statement
Not applicable.
Informed Consent Statement
Not applicable.
Data Availability Statement
Data available on request due to restrictions eg privacy or ethical. The data presented in this study are available on request from the corresponding author. The data are not publicly available as the data also forms part of an ongoing study.
Acknowledgments
Special thanks to the reviewers for their valuable comments.
Conflicts of Interest
The authors declare no conflict of interest.
References
- Pagani, M.; Pardo, C. The impact of digital technology on relationships in a business network. Ind. Mark. Manag. 2017, 67, 185–192. [Google Scholar] [CrossRef]
- Phang, D.C.W.; Wang, K.L.; Wang, Q.H.; Kauffman, R.J.; Naldi, M. How to derive causal insights for digital commerce in China? A research commentary on computational social science methods. Electron. Commer. Res. Appl. 2019, 35, 100837. [Google Scholar] [CrossRef]
- Wu, Y.; Chen, X. A new cognitive framework for understanding social commerce: A service ecosystem perspective. J. Serv. Sci. Manag. 2020, 13, 459–469. [Google Scholar] [CrossRef]
- Ebrun. Social e-Commerce Development Report. 2020. Available online: https://www.ebrun.com/20200907/401052.shtml (accessed on 20 December 2020).
- Busalim, A.H.; Hussin, A.R.C. Understanding social commerce: A systematic literature review and directions for further research. Int. J. Inf. Manag. 2016, 36, 1075–1088. [Google Scholar] [CrossRef]
- Han, H.; Xu, H.Y.; Chen, H.Q. Social commerce: A systematic review and data synthesis. Electron. Commer. Res. Appl. 2018, 30, 38–52. [Google Scholar] [CrossRef]
- Southern Metropolis Daily. Behind the Community Group Buying War, Continuous Mergers and Acquisitions, Bankruptcy and Reorganization. Available online: http://news.southcn.com/nfdsb/content/2020-12/15/content_191843842.htm (accessed on 20 December 2020).
- Sohu News. More Than 500 Companies Have Closed Down in Half a Year, Is the Social Commerce Going to Die? Available online: https://m.sohu.com/a/417906755_121339 (accessed on 20 December 2020).
- Lam, H.K.S.; Yeung, A.C.L.; Lo, C.K.Y.; Cheng, T.C.E. Should firms invest in social commerce? An integrative perspective. Inf. Manag. 2019, 56, 103164. [Google Scholar] [CrossRef]
- Hajli, M. A research framework for social commerce adoption. Inf. Manag. Comput. Secur. 2013, 21, 144–154. [Google Scholar] [CrossRef]
- Zwass, V. Co-creation: Toward a taxonomy and an integrated research perspective. Int. J. Electron. Commer. 2010, 15, 11–48. [Google Scholar] [CrossRef]
- Baghdadi, Y. A framework for social commerce design. Inf. Syst. 2016, 60, 95–113. [Google Scholar] [CrossRef]
- Yu, Y.C.; Pelaez, A.; Lang, K.R. Designing and evaluating business process models: An experimental approach. Inf. Syst. E Bus. Manag. 2016, 14, 767–789. [Google Scholar] [CrossRef]
- McDonald, T.; Dan, L. Pulling the sheep’s wool: The labour of online thrift in a Chinese factory. J. Consum. Cult. 2020, 9. [Google Scholar] [CrossRef]
- Chen, H.H.; Zang, S.W.; Chen, J.; He, W.T.; Chieh, H.C. Looking for meaningful disruptive innovation: Counterattack from Pinduoduo. Asian J. Technol. Innov. 2020, 9. [Google Scholar] [CrossRef]
- Wang, H.; Chen, Y. Analysis of social e-commerce business model based on value network. J. Commer. Econ. 2020, 3, 103–106. [Google Scholar]
- Hajli, N. Social commerce constructs and consumer’s intention to buy. Int. J. Inf. Manag. 2015, 35, 183–191. [Google Scholar] [CrossRef]
- Zhang, H.; Lu, Y.; Gupta, S.; Zhao, L. What motivates customers to participate in social commerce? The impact of technological environments and virtual customer experiences. Inf. Manag. 2014, 51, 1017–1030. [Google Scholar] [CrossRef]
- Sashi, C.M. Customer engagement, buyer-seller relationships, and social media. Manag. Decis. 2012, 50, 253–272. [Google Scholar] [CrossRef]
- Shin, D.H. User experience in social commerce: In friends we trust. Behav. Inf. Technol. 2013, 32, 52–67. [Google Scholar] [CrossRef]
- Aladwani, A.M. A quality-facilitated socialization model of social commerce decisions. Int. J. Inf. Manag. 2018, 40, 1–7. [Google Scholar] [CrossRef]
- Bugshan, H.; Attar, R.W. Social commerce information sharing and their impact on consumers. Technol. Forecast. Soc. Chang. 2020, 153, 119875. [Google Scholar] [CrossRef]
- Kim, J.; Lee, H. VADA: Wi-Fi direct based voluntary advertisement dissemination algorithm for social commerce service. In Proceedings of the IEEE Vehicular Technology Conference, Glasgow, UK, 11–14 May 2015; IEEE Computer Society Press: Washington, DC, USA, 2015; pp. 1–6. [Google Scholar]
- Sang, C.Y.; Liao, S.G. Modeling and simulation of information dissemination model considering user’s awareness behavior in mobile social networks. Phys. A Statal Mech. Appl. 2019, 537, 122639. [Google Scholar] [CrossRef]
- Zhao, N.; Li, H. How can social commerce be boosted? The impact of consumer behaviors on the information dissemination mechanism in a social commerce network. Electron. Commer. Res. 2020, 20, 833–856. [Google Scholar] [CrossRef]
- Zhang, Y. Study on Decision Model of Enterprises in Emerging E-Business Marketing Modes. Ph.D. Thesis, Nanchang University, Nanchang, China, 21 May 2019. [Google Scholar]
- Zhang, W.; Ma, W. Research on the competition strategy of social commerce bilateral market. J. Commer. Econ. 2016, 4, 50–52. [Google Scholar]
- Esmaeili, L.; Golpayegani, A.H. A novel method for discovering process based on the network analysis approach in the context of social commerce systems. J. Theor. Appl. Electron. Commer. Res. 2021, 16, 34–62. [Google Scholar] [CrossRef]
- Grange, C.; Benbasat, I.; Burton-Jones, A. A network-based conceptualization of social commerce and social commerce value. Comput. Hum. Behav. 2020, 108, 105855. [Google Scholar] [CrossRef]
- Reypens, C.; Lievens, A.; Blazevic, V. Leveraging value in multi-stakeholder innovation networks: A process framework for value co-creation and capture. Ind. Mark. Manag. 2016, 56, 40–50. [Google Scholar] [CrossRef]
- Wang, H.; Chen, J.H.; Yao, S.J.; Zhang, Y.Q. The value co-creation analysis framework of service ecosystem stakeholders based on the actor network theory. Soft Sci. 2020, 11. Available online: http://kns.cnki.net/kcms/detail/51.1268.G3.20201215.1731.004.html (accessed on 3 January 2021).
- Zhang, D.N.; Shi, Y.S.; Li, W.W. China’s sharing economy of mobility industry: From perspective of industrial ecosystem. Sustainability 2019, 11, 7130. [Google Scholar] [CrossRef]
- Jiang, S.M.; Hu, Y.M.; Wang, Z.Y. Core firm based view on the mechanism of constructing an enterprise innovation ecosystem: A case study of Haier group. Sustainability 2019, 11, 3108. [Google Scholar] [CrossRef]
- Li, W.J.; Liu, W.; Xu, X.; Gao, Z.J. The port service ecosystem research based on the Lotka-Volterra model. Pol. Marit. Res. 2017, 24, 86–94. [Google Scholar] [CrossRef][Green Version]
- Wang, Q.; Geng, C.X.; Hai-Tao, E. Dynamic coevolution of capital allocation efficiency of new energy vehicle enterprises from financing niche perspective. Math. Probl. Eng. 2019, 2019, 1412950. [Google Scholar] [CrossRef]
- Meng, F.L.; Tian, Z.R.; Chang, B.Q.; Yu, H.X.; Zhang, S. Research on the niche evolution game of ecological community innovation of corporate venture capital based on logistic extended complexity model. Complexity 2020, 2020, 6327218. [Google Scholar] [CrossRef]
- Zhang, Y.J.; Gao, L.M. Research on the niche evaluation of platform enterprises based on value delivery: Taking the e-commerce industry as an example. Manag. Rev. 2019, 31, 116–123. [Google Scholar]
- Zhao, Z.Y.; Ling, W.J.; Zillante, G. An evaluation of Chinese wind turbine manufacturers using the enterprise niche theory. Renew. Sustain. Energy Rev. 2012, 16, 725–734. [Google Scholar] [CrossRef]
- Bian, W.J.; Liu, W.G. Research on measurement methods for ecological niche of regional hi-tech entrepreneurial population. Sci. Sci. Manag. S. T. 2014, 35, 148–157. [Google Scholar]
- Qian, L.X.; Cao, Z.L. Research on port industry development of Guangdong province based on niche theory. Sci. Technol. Manag. Res. 2018, 38, 205–209. [Google Scholar]
- Wang, L.; Wang, Y.; Chen, J. Assessment of the ecological niche of photovoltaic agriculture in China. Sustainability 2019, 11, 2268. [Google Scholar] [CrossRef]
- Hannan, M.; Freeman, J. Structural inertia and organizational change. Am. Sociol. Rev. 1984, 49, 149–164. [Google Scholar] [CrossRef]
- Baum, J.A.C.; Singh, J.V. Organizational niches and the dynamics of organizational founding. Organ. Sci. 1994, 5, 11–26. [Google Scholar] [CrossRef]
- Shi, B.; Tian, H.N. Research on the path selection of green process innovation of home appliances manufacturing based on niche ecostate-ecorole theory. Manag. Rev. 2018, 30, 83–93. [Google Scholar]
- Zhu, F.Y.; Jia, Q.X.; Tan, B.H. Niche suitability measurement model of logistics industry and its dynamic coupling evolution. Sci. Technol. Manag. Res. 2019, 39, 217–224. [Google Scholar]
- Chen, J.; Lin, S. Research on the niche breadth measurement model for tourism enterprises. Agro Food Ind. Hi Tech 2017, 28, 721–724. [Google Scholar]
- Yang, X.Z.; Luo, W.; Tang, Z. Evaluation and evolution of science, technology and innovation competitiveness in the Yangtze river economic belt based on ecological niche. Soft Sci. 2019, 33, 8–14. [Google Scholar]
- Zhao, Z.Y.; Xu, K.; Zuo, J.; Tang, C. Developing the international construction contracting market: Enterprise niche approach. J. Manag. Eng. 2016, 33, 04016027. [Google Scholar] [CrossRef]
- Peng, B.H.; Zheng, C.Y.; Wei, G.; Elahi, E. The cultivation mechanism of green technology innovation in manufacturing industry: From the perspective of ecological niche. J. Clean. Prod. 2020, 252, 119711. [Google Scholar] [CrossRef]
- UNCTAD. Digital Economy Report 2019-Value Creation and Capture: Implications for Developing Countries. Available online: https://unctad.org/webflyer/digital-economy-report-2019 (accessed on 20 December 2020).
- Harrison, L.G. Complexity—Life at the edge of chaos. Science 1993, 259, 387–388. [Google Scholar] [CrossRef]
- Jiang, S.R.; Qiao, H.; Zhang, S.; Liu, Y.; Hu, Y.; Xu, Y.M. The frontiers of value co-creation research: Ecosystem and business model innovation. Manag. Rev. 2020, 32, 3–17. [Google Scholar]
- Ebrun. White Paper on Social Commerce in China. 2019. Available online: http://www.199it.com/archives/950433.html (accessed on 20 December 2020).
- Miles, M.B.; Huberman, A.M. Qualitative Data Analysis: An Expanded Sourcebook; Sage: Newbury Park, CA, USA, 1994; pp. 105–138. [Google Scholar]
- Mayring, P. Qualitative inhaltsanalyse. In Handbuch Qualitative Forschung in der Psychologie; VS Verlag für Sozialwissenschaften: Wiesbaden, Germany, 2010; pp. 601–613. [Google Scholar]
- Internet Society of China. Report on the Development of China’s Social E-Commerce Industry in 2019. Available online: https://www.isc.org.cn/hyjl/zghlwdh/listinfo-36858.html (accessed on 24 November 2020).
- Levins, R. Evolution in Changing Environments: Some Theoretical Explorations; Princeton University Press: Princeton, NJ, USA, 1968; pp. 297–298. [Google Scholar]
- Li, Z.Z.; Li, W.L.; Ma, Z.H.; Yang, Y.H. Model of niche-fitness of crop species and its application to the growth and yield of spring wheat. J. Lanzhou Univ. Nat. Sci. 2010, 46, 45–50. [Google Scholar]
- Pianka, E.R. Niche overlap and diffuse competition. Proc. Natl. Acad. Sci. USA 1974, 71, 2141–2145. [Google Scholar] [CrossRef]


Publisher’s Note: MDPI stays neutral with regard to jurisdictional claims in published maps and institutional affiliations. |
© 2021 by the authors. Licensee MDPI, Basel, Switzerland. This article is an open access article distributed under the terms and conditions of the Creative Commons Attribution (CC BY) license (http://creativecommons.org/licenses/by/4.0/).