Decomposition of Water Footprint of Food Consumption in Typical East Chinese Cities
Abstract
1. Introduction
2. Materials and Methods
2.1. WF Calculation
2.2. LMDI on Food Consumption WFP
3. Study Area and Data Source
3.1. Study Area
3.2. Data Sources
4. Results and Discussions
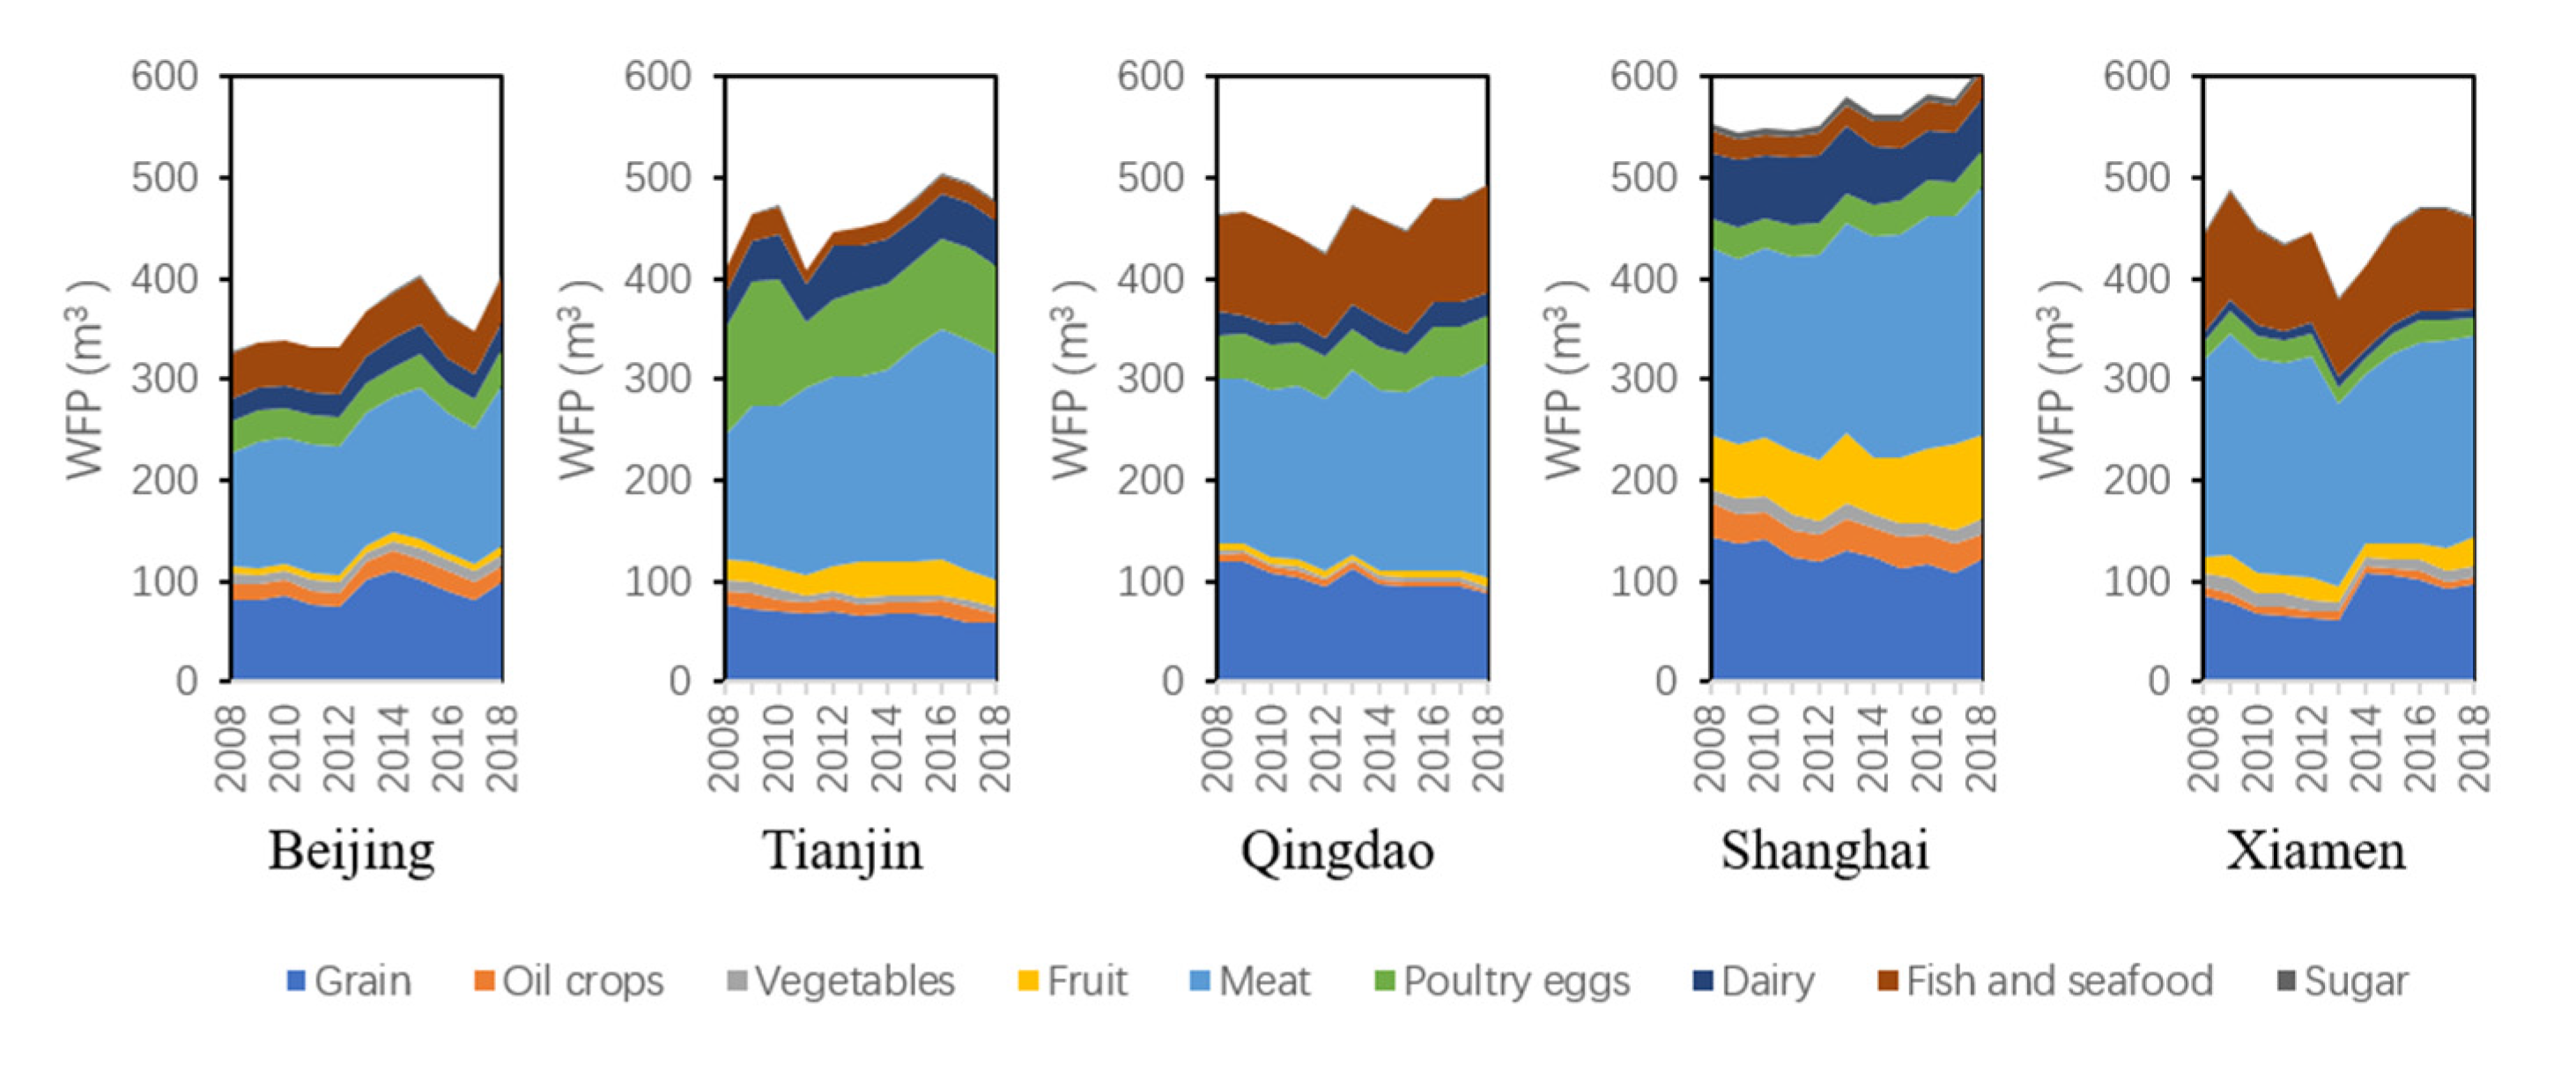
4.1. Food Consumption WFP of the Five Cities
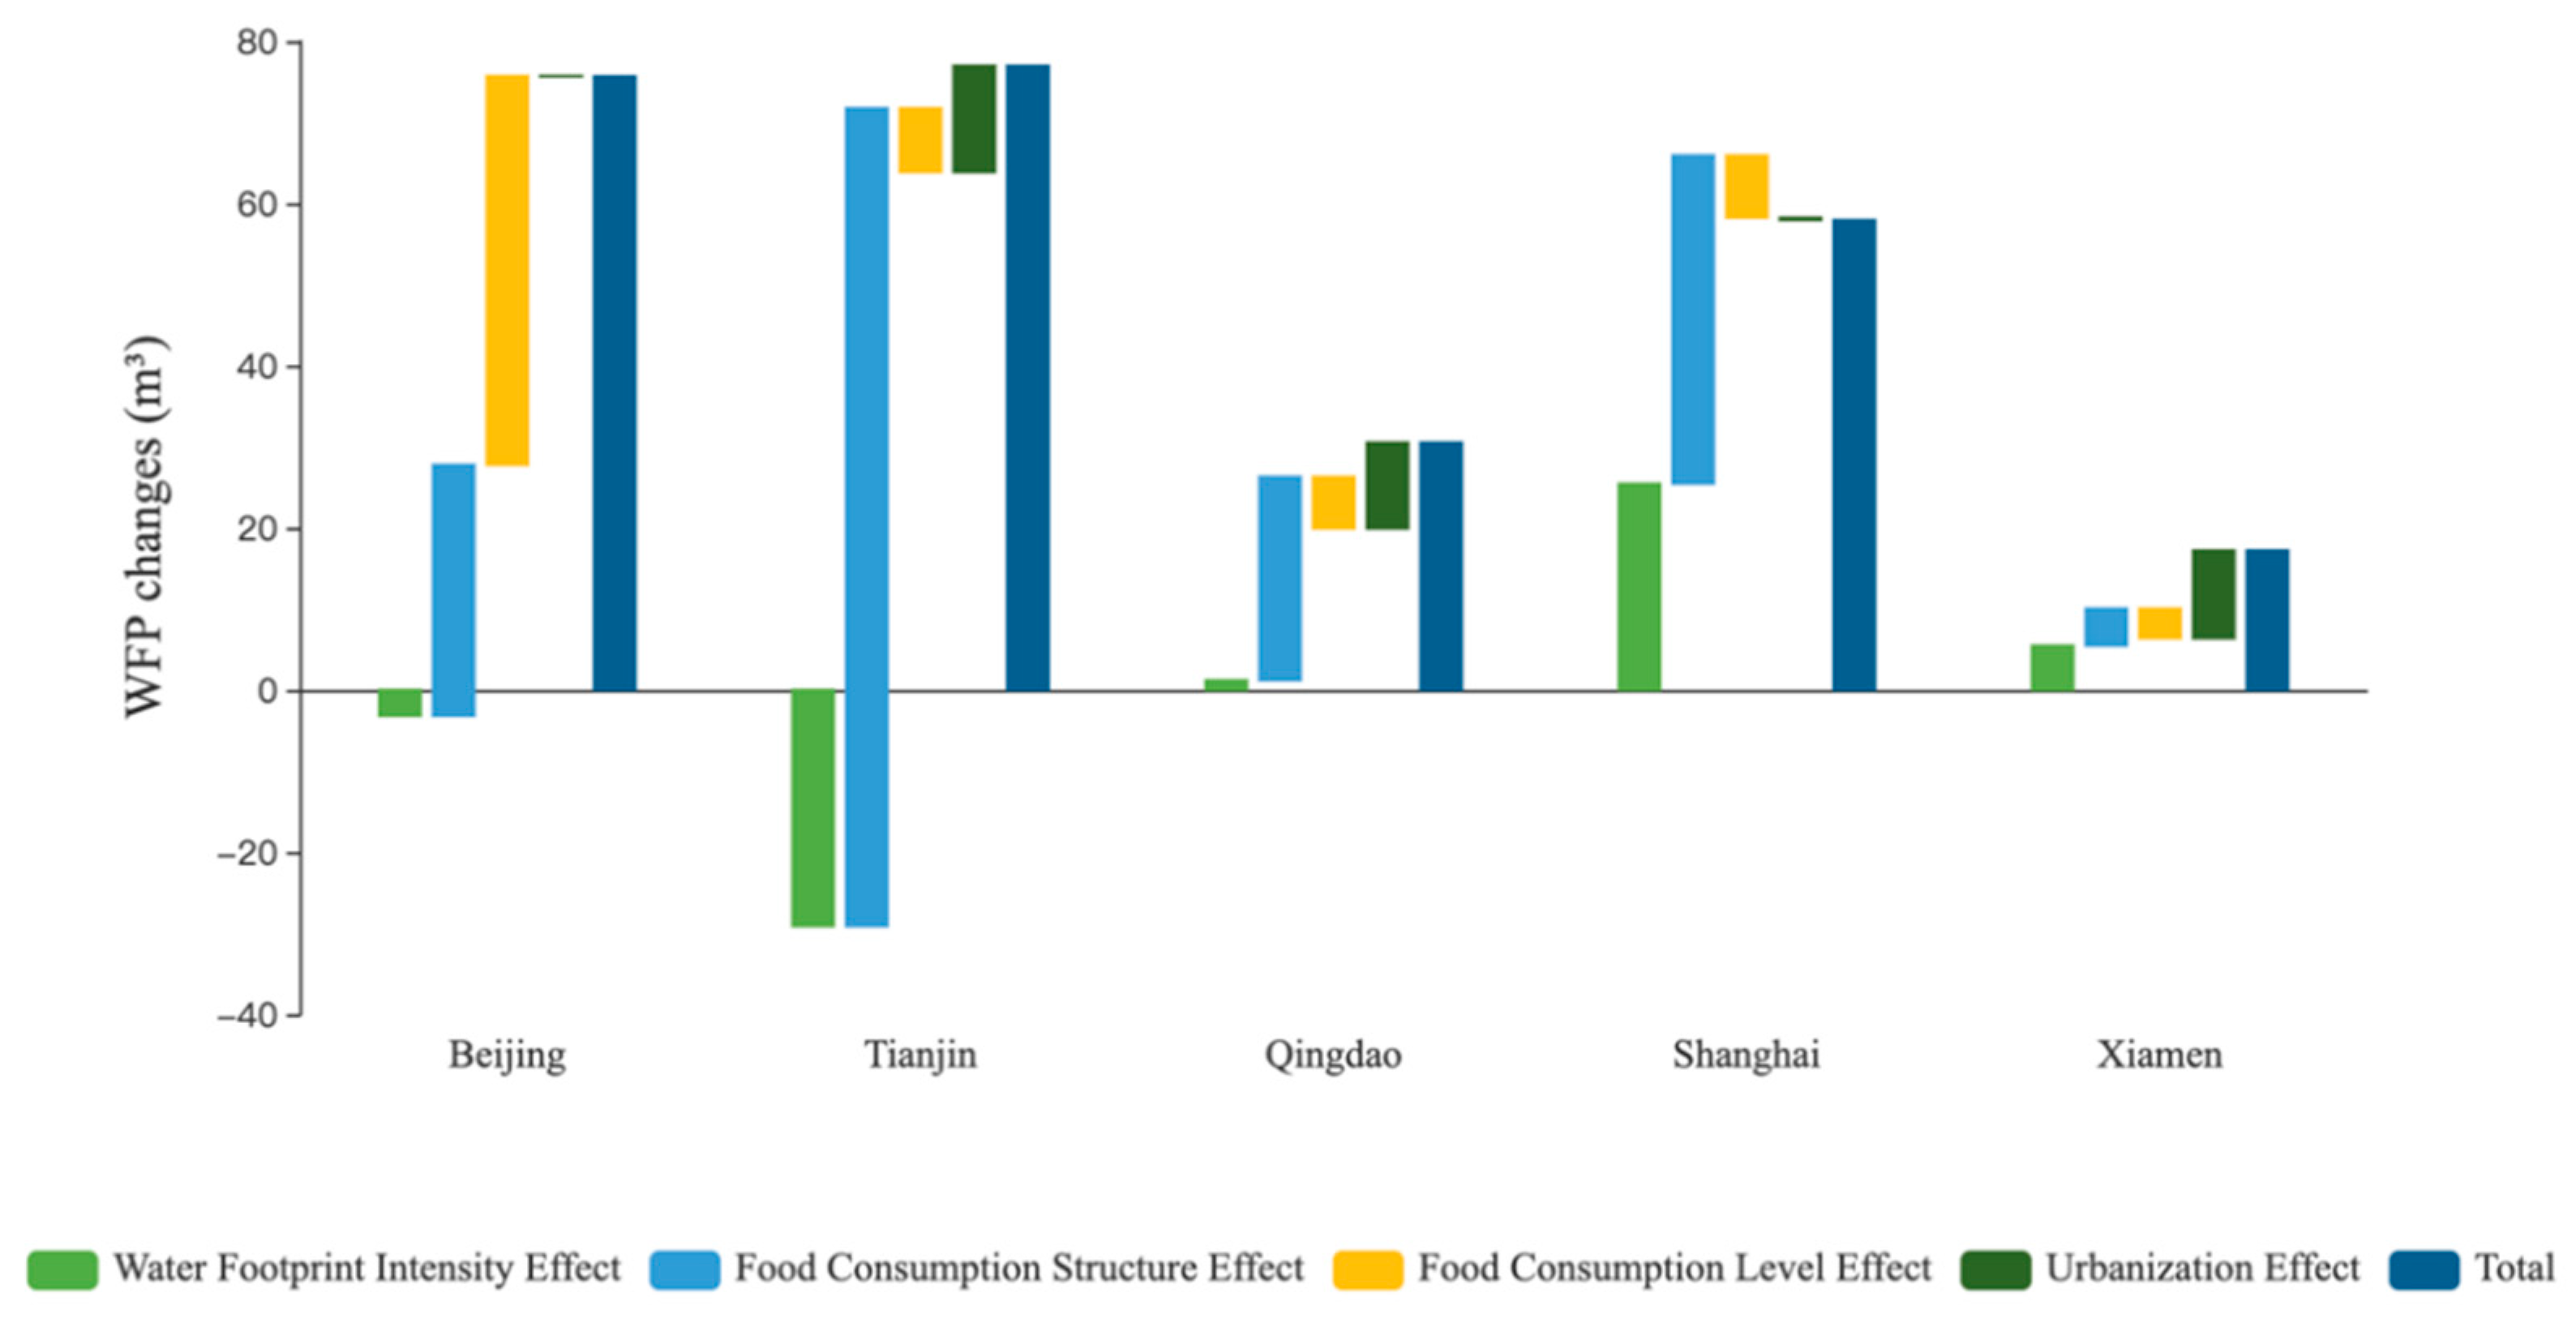
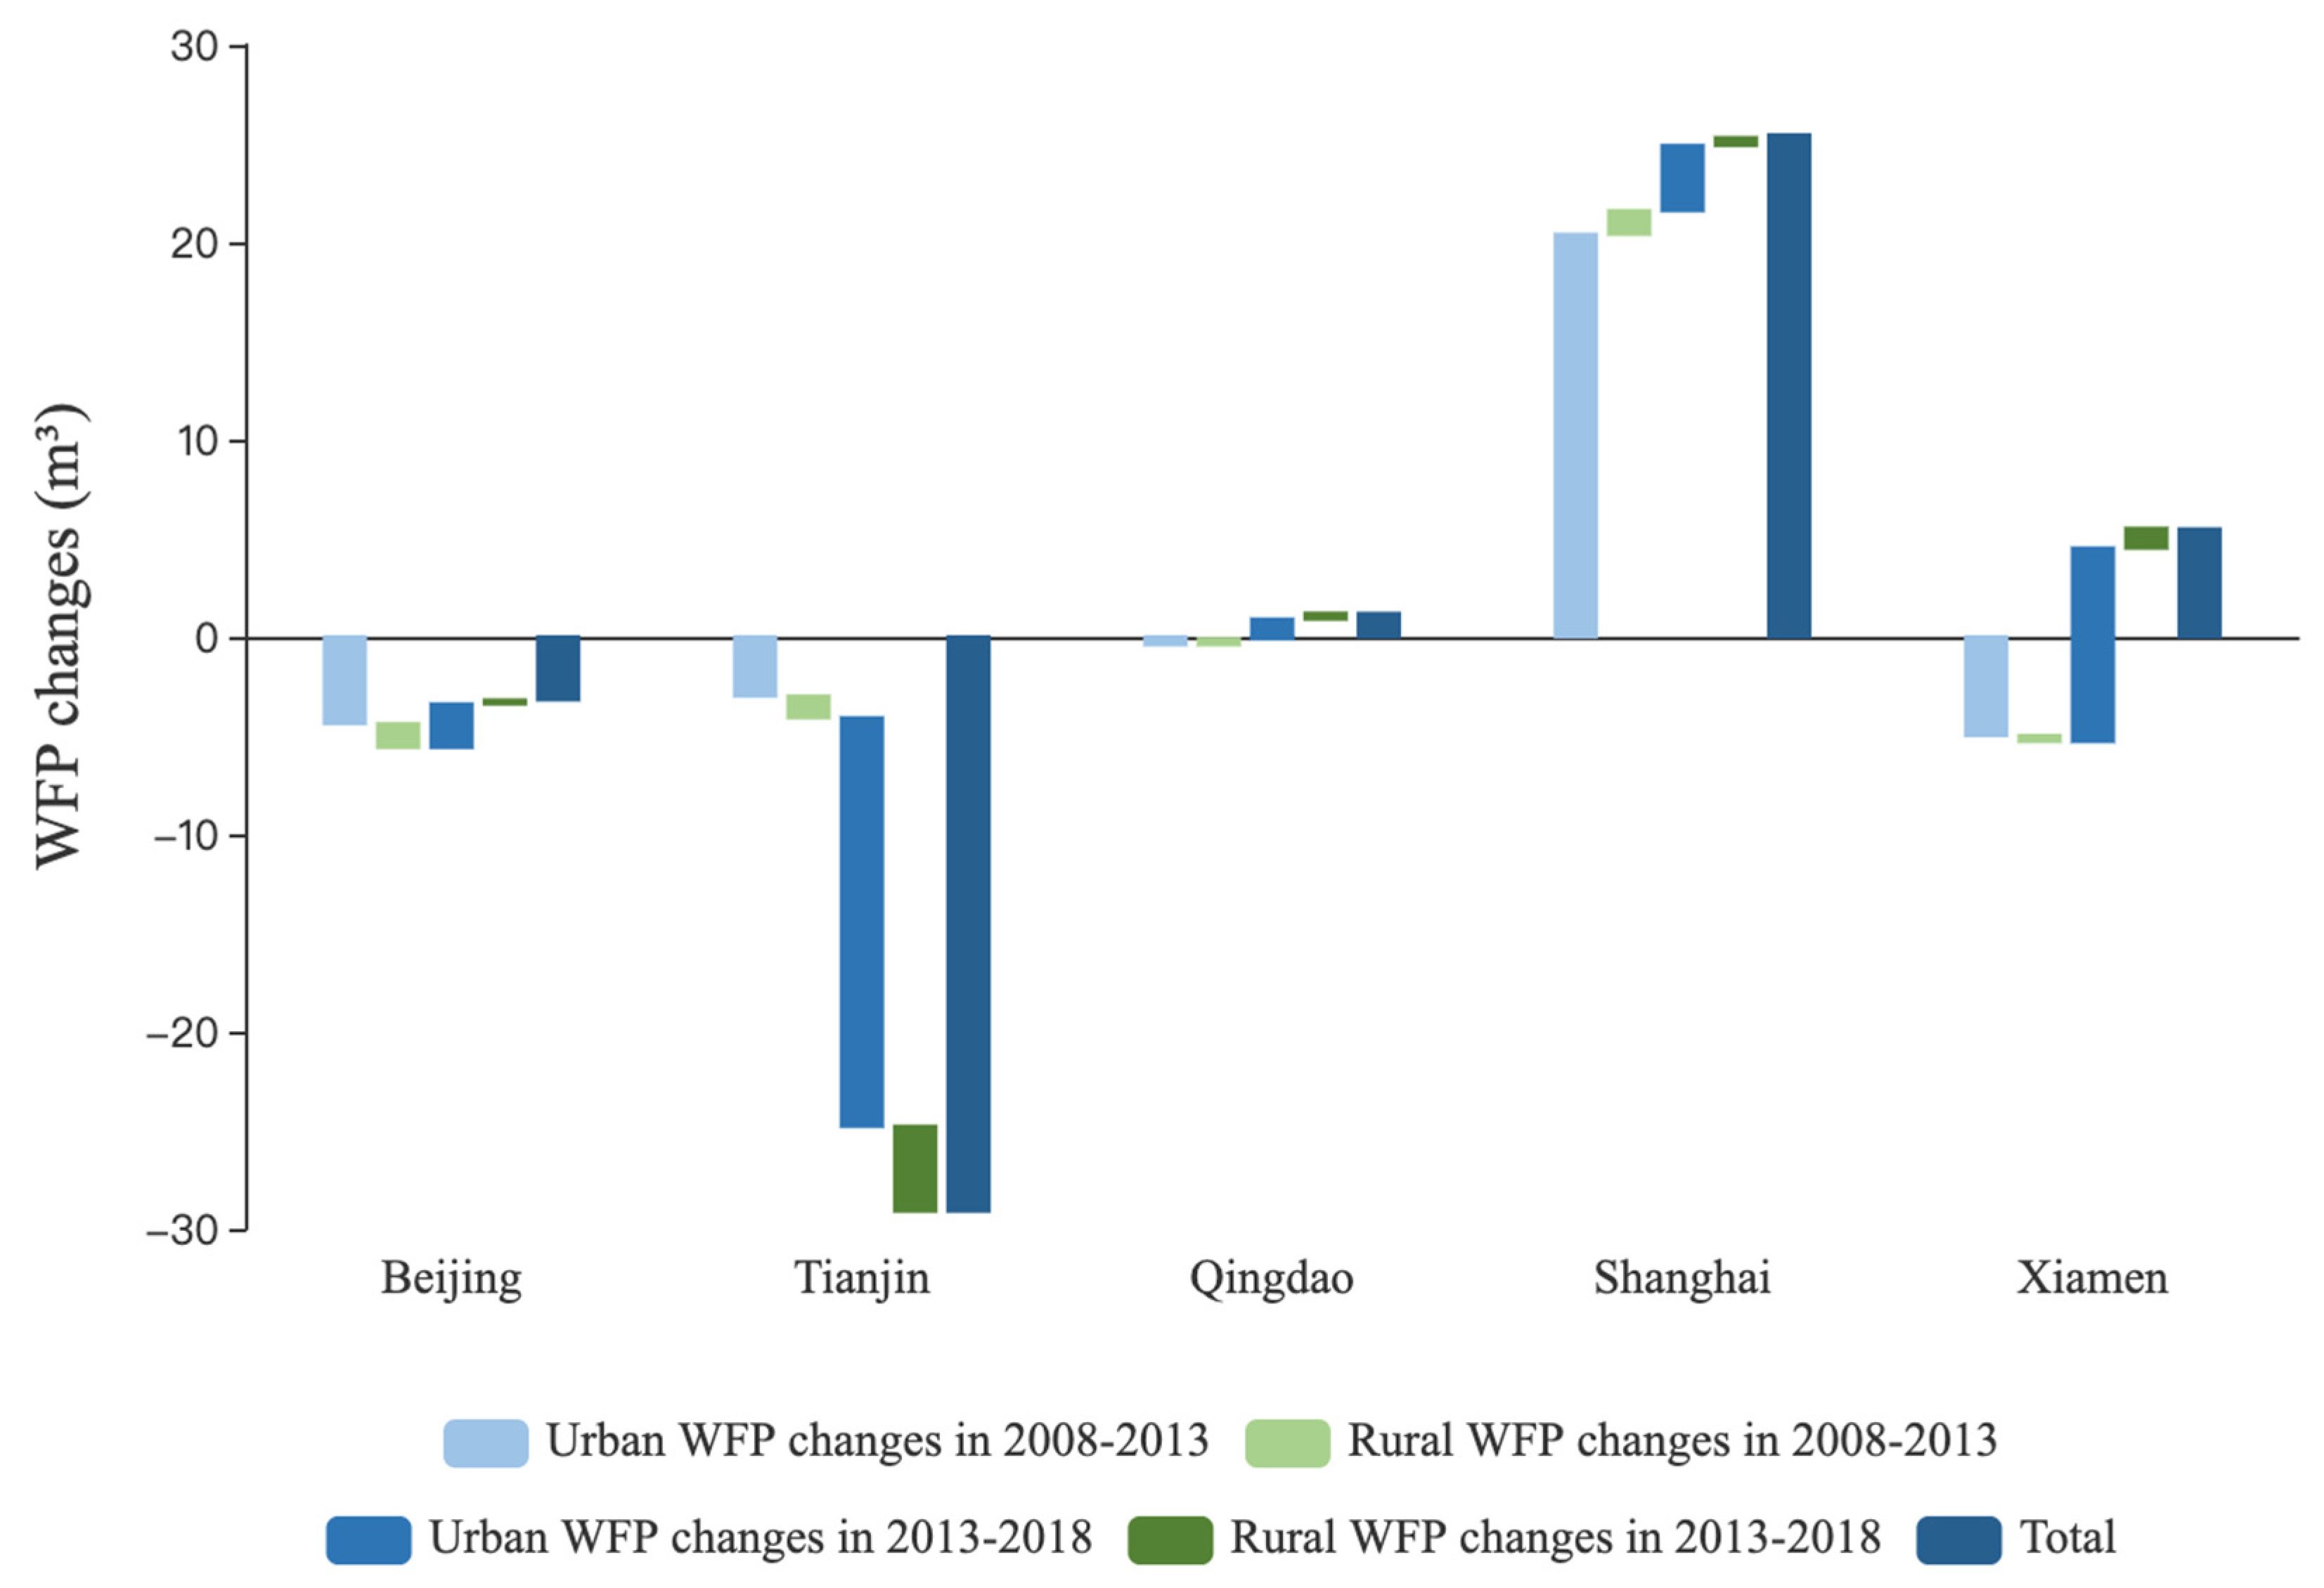
4.2. Decomposition Effect Analysis
4.2.1. WF Intensity Effect
4.2.2. Food Consumption Structure Effect
4.2.3. Food Consumption Level Effect
4.2.4. Urbanization Effect
5. Conclusions
- (1)
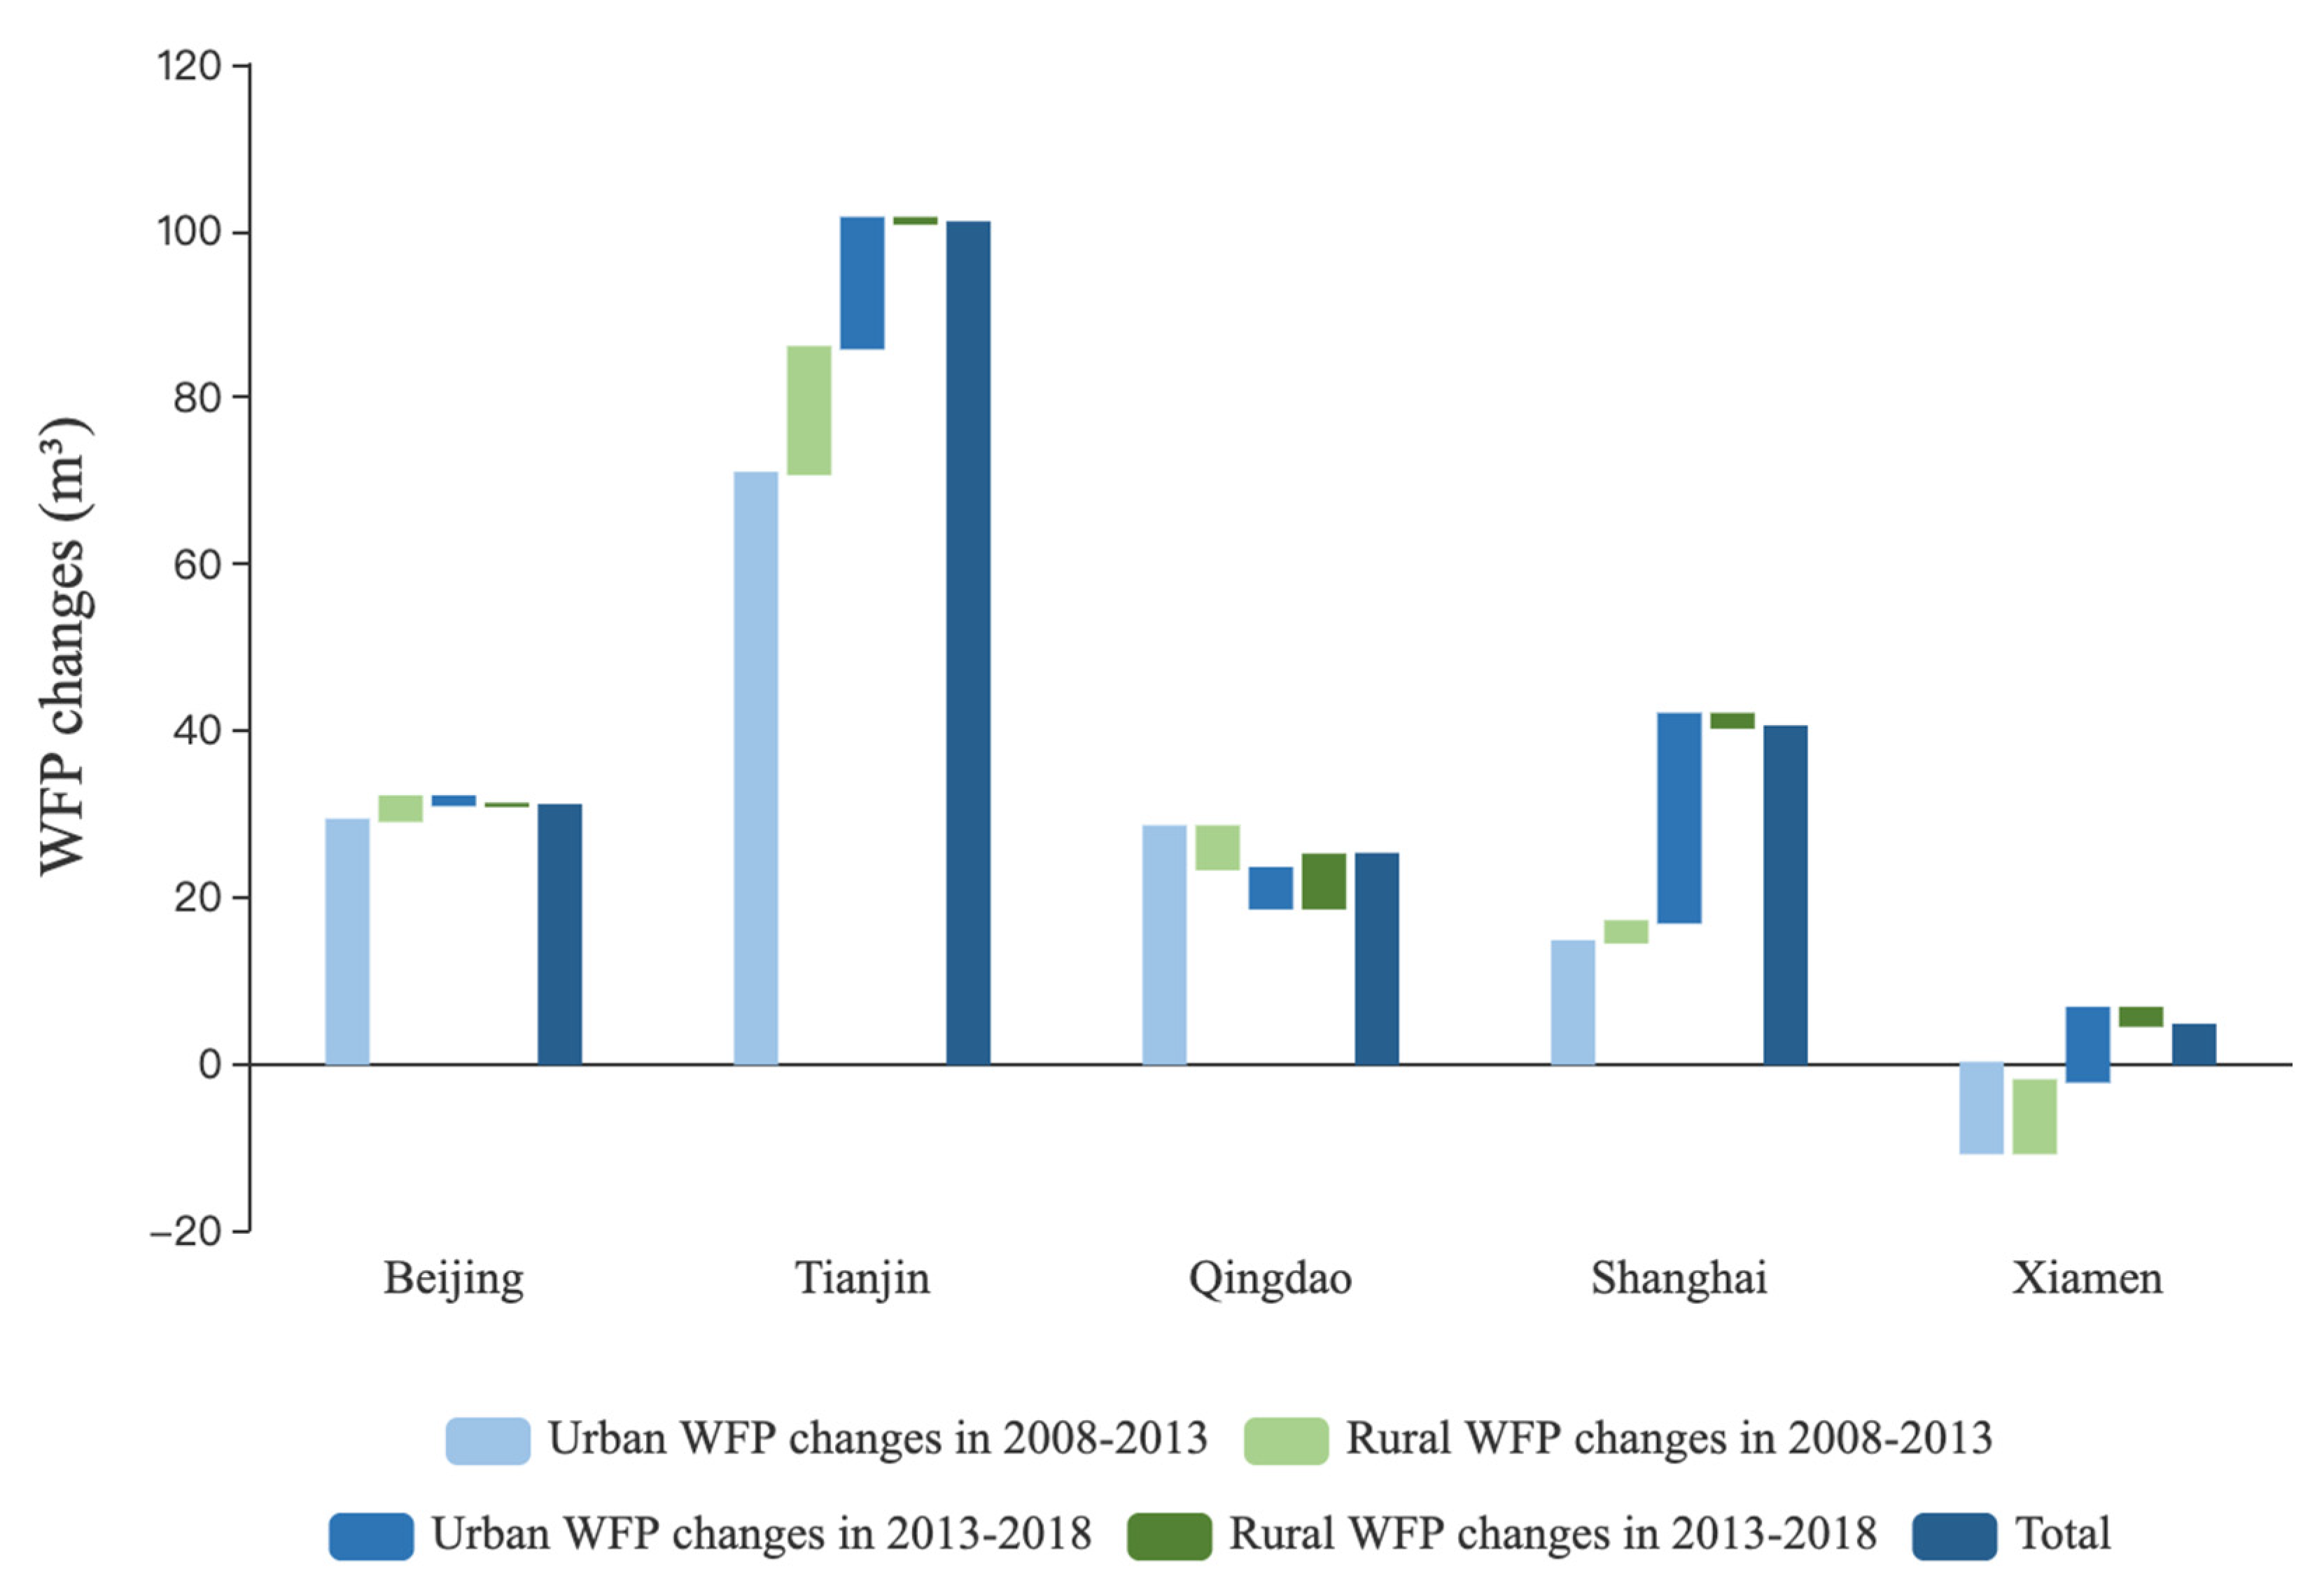
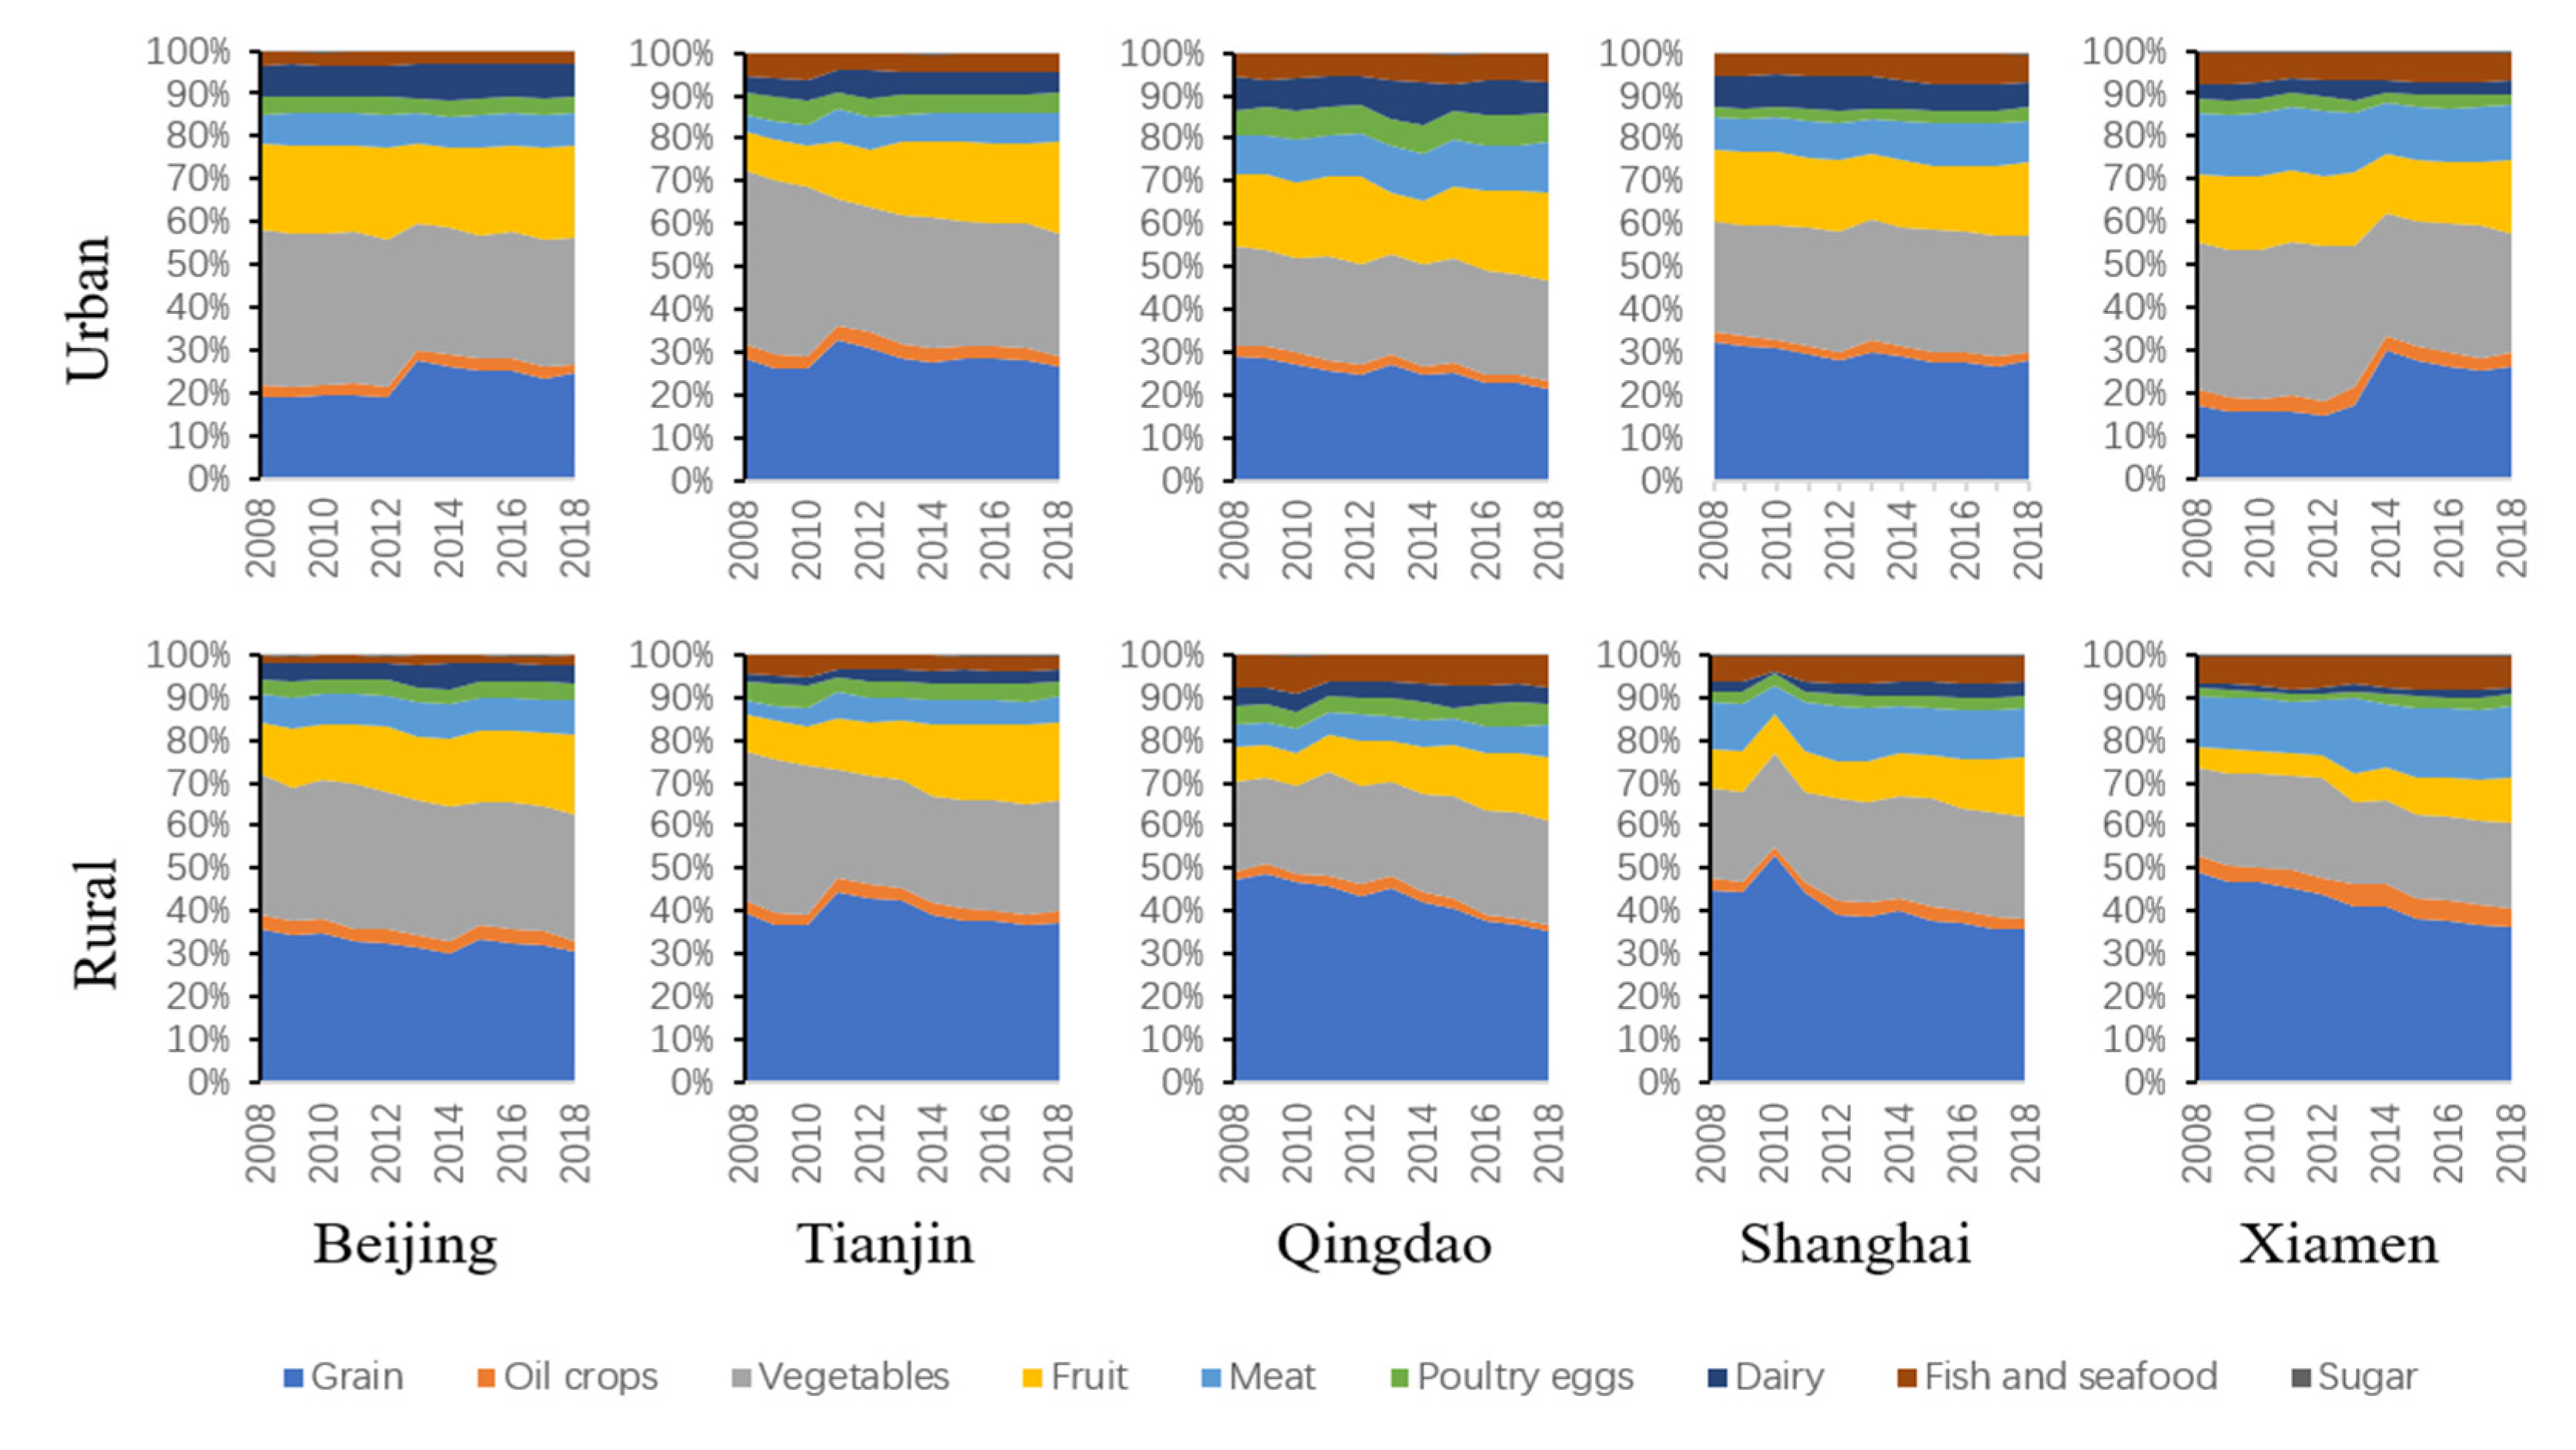
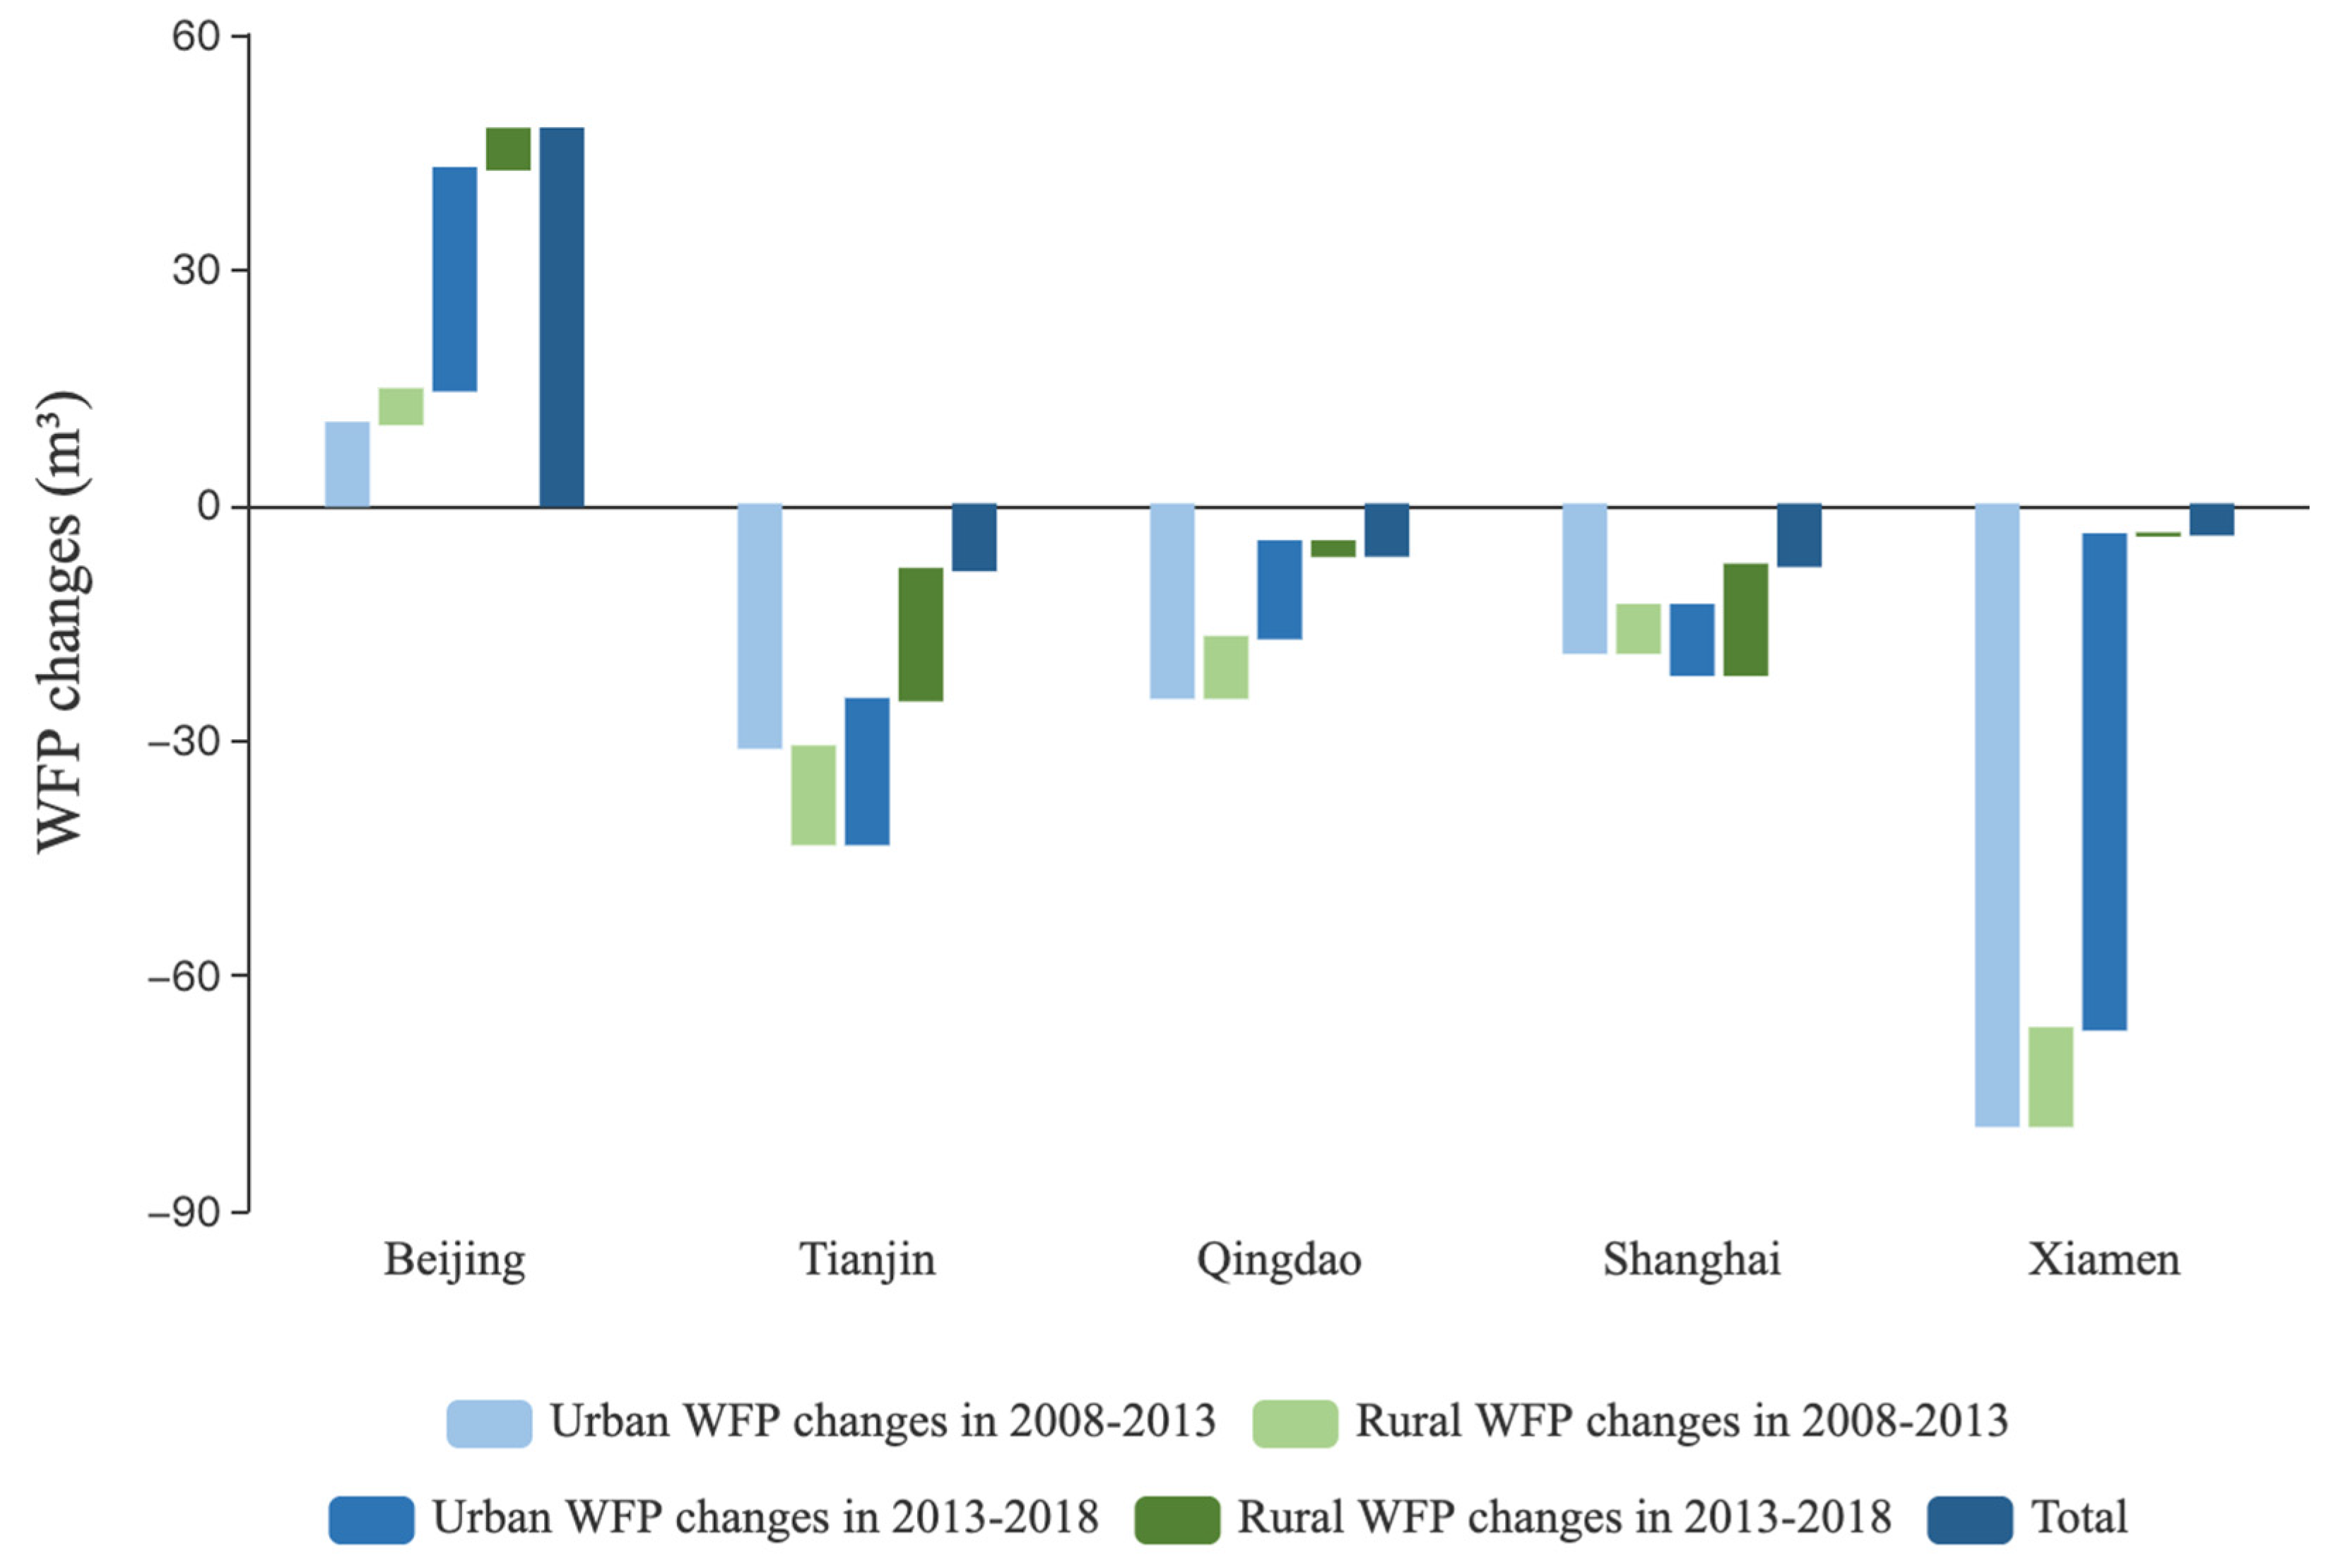
- The WFP related to food consumption showed a rolling upward tendency in the five East China cities. The largest contributor to WFP was meat proportions, which had an upward trend during the research periods, followed by grains, which had a decreasing trend. Decomposition results show that the major driving factor was food consumption level for Beijing and food consumption structure for Beijing Tianjin, Qingdao, and Shanghai. Xiamen was primarily driven positively by the urbanization effect.
- (2)
- Food consumption structure was the primary factor promoting the WFP growth among the five cities. Urban effects were the major contributing driving forces. In most cities, urban and rural residents have dramatically changed their eating habits, especially in the 2008–2013 period. The changed eating habits were mainly reflected by the reduced grain and vegetable consumption proportion and the overall increase in the proportions of meat, poultry eggs, and dairy consumption, especially in rural areas. Improving water resources utilization by guiding a balanced diet could be an efficient way for urban sustainable development.
- (3)
- The food consumption level effect mainly inhibited the WFP growth in most cities, except Beijing. Urban residents mainly had a downward tendency of food consumption level throughout the research period, leading to major driving forces. On the contrary, rural effects kept positive contributions to WFP growth in most cities. Rural residents have raised the demand for consuming more food mainly due to their increased income level and logistics development. On the premise of satisfying daily nutrition, encouraging residents to raise food-saving awareness could reduce the impact of food consumption level on the WFP growth.
- (4)
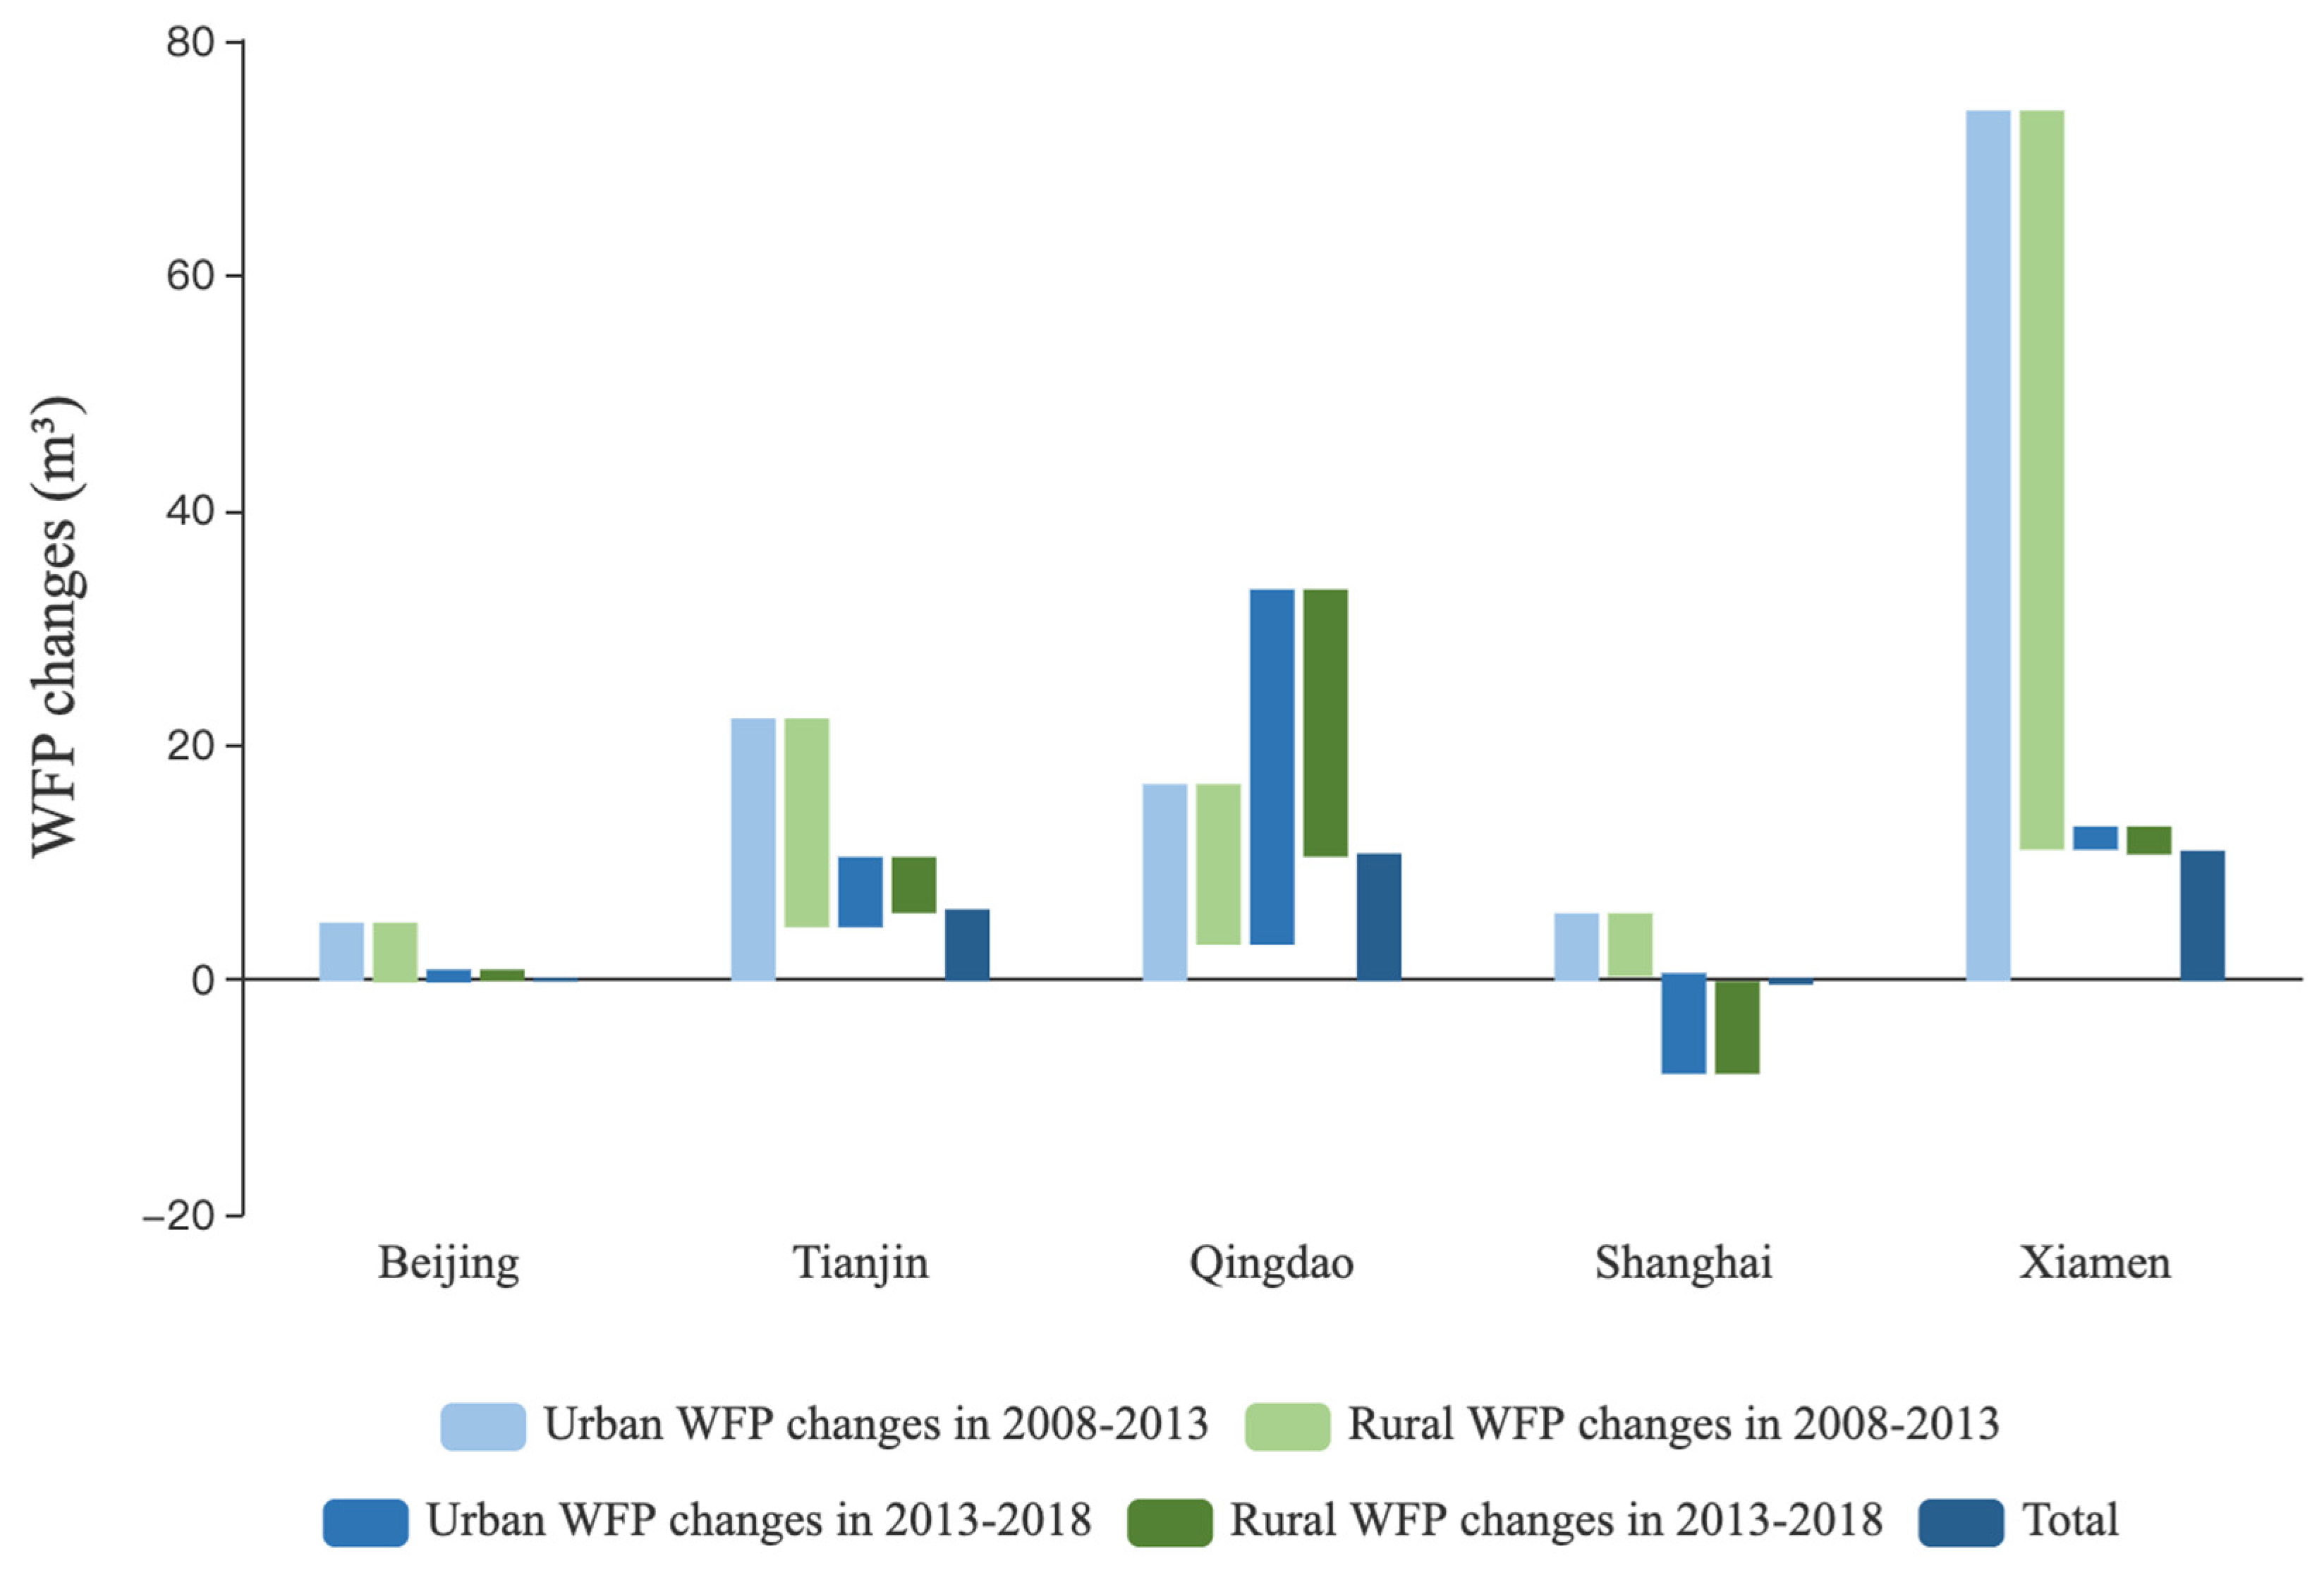
- The urbanization effect was limited in two megacities: Beijing and Shanghai. Stable urbanization level and restrictions on urban population inflow in these two cities evidently inhibited the WFP growth. However, the positive effect led to WFP growth in Tianjin, Qingdao, and Xiamen due to the booming population during rapid urbanization. While the urbanization effects of each city differed between urban and rural areas, the strong offsetting between urban and rural effects weakened the driving forces of city urbanization effects. Cities currently at a low level of urbanization could develop more sustainably by addressing attentions on future water usage and urban population planning.
- (5)
- The WF intensity effect contributed negatively to Tianjin and Beijing but promoted WFP growth in other cities. The differences in water efficiency in temporal and spatial might be due to the high water-saving awareness led by the South-to-North Water Diversion Project in cities located in the Beijing-Tianjin-Hebei region and the leading irrigation technologies in Tianjin and Beijing. The better performance in Beijing and Tianjin pointed out that there is still room for other cities to improve their water utilization efficiency and irrigation technology.
Author Contributions
Funding
Institutional Review Board Statement
Informed Consent Statement
Conflicts of Interest
References
- United Nations. Transforming our World: The 2030 Agenda for Sustainable Development; Report No. A/RES/70/1; United Nations: New York, NY, USA, 2015. [Google Scholar]
- Xu, Z.; Chen, X.; Liu, J.; Zhang, Y.; Chau, S.; Bhattarai, N.; Wang, Y.; Li, Y.; Connor, T.; Li, Y. Impacts of irrigated agriculture on food-energy-water-CO2 nexus across metacoupled systems. Nat. Commun. 2020, 11, 5837. [Google Scholar] [CrossRef]
- Chaudhary, A.; Gustafson, D.; Mathys, A. Multi-indicator sustainability assessment of global food systems. Nat. Commun. 2018, 9, 848. [Google Scholar] [CrossRef]
- Yang, C.; Cui, X. Global Changes and Drivers of the Water Footprint of Food Consumption: A Historical Analysis. Water 2014, 6, 1435–1452. [Google Scholar] [CrossRef]
- Vanham, D.; Pozo, S.d.; Pekcan, A.G.; Keinan-Boker, L.; Trichopoulou, A.; Gawlik, B.M. Water consumption related to different diets in Mediterranean cities. Sci. Total Environ. 2016, 573, 96–105. [Google Scholar] [CrossRef] [PubMed]
- Ministry of Water Resources the people’s Republic of China. China Water Resource Bulletin; Ministry of Water Resources the people’s Republic of China: Beijing, China, 2019.
- Sun, S. Water footprints in Beijing, Tianjin and Hebei: A perspective from comparisons between urban and rural consumptions in different regions. Sci. Total Environ. 2019, 647, 507–515. [Google Scholar] [CrossRef] [PubMed]
- Vanham, D.; Gawlik, B.M.; Bidoglio, G. Cities as hotspots of indirect water consumption: The case study of Hong Kong. J. Hydrol. 2017, 573, 1075–1086. [Google Scholar] [CrossRef]
- Ma, T.; Sun, S.; Fu, G.; Hall, J.W.; Ni, Y.; He, L.; Yi, J.; Zhao, N.; Du, Y.; Pei, T.; et al. Pollution exacerbates China’s water scarcity and its regional inequality. Nat. Commun. 2020, 11, 1–9. [Google Scholar] [CrossRef]
- Wu, Y.; Wnag, X.; Lu, F. Ecological Footprint and Water Footprint of Food Consumption in Beijing. Resour. Sci. 2011, 33, 1145–1152. (In Chinese) [Google Scholar]
- Zhang, Y.; Huang, K.; Yu, Y.; Yang, B. Mapping of water footprint research: A bibliometric analysis during 2006–2015. J. Clean. Prod. 2017, 149, 70–79. [Google Scholar] [CrossRef]
- Koop, S.H.A.; Leeuwen, C.J.v. Assessment of the Sustainability of Water Resources Management: A Critical Review of the City Blueprint Approach. Water Resour. Manag. 2015, 29, 5649–5670. [Google Scholar] [CrossRef]
- Hoekstra, A. Virtual water trade: A quantification of virtual water flows between nations in relation to international crop trade. In Proceedings of the International Expert Meeting on Virtual Water Trade 12, Delft, The Netherlands, 12–13 December 2003; pp. 25–47. [Google Scholar]
- Wang, Z.; Huang, K.; Yang, S.; Yu, Y. An input–output approach to evaluate the water footprint and virtual water trade of Beijing, China. J. Clean. Prod. 2013, 42, 172–179. [Google Scholar] [CrossRef]
- Chapagain, A.K.; Hoekstra, A.Y. Water Footprints of Nations; Unesco-IHE Institute for Water Education: Delft, The Netherlands, 2004. [Google Scholar]
- Jefferies, D.; Muñoz, I.; Hodges, J.; King, V.J.; Aldaya, M.; Ercin, A.E.; Canals, L.M.i.; Hoekstra, A.Y. Water Footprint and Life Cycle Assessment as approaches to assess potential impacts of products on water consumption. Key learning points from pilot studies on tea and margarine. J. Clean. Prod. 2012, 33, 155–166. [Google Scholar] [CrossRef]
- Chenoweth, J.L.; Hadjikakou, M.; Zoumides, C. Quantifying the human impact on water resources: A critical review of the water footprint concept. Hydrol. Earth Syst. Sci. 2014, 18, 2325–2342. [Google Scholar] [CrossRef]
- Su, W.; Chen, S.; Baležentis, T.; Chen, J. Economy-water nexus in agricultural sector: Decomposing dynamics in water footprint by the LMDI. Technol. Econ. Dev. Econ. 2020, 26, 240–257. [Google Scholar] [CrossRef]
- Chini, C.M.; Konar, M.; Stillwell, A.S. Direct and indirect urban water footprints of the United States. Water Resour. Res. 2017, 53, 316–327. [Google Scholar] [CrossRef]
- Novoa, V.; Ahumada-Rudolph, R.; Rojas, O.; Sáez, K.; Barrera, F.d.l.; Arumí, J.L. Understanding agricultural water footprint variability to improve water management in Chile. Sci. Total Environ. 2019, 670, 188–199. [Google Scholar] [CrossRef]
- Deng, G.; Ma, Y.; Li, X. Regional water footprint evaluation and trend analysis of China—based on interregional input–output model. J. Clean. Prod. 2016, 112, 4674–4682. [Google Scholar] [CrossRef]
- Fan, J.-L.; Wang, J.-D.; Zhang, X.; Kong, L.-S.; Song, Q.-Y. Exploring the changes and driving forces of water footprints in China from 2002 to 2012: A perspective of final demand. Sci. Total Environ. 2019, 650, 1101–1111. [Google Scholar] [CrossRef]
- Cai, J.; He, Y.; Xie, R.; Liu, Y. A footprint-based water security assessment: An analysis of Hunan province in China. J. Clean. Prod. 2020, 245, 118485. [Google Scholar] [CrossRef]
- Shi, C.; Yuan, H.; Pang, Q.; Zhang, Y. Research on the Decoupling of Water Resources Utilization and Agricultural Economic Development in Gansu Province from the Perspective of Water Footprint. Int. J. Environ. Res. Public Health 2020, 17, 5758. [Google Scholar] [CrossRef]
- Zhao, D.; Tang, Y.; Liu, J.; Tillotson, M.R. Water footprint of Jing-Jin-Ji urban agglomeration in China. J. Clean. Prod. 2017, 167, 919–928. [Google Scholar] [CrossRef]
- Huang, J.; Ridoutt, B.G.; Zhang, H.; Xu, C.; Chen, F. Water footprint of cereals and vegetables for the Beijing market: Comparison between local and imported supplies. J. Ind. Ecol. 2014, 18, 40–48. [Google Scholar] [CrossRef]
- Ridoutt, B.G.; Huang, J. Environmental relevance—the key to understanding water footprints. Proc. Natl. Acad. Sci. USA 2012, 109, E1424. [Google Scholar] [CrossRef] [PubMed]
- Herath, I.; Deurer, M.; Horne, D.; Singh, R.; Clothier, B. The water footprint of hydroelectricity: A methodological comparison from a case study in New Zealand. J. Clean. Prod. 2011, 19, 1582–1589. [Google Scholar] [CrossRef]
- Paterson, W.; Rushforth, R.; Ruddell, B.L.; Konar, M.; Ahams, I.C.; Gironás, J.; Mijic, A.; Mejia, A. Water Footprint of Cities: A Review and Suggestions for Future Research. Sustainability 2015, 7, 8461–8490. [Google Scholar] [CrossRef]
- Zhao, C.; Chen, B. Driving Force Analysis of the Agricultural Water Footprint in China Based on the LMDI Method. Environ. Sci. Technol. 2014, 48, 12723–12731. [Google Scholar] [CrossRef]
- Zhang, L.; Dong, H.; Geng, Y.; Francisco, M.-J. China’s provincial grey water footprint characteristic and driving forces. Sci. Total Environ. 2019, 677, 427–435. [Google Scholar] [CrossRef]
- Ang, B.W. LMDI decomposition approach: A guide for implementation. Energy Policy 2015, 86, 233–238. [Google Scholar] [CrossRef]
- Cao, Y.; Chai, L.; Yan, X.; Liang, Y. Drivers of the Growing Water, Carbon and Ecological Footprints of the Chinese Diet from 1961 to 2017. Int. J. Environ. Res. Public Health 2020, 17, 1803. [Google Scholar] [CrossRef]
- Kong, Y.; He, W.; Yuan, L.; Shen, J.; An, M.; Degefu, D.M.; Gao, X.; Zhang, Z.; Sun, F.; Wan, Z. Decoupling Analysis of Water Footprint and Economic Growth: A Case Study of Beijing–Tianjin–Hebei Region from 2004 to 2017. Int. J. Environ. Res. Public Health 2019, 16, 4873. [Google Scholar] [CrossRef]
- Kang, J.; Lin, J.; Zhao, X.; Zhao, S.; Kou, L. Decomposition of the Urban Water Footprint of Food Consumption: A Case Study of Xiamen City. Sustainability 2017, 9, 135. [Google Scholar] [CrossRef]
- Vanham, D.; Gawlik, B.M.; Bidoglio, G. Food consumption and related water resources in Nordic cities. Ecol. Indic. 2017, 74, 119–129. [Google Scholar] [CrossRef]
- FAO Database. Available online: http://www.fao.org/land-water/databases-and-software/en/ (accessed on 18 November 2020).
- Wang, F.; Liu, C.; Xu, Y. Analyzing Population Density Disparity in China with GIS-automated Regionalization: The Hu Line Revisited. Chin. Geogr. Sci. 2019, 20, 541–552. [Google Scholar] [CrossRef]
- Xiamen Municipal Bureau of Statistics. Yearbook of Xiamen Special Economic Zone; Xiamen Municipal Bureau of Statistics: Xiamenm, China, 2019. (In Chinese)
- Tianjin Municipal Bureau of Statistics. Tianjin Statistical Yearbook; Tianjin Municipal Bureau of Statistics: Tianjin, China, 2019. (In Chinese)
- Shanghai Municipal Bureau of Statistics. Shanghai Statistical Yearbook; Shanghai Municipal Bureau of Statistics: Shanghai, China, 2019. (In Chinese)
- Qingdao Municipal Bureau of Statistics. Qingdao Statistical Yearbook; Qingdao Municipal Bureau of Statistics: Qingdao, China, 2019. (In Chinese)
- Beijing Municipal Bureau of Statistics. Beijing Statistical Yearbook; Beijing Municipal Bureau of Statistics: Beijing, China, 2019. (In Chinese)
- National Bureau of Statistics of China. China Statistical Yearbook; China Statistical Press: Beijing, China, 2019. (In Chinese)
- Liao, X.; Zhao, X.; Jiang, Y.; Liu, Y.; Yi, Y.; Tillotson, M.R. Water footprint of the energy sector in China’s two megalopolises. Ecol. Model. 2019, 391, 9–15. [Google Scholar] [CrossRef]
- Xiong, X.; Zhang, L.; Zhang, P.; Chang, Y.; Wang, C. Dynamics of Urban Food Metabolism with Water-Carbon Footprint Respond: A Case Study of Beijing. J. Nat. Resour. 2018, 33, 1886–1896. (In Chinese) [Google Scholar]
- Ministry of Water Resources the People’s Republic of China. Tianjin: A National Demonstration City for Water-Saving. Available online: http://www.mwr.gov.cn/english/Medianews/201610/t20161017_765352.html (accessed on 19 November 2020).
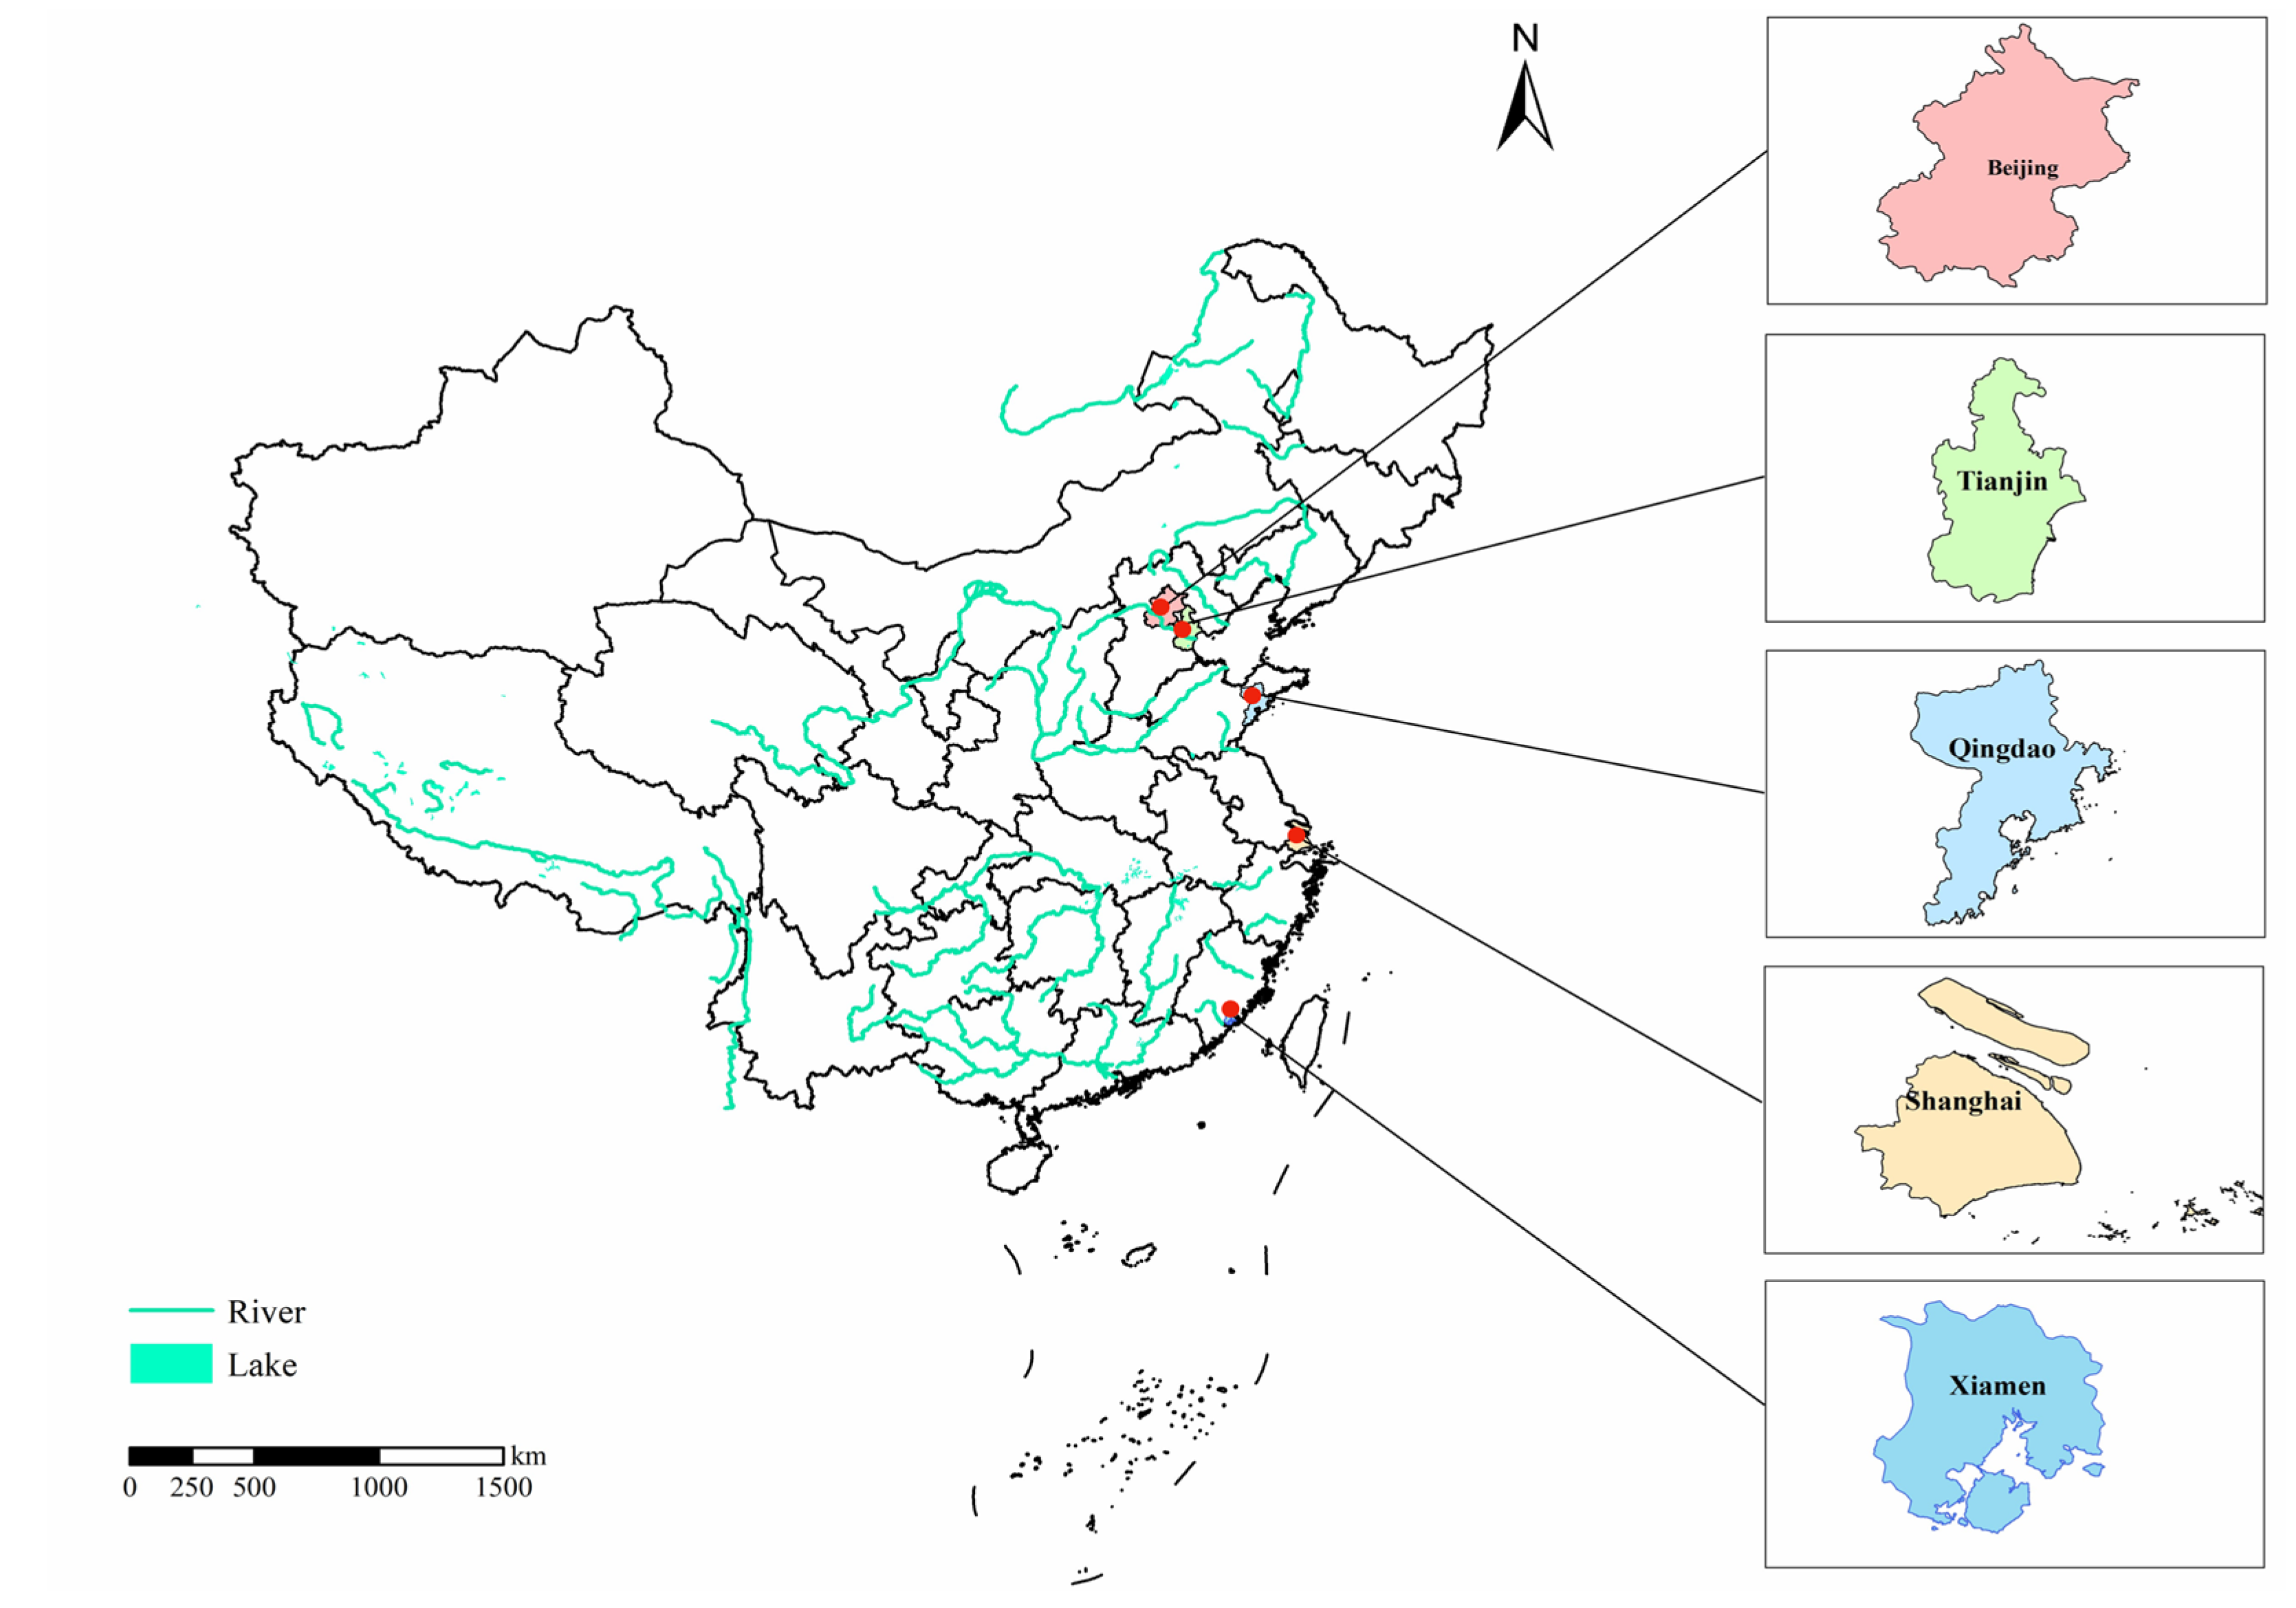
| Items | Beijing | Tianjin | Qingdao | Shanghai | Xiamen |
|---|---|---|---|---|---|
| Population (104 persons) | 2154 | 1560 | 940 | 2424 | 411 |
| Area (km2) | 16,411 | 11,967 | 11,293 | 6341 | 1700 |
| per capita GDP (Yuan) | 140,211 | 120,711 | 128,459 | 134,982 | 118,015 |
| Urbanization rate (%) | 86.5% | 83.1% | 73.7% | 88.1% | 89.1% |
| Per capita water resources (cμ.m/person) | 164 | 113 | 117 | 160 | 268 |
Publisher’s Note: MDPI stays neutral with regard to jurisdictional claims in published maps and institutional affiliations. |
© 2021 by the authors. Licensee MDPI, Basel, Switzerland. This article is an open access article distributed under the terms and conditions of the Creative Commons Attribution (CC BY) license (http://creativecommons.org/licenses/by/4.0/).
Share and Cite
Huang, R.; Li, X.; Liu, Y.; Tang, Y.; Lin, J. Decomposition of Water Footprint of Food Consumption in Typical East Chinese Cities. Sustainability 2021, 13, 409. https://doi.org/10.3390/su13010409
Huang R, Li X, Liu Y, Tang Y, Lin J. Decomposition of Water Footprint of Food Consumption in Typical East Chinese Cities. Sustainability. 2021; 13(1):409. https://doi.org/10.3390/su13010409
Chicago/Turabian StyleHuang, Ruogu, Xiangyang Li, Yang Liu, Yaohao Tang, and Jianyi Lin. 2021. "Decomposition of Water Footprint of Food Consumption in Typical East Chinese Cities" Sustainability 13, no. 1: 409. https://doi.org/10.3390/su13010409
APA StyleHuang, R., Li, X., Liu, Y., Tang, Y., & Lin, J. (2021). Decomposition of Water Footprint of Food Consumption in Typical East Chinese Cities. Sustainability, 13(1), 409. https://doi.org/10.3390/su13010409


