Article

Decomposition of Water Footprint of Food Consumption in Typical East Chinese Cities

1
Key Lab of Urban Environment and Health, Fujian Key Laboratory of Watershed Ecology, Institute of Urban Environment, Chinese Academy of Sciences, 1799 Jimei Road, Xiamen 361021, China
2
Pearl River Water Resource Commission of the Ministry of Water Resources, 80 Tianshou Road, Guangzhou 510611, China
3
School of Earth Sciences and Engineering, Hohai University, 1 Xikang Road, Nanjing 210098, China
*
Author to whom correspondence should be addressed.
Sustainability 2021, 13(1), 409; https://doi.org/10.3390/su13010409
Submission received: 22 December 2020 / Accepted: 30 December 2020 / Published: 5 January 2021

Abstract

:
Water scarcity has put pressure on city development in China. With a particular focus on urban and rural effects, logarithmic mean Divisia index decomposition (LMDI) was used to analyze the water footprint per capita (WFP) of food consumption in five East China cities (Beijing, Tianjin, Shanghai, Qingdao, and Xiamen) from 2008 to 2018. Results show that the WFP of food consumption exhibited an upward tendency among all cities during the research period. Food consumption structure contributed the most to the WFP growth, mainly due to urban and rural residents’ diet shift toward a livestock-rich style. Except in Beijing, the food consumption level mainly inhibited the WFP growth due to the decrease in food consumption level per capita in urban areas. Urbanization had less influence on WFP growth for two megacities (Beijing and Shanghai) due to the strictly controlled urban population inflow policy and more positive effects for other cities. The water footprint intensity effect among cities was mainly due to uneven water-saving efficiency. Meanwhile, Beijing and Tianjin have achieved advancement in water utilization efficiency.

1. Introduction

The Sustainable Development Goals (SDGs) of the United Nations proposed the expectations for future water availability and sustainable usage, which recognized the vital role of water management in urban sustainable development [1,2,3]. As a major water consumer, agricultural food production currently has the largest share in the total water consumption (61.2%) of China [4,5,6]. With a considerable booming population and continuous urbanization in China, a growing centralized water resource is needed to meet the demands of the urban food supply [7,8]. Since populations gradually gathered in eastern coastal areas, which are usually water-stressed [9,10], the growing urban population imposes apparent pressure on local water management [11,12].
Hoekstra introduced Water Footprint (WF) in 2002 to analyze residential water consumed in a particular region with regard to food consumption [13,14]. This parameter is defined as the volume of water needed for goods and services consumed in a certain period and links the physical water usage with virtual indirect water usage in the analysis [13,15,16]. Owing to its wide application and non-imitated research objects, WF provides a new access point for water consumption monitoring and has gradually become an important indicator for water resource management [17]. A certain amount of WF assessment studies have been conducted at the national, regional, and provincial-scale to study influences brought by differentiation in spatial water resource distribution and socio-economic development level of cities [18,19,20,21,22,23,24,25]. Researches also investigated single commodities to analyze WF in the agricultural sector at the micro-level [26,27,28]. WF calculation methodologies can generally be divided into top-down (sector-based) and bottom-up (product-based) [29]. Due to the few data availability requirements, the bottom-up technique has the superiority in assessing the water consumption of goods and products in the delineated area [17,30].
Excepted for calculating WF, decomposition methods have normally been applied in previous studies to examine the effect of a single factor on the total WF changing progress, aiming to find solutions for urban water management challenges [31]. Especially when the WF changes are calculated through the bottom-up route, the logarithmic mean Divisia index (LMDI) model is the preferred technique for evaluating the primary driving forces [32]. At the national level, Cao et al. (2020) investigated the environmental footprint changes (including water, carbon, and ecological footprint) of the China food system from 1961 to 2017 by using LMDI and highlighted the diet pattern, which became the major driving factor since the 1990s [33]. Zhao and Chen (2014) evaluated China’s agricultural WF from 1990 to 2009 by breaking down influencing factors on agricultural WF into diet structure, efficiency, economic activity, and population effect, which was pointed out to be the major contribution of economic activity effect on WF growth [30]. When narrowing down to regional research, studies suggested that urbanization was another potential key factor in WF changes [5,34]. For instance, Sun (2019) decomposed the WF per capita changes of province-level cities in China’s capital region. The results indicated that, with the socio-economic development, the urbanization and food consumption level effect were the leading drivers on WF growth [7]. Furthermore, scholars also focused on WF analysis of the single city. Kang et al. (2017) investigated the driving forces of water intensity, food consumption structure, food consumption level, population, and urban population rate on urban food consumption water footprint in Xiamen and pointed out that population effects were the primary contributors [35]. While studies have been conducted from the perspective of Chinese food consumption, WF decomposition was mainly conducted at the macro level in national or provincial scope. WF decomposition has not been previously compared among cities with high geographical differentiation and varying development levels. The sustainable use of water resources may require extra efforts at the micro-level to better meet local conditions.
Therefore, based on the food consumption perspective, this study quantifies and then compares the WF in five cities (Beijing, Tianjin, Shanghai, Qingdao, and Xiamen) in East China from 2008 to 2018. LMDI decomposition is further conducted to investigate the driving factors underlying WF growth among five cities, which could be useful for relevant policy-making towards future urban sustainability development. This paper is structured as follows: WF calculation for residential food consumption and LMDI decomposition is first introduced; the results and discussion of decomposition factors are then presented; and conclusions and recommendations are proposed.

2. Materials and Methods

2.1. WF Calculation

WF can be classified into three types, namely, green, blue, and grey water. Green water refers to the rainfall used by crops in the production period, and blue water is the surface and groundwater evaporated in the production period [36]. Grey water is excluded from this study because it relies heavily on data availability [29]. Owing to the variations in population size among cities, WF per capita (WFP) is adopted for comparison. The WFP of residential food consumption constituting livestock and crop WF is calculated with the bottom-up method:
W F P = n V W C i C i ,
where WFP represents the WF consumption per capita (m3/cap), VWCi is the virtual water of crop or livestock product i (m3/kg), and Ci is the consumption volume per capita of crop or livestock product i (kg/cap).
The VWC value of the crop is calculated using CropWat software suggested by the Food and Agriculture Organization database and CLIMWAT software [37] to acquire necessary climate data from each city. The livestock VWC value refers to that reported by Chapagain and Hoekstra [15] in China, and the sugar VWC value is adopted from Wu et al. [10].

2.2. LMDI on Food Consumption WFP

Inspired by Kang et al. [35], LMDI is applied to investigate the driving factors underlying the WFP changes in residential food consumption among cities. Owing to the difference in population density among five cities, the WFP in each city is calculated for comparison [7]. The factors affecting the WFP residential food consumption are decomposed into WF intensity (the VWC value per kg of crop or livestock product), food consumption structure, food consumption level, and urbanization rate (the proportion of the urban population in total population) [4,5,35]. The decomposition equation is as follows:
W F P = i W F P u i · U u + i W F P r i · U u U = i W F P u i · U u U + i W F P r i · U r U = i W F P u i C u i · C u i C u · C u U u · U u U + i W F P r i C r i · C r i C r · C r U r · U r U = i I u i · S u i · F u · P u + i I r i · S r i · F r · P r ,
where WFP is the water footprint per capita of residential food consumption; W F P u i and W F P r i represent urban and rural WFPs of product i, respectively; U is the total population; U u and U r represent the urban and rural populations, respectively; C u and C r are the total volume of food consumption per capita in urban and rural areas, respectively; C u i and C r i represent the consumption of i product per capita in urban and rural areas, respectively; P u is the urban population rate; and P r represents the rural population rate. Here, P u and P r add up to 100%. I u i and I r i are the urban and rural WFP intensity, respectively; S u i and S r i are the food consumption structures in urban and rural areas, respectively; and F u and F r represent food consumption per capita in urban and rural areas, respectively.
According to the LMDI decomposition, the change in WFP between baseline year 0 and the target year is calculated as follows:
Δ W F P = W F P t W F P 0 = ( P u · i W F u i + P r · i W F r i ) t ( P u · i W F u i + P r · i W F r i ) 0 = Δ W F P u ( I ) + Δ W F P u ( S ) + Δ W F P U ( F ) + Δ W F P u ( P ) + Δ W F P r ( I ) + Δ W F P r ( S ) + Δ W F P r ( F ) + Δ W F P r ( P ) ,
where Δ W F P u ( I ) , Δ W F P u ( S ) , Δ W F P U ( F ) , and Δ W F P u ( P ) represent WF intensity effect, food consumption structure effect, food consumption level effect, urbanization effect, respectively, which are factors that contribute to the change in urban residential WFP. Δ W F P r ( I ) , Δ W F P r ( S ) , Δ W F P r ( F ) , and Δ W F P r ( P ) are four factors influencing rural residential WFP change. The contribution of each effect on WFP change can be calculated as follows:
Δ W F P u ( I ) = i ( W F P u i · P u ) t ( W F P u i · P u ) 0 l n ( ( W F P u i · P u ) t ) / ( ( W F P u i · P u ) 0 ) · l n ( I u i , t I u i , 0 )
Δ W F P u ( S ) = i ( W F P u i · P u ) t ( W F P u i · P u ) 0 l n ( ( W F P u i · P u ) t ) l n ( ( W F P u i · P u ) 0 ) · l n ( S u i , t S u i , 0 )
Δ W F P u ( F ) = i ( W F P u i · P u ) t ( W F P u i · P u ) 0 l n ( ( W F P u i · P u ) t ) l n ( ( W F P u i · P u ) 0 ) · l n (   F u t   F u 0   )
Δ W F P u ( P ) = i ( W F P u i · P u ) t ( W F P u i · P u ) 0 l n ( ( W F P u i · P u ) t ) l n ( ( W F P u i · P u ) 0 ) · l n ( P u t P u o )
Δ W F P r ( I ) = i ( W F P r i · P r ) t ( W F P r i · P r ) 0 l n ( ( W F P r i · U ) t ) l n ( ( W F P r i · U ) 0 ) · l n ( I r i , t I r i , 0 )
Δ W F P r ( S ) = i ( W F P r i · P r ) t ( W F P r i · P r ) 0 l n ( ( W F P r i · U ) t ) l n ( ( W F P r i · U ) 0 ) · l n ( S r i , t S r i , 0 )
Δ W F P r ( F ) = i ( W F P r i · P r ) t ( W F P r i · P r ) 0 l n ( ( W F P r i · U ) t ) l n ( ( W F P r i · U ) 0 ) · l n (   F r t   F r 0 )
Δ W F P r ( U ) = i ( W F P r i · P r ) t ( W F P r i · P r ) 0 l n ( ( W F P r i · P r ) t ) l n ( ( W F P r i · P r ) 0 ) × l n ( P r t P r o )

3. Study Area and Data Source
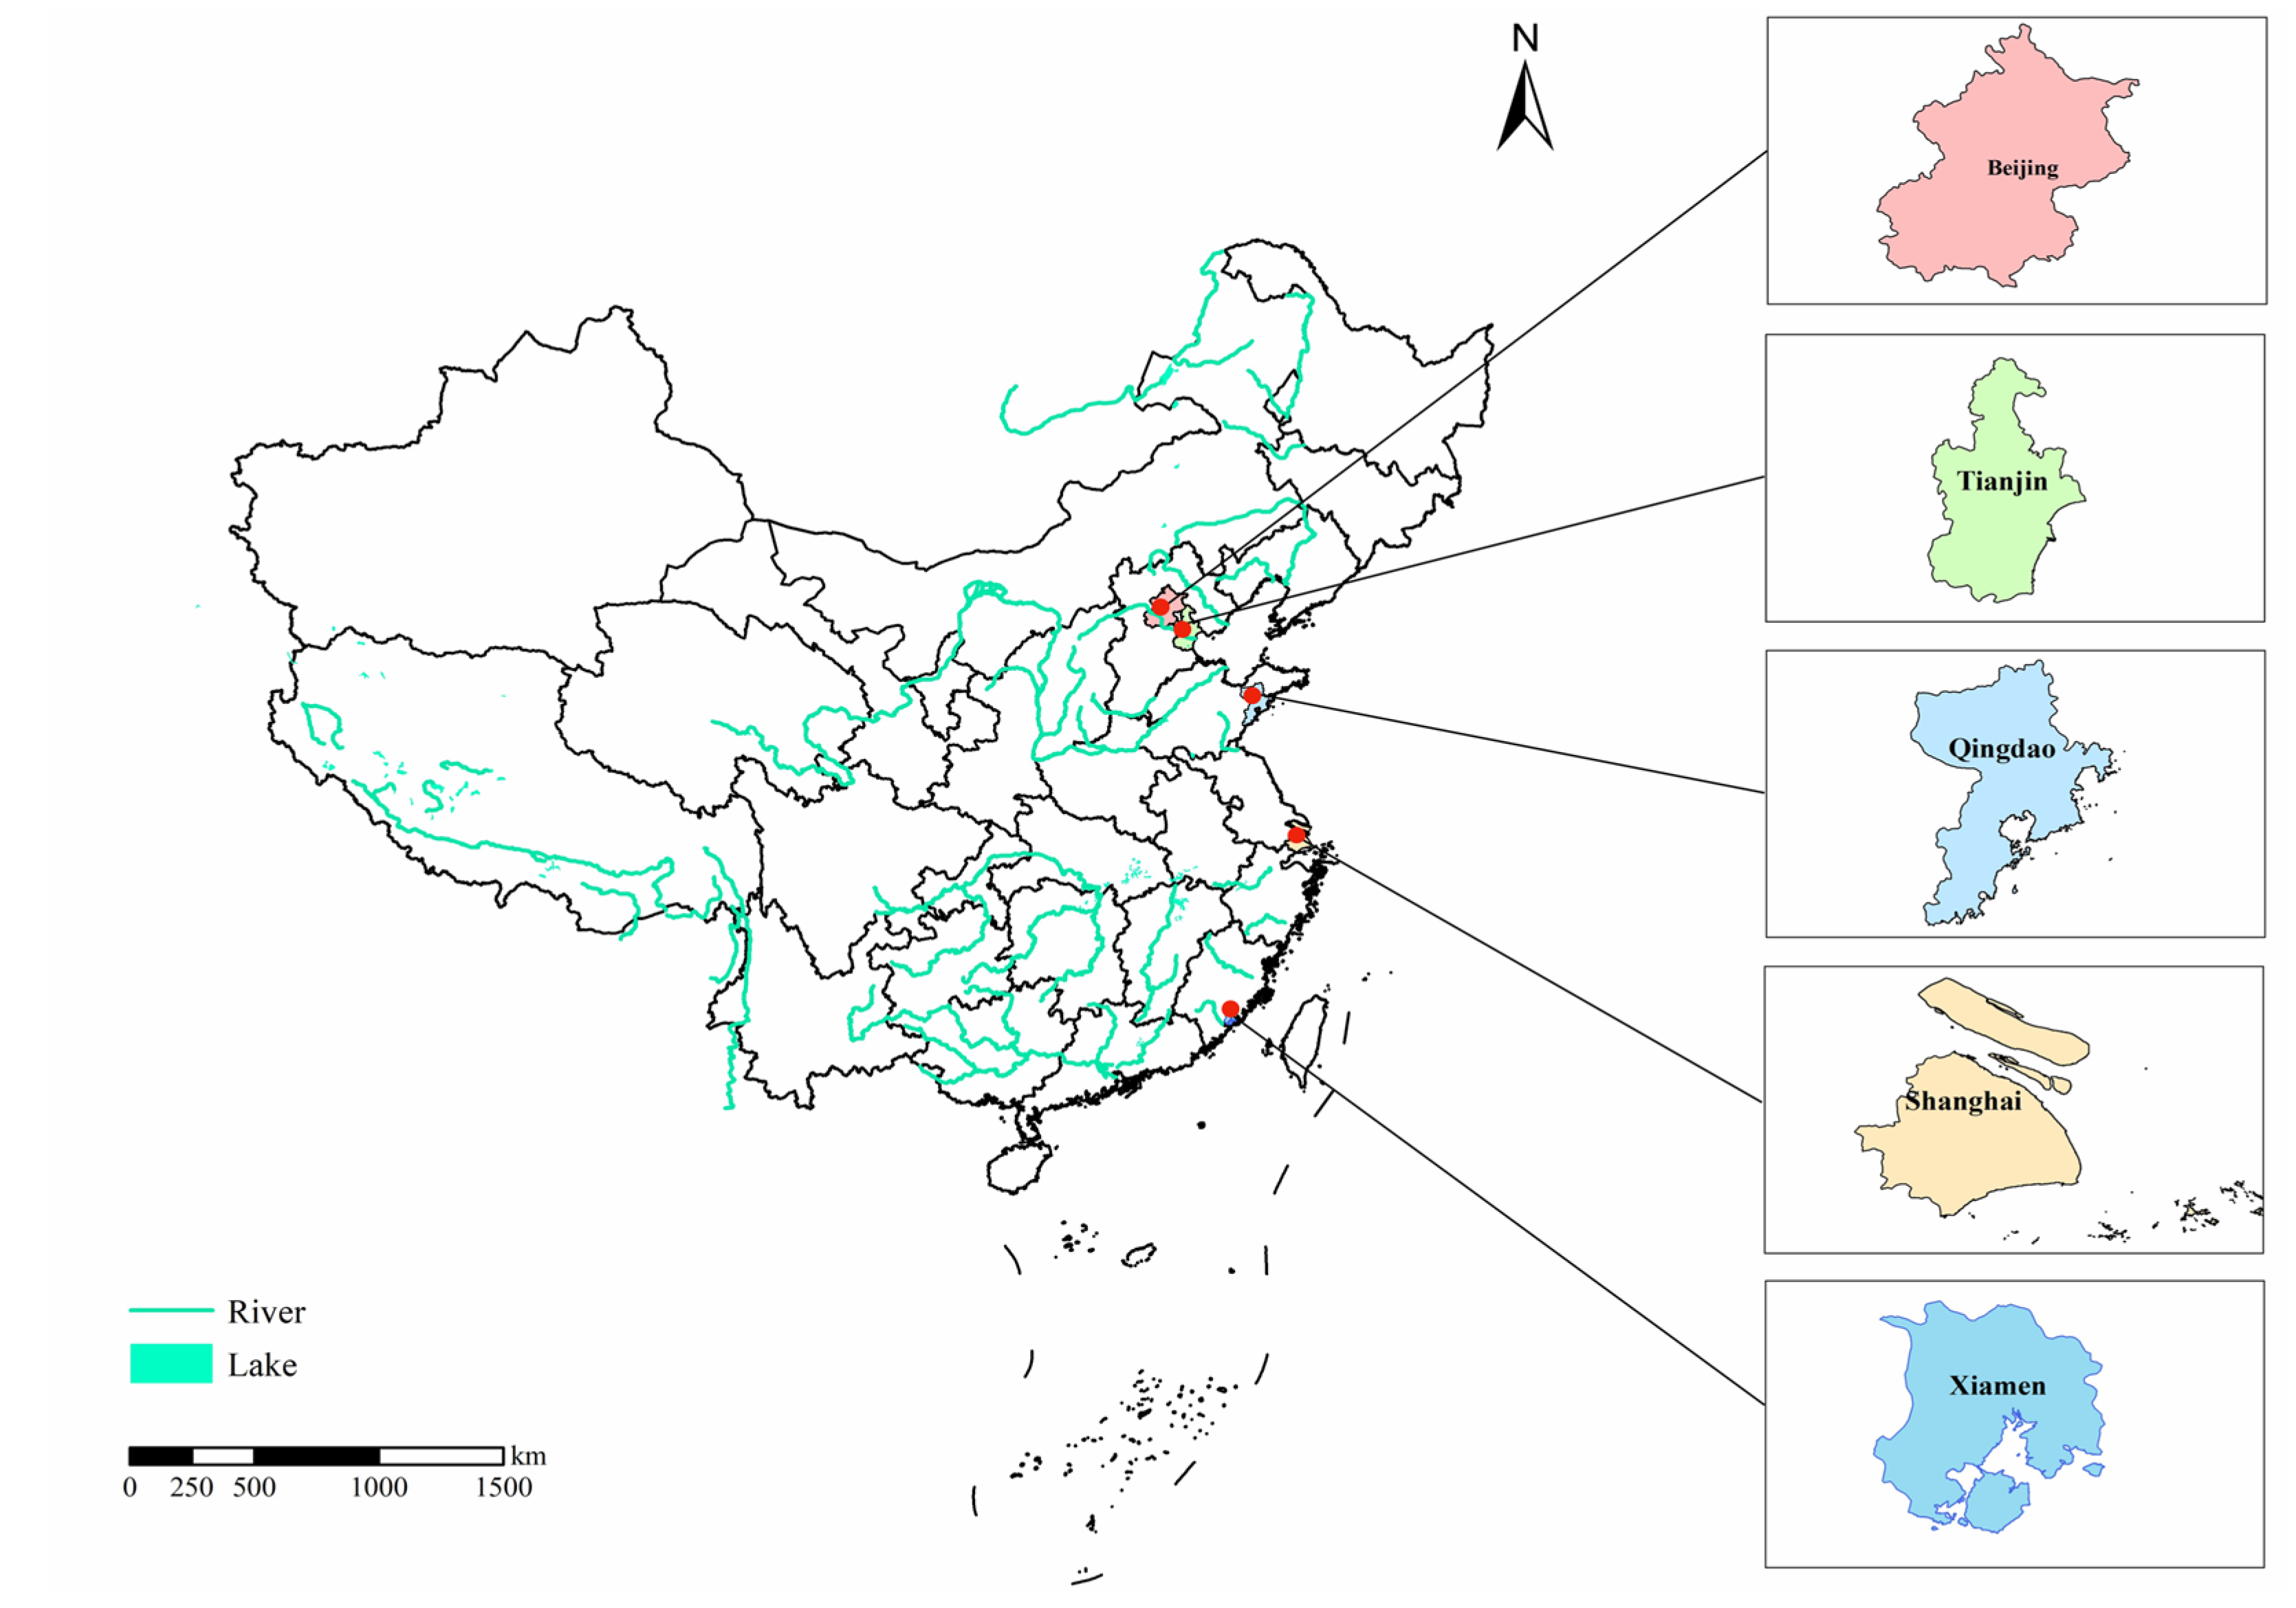
3.1. Study Area

China’s population is denser in the eastern coastal cities, taking the Hu Line as the population boundary [38]. Benefiting from early reform and opening policy, cities developed rapidly and gradually formed the Beijing-Tianjin-Hebei urban agglomeration, the Yangtze River Delta urban agglomeration, and the Guangdong-Hong Kong-Macao Greater Bay Area, which included the political and economic centers of China (Beijing and Shanghai, respectively). The coastal cities in East China have now become the core economic growth zone, while cities will also face increased water demand due to dense population. Given the current data availability, five cities in East China, namely, Beijing, Tianjin, Shanghai, Qingdao, and Xiamen, are selected to reveal the driving factors of water usage with regard to food consumption (Figure 1). In the Beijing–Tianjin–Hebei Region, Beijing and Tianjin are two resource-based water scarcity megacities located near the Bohai Sea [9]. Given their close geographical link, these two cities suffer from water shortage and rely heavily on the South-to-North Water Diversion Project to maintain their citizens’ freshwater usage. Shanghai is another megacity on the south of the Yangtze River Estuary and is recognized as a quality-based water scarcity city. As the economic center of China, this city is the most populous and has overloaded water capacity. Qingdao and Xiamen are two municipalities with independent planning statuses and play important roles in coastal economic growth. Both suffer from surface water reservations due to their topographic features. Compared to Qingdao in the southeast of the Jiaodong Peninsula, Xiamen is a typical bay city in the south of Fujian province that relies heavily on surface water. Detailed information about these five cities is shown in Figure 1 and Table 1.

3.2. Data Sources

The research period covers from 2008 to 2018. Data on food consumption per capita in urban and rural areas, the types of crop and livestock products, geological conditions, cultivation conditions, and population are sourced from the Statistical Yearbooks (2009–2019) and Water Resource Bulletin (2019) of each city [6,39,40,41,42,43,44]. In those publications, the types of food counted vary. Therefore, due to data availability and feasibility of further comparisons, this paper employs five crop products (grains, oil crops, vegetables, fruits, and sugar) and four livestock products (meat, poultry eggs, dairy, and fish and seafood) provided in the five cities’ Statistical Yearbooks.

4. Results and Discussions

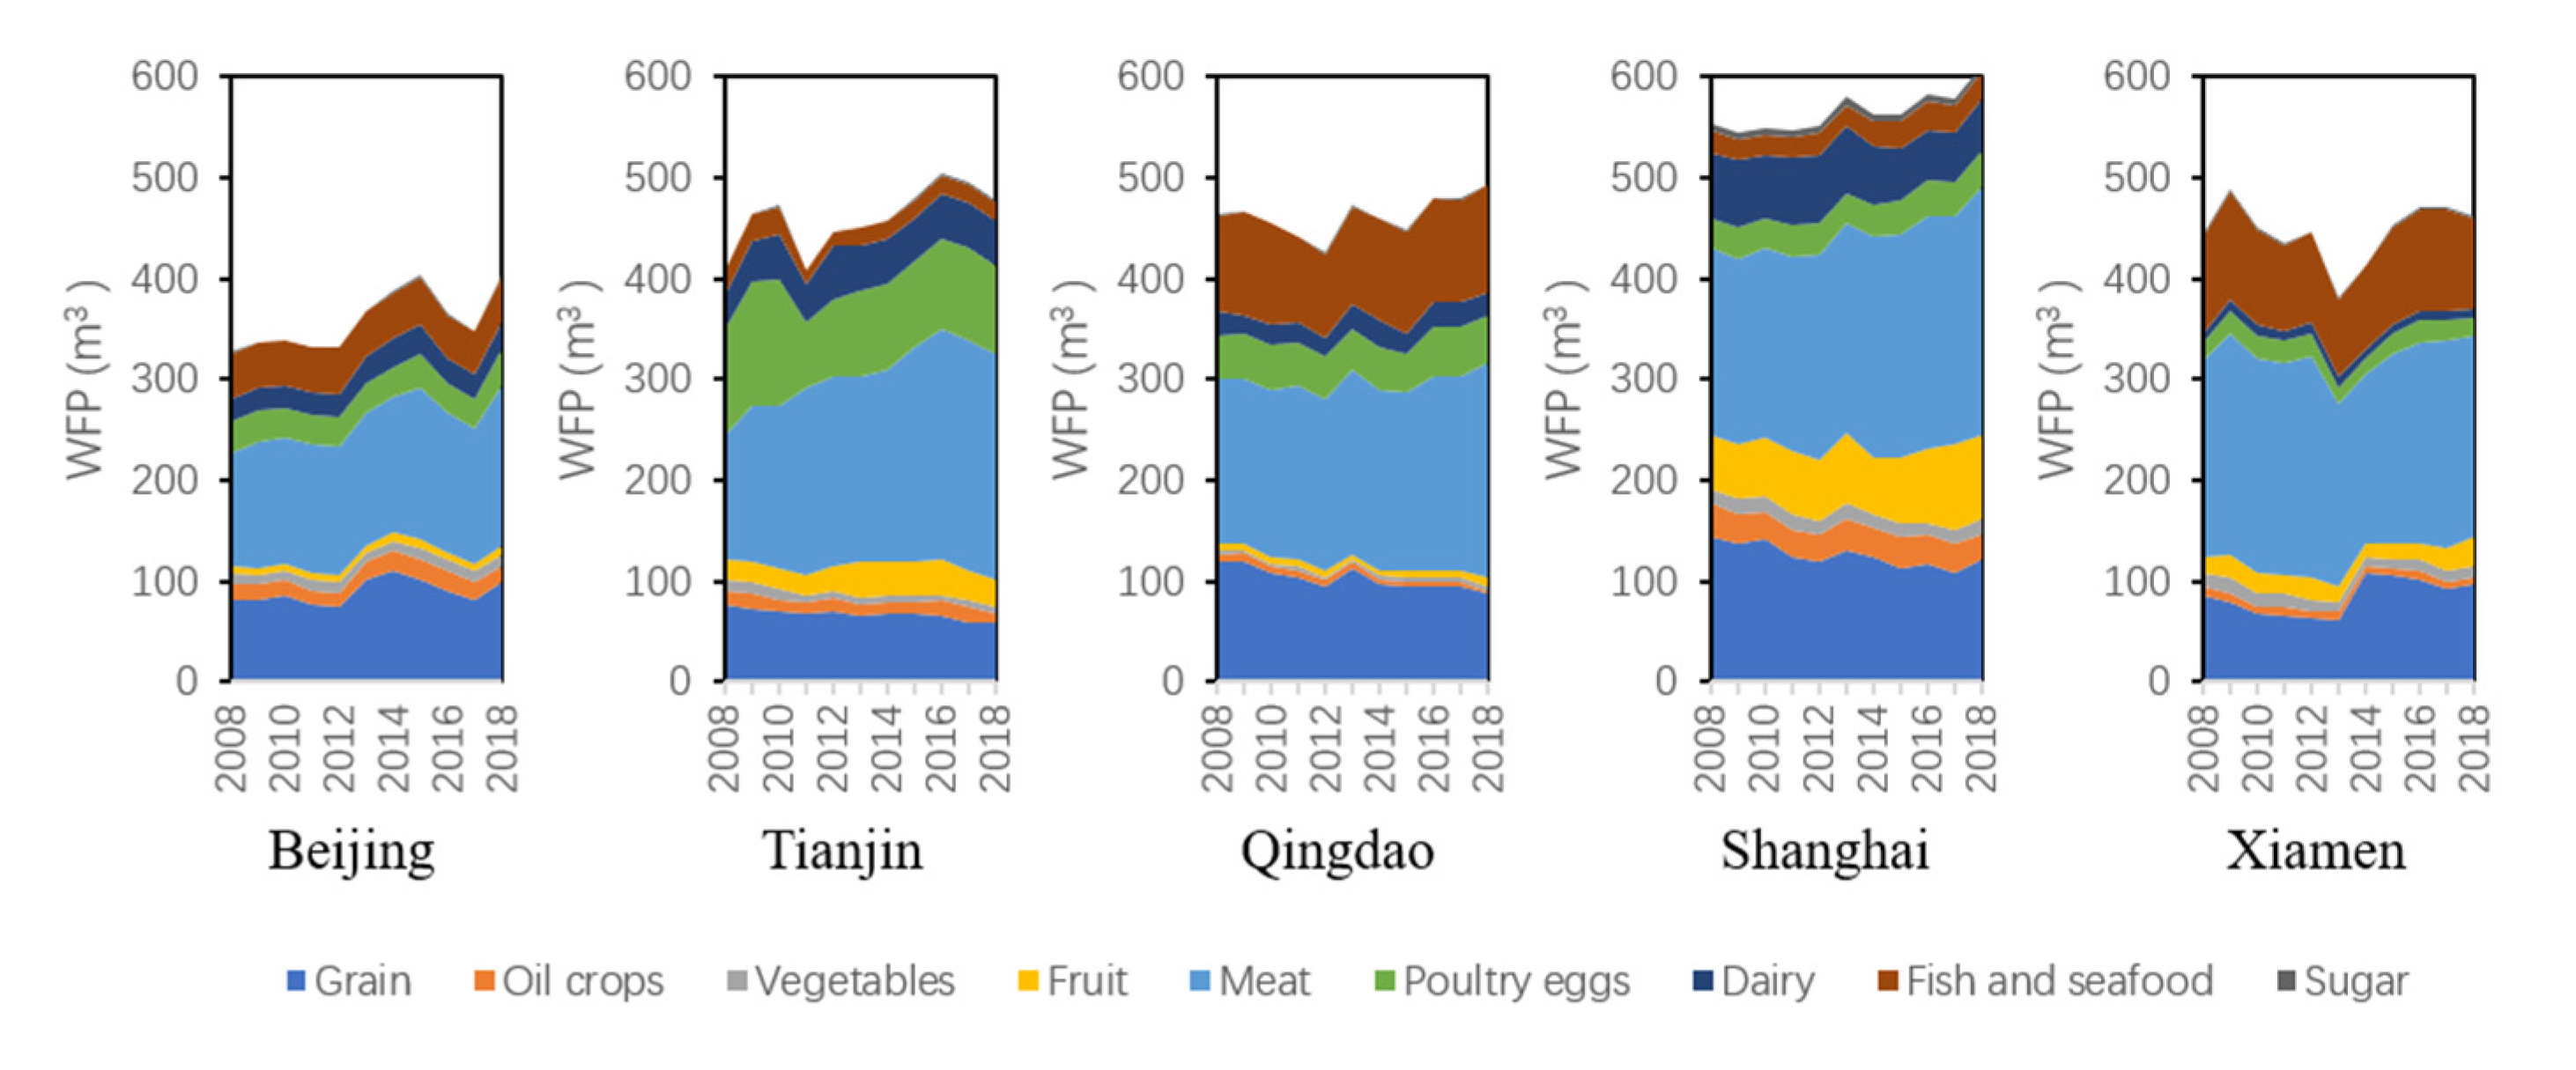
4.1. Food Consumption WFP of the Five Cities

Figure 2 presents the trend of food consumption WFP in each city from 2008 to 2018. The WFP of all cities exhibited an upward tendency; that of Beijing, Tianjin, Qingdao, and Xiamen grew volatilely, and that of Shanghai WFP had a slow-growth tendency. In terms of composition, the WFP of each city showed similarity in meat and grain proportions and variations in poultry eggs, dairy and fish and seafood elements. Meat proportions accounted for the majority of the WFP in all five cities, thus reflecting the strong effect of water-intensive products on city Food consumption WFP. Grain proportions also accounted for large WFP; however, grain products consumed less virtual water and therefore had less effect on WFP in each city. Poultry eggs and dairy were the main WFP elements in Beijing, Tianjin, Shanghai, and Qingdao. Compared with Tianjin and Shanghai, fish and seafood constituted a large part of the WFP in Beijing, Qingdao, and Xiamen. Shanghai was the only city with a considerably large proportion of fruit WFP.

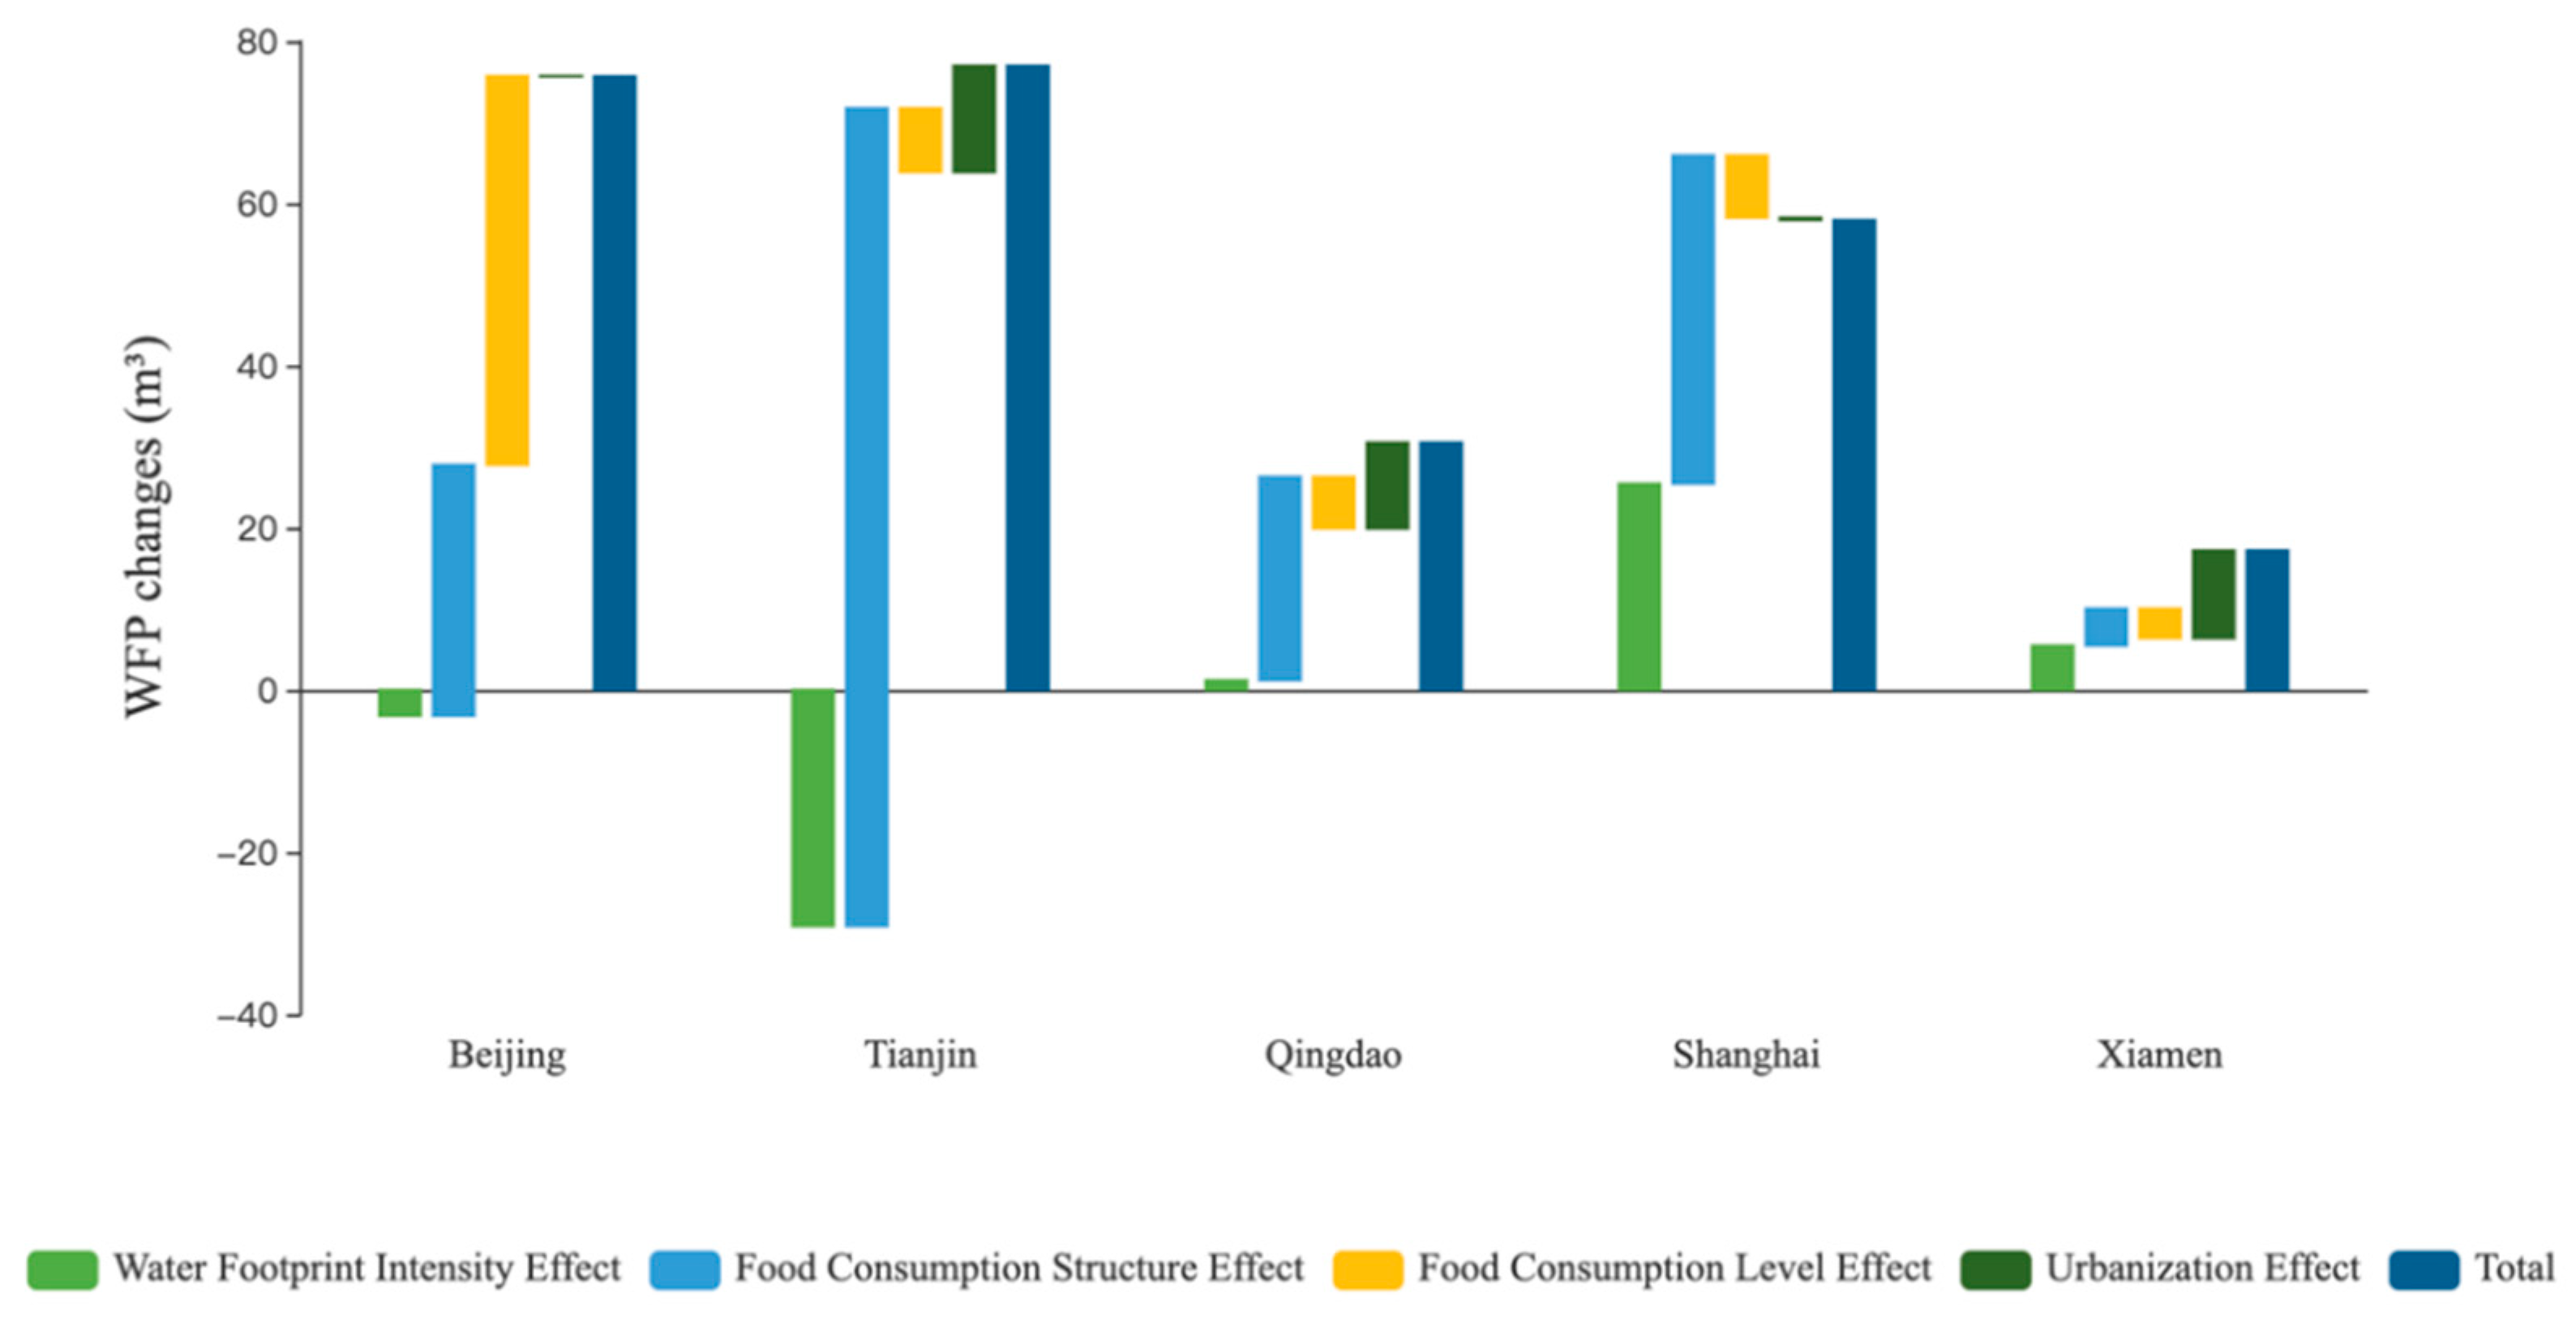
4.2. Decomposition Effect Analysis

Figure 3 illustrates the aggregate decomposition effect of WFP changes in five cities from 2008 to 2018. In general, the food consumption WFP of five cities increased to varying degrees during 2008–2018, in which Beijing had the highest increase of 75.67 m3, followed by Tianjin, Shanghai, Qingdao, and Xiamen with 69.5, 57.94, 30.51, and 17.21 m3, respectively. With regard to the WF intensity effect, Beijing and Tianjin showed negative effects with −3.19 and −29.04 m3 declines, respectively. This finding indicated the efficient use of agricultural water in Beijing and Tianjin. The water management optimization in Beijing–Tianjin–Hebei Region might be related to the South-to-North Water Diversion Project in China, which pressures Beijing and Tianjin to show awareness on water utilization improvement [34]. On the contrary, Shanghai, Xiamen, and Qingdao had positive effects with increases of 25.44, 5.47, and 1.19 m3, respectively. The positive driving forces of these three coastal cities indicated a descending efficiency in water utilization during the research period. In terms of the food consumption structure effect, all cities had positive effects. Among which, Tianjin had the largest driving force with a 100.93 m3 increase, followed by Beijing, Shanghai, Qingdao, and Xiamen with 30.95, 40.48, 25.09, and 4.57 m3 uplifts, respectively. This result expressed that Tianjin citizens had a structural change in their daily food intake, whereas Xiamen residents kept a stable diet habit. In terms of food consumption level per capita effect, Beijing had a 47.94 m3 surge. Other cities had negative effects, with Tianjin showing the highest negative effect of −8.23 m3, followed by Shanghai, Qingdao, and Xiamen at −7.68, –6.37, and −3.67 m3, respectively. The differences between Beijing and other cities could be caused by the increase in food consumption levels in urban and rural areas in Beijing. Meanwhile, other cities only had an upward trend in rural areas. In terms of urbanization effect, Beijing and Shanghai showed negative effects with declines of −0.02 and −0.29 m3, respectively. This phenomenon is mainly due to the high urbanization rates in Beijing and Shanghai since 2008 and the counter-urbanization occurring in both cities. Tianjin, Qingdao, and Xiamen had positive effects with growths of 5.84, 10.60, and 10.83 m3, respectively.

4.2.1. WF Intensity Effect

Figure 4 shows the urban and rural WF intensity effect of five cities from 2008 to 2013 and 2013 to 2018. The WF intensity effect of Beijing and Tianjin was negative effects, whereas that of Qingdao, Shanghai, and Xiamen was positive. Except for Shanghai, the urban effect showing a 20.44 m3 increase, the urban effect of other cities had negative driving forces with decreases of −4.40 m3 in Beijing, −3.04 m3 in Tianjin, −0.39 m3 in Qingdao, and –4.98 m3 in Xiamen from 2008 to 2013. The rural effect contributed positively to Shanghai and Qingdao with 1.24 and 0.32 m3 increases, respectively, but contributed negatively to Beijing, Tianjin, and Xiamen with −1.18, −1.06, and −0.34 m3 decreases, respectively. In this period, most cities were mainly driven by negative urban effects. Shanghai’s positive urban effect was the only main contributor. Compared with urban effects, rural effects had relatively small driving forces in most cities.
From 2013 to 2018, the urban effect of most cities was positive, with increases of 2.15 m3 in Beijing, 0.98 m3 in Qingdao, 3.34 m3 in Shanghai, and 9.81 m3 in Xiamen, thereby reflecting a decrease in water efficiency in most urban areas. By contrast, the Tianjin urban effect reflected a −20.67 m3 drop, the only city with increasing water utility efficiency. Rural effects had a similar trend, in which only Tianjin decreased by −4.27 m3, whereas Beijing, Qingdao, Shanghai, and Xiamen contributed positively with 0.24, 0.28, 0.41, and 0.98 m3 uplifts, respectively. The urban and rural areas in Tianjin had an improvement in water saving. In this period, most cities were mainly driven by positive urban effects. Tianjin’s negative urban effect was the only main contributor. Therefore, urban effects were maintained as the primary contributor to the city WF intensity effect throughout the whole period.
Since the WF intensity effect was related to crop yield, geographical conditions, and temperature changes in a certain area, we mainly analyze the city’s overall WF intensity effect here. From 2008 to 2018, the effect of Beijing and Tianjin inhibited WFP growth, while Qingdao, Shanghai, and Xiamen contributed positive effects. Compared with those in the former period, the effects of Beijing, Qingdao, and Xiamen turned to contribute positively in 2013–2018, and Shanghai continued to contribute positively during the two periods. Only Tianjin kept negative contributions from 2008 to 2018. This finding indicated the continuous improvement of water usage efficiency in Tianjin, but a decrease in water utility efficiency in other cities in 2013–2018. As Beijing and Tianjin were in the capital region, the water shortage issues may become more severe with climate change. The continuous improvement of water efficiency in these two cities indicated that cities with higher water pressure would have a more urgent need for water-saving technology promotion and emphasis on water usage efficiency optimization [45]. This is consistent with previous studies in the Beijing-Tianjin-Hebei region, that is, cities with water scarcity would have advantages in water usage efficiency [7,34]. Besides, since a large amount of water were consumed in agriculture production, Beijing has reduced its localized agricultural production and gradually become a consumer-oriented city, which may also be the reason for Beijing to have the negative WF intensity effect [46]. In this case, surrounding cities, especially Tianjin, would face increasing pressure on agricultural production, which may be the reason for Tianjin having the leading national irrigation efficiency [47].

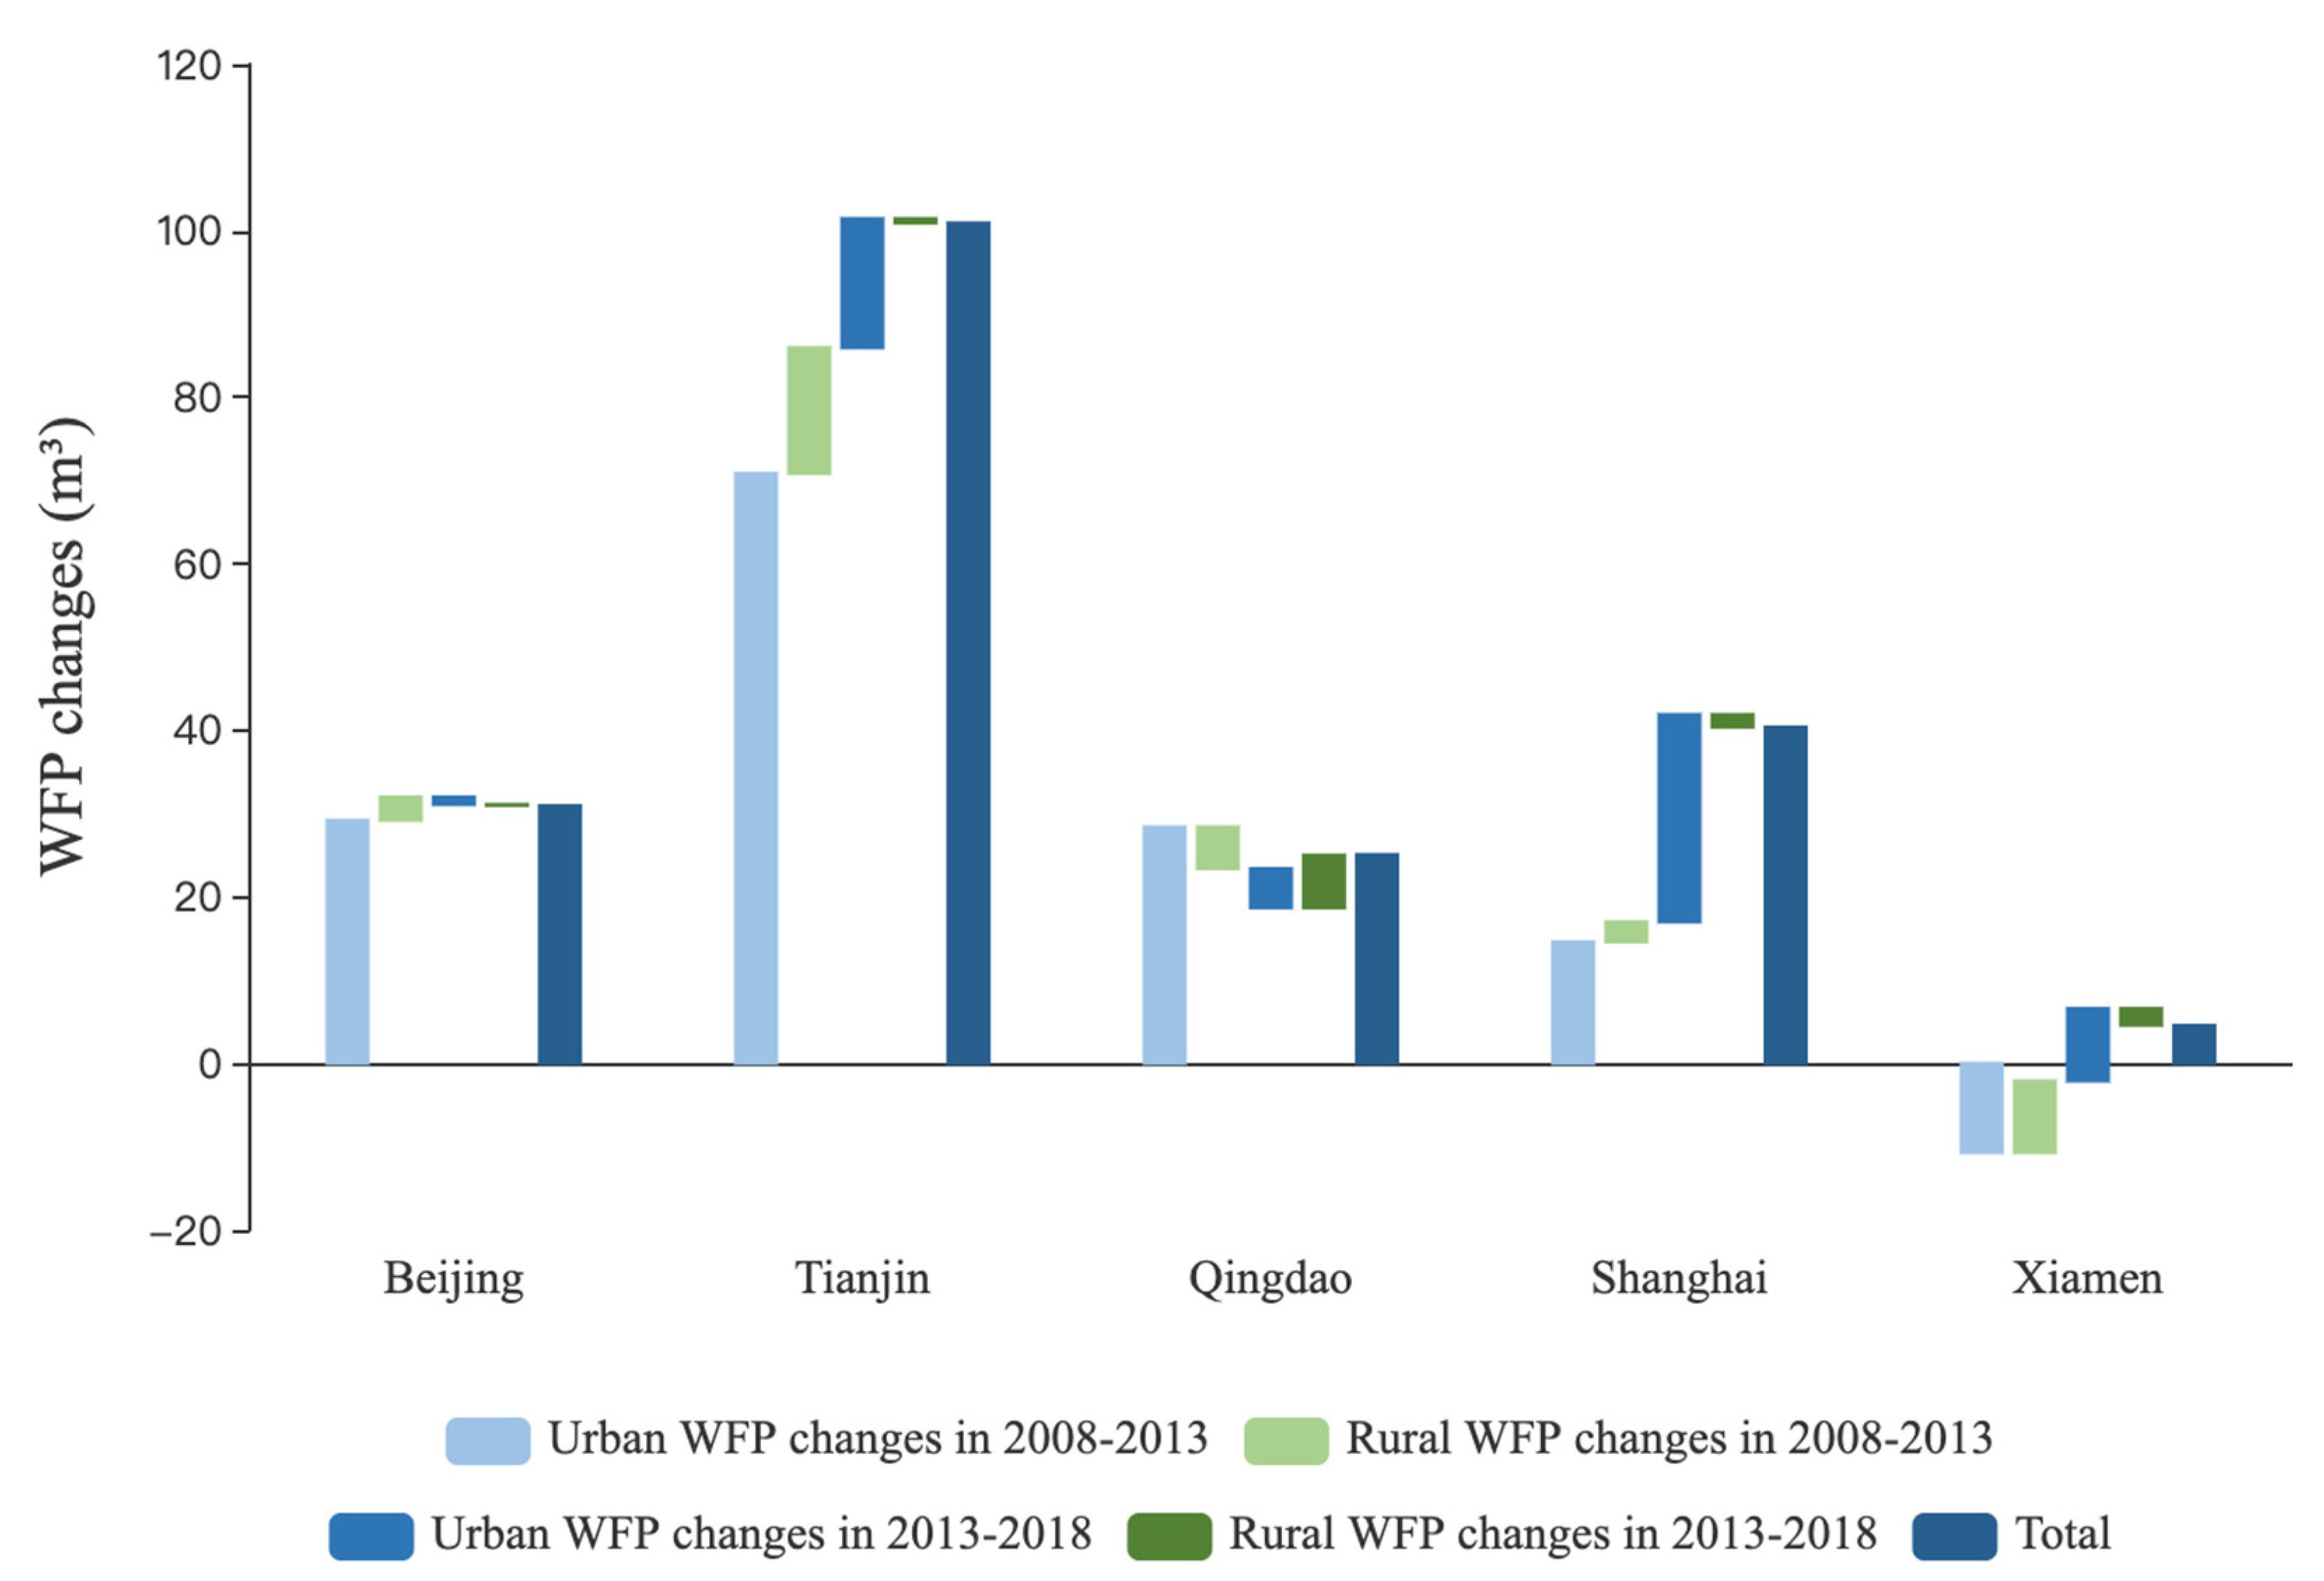
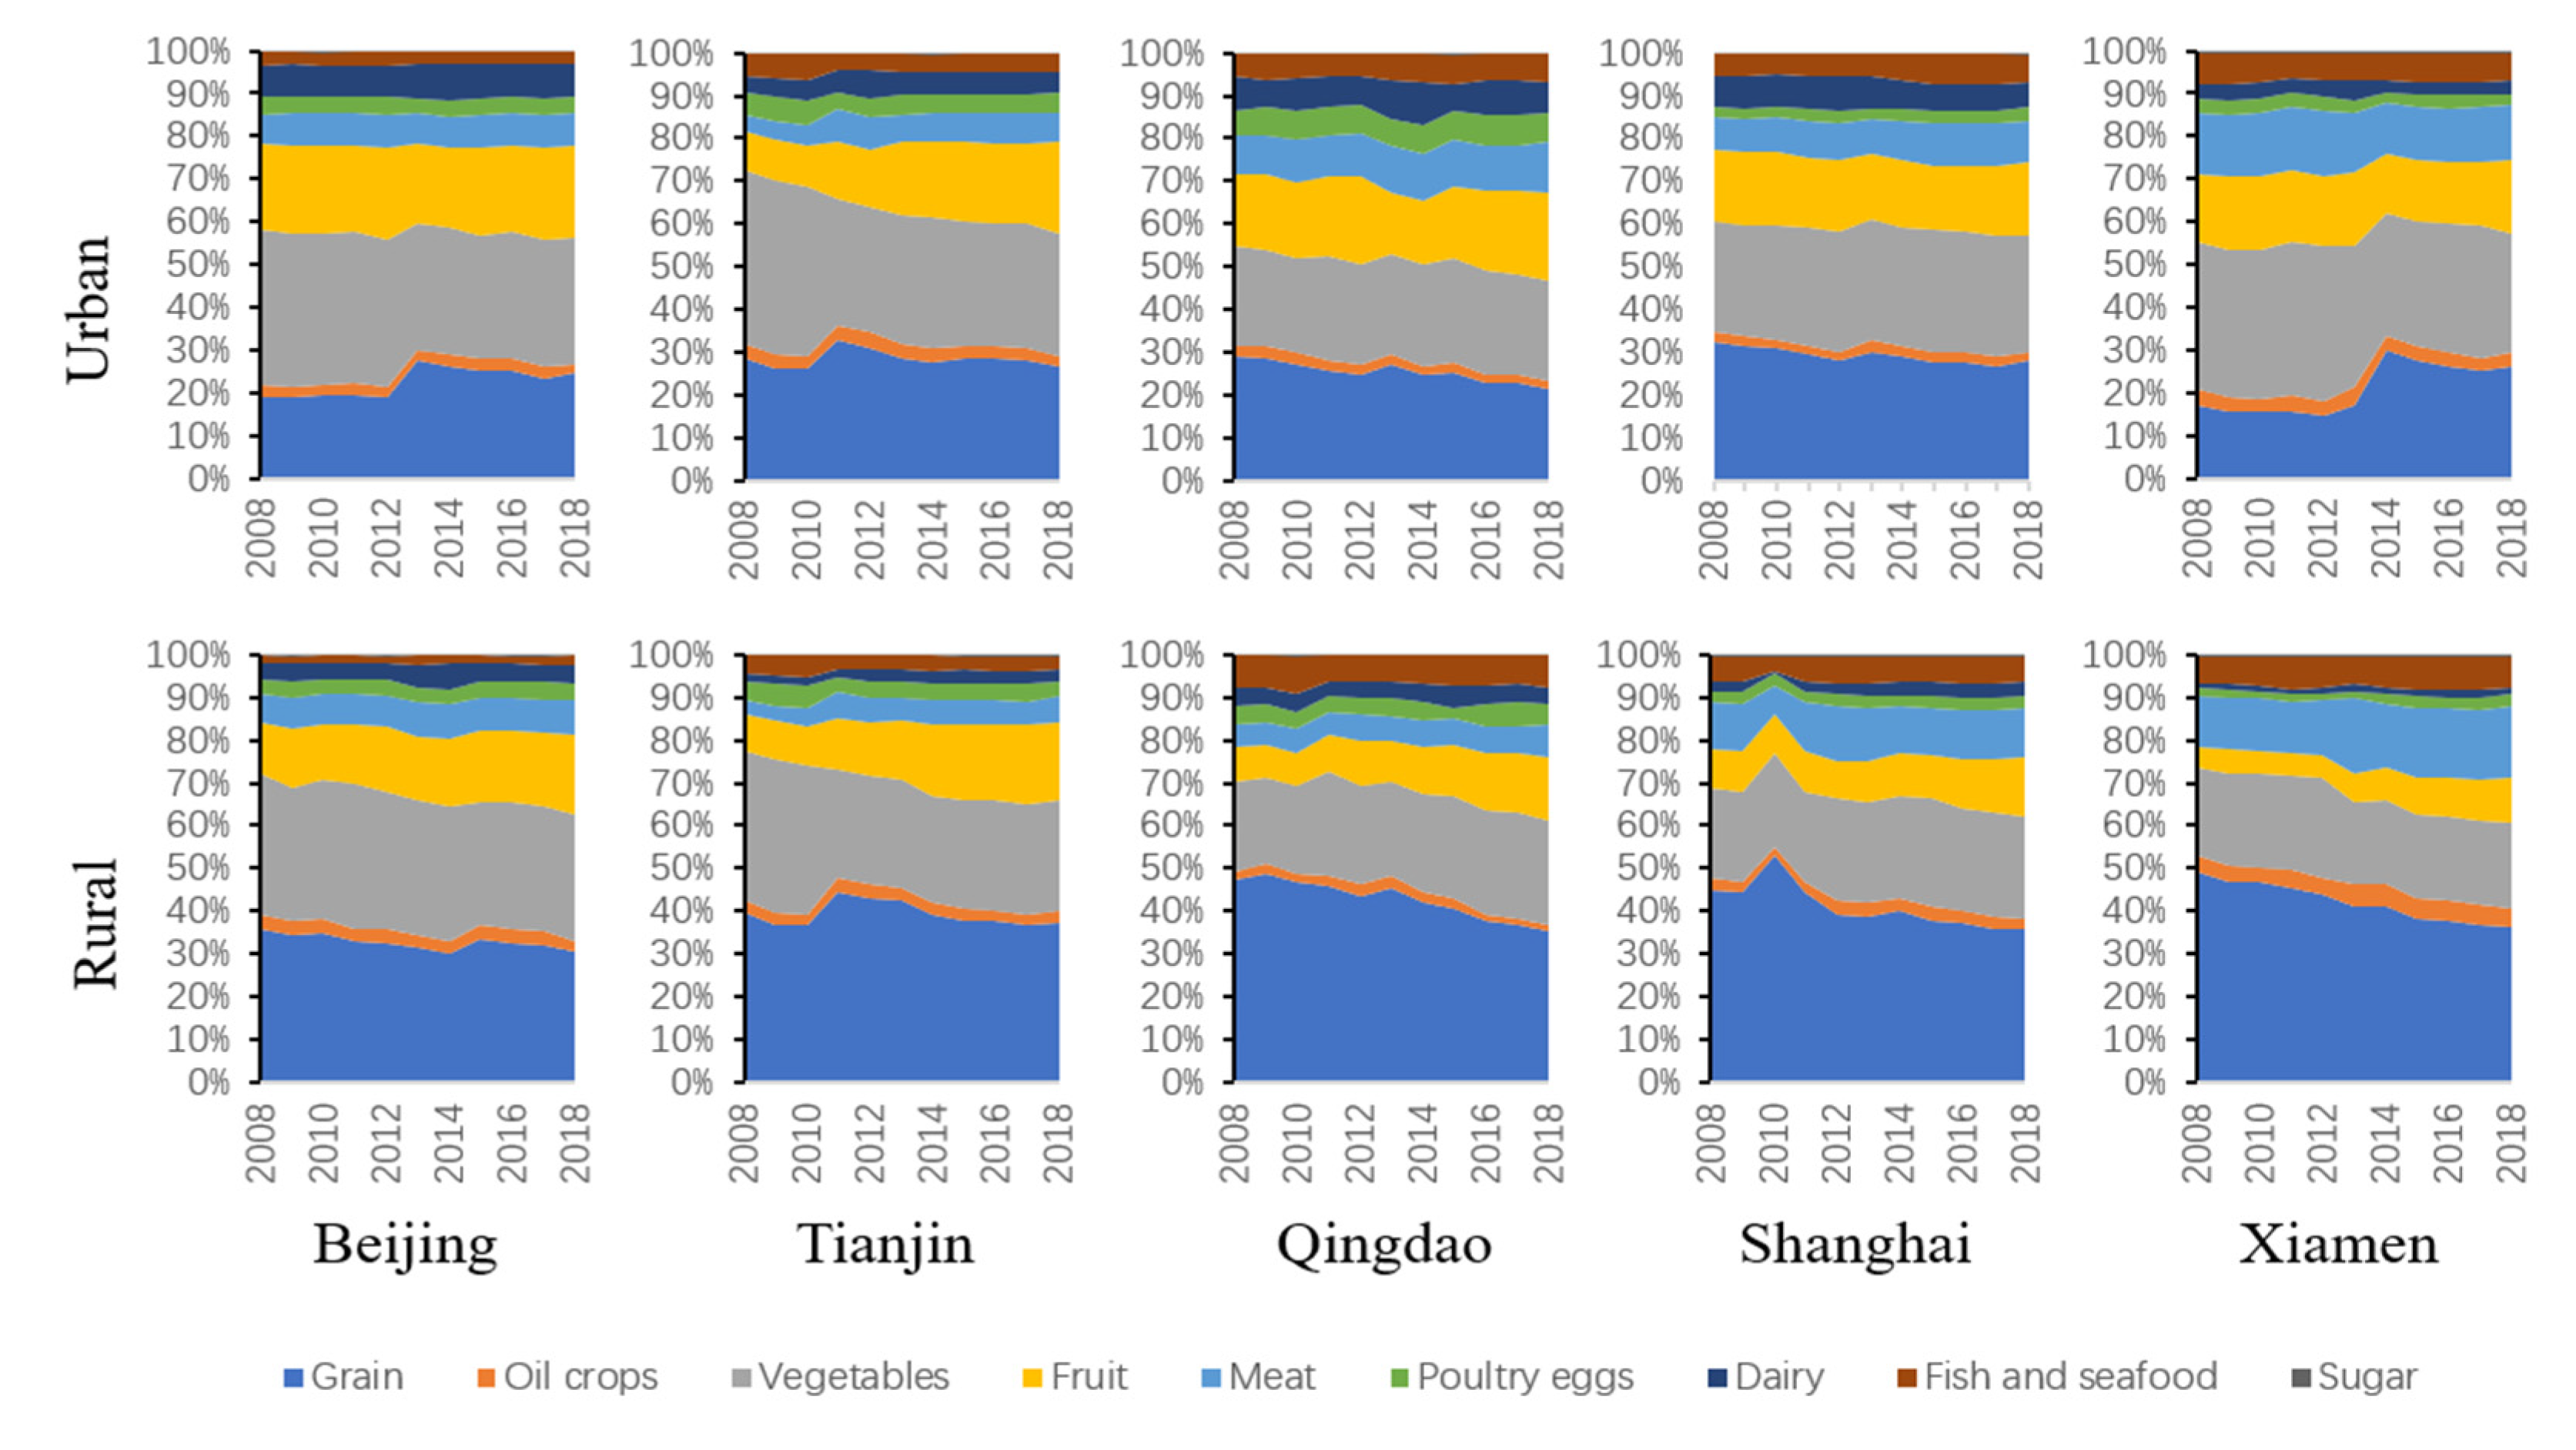
4.2.2. Food Consumption Structure Effect

Figure 5 shows the urban and rural food consumption structure effect of the five cities from 2008 to 2013 and from 2013 to 2018. The food consumption structure effects of all cities were all positive. For the driving forces that differed among each food type, the variations in the VWC values resulted in different contributions to WFP growth. In particular, meat products had the largest VWC value, followed by fish and seafood, poultry eggs, and dairy. For urban and rural areas, vegetarian products such as grain, vegetables, and fruits accounted for the major proportion of residential food consumption in all cities. Among the livestock products, meat, poultry eggs, dairy, and fish and seafood were allocated with major proportions. Details on the food consumption structure in these five cities are shown in Figure 6.
From 2008 to 2013, the urban effect of most cities showed a strong positive driving force with growths of 29.23 m3 in Beijing, 70.85 m3 in Tianjin, 28.41 m3 in Qingdao, and 14.63 m3 in Shanghai. The increase in meat and dairy consumption proportion mainly contributed to these positive forces. The Xiamen urban effect had a −10.68 m3 decrease, which was mainly due to the reduction in fish and seafood, meat, and poultry egg proportions. In addition, the rural effect only contributed negatively to Qingdao with a −4.97 m3 reduction due to the decline of fish and seafood and grain proportions. Beijing, Tianjin, Shanghai, and Xiamen had positive rural effects with 2.79, 15.50, 2.43, and 8.63 m3 growths, respectively. For the food structure, meat and dairy proportions increased in all cities and contributed primary positive forces. In this period, most cities were mainly driven by a positive urban effect, except for Xiamen, which was driven by the negative urban effect. The dominant positive urban effects caused a considerable change in food consumption structure in urban areas, which in turn altered the diet structure with a high WF. In addition, the rural effects mainly had positive driving forces in most cities, except for the negative effect in Qingdao. This finding indicates that the food structure in rural areas also changed gradually, although not as dramatically as that in urban areas.
From 2013 to 2018, the urban effect turned from positive to negative in Beijing and Qingdao, with −0.94 and −4.70 m3 reductions, respectively. The drop of grain and dairy proportions in both cities contributed to major negative driving forces. By contrast, Tianjin, Shanghai, and Xiamen had positive effects with 15.11, 24.93, and 8.67 m3 surges, respectively. The major positive effects were contributed by increases in meat, fruit, and fish and seafood proportions in Tianjin and Shanghai. While the meat proportion decreased in Xiamen, the positive effects driven by grain proportion growth were the primary contributors. The rural effects of Beijing, Tianjin, Shanghai, and Xiamen were opposite to those in the previous period, which turned from positive to negative with −0.13, −0.53, −1.51, and −2.05 m3 declines, respectively. The decrease in grain proportion contributed to the negative effects in these cities. Owing to the slow growth of meat proportion in Beijing and Tianjin, the positive effects were overridden by the negative effects contributing to the decrease in dairy and fish and seafood proportions. Otherwise, the negative rural effects of Shanghai and Xiamen were mainly driven by a reduction in meat proportion, which contributed from positive to negative. The rural effect only contributed positively to Qingdao with a 6.35 m3 increase, in which the increasing consumption proportions of meat and fish and seafood were the major contributors. In the current period, most cities were still driven by the urban effect, which was weaker than that in the previous period. The decline of positive urban effects revealed that the food consumption changes became minimal in the 2013–2018 period. The rural effect otherwise contributed negatively to WFP, indicating that the food consumption in rural areas was gradually stabilized.
From 2008 to 2018, urban effects were the major driving forces among the five cities except for Qingdao. This finding reflected an important food structure change in urban areas compared to that in rural areas. Urban residents in most cities had a great diet change in 2008–2013, and those in Shanghai tended to have a different diet in the latter period. Rural residential food structure also changed considerably in the first stage except for Qingdao, where people tended to keep the same diet preference in the 2013–2018 period.
Furthermore, cities showed similarity in diet changes. Food consumption structures gradually turned to livestock-rich diet preference, showing less demand for vegetarian products and high demand for meat products. However, a livestock-rich diet could be highly prevalent in rural areas because the people have a consistent tendency to increase their livestock product consumption. As the two most consumed vegetarian products, grain and vegetable consumption proportions had a downward tendency in most cities, except for the grain proportion growth in Xiamen urban areas and the vegetable proportion growth in Shanghai and Qingdao for urban and rural areas. Different from grain and vegetable products, the fruit proportion increased in the urban and rural areas of all cities, especially in Tianjin. The proportion of meat consumption generally increased among the five cities and only decreased in Xiamen urban areas. The proportion of poultry eggs and dairy varied among the five cities. The consumption proportion of poultry eggs only increased in Qingdao and Shanghai urban areas and decreased in Tianjin rural areas. Additionally, dairy proportion was increased in Beijing and Tianjin urban areas but was reduced in Qingdao rural areas. Given that livestock products have great VWC values, the growth in their consumption could lead to a high positive driving force on WFP in cities.

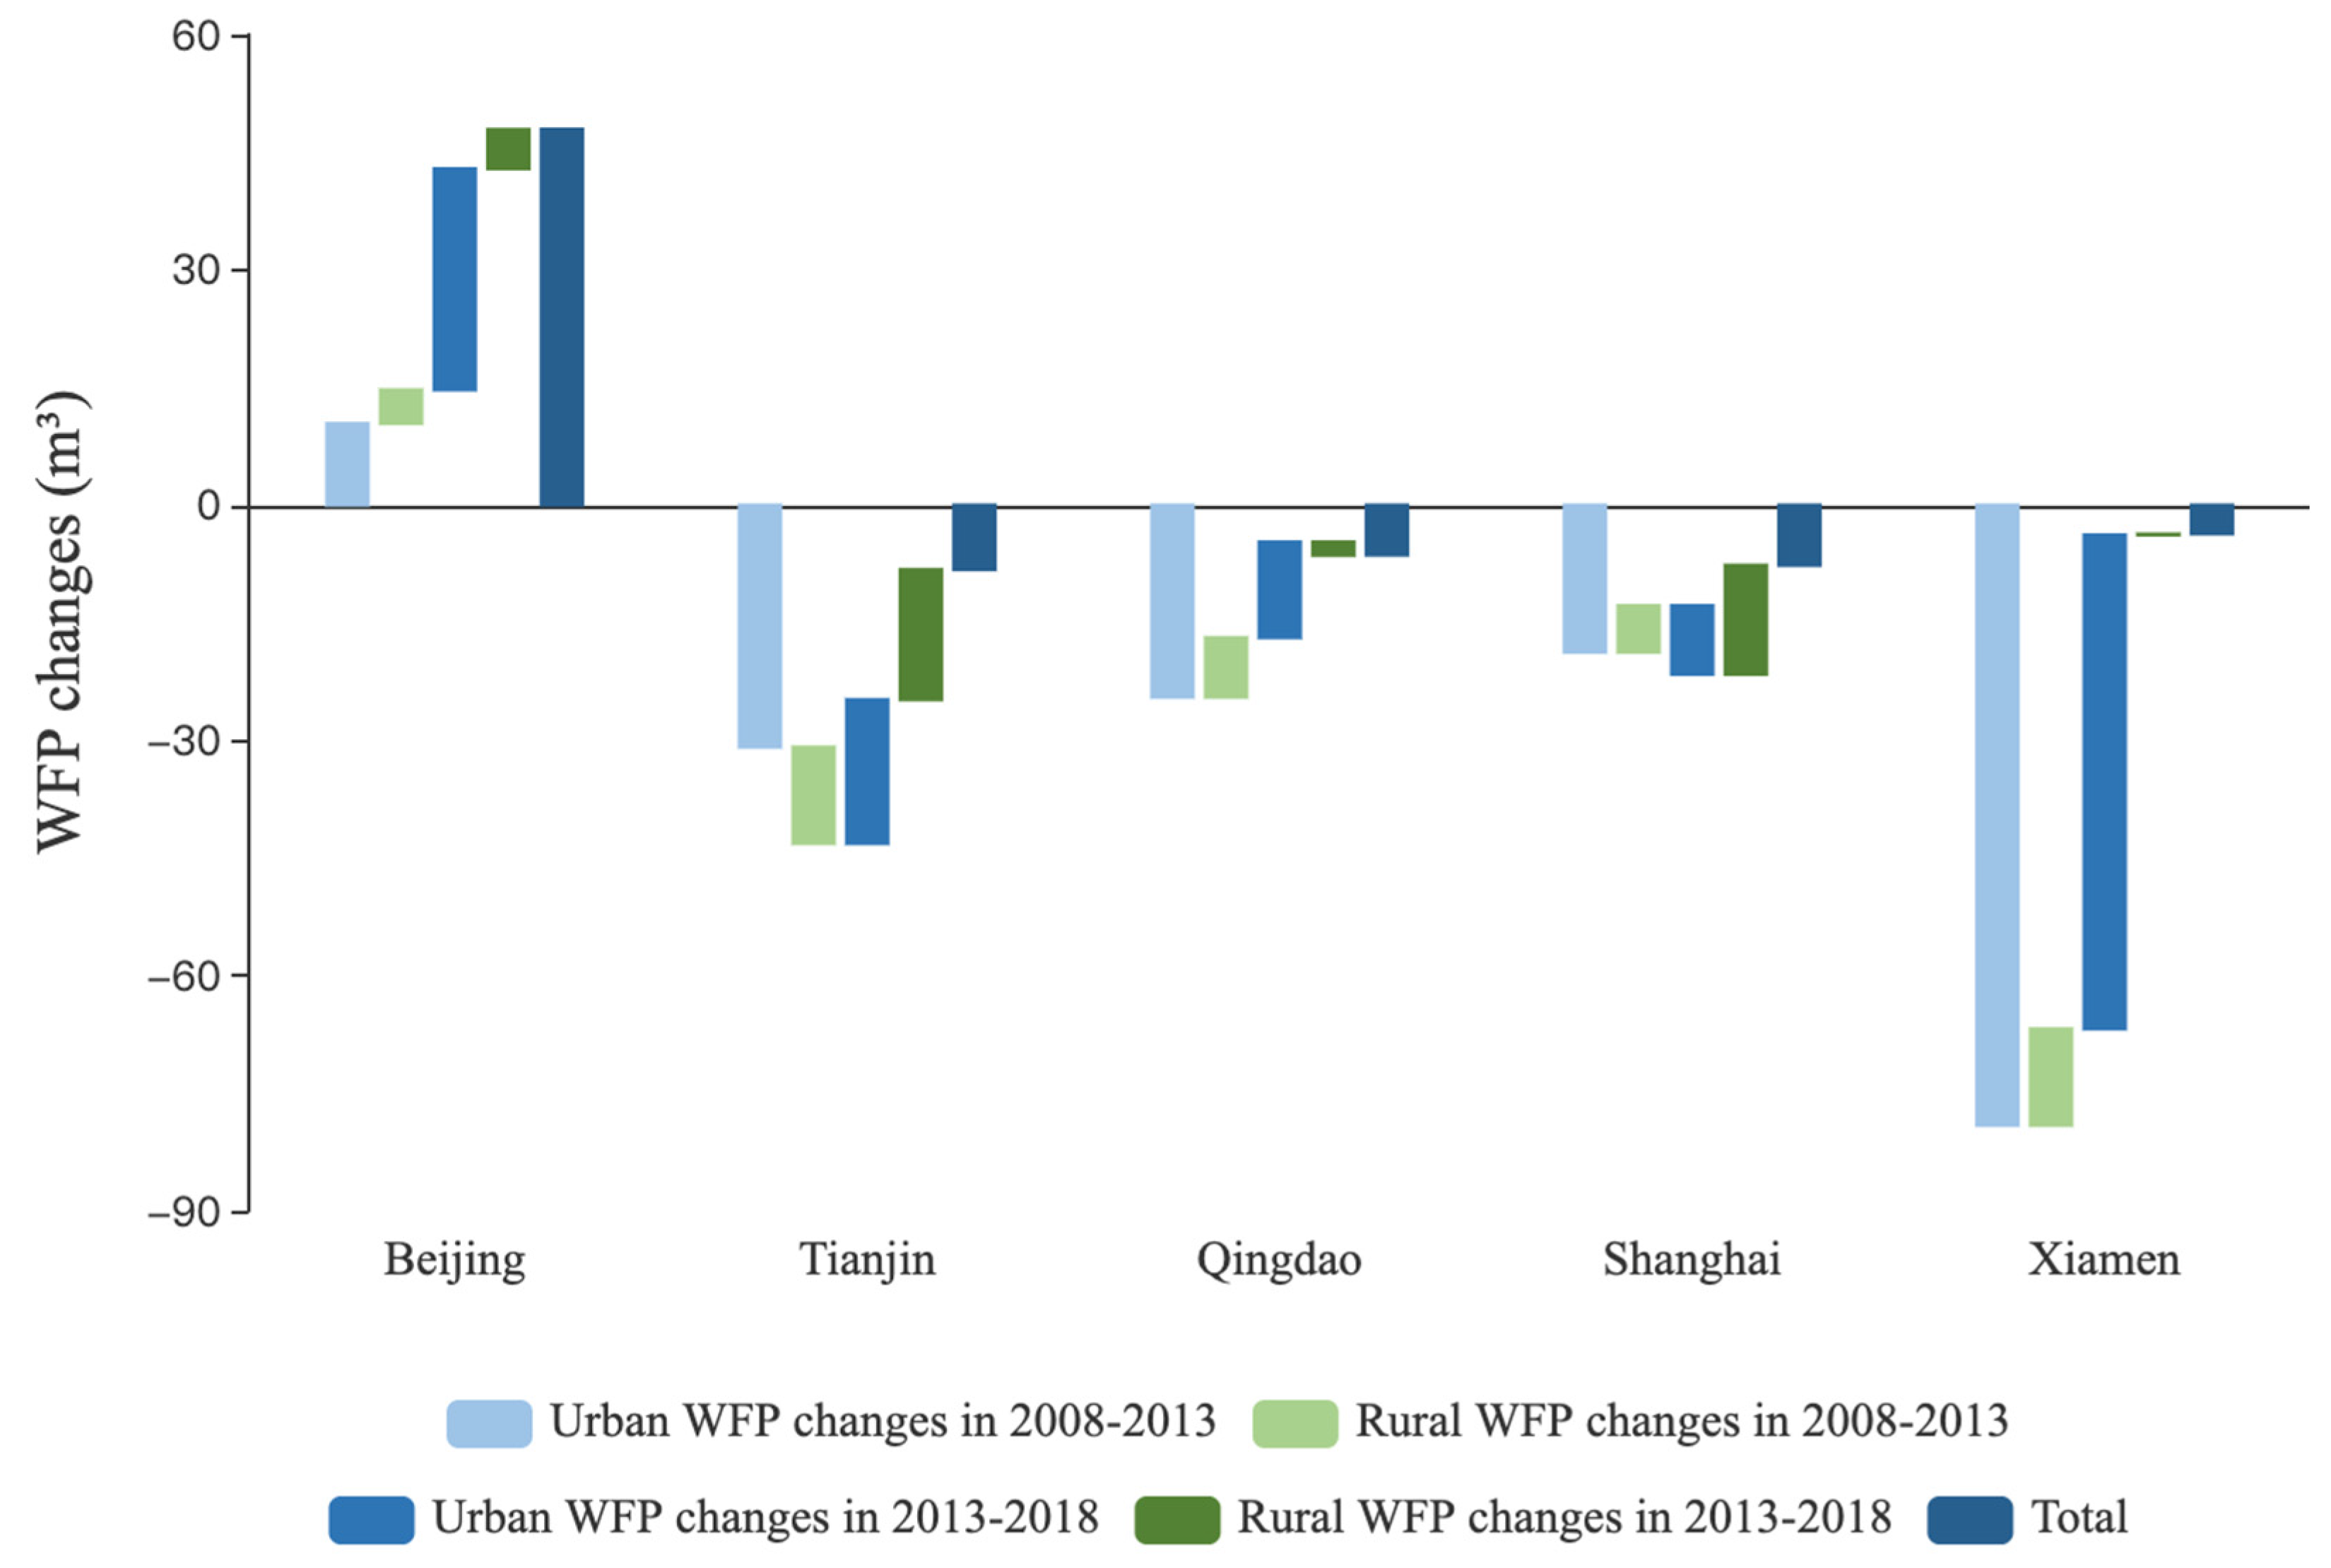
4.2.3. Food Consumption Level Effect

Figure 7 illustrates the urban and rural food consumption level effect of five cities from 2008 to 2013 and from 2013 to 2018. Beijing’s food consumption level contributed a positive effect, whereas Tianjin, Qingdao, Shanghai, and Xiamen had negative effects. Except Beijing where the urban effect had a 10.41 m3 increase, the urban effect of other cities showed a negative driving force with decreases of −30.87 m3 in Tianjin, −24.48 m3 in Qingdao, −18.77 m3 in Shanghai, and −79.13 m3 in Xiamen from 2008 to 2013. The rural effect only contributed negatively to Tianjin with a −12.29 m3 decline, but positively to Beijing, Qingdao, Shanghai, and Xiamen with 4.31, 7.61, 5.95, and 12.34 m3 increases, respectively. In this period, negative urban effects were the main contributors among most cities, except in Beijing, which was driven by a positive urban effect. This finding showed a remarkably downward urban residential food consumption level. Rural effects contributed positively to most cities, except in Tianjin with a negative rural effect. This result indicated that rural residents are willing to increase their food consumption level. The food consumption level growth in rural areas could be caused by the increased income of rural residents and logistics development. Benefiting from these occurrences, rural residents could easily consume food and own a border collection, leading to less dependence on local food resources. Thus, the rural food consumption level was on an upward trend and led to city WF growth.
From 2013 to 2018, only Shanghai urban effect, with a −8.76 m3 drop, maintained negative urban effects during the two periods. The urban effect of other cities shifted from negative to positive with increases of 28.20 m3 in Beijing, 18.35 m3 in Tianjin, 12.24 m3 in Qingdao, and 63.04 m3 in Xiamen. The rural effect only contributed negatively to Qingdao with a −1.75 m3 reduction, but contributed positively to Beijing, Tianjin, Shanghai, and Xiamen with 5.02, 16.58, 13.91, and 0.08 m3 uplifts, respectively. In this period, the cities were mainly driven by positive urban effects. The positive rural effect was only evident in Shanghai. These changes in urban effect suggested that urban residents in most cities consumed more food in this period than in the previous period. Meanwhile, a continuous decline was observed in the Shanghai urban residential food consumption level. Most cities still had positive rural effects, except for Qingdao, indicating that rural residents in most cities preferred to continuously increase their food consumption level.
From 2008 to 2018, the urban effect was the major contributor to WFP in most cities, except Shanghai. In terms of urban effect, the negative effects of most cities in the 2008–2013 period were greater than the positive effect in the later period. This finding indicates a downward tendency of urban residential food consumption level and fluctuations between the two periods. However, only Beijing urban residents showed high demands for increased food consumption during the whole period. The growing food demand of Beijing residents could possibly be due to a higher living standard in this city, which has been indicated in other researches [7,34]. For the rural effect, the positive effects of Qingdao and Xiamen were reduced in the 2013–2018 period, reflecting a slow growth of food consumption level in Xiamen and a reduction in Qingdao. By contrast, Beijing, Tianjin, and Shanghai had a great positive effect in the 2013–2018 period. The continuous growth of rural effect displayed the growing food consumption demand of rural residents in these cities.
Comparing the effects of urban and rural areas, the urban population’s reductions in food consumption level had strong negative driving forces on the overall WF of cities due to the large urban population base. The general decline in the consumption level of urban residents could be related to the “clear your plate” campaign conducted in China, where food-saving regulations and publicity activities were carried out among cities. The concept of food saving may be more popular among urban residents. The declining food consumption has inhibited the WFP growth. However, it cannot be ignored that consumption in rural areas continues to rise. While the rural population continues to move to cities, the positive effect led by the increase in the rural food consumption level on the WFP growth should be concerned.

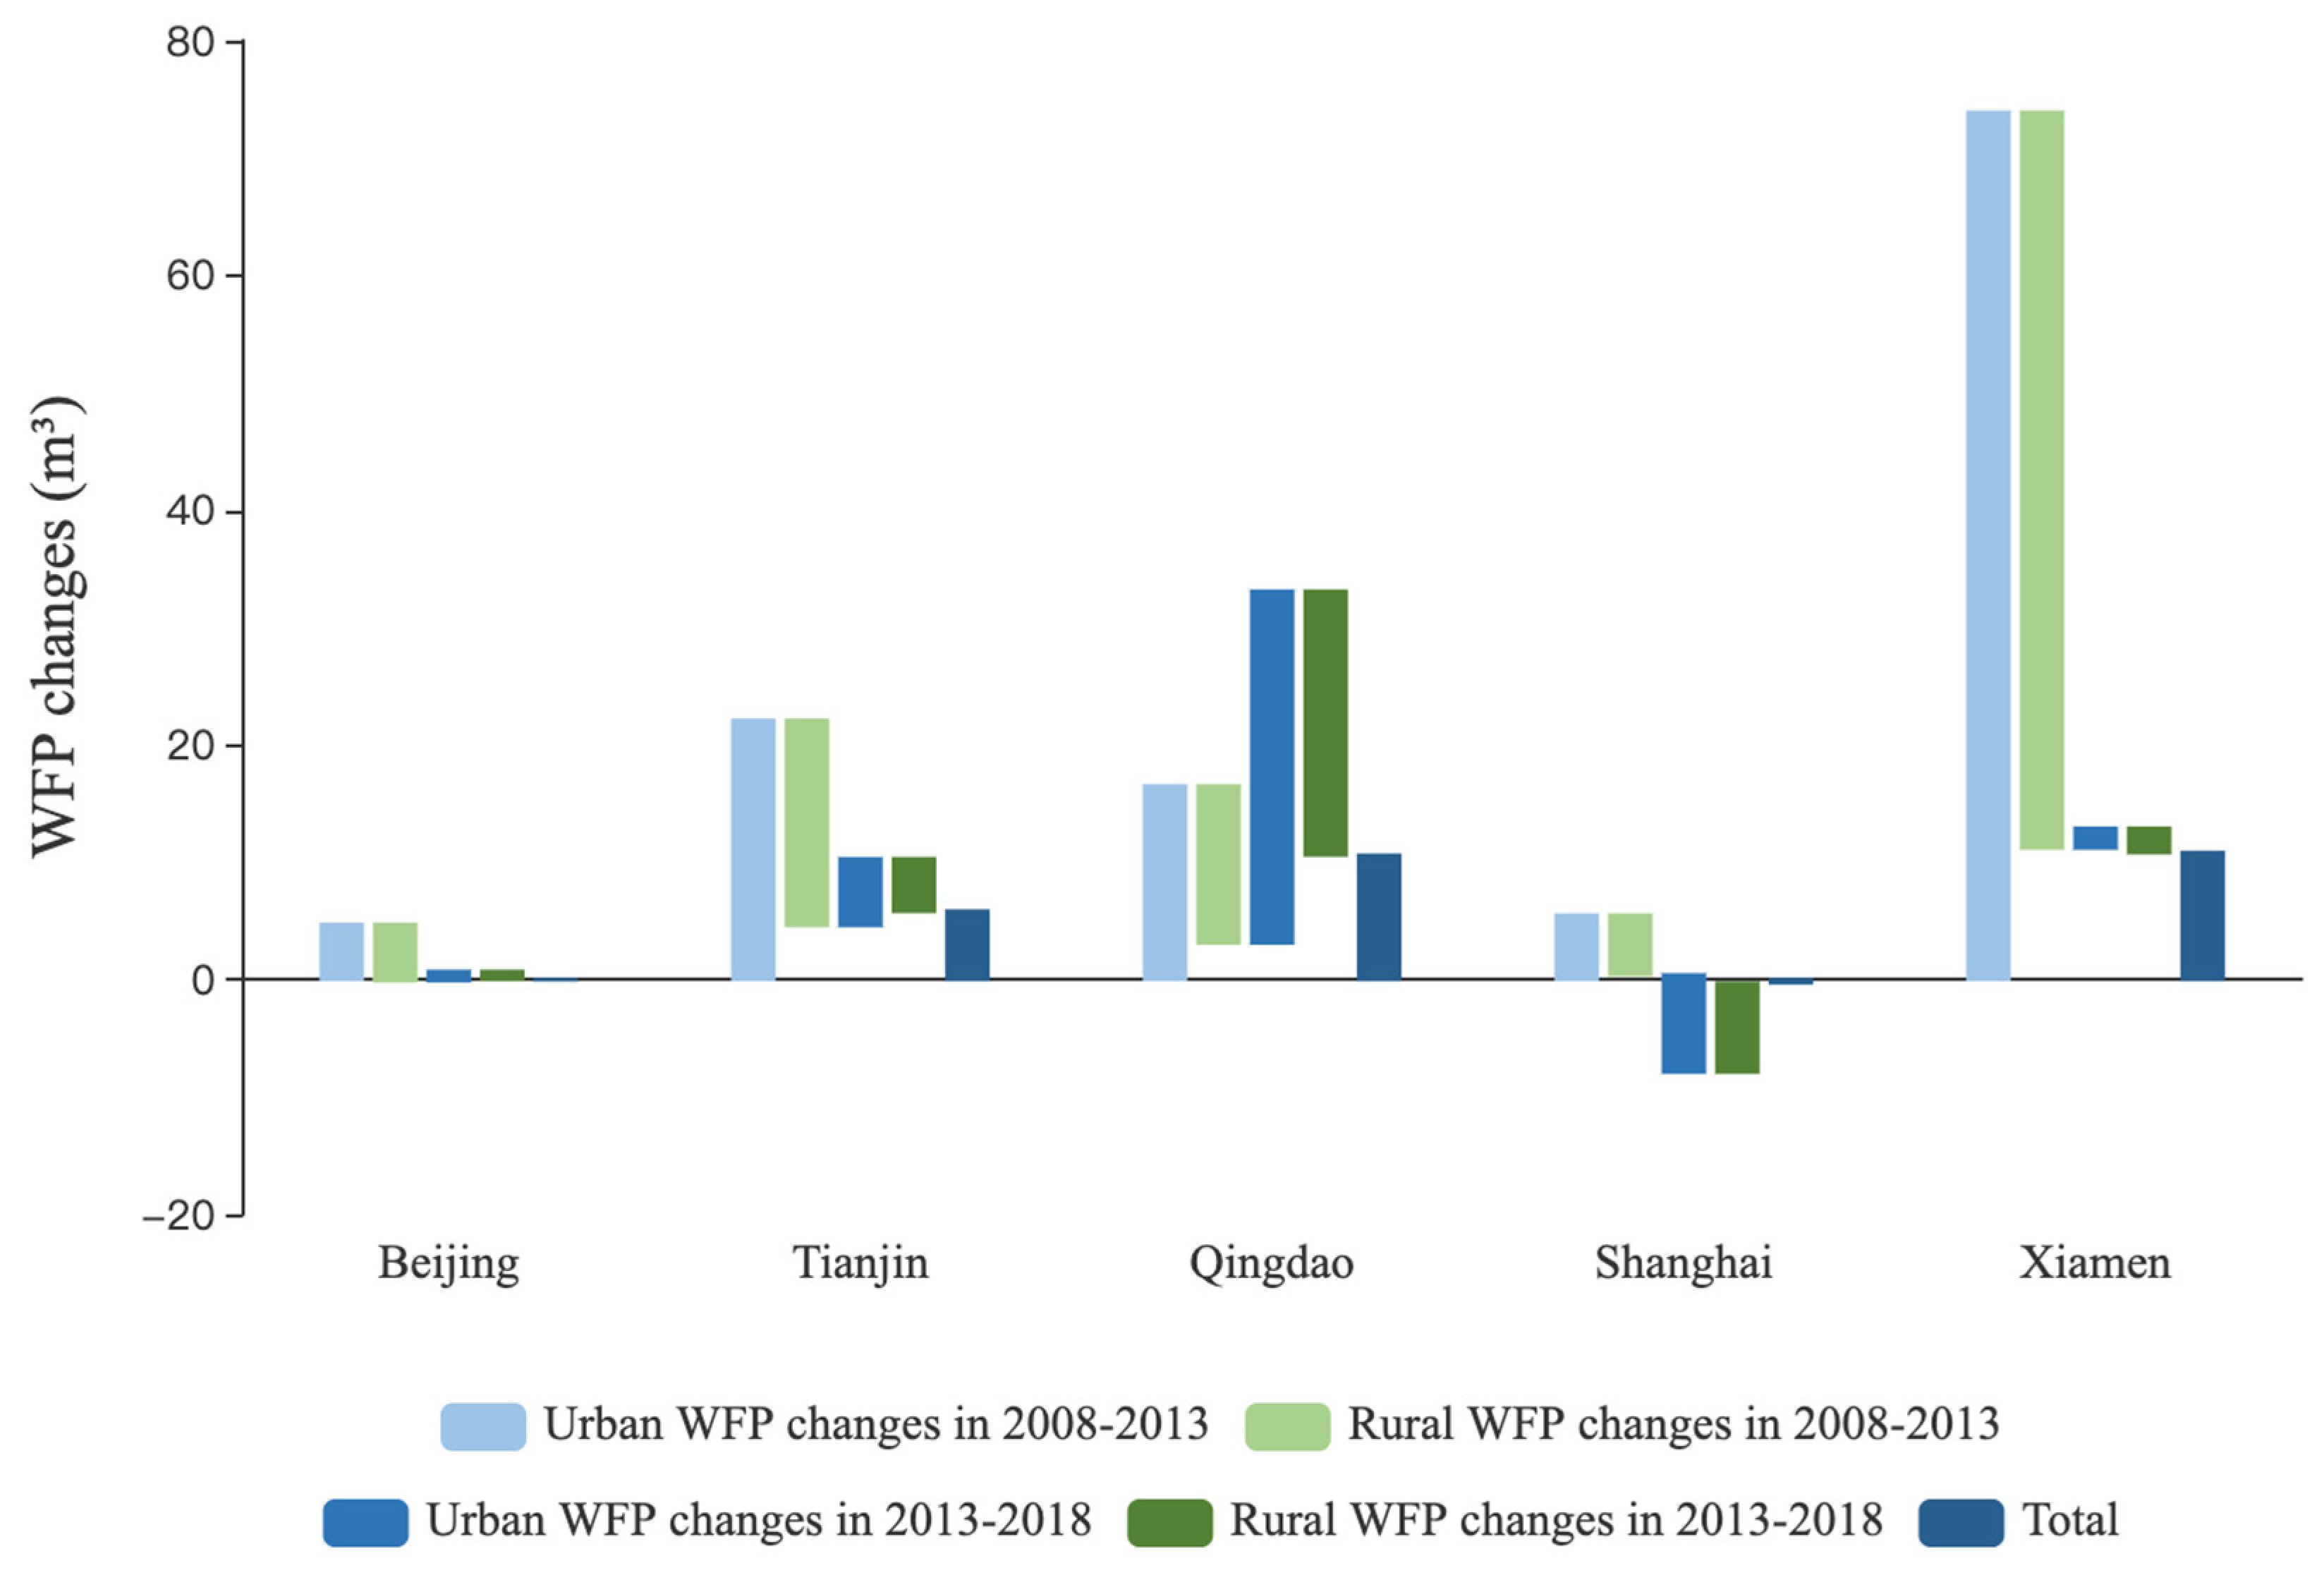
4.2.4. Urbanization Effect

Figure 8 illustrates the urban and rural urbanization effects of the five cities from 2008 to 2013 and 2013 to 2018. The urbanization effect contributed negatively to Beijing and Shanghai but positively to Tianjin, Qingdao, and Xiamen. From 2008 to 2013, the urban effects contributed positively to all cities, among which Xiamen had the highest growth with 73.85 m3, followed by Tianjin, Qingdao, Shanghai, and Beijing, with 22.10, 16.45, 5.56, and 4.69 m3 surges, respectively. All cities had negative rural effects, among which Xiamen still had the largest driving force with a −62.67 m3 decrease, followed by Tianjin, Qingdao, Shanghai, and Beijing with −17.50, −13.37, −5.18, and –4.82 m3 reductions, respectively. In this period, most cities were mainly driven by positive urban effects, with Beijing the only city driven by the negative rural effect. The positive driving forces reflected a boom in the urban population from 2008 to 2013, especially in Tianjin, Xiamen, and Qingdao. This boom resulted in the rapid growth of WFP. The negative rural effects caused by rural population reduction was otherwise offset on city WFP growth.
Except Shanghai, where the urban effect had a −8.29 m3 decrease, the urban effect of other cities showed positive driving forces with growths of 0.85 m3 in Beijing, 5.74 m3 in Tianjin, 30.05 m3 in Qingdao, and 1.72 m3 in Xiamen from 2013 to 2018. The rural effect contributed positively only to Shanghai with a 7.62 m3 growth but negatively to Beijing, Tianjin, Qingdao, and Xiamen with −0.74, −4.49, −22.53, and −2.08 m3 declines, respectively. In this period, positive urban effects were still the main contributors among most cities, except for Shanghai, which was driven by the negative urban effect. Rural effects continuously contributed negative driving forces, whereas the Shanghai rural effect contributed positively. Other cities kept the continuous growth of the urban population, particularly Qingdao with the greatest urbanization growth. By contrast, Shanghai population reduced the urban area but increased the rural areas, showing a counter-urbanization tendency in the 2013–2018 period.
From 2008 to 2018, urban effects contributed positively to WFP growth during urbanization, whereas negative rural effects inhibited the WFP growth, mainly by offsetting the positive urban effect. Among the cities, the urbanization effect of Beijing and Shanghai contributed the weakest driving force on city WFP growth. As first-tier cities, these cities have almost completed urbanization progress since 2008. Owing to the strict urban population inflow control policy, these cities had minimal population structure changes between 2008 and 2018, and even experienced different counter-urbanization degrees during the research period. Therefore, the WFP caused by residential food consumption in megacities could be strictly controlled by keeping a stable population structure, in which the urbanization effect could only have a small driving force on WFP growth. Moreover, as a new first-tier megacity, Tianjin had a substantially positive urbanization effect on WFP growth similarly to two second-tier cities, namely, Qingdao and Xiamen. The strong positive driving force of urbanization effects indicates the considerable changes in population structure in these cities, namely, the upsurge in the urban population and the drop in rural populations. Specifically, Tianjin and Xiamen had rapid urbanization progress in 2013–2018, whereas Qingdao sped up the urbanization process in 2013–2018. In other words, the rapid growth of the urban population has put pressure on city water resources.
Therefore, although previous studies have put forward concerns about the pressure of the continued urbanization process on water resources [8,35,36], in fact, the change of population structure during rapid urbanization may be the influencing factors that hindered the WFP growth. This calls for cities to have a well-planned urbanization process and an overall view of the resource carrying capacity. With proper planning and restrictions on population inflow, urbanization could impose fewer threats to urban water resources. This could provide guidelines for cities under low urbanization level to develop sustainable practices.

5. Conclusions

The WFP generated by food consumption from 2008–2018 was calculated in five East China cities: Beijing, Tianjin, Qingdao, Shanghai, and Xiamen. By using LMDI decomposition, this paper investigated the driving force of WF intensity effect, food consumption structure effect, food consumption level effect, and urbanization effect on the whole city’s food consumption WFP changes, with a focus on urban and rural aspects. The main conclusions and policy suggestions are drawn as follows:
(1)
The WFP related to food consumption showed a rolling upward tendency in the five East China cities. The largest contributor to WFP was meat proportions, which had an upward trend during the research periods, followed by grains, which had a decreasing trend. Decomposition results show that the major driving factor was food consumption level for Beijing and food consumption structure for Beijing Tianjin, Qingdao, and Shanghai. Xiamen was primarily driven positively by the urbanization effect.
(2)
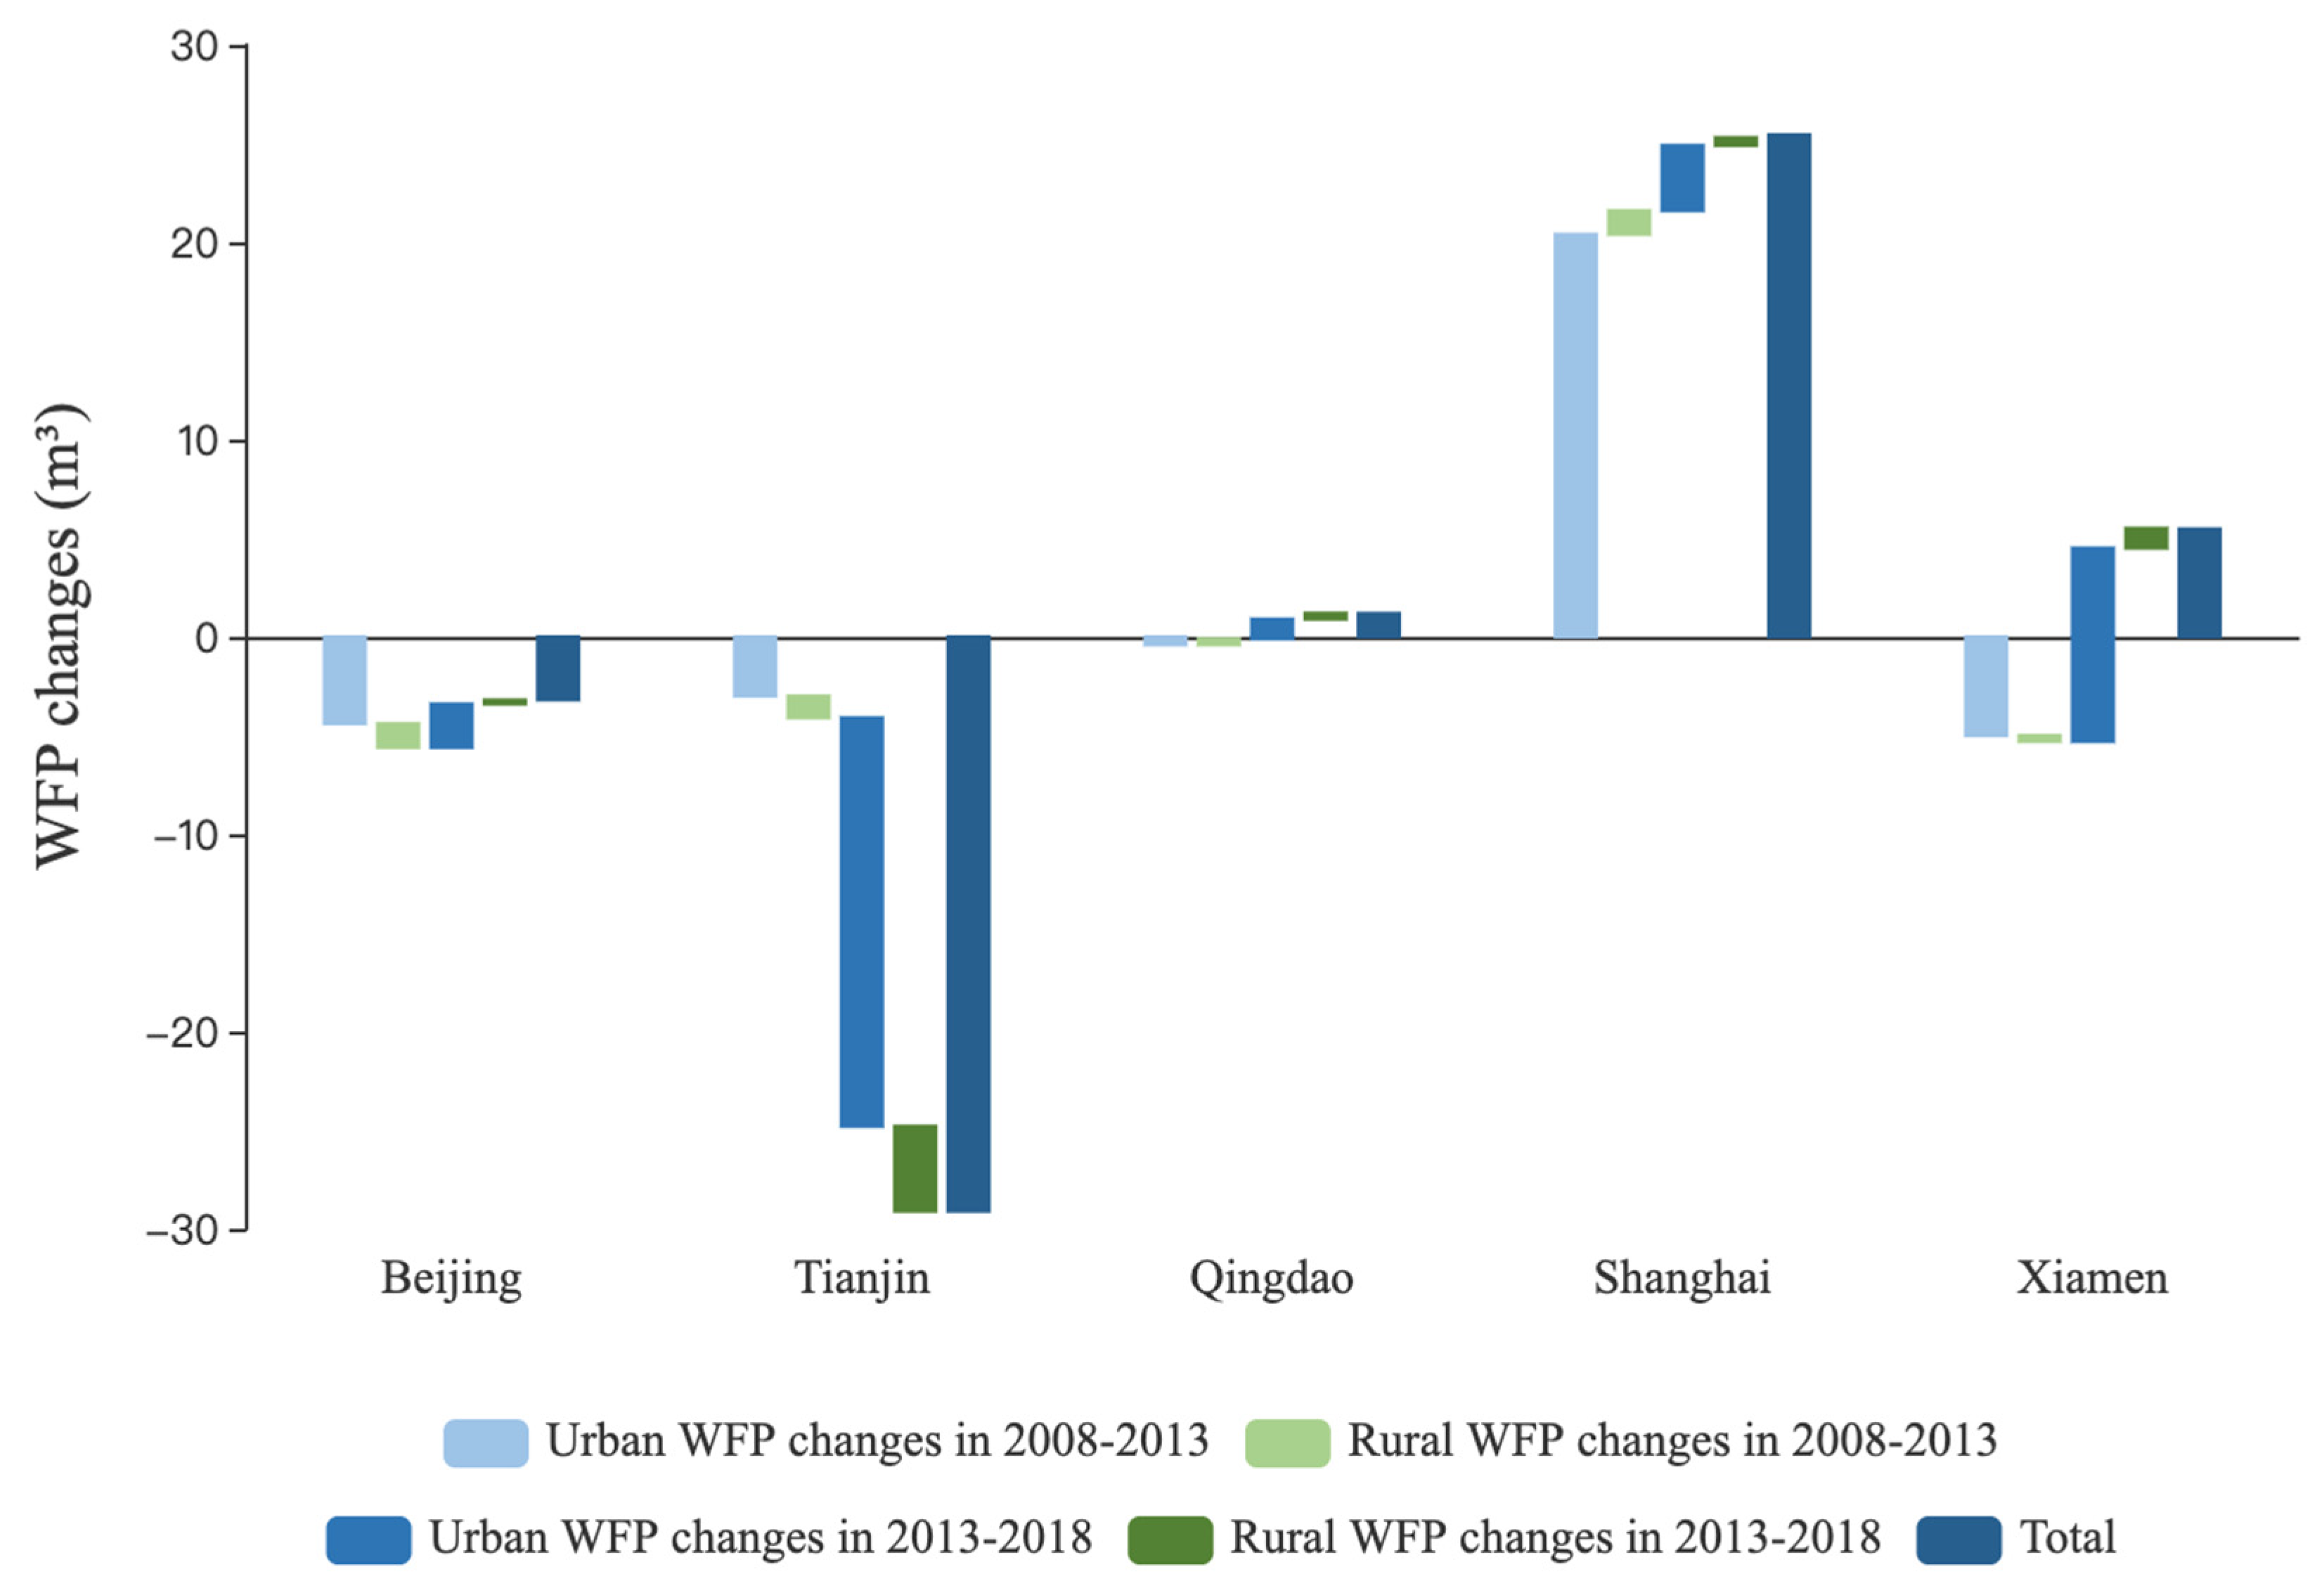
Food consumption structure was the primary factor promoting the WFP growth among the five cities. Urban effects were the major contributing driving forces. In most cities, urban and rural residents have dramatically changed their eating habits, especially in the 2008–2013 period. The changed eating habits were mainly reflected by the reduced grain and vegetable consumption proportion and the overall increase in the proportions of meat, poultry eggs, and dairy consumption, especially in rural areas. Improving water resources utilization by guiding a balanced diet could be an efficient way for urban sustainable development.
(3)
The food consumption level effect mainly inhibited the WFP growth in most cities, except Beijing. Urban residents mainly had a downward tendency of food consumption level throughout the research period, leading to major driving forces. On the contrary, rural effects kept positive contributions to WFP growth in most cities. Rural residents have raised the demand for consuming more food mainly due to their increased income level and logistics development. On the premise of satisfying daily nutrition, encouraging residents to raise food-saving awareness could reduce the impact of food consumption level on the WFP growth.
(4)
The urbanization effect was limited in two megacities: Beijing and Shanghai. Stable urbanization level and restrictions on urban population inflow in these two cities evidently inhibited the WFP growth. However, the positive effect led to WFP growth in Tianjin, Qingdao, and Xiamen due to the booming population during rapid urbanization. While the urbanization effects of each city differed between urban and rural areas, the strong offsetting between urban and rural effects weakened the driving forces of city urbanization effects. Cities currently at a low level of urbanization could develop more sustainably by addressing attentions on future water usage and urban population planning.
(5)
The WF intensity effect contributed negatively to Tianjin and Beijing but promoted WFP growth in other cities. The differences in water efficiency in temporal and spatial might be due to the high water-saving awareness led by the South-to-North Water Diversion Project in cities located in the Beijing-Tianjin-Hebei region and the leading irrigation technologies in Tianjin and Beijing. The better performance in Beijing and Tianjin pointed out that there is still room for other cities to improve their water utilization efficiency and irrigation technology.
Regarding current water usage in the five cities, improvements in irrigation technologies should always be encouraged to save water in production. Also, compared with developing irrigation technology and constructing water conservancy facilities, raising residents’ awareness of food consumption would be a more efficient and flexible way to save water. A higher intake of vegetarian products should be encouraged in daily food consumption to achieve a healthier and less-WF food consumption pattern. Public information, such as healthy diet guidelines and nutrition facts on labels, should be made available to citizens. Given the prevalence of a high WF diet in rural areas, a targeted diet guideline should be applied, especially for rural residents to set up a less-WF diet. Besides, under the premise of meeting nutritional needs, public education and practical consumption guideline should be brought up to encourage reductions in food losses and waste on the dinner table, especially during the COVID-19 pandemic, which that continuously challenges national food security.
It should be noticed that, due to data availability, this study conducted WF investigation among five coastal cities. In future research, more cities can be included to get more general rules of the WF driving forces.

Author Contributions

Conceptualization, J.L.; methodology, R.H. and Y.L.; formal analysis, R.H. and Y.T.; resources, Y.L.; writing—original draft preparation, R.H.; writing—review and editing, J.L. and X.L. All authors have read and agreed to the published version of the manuscript.

Funding

This research was funded by the Strategic Priority Research Program of the Chinese Academy of Sciences, XDA23020502 and the National Natural Science Foundation of China, 71573242.

Institutional Review Board Statement

Not applicable.

Informed Consent Statement

Not applicable.

Conflicts of Interest

The authors declare no conflict of interest.

References

  1. United Nations. Transforming our World: The 2030 Agenda for Sustainable Development; Report No. A/RES/70/1; United Nations: New York, NY, USA, 2015. [Google Scholar]
  2. Xu, Z.; Chen, X.; Liu, J.; Zhang, Y.; Chau, S.; Bhattarai, N.; Wang, Y.; Li, Y.; Connor, T.; Li, Y. Impacts of irrigated agriculture on food-energy-water-CO2 nexus across metacoupled systems. Nat. Commun. 2020, 11, 5837. [Google Scholar] [CrossRef]
  3. Chaudhary, A.; Gustafson, D.; Mathys, A. Multi-indicator sustainability assessment of global food systems. Nat. Commun. 2018, 9, 848. [Google Scholar] [CrossRef] [Green Version]
  4. Yang, C.; Cui, X. Global Changes and Drivers of the Water Footprint of Food Consumption: A Historical Analysis. Water 2014, 6, 1435–1452. [Google Scholar] [CrossRef] [Green Version]
  5. Vanham, D.; Pozo, S.d.; Pekcan, A.G.; Keinan-Boker, L.; Trichopoulou, A.; Gawlik, B.M. Water consumption related to different diets in Mediterranean cities. Sci. Total Environ. 2016, 573, 96–105. [Google Scholar] [CrossRef] [PubMed]
  6. Ministry of Water Resources the people’s Republic of China. China Water Resource Bulletin; Ministry of Water Resources the people’s Republic of China: Beijing, China, 2019.
  7. Sun, S. Water footprints in Beijing, Tianjin and Hebei: A perspective from comparisons between urban and rural consumptions in different regions. Sci. Total Environ. 2019, 647, 507–515. [Google Scholar] [CrossRef] [PubMed]
  8. Vanham, D.; Gawlik, B.M.; Bidoglio, G. Cities as hotspots of indirect water consumption: The case study of Hong Kong. J. Hydrol. 2017, 573, 1075–1086. [Google Scholar] [CrossRef]
  9. Ma, T.; Sun, S.; Fu, G.; Hall, J.W.; Ni, Y.; He, L.; Yi, J.; Zhao, N.; Du, Y.; Pei, T.; et al. Pollution exacerbates China’s water scarcity and its regional inequality. Nat. Commun. 2020, 11, 1–9. [Google Scholar] [CrossRef] [Green Version]
  10. Wu, Y.; Wnag, X.; Lu, F. Ecological Footprint and Water Footprint of Food Consumption in Beijing. Resour. Sci. 2011, 33, 1145–1152. (In Chinese) [Google Scholar]
  11. Zhang, Y.; Huang, K.; Yu, Y.; Yang, B. Mapping of water footprint research: A bibliometric analysis during 2006–2015. J. Clean. Prod. 2017, 149, 70–79. [Google Scholar] [CrossRef]
  12. Koop, S.H.A.; Leeuwen, C.J.v. Assessment of the Sustainability of Water Resources Management: A Critical Review of the City Blueprint Approach. Water Resour. Manag. 2015, 29, 5649–5670. [Google Scholar] [CrossRef] [Green Version]
  13. Hoekstra, A. Virtual water trade: A quantification of virtual water flows between nations in relation to international crop trade. In Proceedings of the International Expert Meeting on Virtual Water Trade 12, Delft, The Netherlands, 12–13 December 2003; pp. 25–47. [Google Scholar]
  14. Wang, Z.; Huang, K.; Yang, S.; Yu, Y. An input–output approach to evaluate the water footprint and virtual water trade of Beijing, China. J. Clean. Prod. 2013, 42, 172–179. [Google Scholar] [CrossRef]
  15. Chapagain, A.K.; Hoekstra, A.Y. Water Footprints of Nations; Unesco-IHE Institute for Water Education: Delft, The Netherlands, 2004. [Google Scholar]
  16. Jefferies, D.; Muñoz, I.; Hodges, J.; King, V.J.; Aldaya, M.; Ercin, A.E.; Canals, L.M.i.; Hoekstra, A.Y. Water Footprint and Life Cycle Assessment as approaches to assess potential impacts of products on water consumption. Key learning points from pilot studies on tea and margarine. J. Clean. Prod. 2012, 33, 155–166. [Google Scholar] [CrossRef] [Green Version]
  17. Chenoweth, J.L.; Hadjikakou, M.; Zoumides, C. Quantifying the human impact on water resources: A critical review of the water footprint concept. Hydrol. Earth Syst. Sci. 2014, 18, 2325–2342. [Google Scholar] [CrossRef] [Green Version]
  18. Su, W.; Chen, S.; Baležentis, T.; Chen, J. Economy-water nexus in agricultural sector: Decomposing dynamics in water footprint by the LMDI. Technol. Econ. Dev. Econ. 2020, 26, 240–257. [Google Scholar] [CrossRef] [Green Version]
  19. Chini, C.M.; Konar, M.; Stillwell, A.S. Direct and indirect urban water footprints of the United States. Water Resour. Res. 2017, 53, 316–327. [Google Scholar] [CrossRef]
  20. Novoa, V.; Ahumada-Rudolph, R.; Rojas, O.; Sáez, K.; Barrera, F.d.l.; Arumí, J.L. Understanding agricultural water footprint variability to improve water management in Chile. Sci. Total Environ. 2019, 670, 188–199. [Google Scholar] [CrossRef]
  21. Deng, G.; Ma, Y.; Li, X. Regional water footprint evaluation and trend analysis of China—based on interregional input–output model. J. Clean. Prod. 2016, 112, 4674–4682. [Google Scholar] [CrossRef]
  22. Fan, J.-L.; Wang, J.-D.; Zhang, X.; Kong, L.-S.; Song, Q.-Y. Exploring the changes and driving forces of water footprints in China from 2002 to 2012: A perspective of final demand. Sci. Total Environ. 2019, 650, 1101–1111. [Google Scholar] [CrossRef]
  23. Cai, J.; He, Y.; Xie, R.; Liu, Y. A footprint-based water security assessment: An analysis of Hunan province in China. J. Clean. Prod. 2020, 245, 118485. [Google Scholar] [CrossRef]
  24. Shi, C.; Yuan, H.; Pang, Q.; Zhang, Y. Research on the Decoupling of Water Resources Utilization and Agricultural Economic Development in Gansu Province from the Perspective of Water Footprint. Int. J. Environ. Res. Public Health 2020, 17, 5758. [Google Scholar] [CrossRef]
  25. Zhao, D.; Tang, Y.; Liu, J.; Tillotson, M.R. Water footprint of Jing-Jin-Ji urban agglomeration in China. J. Clean. Prod. 2017, 167, 919–928. [Google Scholar] [CrossRef]
  26. Huang, J.; Ridoutt, B.G.; Zhang, H.; Xu, C.; Chen, F. Water footprint of cereals and vegetables for the Beijing market: Comparison between local and imported supplies. J. Ind. Ecol. 2014, 18, 40–48. [Google Scholar] [CrossRef]
  27. Ridoutt, B.G.; Huang, J. Environmental relevance—the key to understanding water footprints. Proc. Natl. Acad. Sci. USA 2012, 109, E1424. [Google Scholar] [CrossRef] [PubMed] [Green Version]
  28. Herath, I.; Deurer, M.; Horne, D.; Singh, R.; Clothier, B. The water footprint of hydroelectricity: A methodological comparison from a case study in New Zealand. J. Clean. Prod. 2011, 19, 1582–1589. [Google Scholar] [CrossRef]
  29. Paterson, W.; Rushforth, R.; Ruddell, B.L.; Konar, M.; Ahams, I.C.; Gironás, J.; Mijic, A.; Mejia, A. Water Footprint of Cities: A Review and Suggestions for Future Research. Sustainability 2015, 7, 8461–8490. [Google Scholar] [CrossRef] [Green Version]
  30. Zhao, C.; Chen, B. Driving Force Analysis of the Agricultural Water Footprint in China Based on the LMDI Method. Environ. Sci. Technol. 2014, 48, 12723–12731. [Google Scholar] [CrossRef]
  31. Zhang, L.; Dong, H.; Geng, Y.; Francisco, M.-J. China’s provincial grey water footprint characteristic and driving forces. Sci. Total Environ. 2019, 677, 427–435. [Google Scholar] [CrossRef]
  32. Ang, B.W. LMDI decomposition approach: A guide for implementation. Energy Policy 2015, 86, 233–238. [Google Scholar] [CrossRef]
  33. Cao, Y.; Chai, L.; Yan, X.; Liang, Y. Drivers of the Growing Water, Carbon and Ecological Footprints of the Chinese Diet from 1961 to 2017. Int. J. Environ. Res. Public Health 2020, 17, 1803. [Google Scholar] [CrossRef] [Green Version]
  34. Kong, Y.; He, W.; Yuan, L.; Shen, J.; An, M.; Degefu, D.M.; Gao, X.; Zhang, Z.; Sun, F.; Wan, Z. Decoupling Analysis of Water Footprint and Economic Growth: A Case Study of Beijing–Tianjin–Hebei Region from 2004 to 2017. Int. J. Environ. Res. Public Health 2019, 16, 4873. [Google Scholar] [CrossRef] [Green Version]
  35. Kang, J.; Lin, J.; Zhao, X.; Zhao, S.; Kou, L. Decomposition of the Urban Water Footprint of Food Consumption: A Case Study of Xiamen City. Sustainability 2017, 9, 135. [Google Scholar] [CrossRef] [Green Version]
  36. Vanham, D.; Gawlik, B.M.; Bidoglio, G. Food consumption and related water resources in Nordic cities. Ecol. Indic. 2017, 74, 119–129. [Google Scholar] [CrossRef]
  37. FAO Database. Available online: http://www.fao.org/land-water/databases-and-software/en/ (accessed on 18 November 2020).
  38. Wang, F.; Liu, C.; Xu, Y. Analyzing Population Density Disparity in China with GIS-automated Regionalization: The Hu Line Revisited. Chin. Geogr. Sci. 2019, 20, 541–552. [Google Scholar] [CrossRef] [Green Version]
  39. Xiamen Municipal Bureau of Statistics. Yearbook of Xiamen Special Economic Zone; Xiamen Municipal Bureau of Statistics: Xiamenm, China, 2019. (In Chinese)
  40. Tianjin Municipal Bureau of Statistics. Tianjin Statistical Yearbook; Tianjin Municipal Bureau of Statistics: Tianjin, China, 2019. (In Chinese)
  41. Shanghai Municipal Bureau of Statistics. Shanghai Statistical Yearbook; Shanghai Municipal Bureau of Statistics: Shanghai, China, 2019. (In Chinese)
  42. Qingdao Municipal Bureau of Statistics. Qingdao Statistical Yearbook; Qingdao Municipal Bureau of Statistics: Qingdao, China, 2019. (In Chinese)
  43. Beijing Municipal Bureau of Statistics. Beijing Statistical Yearbook; Beijing Municipal Bureau of Statistics: Beijing, China, 2019. (In Chinese)
  44. National Bureau of Statistics of China. China Statistical Yearbook; China Statistical Press: Beijing, China, 2019. (In Chinese)
  45. Liao, X.; Zhao, X.; Jiang, Y.; Liu, Y.; Yi, Y.; Tillotson, M.R. Water footprint of the energy sector in China’s two megalopolises. Ecol. Model. 2019, 391, 9–15. [Google Scholar] [CrossRef]
  46. Xiong, X.; Zhang, L.; Zhang, P.; Chang, Y.; Wang, C. Dynamics of Urban Food Metabolism with Water-Carbon Footprint Respond: A Case Study of Beijing. J. Nat. Resour. 2018, 33, 1886–1896. (In Chinese) [Google Scholar]
  47. Ministry of Water Resources the People’s Republic of China. Tianjin: A National Demonstration City for Water-Saving. Available online: http://www.mwr.gov.cn/english/Medianews/201610/t20161017_765352.html (accessed on 19 November 2020).
Figure 1. Scope of Study area: Beijing, Tianjin, Qingdao, Shanghai, and Xiamen.
Sustainability 13 00409 g001
Figure 2. Food consumption WFP of five cities from 2008–2018.
Sustainability 13 00409 g002
Figure 3. Aggregate decomposition effect of WFP changes in five cities in China.
Sustainability 13 00409 g003
Figure 4. Accumulative contribution of water footprint intensity effect to WFP change in five cities’ urban and rural areas in 2008–2018.
Sustainability 13 00409 g004
Figure 5. Accumulative contribution of food consumption structure effect to WFP change in five cities’ urban and rural areas in 2008–2018.
Sustainability 13 00409 g005
Figure 6. Urban and rural food consumption structure in five cities in 2008–2018.
Sustainability 13 00409 g006
Figure 7. Accumulative contribution of food consumption level effect to WFP change in five cities’ urban and rural areas in 2008–2018.
Sustainability 13 00409 g007
Figure 8. Accumulative contribution of urbanization effect to WFP change in five cities’ urban and rural areas in 2008–2018.
Sustainability 13 00409 g008
Table 1. General information for five cities in Eastern China in 2018.
ItemsBeijingTianjinQingdaoShanghaiXiamen
Population (104 persons)215415609402424411
Area (km2)16,41111,96711,29363411700
per capita GDP (Yuan)140,211120,711128,459134,982118,015
Urbanization rate (%)86.5%83.1%73.7%88.1%89.1%
Per capita water resources (cμ.m/person)164113117160268
Sourced from: Beijing, Tianjin, Shanghai, Qingdao, and Xiamen Statistical Yearbooks and Water Resource Bulletin (2019).
Publisher’s Note: MDPI stays neutral with regard to jurisdictional claims in published maps and institutional affiliations.

