Examining the Effects of the Sacramento Dockless E-Bike Share on Bicycling and Driving
Abstract
1. Introduction
2. Materials and Methods
2.1. Sacramento Context
2.2. Survey Data
2.2.1. Household Survey
2.2.2. User Survey
2.3. Analysis
2.4. Limitations
3. Results
3.1. Bike-Share Adoption and Comparison of Users and Non-Users
3.2. Bicycling Before-and-After Bike-Share
3.3. Driving Before-and-After Bike-Share
4. Discussion
4.1. Bike-Share Adoption
4.2. The Effects of Bike-Share on Travel Behavior
5. Conclusions
Author Contributions
Funding
Institutional Review Board Statement
Informed Consent Statement
Data Availability Statement
Acknowledgments
Conflicts of Interest
Appendix A
| Days biked in last 7 days | |
| Priors | |
| Bicycling Frequency as ordered categories: | {Never, Not used in the last year, A few times per year, A few timers per month, A few times per week, Every day or almost every day} |
| Priors | |
| Weekly personal VMT and annual household VMT | |
| Priors | |
Appendix B. Model Parameter Summaries
| Parameter Description | Parameter | Mean | sd |
|---|---|---|---|
| Count Binomial Model | |||
| Intercept | 0.598 | 0.257 | |
| After bike-share (0/1) | −0.052 | 0.164 | |
| User survey (0/1) | 0.021 | 0.228 | |
| Ever used bike-share (0/1) | 0.286 | 0.193 | |
| Age (z-score) | −0.008 | 0.043 | |
| Woman (0/1) | −0.352 | 0.055 | |
| One Adult HH (0/1) | −0.220 | 0.071 | |
| No children HH (0/1) | 0.051 | 0.061 | |
| Two or more HH cars (0/1) | −0.431 | 0.063 | |
| No College Degree (0/1) | −0.100 | 0.096 | |
| Working (0/1) | −0.099 | 0.070 | |
| Student (0/1) | 0.141 | 0.134 | |
| >USD 50,000 HH income (0/1) | −0.291 | 0.110 | |
| Physical condition, cannot ride bike (0/1) | −0.532 | 0.140 | |
| Student × >USD 50,000 HH income (0/1) | 0.132 | 0.157 | |
| Zero-Inflated Bernoulli Model | |||
| Intercept | 0.591 | 0.461 | |
| After bike-share (0/1) | 0.107 | 0.225 | |
| User survey (0/1) | −0.297 | 0.294 | |
| Ever used bike-share (0/1) | −0.908 | 0.298 | |
| Age (z-score) | 0.125 | 0.066 | |
| Woman (0/1) | 0.486 | 0.096 | |
| One Adult HH (0/1) | 0.439 | 0.127 | |
| No children HH (0/1) | 0.178 | 0.111 | |
| Two or more HH cars (0/1) | 0.062 | 0.116 | |
| No College Degree (0/1) | −0.279 | 0.164 | |
| Working (0/1) | −0.248 | 0.125 | |
| Student (0/1) | −0.818 | 0.212 | |
| >USD 50,000 HH income (0/1) | −0.227 | 0.165 | |
| Physical condition, cannot ride bike (0/1) | 0.941 | 0.186 | |
| Student × >USD 50,000 HH income (0/1) | 0.430 | 0.258 | |
| Neighborhood Level Variation | |||
| Count Binomial Model | |||
| Std. dev. Intercept | 0.383 | 0.196 | |
| Std. dev. Ever used bike-share | 0.240 | 0.208 | |
| Std. dev. User survey | 0.372 | 0.256 | |
| Std. dev. After bike-share | 0.267 | 0.194 | |
| Zero-Inflated Bernoulli Model | |||
| Std. dev. Intercept | 0.759 | 0.321 | |
| Std. dev. Ever used bike-share | 0.340 | 0.324 | |
| Std. dev. User survey | 0.309 | 0.273 | |
| Std. dev. After bike-share | 0.392 | 0.242 | |
| Varying parameter correlations by neighborhood | |||
| Count Binomial Model | |||
| Cor. Intercept and Ever used bike-share | 0.044 | 0.380 | |
| Cor. Intercept and User survey | −0.131 | 0.355 | |
| Cor. Ever used bike-share and User survey | −0.061 | 0.379 | |
| Cor. Intercept and After bike-share | 0.169 | 0.354 | |
| Cor. Ever used bike-share and After bike-share | −0.028 | 0.372 | |
| Cor. User survey and After bike-share | −0.109 | 0.367 | |
| Zero-Inflated Bernoulli Model | |||
| Cor. Intercept and Ever used bike-share | −0.038 | 0.376 | |
| Cor. Intercept and User survey | 0.082 | 0.378 | |
| Cor. Ever used bike-share and User survey | −0.044 | 0.384 | |
| Cor. Intercept and After bike-share | −0.186 | 0.343 | |
| Cor. Ever used bike-share and After bike-share | 0.030 | 0.374 | |
| Cor. User survey and After bike-share | −0.022 | 0.374 |
| Parameter Description | Parameter | Mean | sd |
|---|---|---|---|
| Intercept [1] | −1.575 | 0.384 | |
| Intercept [2] | −0.659 | 0.383 | |
| Intercept [3] | 0.150 | 0.383 | |
| Intercept [4] | 1.061 | 0.383 | |
| Intercept [5] | 2.207 | 0.385 | |
| After bike-share (0/1) | −0.086 | 0.197 | |
| User survey (0/1) | 0.469 | 0.236 | |
| Ever used bike-share (0/1) | 0.884 | 0.247 | |
| Age (z-score) | −0.140 | 0.053 | |
| Woman (0/1) | −0.537 | 0.075 | |
| One Adult HH (0/1) | −0.254 | 0.102 | |
| No children HH (0/1) | −0.173 | 0.085 | |
| Two or more HH cars (0/1) | −0.153 | 0.093 | |
| No College Degree (0/1) | 0.084 | 0.134 | |
| Working (0/1) | 0.343 | 0.099 | |
| Student (0/1) | 0.916 | 0.187 | |
| >USD 50,000 HH income (0/1) | 0.251 | 0.141 | |
| Physical condition, cannot ride bike (0/1) | −1.076 | 0.169 | |
| Student × >USD 50,000 HH income (0/1) | −0.560 | 0.217 | |
| Neighborhood Level Variation | |||
| Std. dev. Intercept | 0.738 | 0.283 | |
| Std. dev. Ever used bike-share | 0.283 | 0.254 | |
| Std. dev. User survey | 0.266 | 0.223 | |
| Std. dev. After bike-share | 0.325 | 0.219 | |
| Varying Parameter Correlations by Neighborhood | |||
| Cor. Intercept and Ever used bike-share | −0.153 | 0.368 | |
| Cor. Intercept and User survey | −0.140 | 0.368 | |
| Cor. Ever used bike-share and User survey | −0.015 | 0.373 | |
| Cor. Intercept and After bike-share | −0.165 | 0.342 | |
| Cor. Ever used bike-share and After bike-share | 0.034 | 0.371 | |
| Cor. User survey and After bike-share | 0.023 | 0.377 |
| Parameter Description | Parameter | Mean | sd |
|---|---|---|---|
| Zero-VMT Binary Model (Hurdle) | |||
| Intercept | −0.082 | 0.420 | |
| After bike-share (0/1) | −0.074 | 0.333 | |
| User survey (0/1) | −0.058 | 0.456 | |
| Ever used bike-share (0/1) | 0.369 | 0.462 | |
| Age (z-score) | −0.234 | 0.105 | |
| Woman (0/1) | −0.223 | 0.150 | |
| One Adult HH (0/1) | −0.503 | 0.184 | |
| No children HH (0/1) | 0.514 | 0.208 | |
| Two or more HH cars (0/1) | −1.564 | 0.190 | |
| No College Degree (0/1) | −0.806 | 0.205 | |
| Working (0/1) | −0.498 | 0.186 | |
| Student (0/1) | −0.179 | 0.277 | |
| >USD 50,000 HH income (0/1) | −1.174 | 0.214 | |
| Student × >USD 50,000 HH income (0/1) | 0.370 | 0.347 | |
| Greater Than Zero-VMT Gamma Model | |||
| Intercept | 4.185 | 0.203 | |
| After bike-share (0/1) | 0.031 | 0.117 | |
| User survey (0/1) | 0.466 | 0.215 | |
| Ever used bike-share (0/1) | −0.208 | 0.198 | |
| Age (z-score) | −0.016 | 0.030 | |
| Woman (0/1) | −0.152 | 0.043 | |
| One Adult HH (0/1) | 0.330 | 0.061 | |
| No children HH (0/1) | −0.100 | 0.048 | |
| Two or more HH cars (0/1) | 0.372 | 0.057 | |
| No College Degree (0/1) | −0.030 | 0.086 | |
| Working (0/1) | 0.246 | 0.061 | |
| Student (0/1) | −0.217 | 0.129 | |
| >USD 50,000 HH income (0/1) | 0.140 | 0.090 | |
| Student × >USD 50,000 HH income (0/1) | 0.026 | 0.151 | |
| Neighborhood Level Variation | |||
| Zero-VMT Binary Model (Hurdle) | |||
| Std. dev. Intercept | 0.423 | 0.311 | |
| Std. dev. Ever used bike-share | 0.433 | 0.365 | |
| Std. dev. User survey | 0.394 | 0.344 | |
| Std. dev. After bike-share | 0.439 | 0.356 | |
| Greater Than Zero-VMT Gamma Model | |||
| Std. dev. Intercept | 0.271 | 0.193 | |
| Std. dev. Ever used bike-share | 0.219 | 0.224 | |
| Std. dev. User survey | 0.253 | 0.231 | |
| Std. dev. After bike-share | 0.147 | 0.160 | |
| Varying parameter correlations by neighborhood | |||
| Zero-VMT Binary Model (Hurdle) | |||
| Cor. Intercept and Ever used bike-share | 0.021 | 0.384 | |
| Cor. Intercept and User survey | −0.013 | 0.388 | |
| Cor. Ever used bike-share and User survey | −0.068 | 0.386 | |
| Cor. Intercept and After bike-share | 0.008 | 0.380 | |
| Cor. Ever used bike-share and After bike-share | 0.006 | 0.380 | |
| Cor. User survey and After bike-share | −0.031 | 0.383 | |
| Greater Than Zero-VMT Gamma Model | |||
| Cor. Intercept and Ever used bike-share | 0.056 | 0.377 | |
| Cor. Intercept and User survey | −0.055 | 0.381 | |
| Cor. Ever used bike-share and User survey | −0.068 | 0.386 | |
| Cor. Intercept and After bike-share | 0.026 | 0.372 | |
| Cor. Ever used bike-share and After bike-share | −0.018 | 0.378 | |
| Cor. User survey and After bike-share | −0.024 | 0.382 |
| Parameter Description | Parameter | Mean | sd |
|---|---|---|---|
| Zero-VMT Binary Model (Hurdle) | |||
| Intercept | −0.910 | 0.439 | |
| After bike-share (0/1) | 0.031 | 0.322 | |
| User survey (0/1) | 0.384 | 0.537 | |
| Ever used bike-share (0/1) | 0.741 | 0.533 | |
| Age (z-score) | −0.141 | 0.126 | |
| Woman (0/1) | −0.115 | 0.184 | |
| One Adult HH (0/1) | −0.151 | 0.206 | |
| No children HH (0/1) | 0.750 | 0.296 | |
| Two or more HH cars (0/1) | −3.620 | 0.451 | |
| No College Degree (0/1) | −0.429 | 0.259 | |
| Working (0/1) | −0.637 | 0.225 | |
| Student (0/1) | −0.057 | 0.314 | |
| >USD 50,000 HH income (0/1) | −1.478 | 0.245 | |
| Student × >USD 50,000 HH income (0/1) | 0.259 | 0.409 | |
| Greater Than Zero-VMT Gamma Model | |||
| Intercept | 8.745 | 0.124 | |
| After bike-share (0/1) | 0.006 | 0.107 | |
| User survey (0/1) | −0.051 | 0.176 | |
| Ever used bike-share (0/1) | −0.022 | 0.165 | |
| Age (z-score) | −0.062 | 0.024 | |
| Woman (0/1) | 0.025 | 0.035 | |
| One Adult HH (0/1) | 0.001 | 0.047 | |
| No children HH (0/1) | −0.046 | 0.038 | |
| Two or more HH cars (0/1) | 0.724 | 0.042 | |
| No College Degree (0/1) | 0.002 | 0.063 | |
| Working (0/1) | 0.176 | 0.045 | |
| Student (0/1) | 0.208 | 0.100 | |
| >USD 50,000 HH income (0/1) | 0.254 | 0.068 | |
| Student × >USD 50,000 HH income (0/1) | −0.210 | 0.119 | |
| Neighborhood Level Variation | |||
| Zero-VMT Binary Model (Hurdle) | |||
| Std. dev. Intercept | 0.248 | 0.254 | |
| Std. dev. Ever used bike-share | 0.515 | 0.404 | |
| Std. dev. User survey | 0.571 | 0.427 | |
| Std. dev. After bike-share | 0.329 | 0.296 | |
| Greater Than Zero-VMT Gamma Model | |||
| Std. dev. Intercept | 0.098 | 0.114 | |
| Std. dev. Ever used bike-share | 0.171 | 0.191 | |
| Std. dev. User survey | 0.175 | 0.193 | |
| Std. dev. After bike-share | 0.153 | 0.153 | |
| Varying parameter correlations by neighborhood | |||
| Zero-VMT Binary Model (Hurdle) | |||
| Cor. Intercept and Ever used bike-share | −0.025 | 0.389 | |
| Cor. Intercept and User survey | −0.029 | 0.386 | |
| Cor. Ever used bike-share and User survey | −0.051 | 0.373 | |
| Cor. Intercept and After bike-share | −0.032 | 0.395 | |
| Cor. Ever used bike-share and After bike-share | −0.032 | 0.380 | |
| Cor. User survey and After bike-share | −0.051 | 0.384 | |
| Greater Than Zero-VMT Gamma Model | |||
| Cor. Intercept and Ever used bike-share | −0.032 | 0.382 | |
| Cor. Intercept and User survey | −0.011 | 0.380 | |
| Cor. Ever used bike-share and User survey | −0.074 | 0.388 | |
| Cor. Intercept and After bike-share | 0.042 | 0.379 | |
| Cor. Ever used bike-share and After bike-share | −0.073 | 0.385 | |
| Cor. User survey and After bike-share | −0.045 | 0.388 |
References
- NACTO. Shared Micromobility in the U.S. 2018; NACTO: New York, NY, USA, 2019. [Google Scholar]
- Hosford, K.; Winters, M. Quantifying the Bicycle Share Gender Gap. Transp. Find. 2019. [Google Scholar] [CrossRef]
- Chen, Z.; Van Lierop, D.; Ettema, D. Dockless bike-sharing systems: what are the implications? Transp. Rev. 2020, 40, 333–353. [Google Scholar] [CrossRef]
- Degele, J.; Gorr, A.; Hass, K.; Kormann, D.; Krauss, S.; Lipinski, P.; Tenbih, M.; Koppenhoefer, C.; Fauser, J.; Hertweck, D. Identifying e-scooter sharing customer segments using clustering. In Proceedings of the IEEE International Conference on Engineering, Technology and Innovatoin, Stuttgart, Germany, 17–20 June 2018. [Google Scholar]
- Populus. The Micro-Mobility Revolution: The Introduction and Adoption of Electric Scooters in the United States; Populus: San Francisco, CA, USA, 2018. [Google Scholar]
- Garrard, J.; Handy, S.; Dill, J. Women and Cycling. In City Cycling; Pucher, J., Buehler, R., Eds.; MIT Press: Cambridge, MA, USA, 2012; pp. 211–234. ISBN 978-262517812. [Google Scholar]
- Fishman, E.; Washington, S.; Haworth, N. Bike Share: A Synthesis of the Literature. Transp. Rev. 2013, 33, 148–165. [Google Scholar] [CrossRef]
- Fishman, E.; Washington, S.; Haworth, N. Bike share’s impact on car use: Evidence from the United States, Great Britain, and Australia. Transp. Res. Part D Transp. Environ. 2014, 31, 13–20. [Google Scholar] [CrossRef]
- Qin, J.; Lee, S.; Yan, X.; Tan, Y. Beyond solving the last mile problem: the substitution effects of bike-sharing on a ride-sharing platform. J. Bus. Anal. 2018, 1, 13–28. [Google Scholar] [CrossRef]
- Hollingsworth, J.; Copeland, B.; Johnson, J.X. Are e-scooters polluters? the environmental impacts of shared dockless electric scooters. Environ. Res. Lett. 2019, 14, 084031. [Google Scholar] [CrossRef]
- Mcneil, N.; Dill, J.; Macarthur, J.; Broach, J. Breaking Barriers to Bike Share: Insights from Bike Share Users; Final Report NITC-RR-884c; Portland State University: Portland, OR, USA, 2017. [Google Scholar]
- Ricci, M. Bike sharing: A review of evidence on impacts and processes of implementation and operation. Res. Transp. Bus. Manag. 2015, 15, 28–38. [Google Scholar] [CrossRef]
- Ma, T.; Liu, C.; Erdoğan, S. Bicycle Sharing and Public Transit: Does Capital Bikeshare Affect Metrorail Ridership in Washington, D.C.? Transp. Res. Rec. 2015, 2534, 1–9. [Google Scholar] [CrossRef]
- Nederlandse Spoorwegen. NS Annual Report Transport Concession 2019; Nederlandse Spoorwegen: Utrecht, The Netherlands, 2019. [Google Scholar]
- Buehler, T.; Handy, S.L. Fifty years of bicycle policy in Davis, California. Transp. Res. Rec. J. Transp. Res. Board 2008, 52–57. [Google Scholar] [CrossRef]
- Fitch, D.T.; Mohiuddin, H.; Handy, S.L. Investigating the Influence of Dockless Electric Bike-Share on Travel Behavior, Attitudes, Health, and Equity; Institute of Transportation Studies, University of California: Davis, CA, USA, 2020. [Google Scholar]
- Bürkner, P.C. brms: An R package for Bayesian multilevel models using Stan. J. Stat. Softw. 2017, 80. [Google Scholar] [CrossRef]
- Stan Development Team. Stan Modeling Language. In User’s Guide and Reference Manual; 2018; pp. 1–488. Available online: https://mc-stan.org/docs/2_25/functions-reference/index.html (accessed on 30 December 2020).
- Bachand-Marleau, J.; Lee, B.H.Y.; El-Geneidy, A.M. Better Understanding of Factors Influencing Likelihood of Using Shared Bicycle Systems and Frequency of Use. Transp. Res. Rec. J. Transp. Res. Board 2013, 2314, 66–71. [Google Scholar] [CrossRef]
- Buehler, R.; Pucher, J.; Bauman, A. Physical activity from walking and cycling for daily travel in the United States, 2001–2017: Demographic, socioeconomic, and geographic variation. J. Transp. Health 2020, 16, 100811. [Google Scholar] [CrossRef]
- Shaheen, S.A.; Martin, E.W.; Chan, N.D. Public Bikesharing in North America: Early Operator and User Understanding, MTI Report 11–19; Mineta Transportation Institute Publications: San Jose, CA, USA, 2012; pp. 11–26. [Google Scholar]
- Handy, S.L.; Fitch, D.T. Can an e-bike share system increase awareness and consideration of e-bikes as a commute mode? Results from a natural experiment. Int. J. Sustain. Transp. 2020. [Google Scholar] [CrossRef]
- Mobiliteitsbedrijf, I.S.M.; Transport & Mobility Leuven. Evaluatie Circulatieplan Gent: Tweede Periode April-November 2018 Mei 2019; Stad Gent: Ghent, Belgium, 2019. [Google Scholar]
- Hidalgo, D. More Bicycles, Slower Speeds, a More Livable City: Paris Mayor Anne Hidalgo Plans an Ambitious Second Term. Available online: https://thecityfix.com/blog/bicycles-slower-speeds-livable-city-paris-mayor-anne-hidalgo-plans-ambitious-second-term-dario-hidalgo/1/5 (accessed on 22 July 2020).
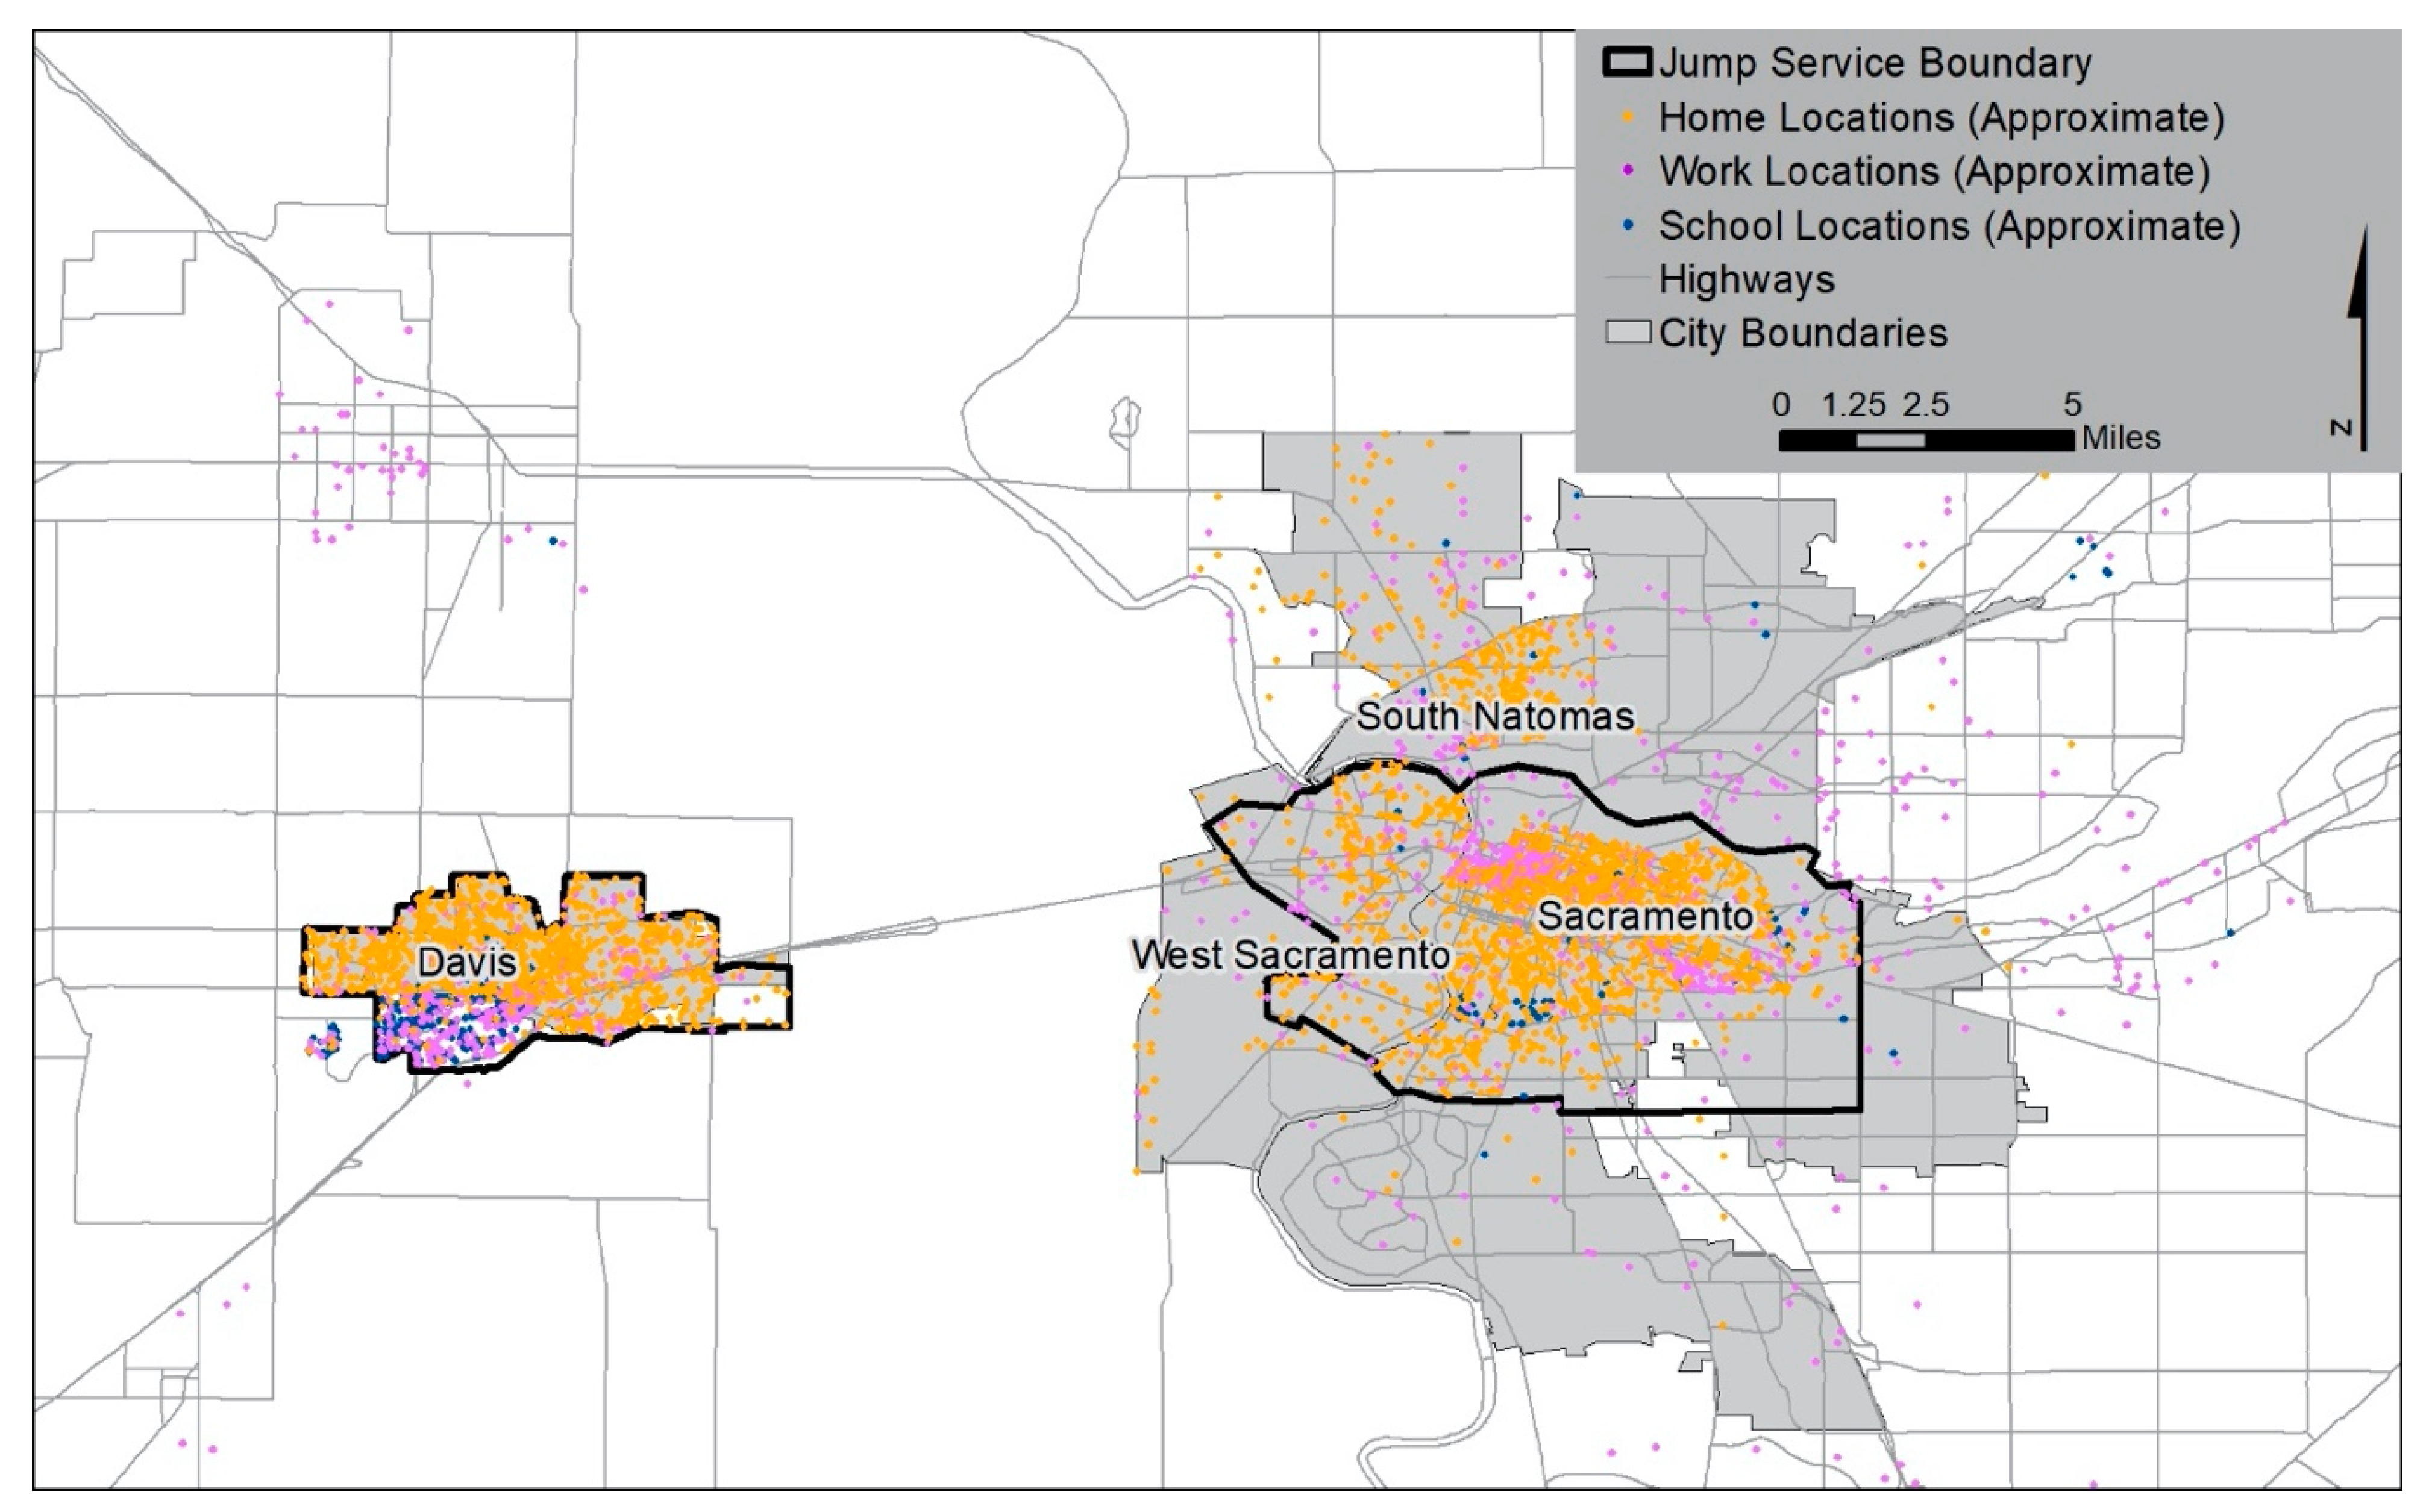
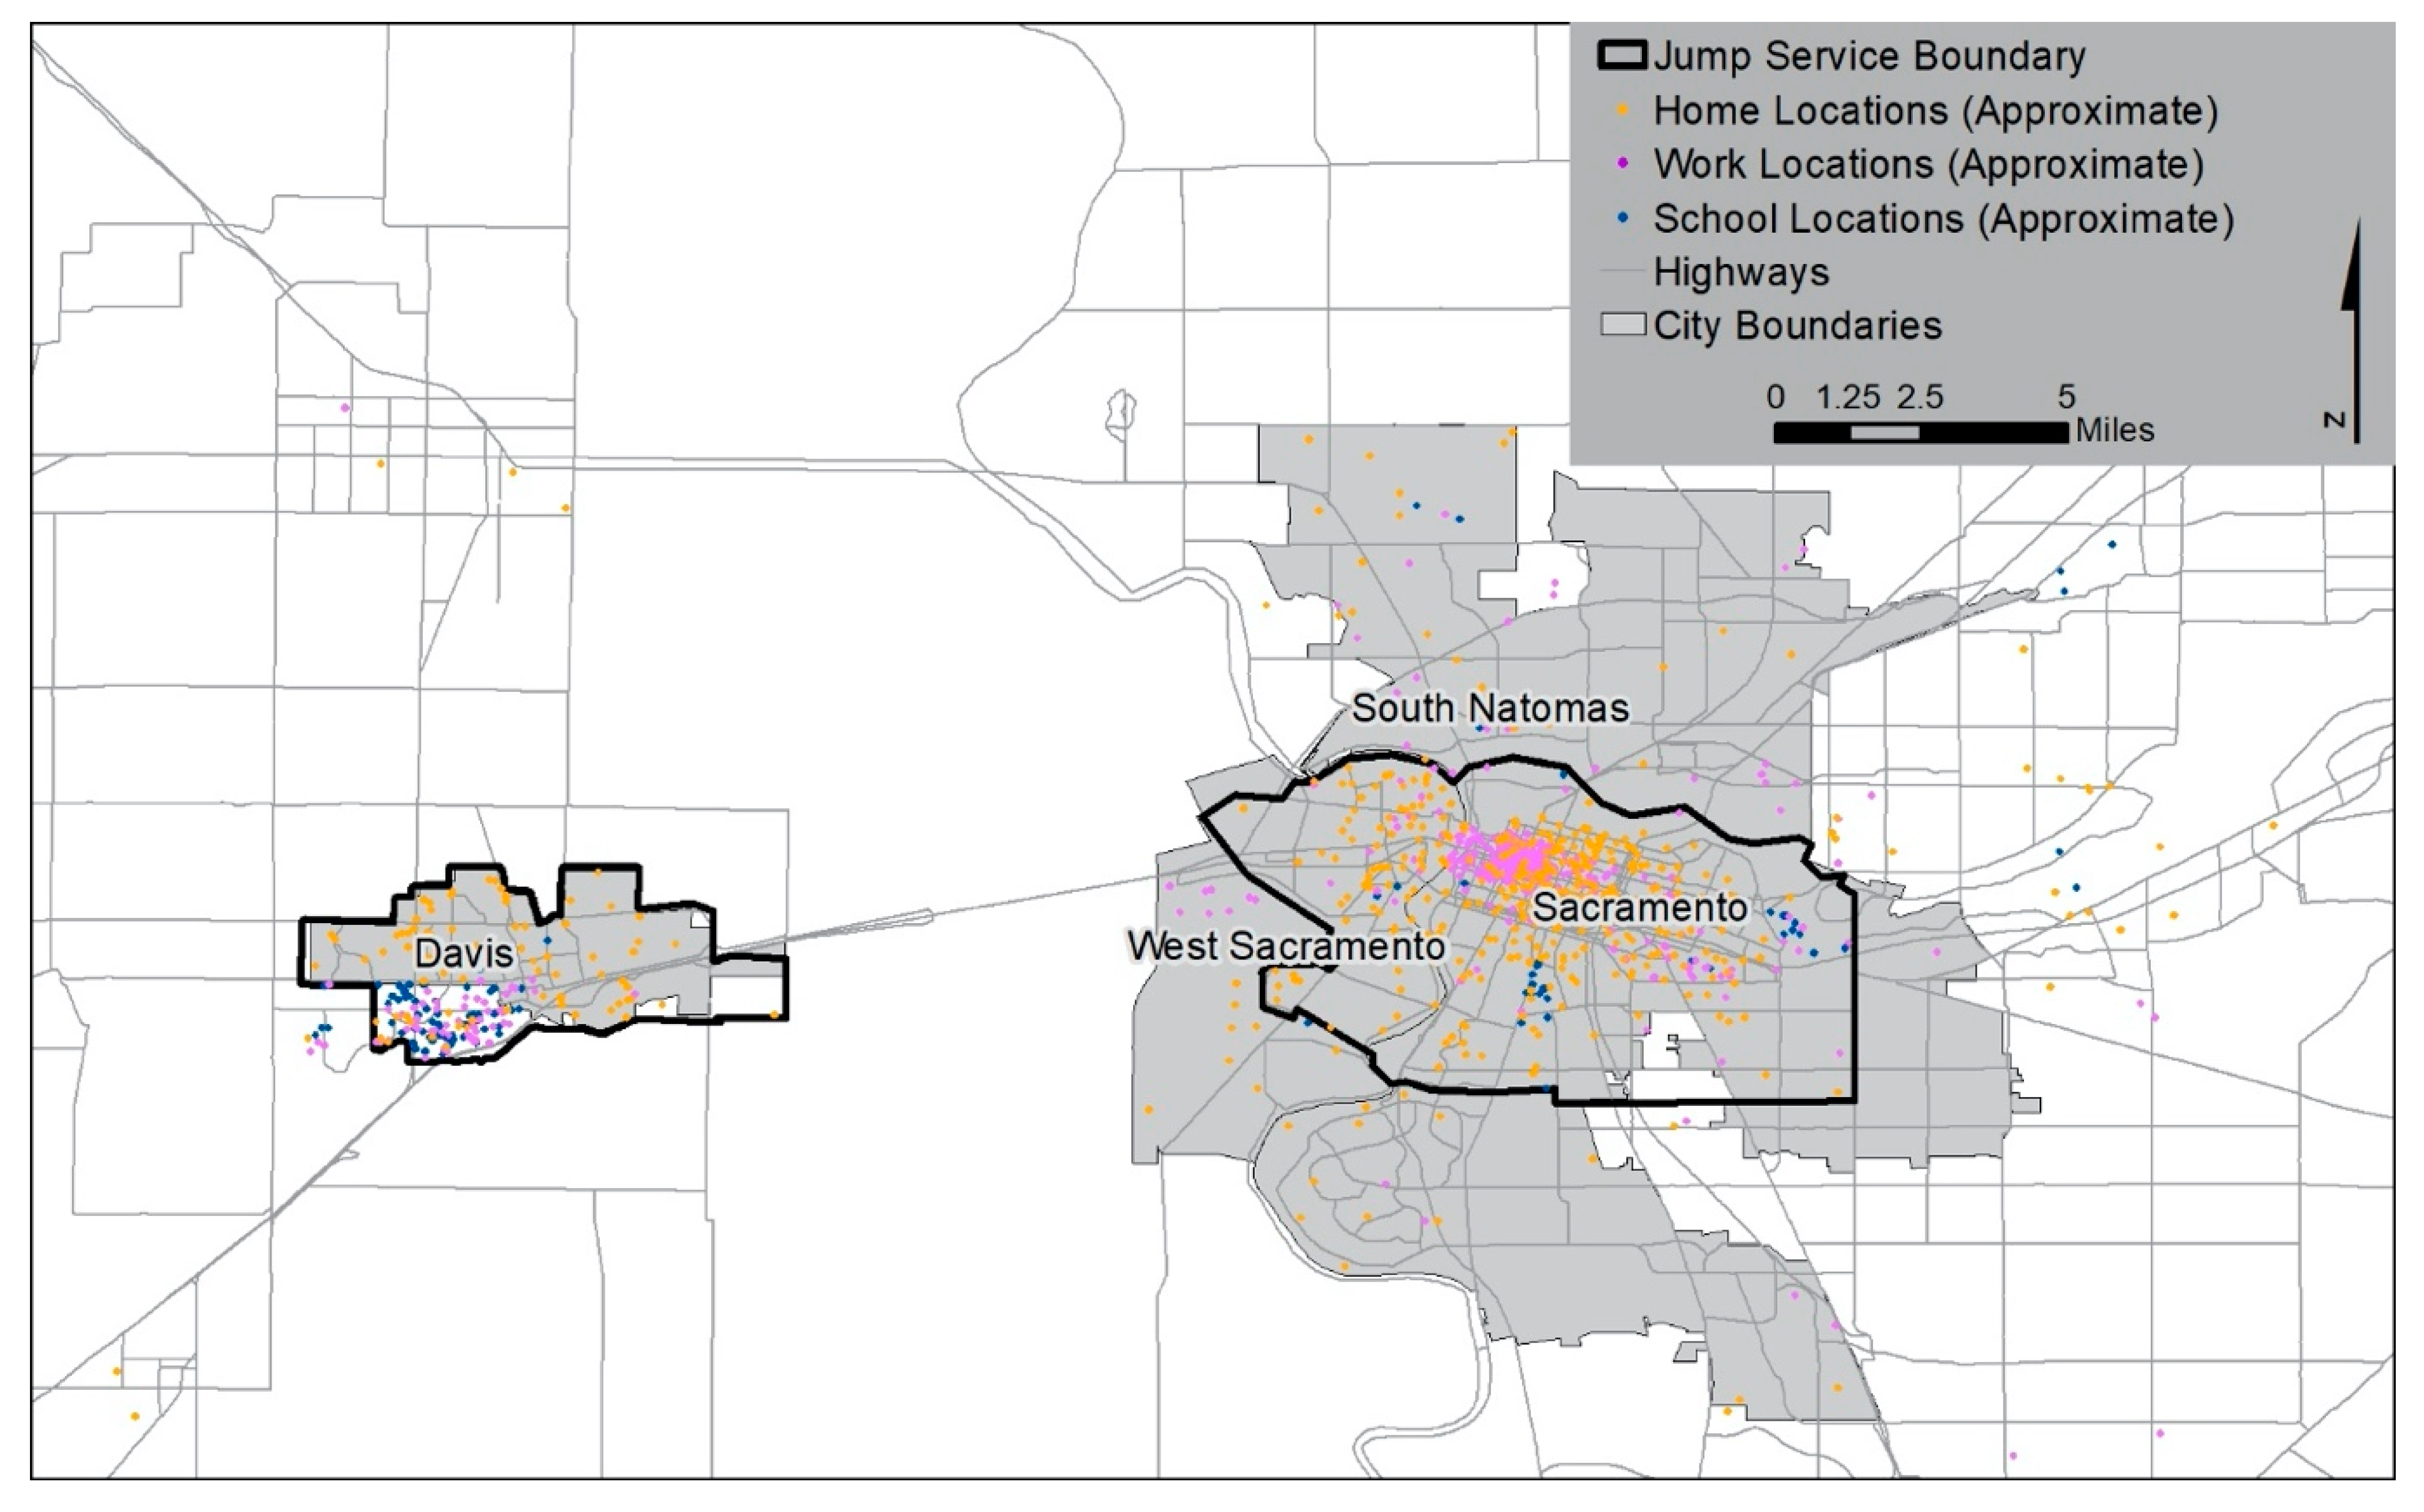

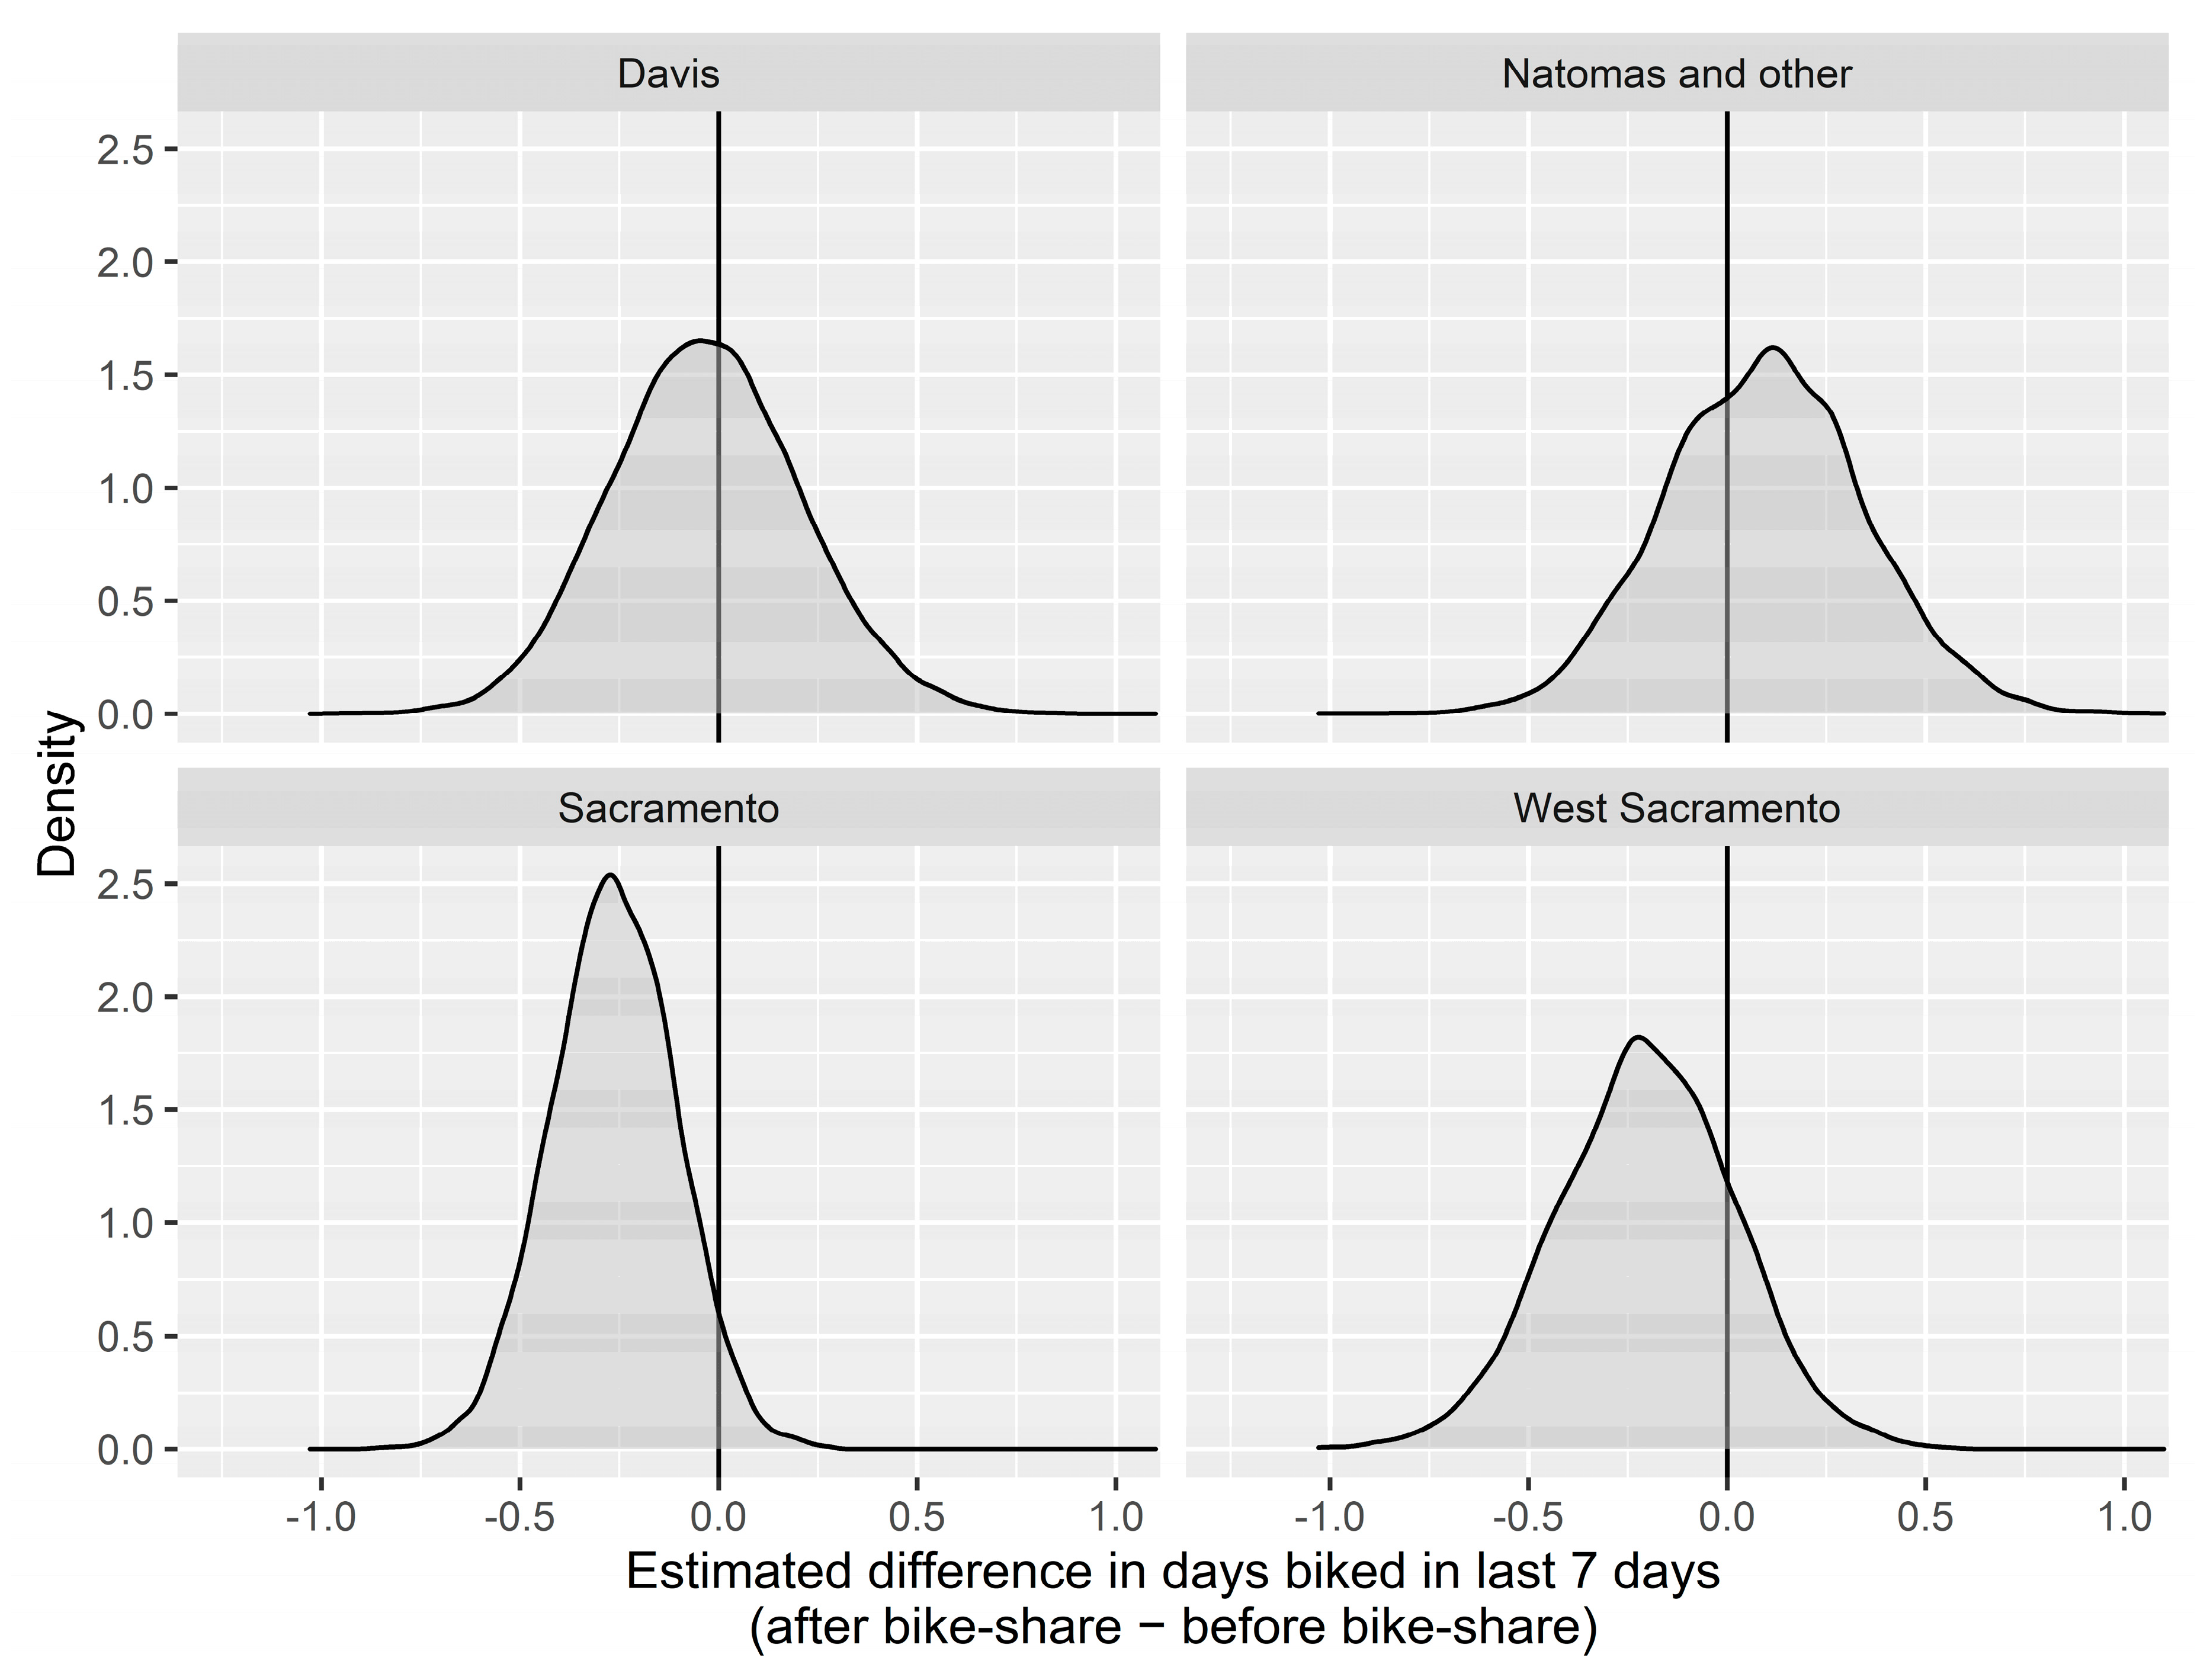
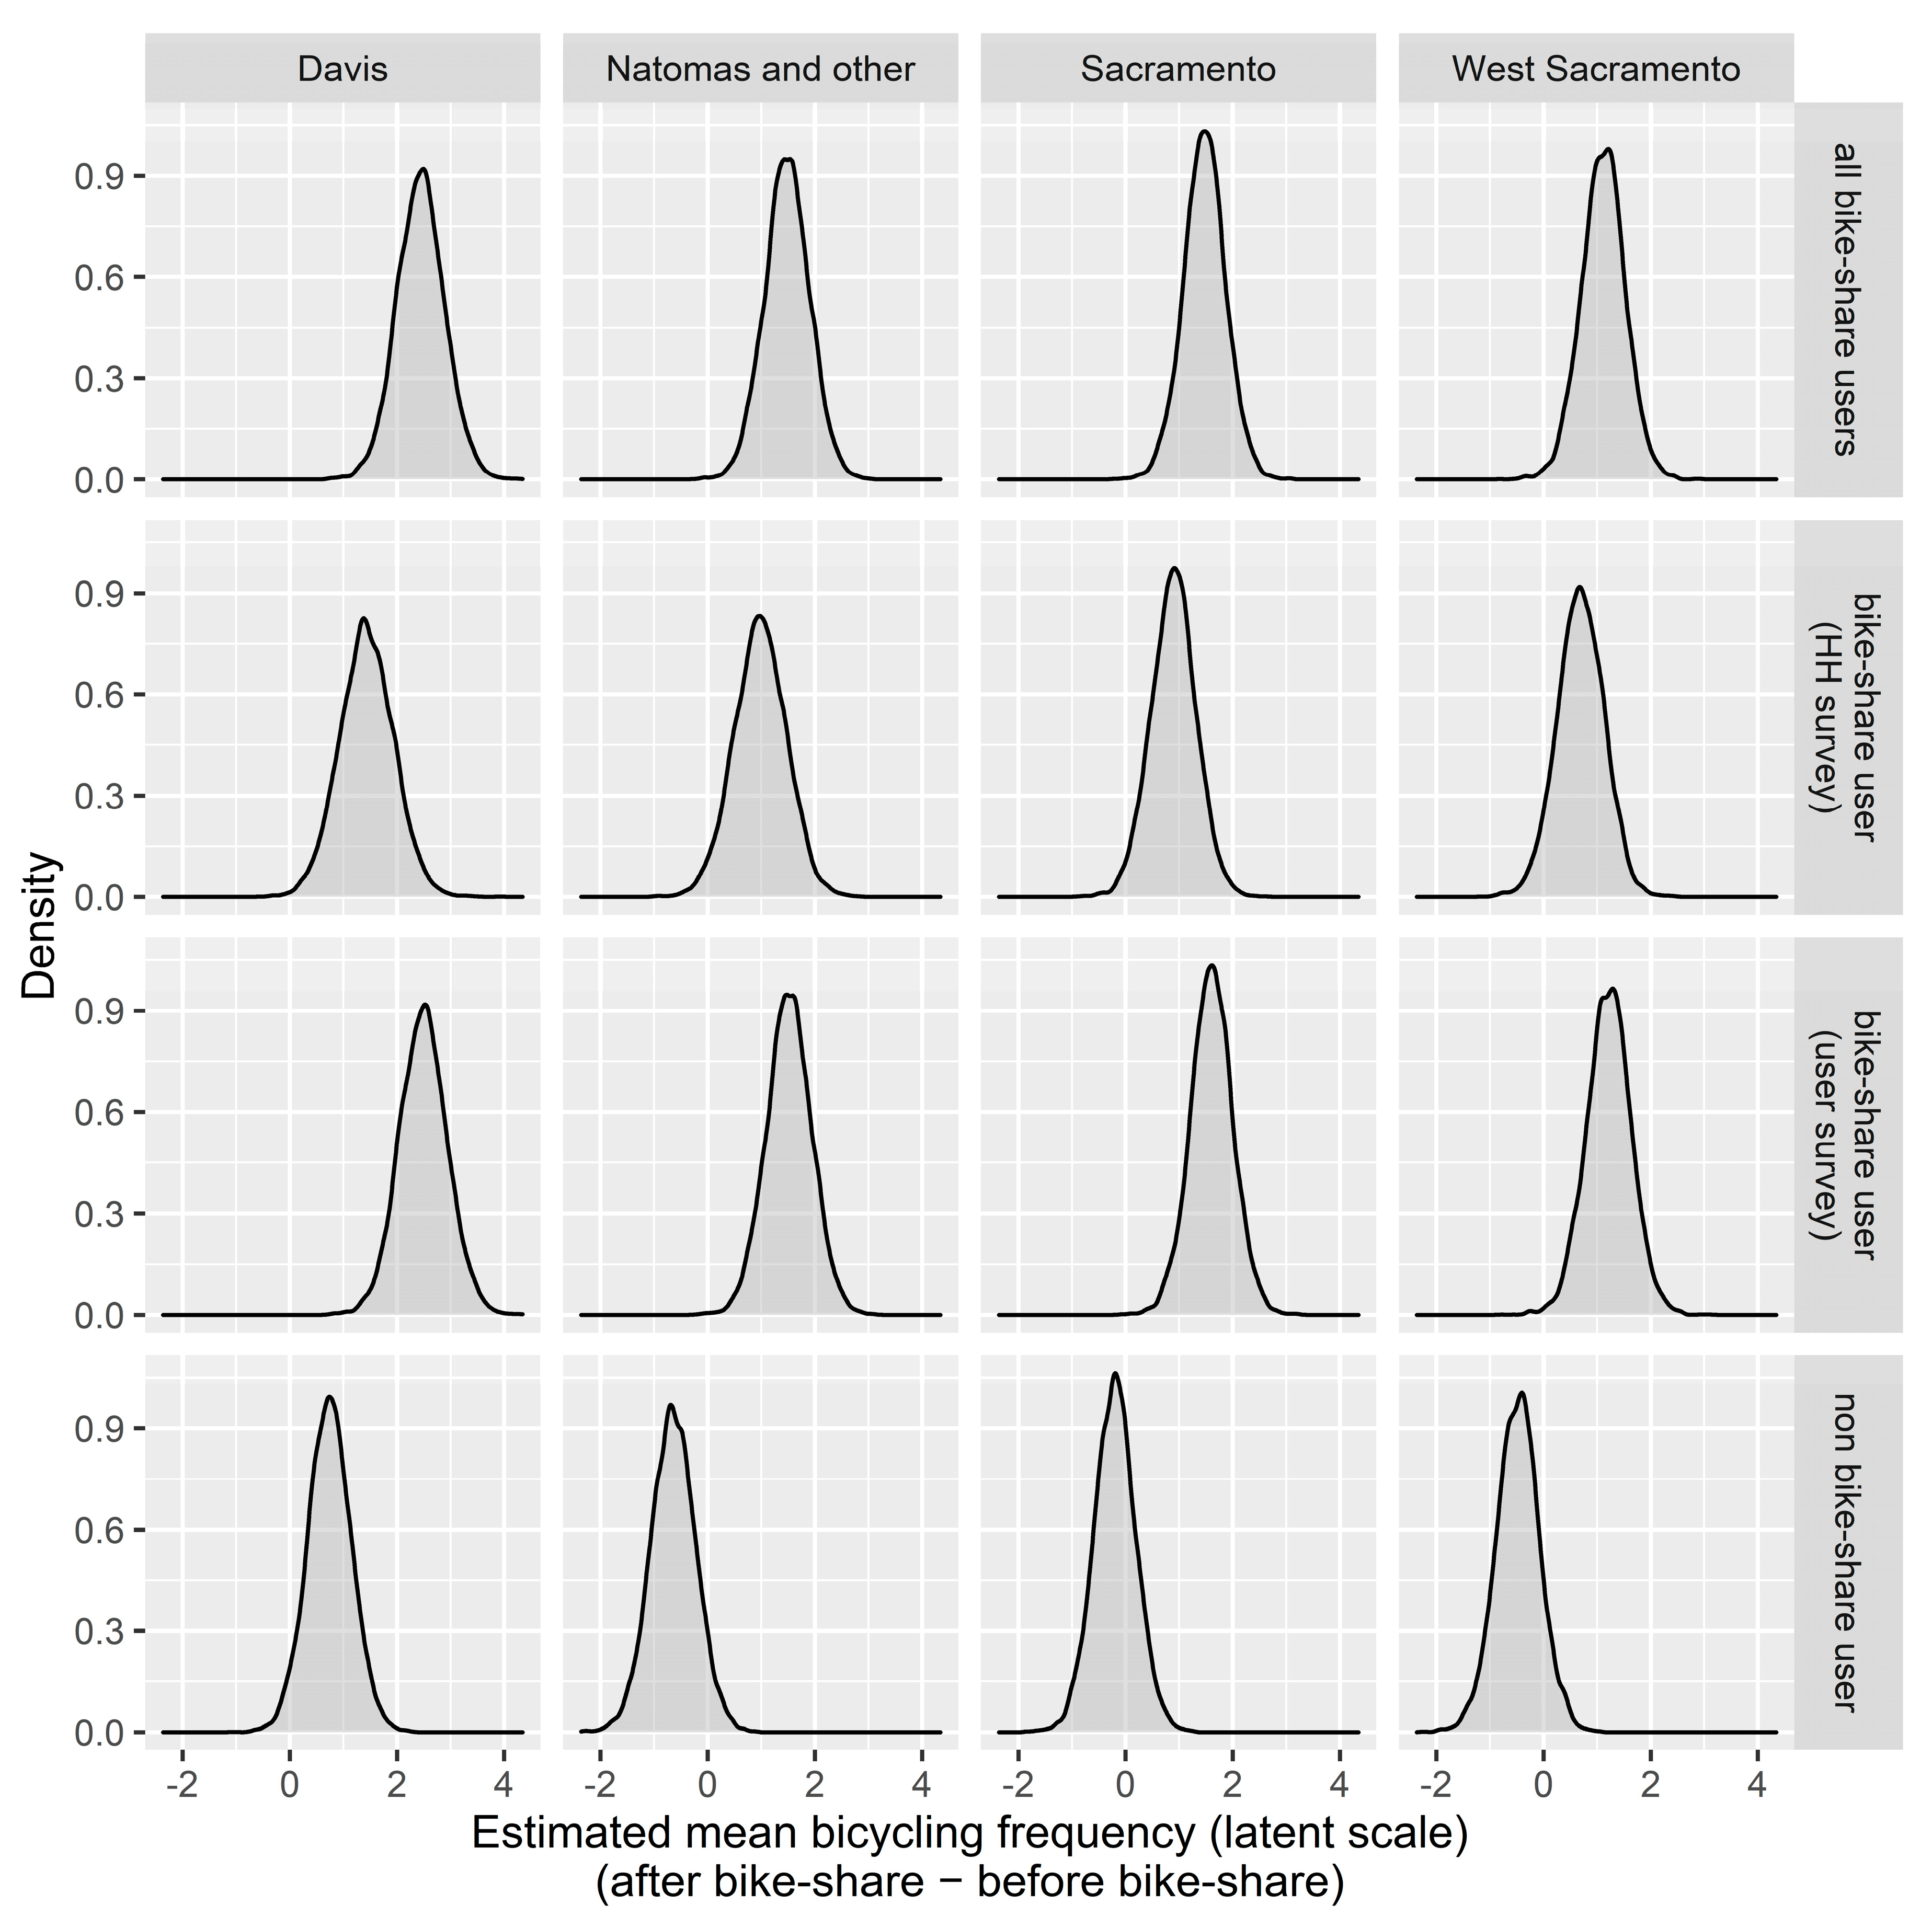


| Variable | Household Survey | Bike-Share User Survey | Population for Household Survey Area 1 | Population for Bike-Share Service Area 2 | |
|---|---|---|---|---|---|
| Sample Size | Before | 1959 | 434 (wave 1) | ||
| After | 988 | 269 + 140 panel (wave 2) | |||
| Response Rate | Before | 14% | NA | ||
| After | 10% | NA | |||
| User Status (Household Survey wave 2) | Davis | 3% | |||
| West Sacramento | 13% | ||||
| Sacramento | 13% | ||||
| Student | 12% | 25% | 34% | 33% | |
| Races | White | 74% | 65% | 48% | 49% |
| Black | 4% | 4% | 6% | 7% | |
| Hispanic | 10% | 13% | 24% | 21% | |
| Asian | 12% | 18% | 14% | 17% | |
| Age | (Mean) | 47 years | 35 years | ||
| Gender | Women | 55% | 54% | ||
| Household Income | Less than 50,000 | 16% | 10% | 45% | 40% |
| 50,001 to 100,000 | 28% | 26% | 26% | 29% | |
| 100,001 to 200,000 | 43% | 46% | 21% | 23% | |
| More than 200,000 | 13% | 18% | 8% | 8% | |
| Annual Household Vehicle Miles Traveled (VMT) | (Median) | 12,000 miles | 11,000 miles | ||
| (Std. Deviation) | 19,841 miles | 16,666 miles | |||
| Dependent Variable | Dependent Variable Histograms | Model Form 1 | Predictor Variables (For All Models) |
|---|---|---|---|
| Days bicycled in the last 7 days | 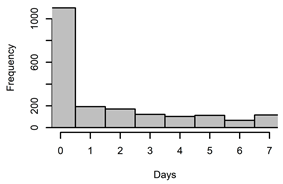 | Zero-inflated binomial |
|
| General Bicycling Frequency |  | Ordered logit | |
| Weekly individual VMT | 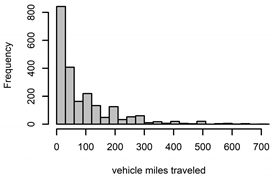 | Hurdle gamma | |
| Annual household VMT |  | Hurdle gamma |
| Variable | Davis | West Sacramento | Sacramento (Downtown) | Natomas (Control) | ||
| Student | Users | 0% | 14% | 5% | 14% | |
| Non-users | 20% | 6% | 7% | 8% | ||
| Races | White | Users | 60% | 74% | 75% | 50% |
| Non-users | 73% | 75% | 79% | 62% | ||
| Black | Users | 0% | 0% | 5% | 13% | |
| Non-users | 1% | 4% | 2% | 14% | ||
| Hispanic | Users | 0% | 26% | 10% | 37% | |
| Non-users | 11% | 13% | 10% | 13% | ||
| Asian | Users | 40% | 0% | 10% | 0% | |
| Non-users | 15% | 8% | 9% | 11% | ||
| Age (years) | (Mean) | Users | 45 | 42 | 41 | 34 |
| Non-users | 49 | 52 | 52 | 50 | ||
| Gender | Women | Users | 50% | 38% | 51% | 43% |
| Non-users | 53% | 56% | 56% | 56% | ||
| Household Income 1 | Less than 50,000 | Users | 0% | 14% | 4% | 0% |
| Non-users | 3% | 16% | 9% | 11% | ||
| 50,001 to 100,000 | Users | 50% | 14% | 22% | 75% | |
| Non-users | 24% | 35% | 27% | 34% | ||
| 100,001 to 200,000 | Users | 50% | 71% | 61% | 25% | |
| Non-users | 46% | 35% | 52% | 44% | ||
| More than 200,000 | Users | 0% | 0% | 13% | 0% | |
| Non-users | 27% | 14% | 12% | 11% | ||
| Annual Household Vehicle Miles Traveled (VMT) | (Median) | Users | 12,000 | 16,500 | 10,000 | 12,000 |
| Non-users | 10,000 | 13,250 | 10,000 | 16,000 | ||
| (Std. Deviation) | Users | 6569 | 9942 | 19,126 | 9973 | |
| Non-users | 11,998 | 17,809 | 14,211 | 21,958 | ||
Publisher’s Note: MDPI stays neutral with regard to jurisdictional claims in published maps and institutional affiliations. |
© 2021 by the authors. Licensee MDPI, Basel, Switzerland. This article is an open access article distributed under the terms and conditions of the Creative Commons Attribution (CC BY) license (http://creativecommons.org/licenses/by/4.0/).
Share and Cite
Fitch, D.T.; Mohiuddin, H.; Handy, S.L. Examining the Effects of the Sacramento Dockless E-Bike Share on Bicycling and Driving. Sustainability 2021, 13, 368. https://doi.org/10.3390/su13010368
Fitch DT, Mohiuddin H, Handy SL. Examining the Effects of the Sacramento Dockless E-Bike Share on Bicycling and Driving. Sustainability. 2021; 13(1):368. https://doi.org/10.3390/su13010368
Chicago/Turabian StyleFitch, Dillon T., Hossain Mohiuddin, and Susan L. Handy. 2021. "Examining the Effects of the Sacramento Dockless E-Bike Share on Bicycling and Driving" Sustainability 13, no. 1: 368. https://doi.org/10.3390/su13010368
APA StyleFitch, D. T., Mohiuddin, H., & Handy, S. L. (2021). Examining the Effects of the Sacramento Dockless E-Bike Share on Bicycling and Driving. Sustainability, 13(1), 368. https://doi.org/10.3390/su13010368


