Article

Analyzing Temporal Variability in Inventory Data for Life Cycle Assessment: Implications in the Context of Circular Economy

Department of Production Engineering, KTH Royal Institute of Technology, Brinellvägen 68, 100 44 Stockholm, Sweden
*
Author to whom correspondence should be addressed.
Sustainability 2021, 13(1), 344; https://doi.org/10.3390/su13010344
Submission received: 15 November 2020 / Revised: 21 December 2020 / Accepted: 22 December 2020 / Published: 2 January 2021

Abstract

:
Life cycle assessment (LCA) is used frequently as a decision support tool for evaluating different design choices for products based on their environmental impacts. A life cycle usually comprises several phases of varying timespans. The amount of emissions generated from different life cycle phases of a product could be significantly different from one another. In conventional LCA, the emissions generated from the life cycle phases of a product are aggregated at the inventory analysis stage, which is then used as an input for life cycle impact assessment. However, when the emissions are aggregated, the temporal variability of inventory data is ignored, which may result in inaccurate environmental impact assessment. Besides, the conventional LCA does not consider the environmental impact of circular products with multiple use cycles. It poses difficulties in identifying the hotspots of emission-intensive activities with the potential to mislead conclusions and implications for both practice and policy. To address this issue and to analyze the embedded temporal variations in inventory data in a CE context, the paper proposes calculating the emission intensity for each life cycle phase. It is argued that calculating and comparing emission intensity, based on the timespan and amount of emissions for individual life cycle phases, at the inventory analysis stage of LCA offers a complementary approach to the traditional aggregate emission-based LCA approach. In a circular scenario, it helps to identify significant issues during different life cycle phases and the relevant environmental performance improvement opportunities through product, business model, and supply chain design.

1. Introduction

Life cycle assessment (LCA) is used frequently as a decision support tool to evaluate different design choices for products (e.g., cars, refrigerators, and freezers) based on their environmental impact during the entire life cycle from cradle to grave [1]. LCA includes four interdependent stages: goal and scope definition, inventory analysis, impact assessment, and interpretation [2]. Among these, inventory analysis deals with flows involving inputs and outputs, such as materials and energies, during the entire life cycle of a product [3]. The life cycle usually comprises consecutive and interlinked stages of a product system (i.e., production, distribution, use, and end of life). The length of different life cycle phases could be significantly different. For example, the use phase of most energy-using products is much longer than the production phase (Figure 1). Each life cycle phase further entails several activities and events, and the emissions generated from a life cycle phase could also be significantly different from one another [4].
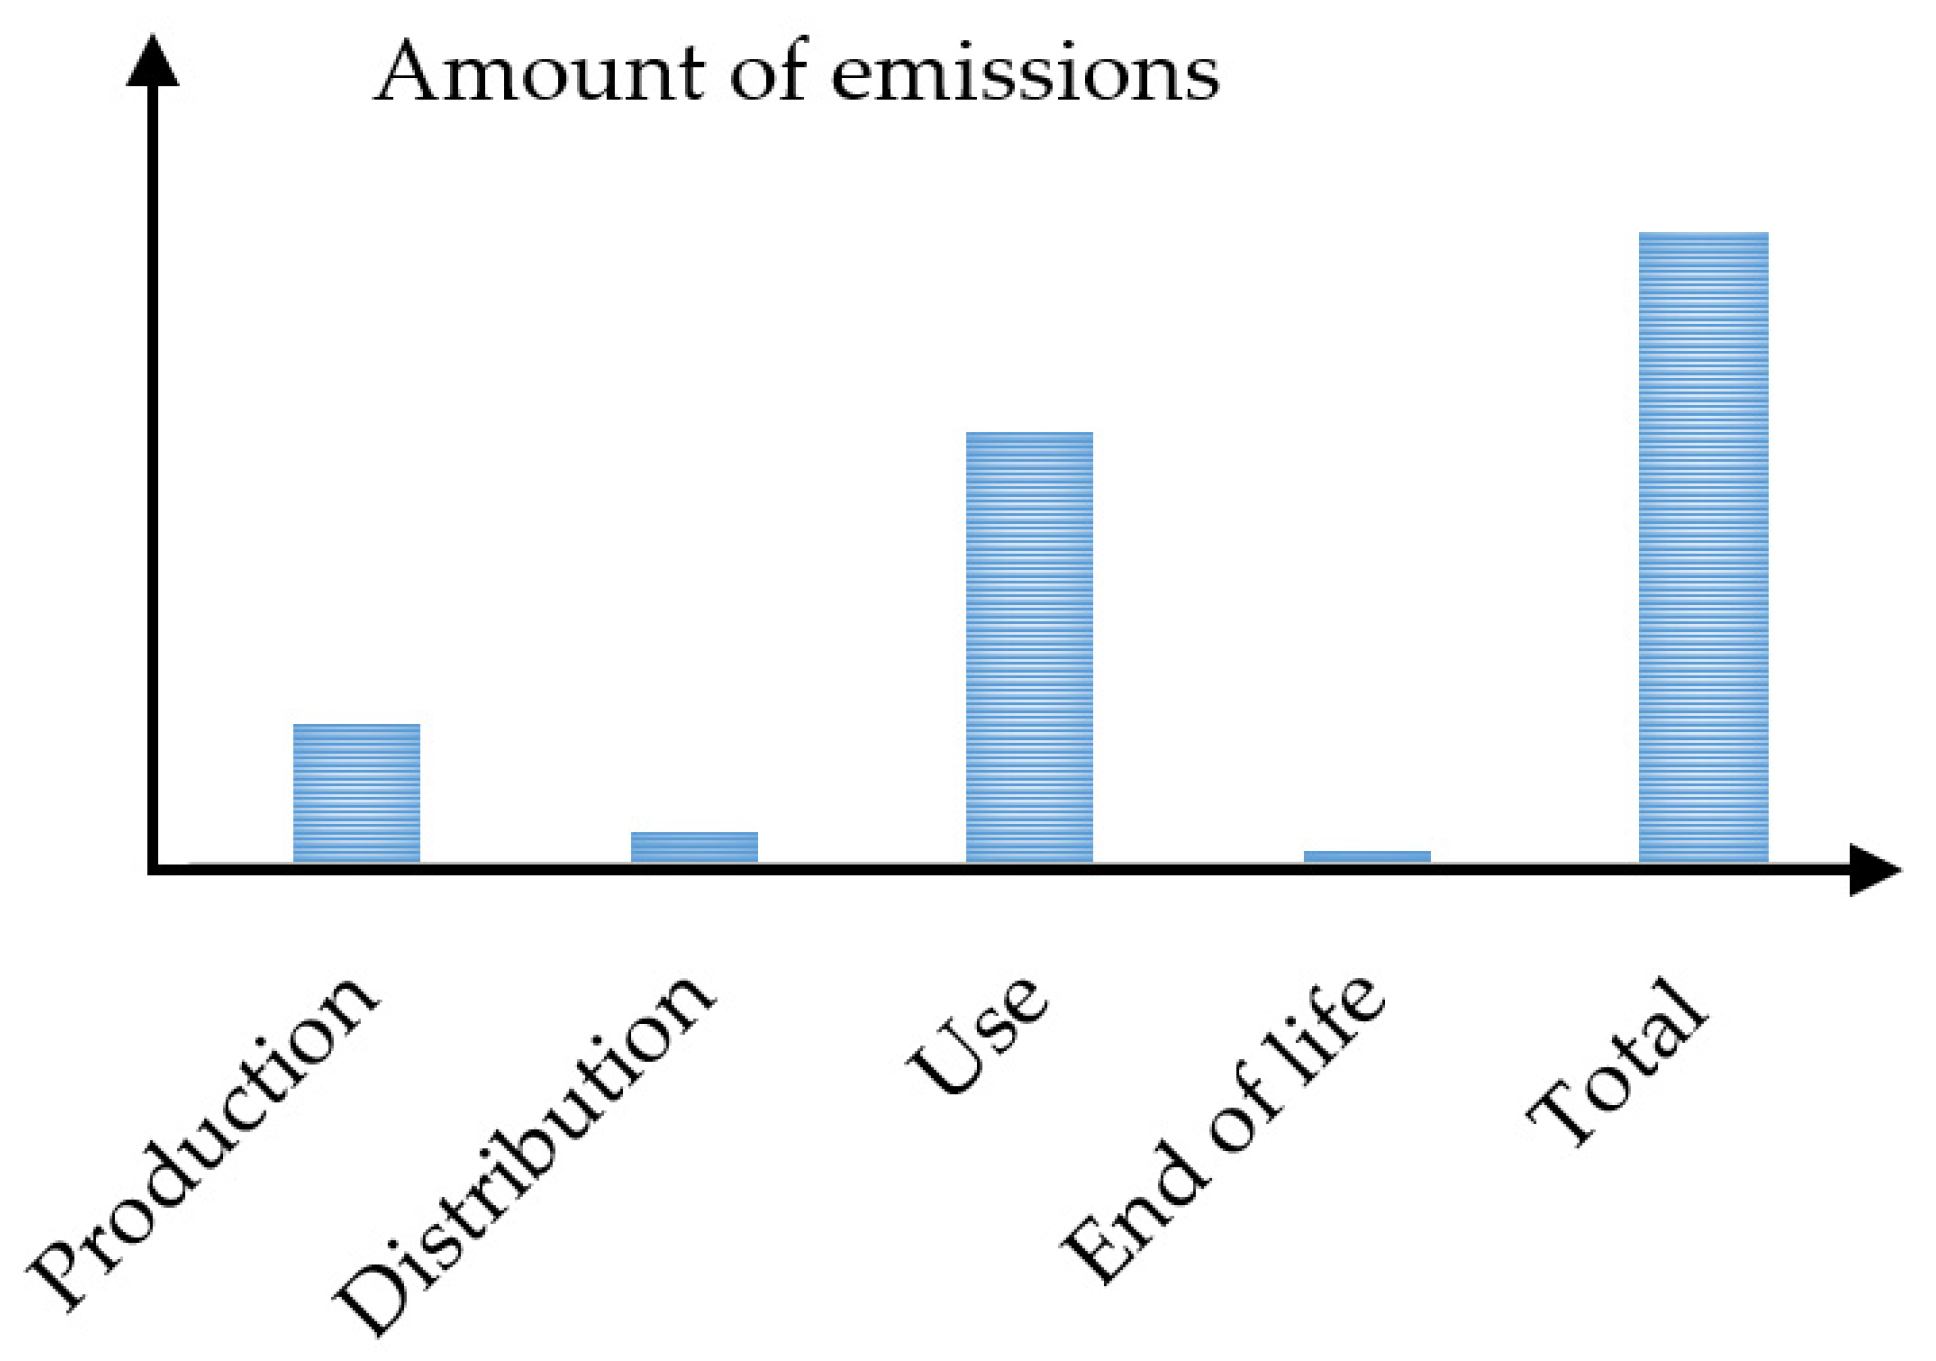
In conventional LCA, the emissions generated from different periods are aggregated at the inventory analysis stage (Figure 2), which is then used as an input for life cycle impact assessment [5].
However, when the emissions are aggregated, the temporal variability of inventory data is ignored, which may result in an inaccurate environmental impact assessment [4]. Besides, the conventional LCA does not consider the environmental impact of circular products with multiple life cycles. It poses difficulties in identifying the hotspots of emission-intensive activities during different life cycles of a product with the potential to mislead conclusions and implications for both practice and policy.
To address this issue and to analyze the embedded temporal variations in inventory data in a CE context, the paper proposes to quantify the timespan of each phase of a life cycle and the associated amount of emissions at the inventory analysis stage of LCA. These variables then can be used to calculate the emission intensity (emission amount per unit of time) during each phase of a life cycle. The paper argues that calculating and comparing emission intensity for the individual life cycle phases, based on their timespan and amount of emissions, offers a complementary approach to the traditional aggregate emission-based LCA approach. In a circular scenario, it helps to identify significant issues during different life cycle phases and the relevant environmental performance improvement opportunities through product, business model, and supply chain design.
Section 2 introduces the LCA methodology and some of its main limitations. In Section 3, different perspectives on the temporal dimension in LCA literature have been analyzed. Section 4 provides a few examples of LCA studies to show the implications of their results for practice and policy. In Section 5, we propose our emission intensity-based approach to analyze temporal variability in inventory data and illustrate its implementation based on the data from existing LCA studies. In Section 6, we discuss the implications of emission intensity in the context of circular economy with the help of a case example. Section 7 provides discussion and conclusion.

2. A Brief Introduction to LCA Methodology

2.1. General Framework of LCA

LCA is a tool to assess the environmental aspects and potential impacts of a product, process, or service system throughout its life from cradle to grave. With increasing application in different industrial sectors, there have been several methodological developments in LCA during the last three decades [6,7,8]. While some aspects of the LCA methodology are still being debated in the literature [9,10,11], the International Organization for Standardization (ISO) has provided a general LCA framework, principles [2], requirements, and guidelines [5] that are widely accepted and used in both academia and industry. The ISO framework of LCA is comprised of four main stages: goal and scope definition, life cycle inventory analysis (LCI), life cycle impact assessment (LCIA), and interpretation.
The goal and scope definition phase of an LCA includes the purpose of carrying out the study, the intended application, and the intended audience [2]. It describes the product system in terms of the system boundaries and the functional unit. The functional unit is a quantitative measure of the functions that the goods (or services) provide.
The LCI phase is an inventory of inputs (resources) and outputs (emissions) from the product over its life cycle in relation to the functional unit [2]. It is built based on the unit process that is the smallest element considered in the life cycle inventory analysis. For each unit process, which represents one or several activities such as production processes or transportation, data are collected on the inputs of natural resources and outputs of emissions, waste flows, and other environmental exchanges. The LCI, then, is the compilation and quantification of the different unit processes within the system under study. Conventional LCA provides the set of total system-wide flows that are associated with or attributed to the delivery of a specified amount of the functional unit [12]. In conventional LCA, the processes included are those that are considered to contribute significantly to the studied product and its function. It typically implies that material and energy flows are followed systematically upstream from the process associated with the reference flow to the extraction of natural resources and downstream to the final disposal of waste. Conventional LCA utilizes average data for each unit process within the life cycle. Average data for a system represent the average environmental burdens for producing a unit of the good or service in the system.
The LCIA phase aims to assess a product system’s LCI results for their environmental significance [2]. The LCIA provides an evaluation of the magnitude and significance of the potential environmental impacts for a product system throughout the life cycle. According to the ISO 14040 series, there are three general impact categories (also referred to as areas of protection) that should be taken into account when defining the scope of an LCA study: resource use, human health, and ecological consequences.
Life cycle interpretation is the final phase of the LCA, in which the results from the previous LCA phases are summarized and discussed as a basis for conclusions, recommendations, and decision-making [2].

2.2. Major Limitations of LCA Methodology

Several limitations of the LCA methodology have been identified in the literature. In LCA’s first phase, there is a lack of clear guidance for matching the goal with the subsequent LCA phases of scoping, inventory analysis, and impact assessment [13]. Besides, selection and definition of the functional unit and setting an appropriate scale to it are identified as critical problems requiring particular attention [7,13,14,15]. In the second phase of LCA, compiling the inventory data can be very resource and time-intensive. Lack of readily available inventory data or poor data quality and lack of spatial and temporal considerations in inventory data are the main limitations of LCA methodology [7,12,13,16]. In the third phase of LCA, one of the limitations is the missing data that link emissions to different impact categories. Besides, the impact models and impact assessment approaches do not consider the spatial and temporal differentiation in inventory data [16,17]. Assumptions about global homogeneity and steady-state conditions introduce the most severe errors in impact assessment. In particular, the dynamics of the environment, such as the timing of emissions, rate of release, and time-dependent environmental processes, affect the impact of pollution [18]. Aggregation is the overarching problem in the interpretation phase. Collapsing inventory or impact data into a single figure of merit requires weighting or valuation of some kind, which introduces subjectivity [17].
Although the literature identifies many limitations of LCA methodology, this paper focuses specifically on the temporal dimension, mainly due to its high relevance and importance in a CE context. The next section analyzes different perspectives on the temporal dimension in LCA literature.

3. Perspectives on Temporal Dimension in LCA Literature

In LCA literature, the temporal dimension has been discussed from different perspectives: (i) temporally dynamic goal and scope (e.g., temporally induced changes in service life) [19]; (ii) temporally dynamic inventory for the system (e.g., the shift from gas to electric vehicles) [20]; (iii) temporally dynamic inventory for individual unit processes (e.g., electricity generation plants becoming more efficient with time) [21]; (iv) temporally dynamic normalization or weighting (e.g., variation in indexes—such as public concerns, green taxation systems, pollution charge fees—commonly used to calculate weighting factors) [22]; (v) temporal variability in characterization factors (e.g., change in variables, such as wind speed and temperature, used for the computation of characterization factors) [23]; and (vi) temporal variability in inventory data (e.g., variation in emissions during the life cycle of a product) [14]. Although all these perspectives on temporal dynamism and variability are relevant for an effective LCA (see [24,25,26] for a thorough review on temporal considerations in LCA), this paper focuses only on temporal variability in inventory data and its implications for LCA results and their interpretation.
Temporal variation is present in inventory as emissions are generated mostly from different periods spreading over the whole lifetime of a product [4,27]. In conventional LCA, the temporal variability in inventory data is largely ignored due to difficulties in its operationalization for the whole life cycle of a product system [14]. As a result, various emissions generated from different periods are treated as a single aggregated emission generated at one time during the life cycle of a product [18]. This assumption of temporal homogeneity of inventory data has been identified as one of the main problems in LCA literature [4,28,29]. To address embedded temporal differences of inventory data in LCA, [4] proposed a framework for temporal discounting. The framework provides guidelines to calculate the temporal scale of LCA (including the time duration of individual life cycle phases) and the associated emissions. However, their focus is on eliminating the temporal differences by aggregating discounted emissions at the inventory analysis stage. Aggregating the discounted life cycle emissions might be useful for accurate impact assessment; identification of significant issues including the hotspots of emission-intensive activities remains a challenge with the potential to mislead conclusions and implications of LCA results for both practice and policy. It is particularly important in the context of CE where products can have multiple and alternative life cycles with different activities such as reuse, remanufacturing, and recycling. In the next section, we report some of the representative LCA studies to show the implications of their results for practice and policy.

4. Implications of Conventional LCA Results for Practice and Policy

Apart from using LCA as a decision support tool to evaluate different product design choices (e.g., automotive lightweighting), LCA and other approaches rooted in life cycle thinking have been widely utilized to support policy-making processes throughout the entire policy cycle, from policy formulation, policy implementation, and regulatory frameworks enforced, as well as the monitoring and evaluation of policy performance. For instance, the Ecodesign Directive is a hard regulation that provides a framework for the establishment of ecodesign requirements for all energy-using products and energy-related products in the residential, tertiary, and industrial sectors. It is accompanied by energy labeling regulation for individual categories of products. Similarly, the Car Labeling Directive (Directive 1999/94/EC) requires providing fuel economy and CO2 emission performance for new passenger cars and new light commercial vehicles. The directive is a complementary measure to help car manufacturers to meet their specific CO2 emission targets set under Regulation (EC) 443/2009. It is obvious that LCA results have implications for both practice and policy. Therefore, a multifaceted analysis and interpretation of inventory data and LCA results is important to properly guide the practice and policy. Table 1 provides a few examples of LCA studies and the implications drawn from their results.

5. Proposed Approach

5.1. Proposed Approach to Calculate Emission Intensity

In this section, we propose a complementary approach to calculate the emission intensity for individual life cycle phases at the inventory analysis stage of LCA. Emission intensity is defined as the emission amount per unit of time during a particular phase of a life cycle. It includes four steps:
Step 1: Calculate the timespan of each life cycle phase.
This research uses the methodology proposed by [4,29] to calculate the timespan of individual life cycle phases. It requires estimating the minimum and maximum phase duration times. The minimum time that must elapse to include all activities of a phase can be calculated using the critical path method. The maximum time can be calculated by summing the duration of all of the activities of a phase. Accordingly, the phase duration is assumed to be a value within this range and can be approximated by taking the mean of the two extremes.
Step 2: Calculate the amount of emissions from each life cycle phase.
Emissions from different life cycle phases can be calculated using the conventional life cycle engineering approach, which differentiates between material extraction, components supply, production/assembly, use, and end-of-life phases of a product [33].
Step 3: Calculate the emission intensity of the product during each life cycle phase.
The emission intensity of the product during each life cycle phase can be calculated by simply dividing the amount of emissions during that phase by its time duration (see Equation (1)).
E m i s s i o n   i n t e n s i t y = A m o u n t   o f   e m i s s i o n s   d u r i n g   a   l i f e   c y c l e   p h a s e T i m e   d u r a t i o n   o f   t h e   l i f e   c y c l e   p h a s e
Step 4: Interpret results by comparing the emission intensity of the product during different life cycle phases.

5.2. Implementation and Results

To illustrate the implementation of the proposed approach, this paper uses timespan and GHG emissions data from existing studies in the automotive sector. In particular, this paper uses timespan data based on the work of [29] and the GHG emissions data based on the work of [33]. Four life cycle phases of a car are considered: mining and material production/supply, manufacturing, usage, and end of life.
GHG emissions are considered for different life cycle phases of a Golf VII, 1.6 TDI produced at Volkswagen’s Wolfsburg plant in Germany with an assumed running distance of 200,000 km. Here, approximately 15.8% of total emissions are emitted during the mining and material production/supply phase, 4.2% during the manufacturing phase at Volkswagen plant, 79% during the use phase, and 1% during the end-of-life phase [33].
The timespan for the mining and material production/supply phase is considered using the mean of the minimum and maximum phase duration times. The mining and material production/supply phases consist of parallel–serial processes for multiple materials used in the car (134 different activities for mining and 75 different activities for material production). The longest duration of these parallel processes (i.e., the critical path) is the minimum duration of the phase and the sum of the duration of all of the activities is the maximum duration of the phase. The timespan for the manufacturing phase is estimated from the processes that take place at Volkswagen’s Wolfsburg plant in Germany. The timespan for the use phase is considered 10 years and the timespan for the end of life is estimated based on the process of a U.K.-based recycling company CarTakeBack [29].
The GHG emissions and timespan values are then used to calculate the emission intensity for each phase.
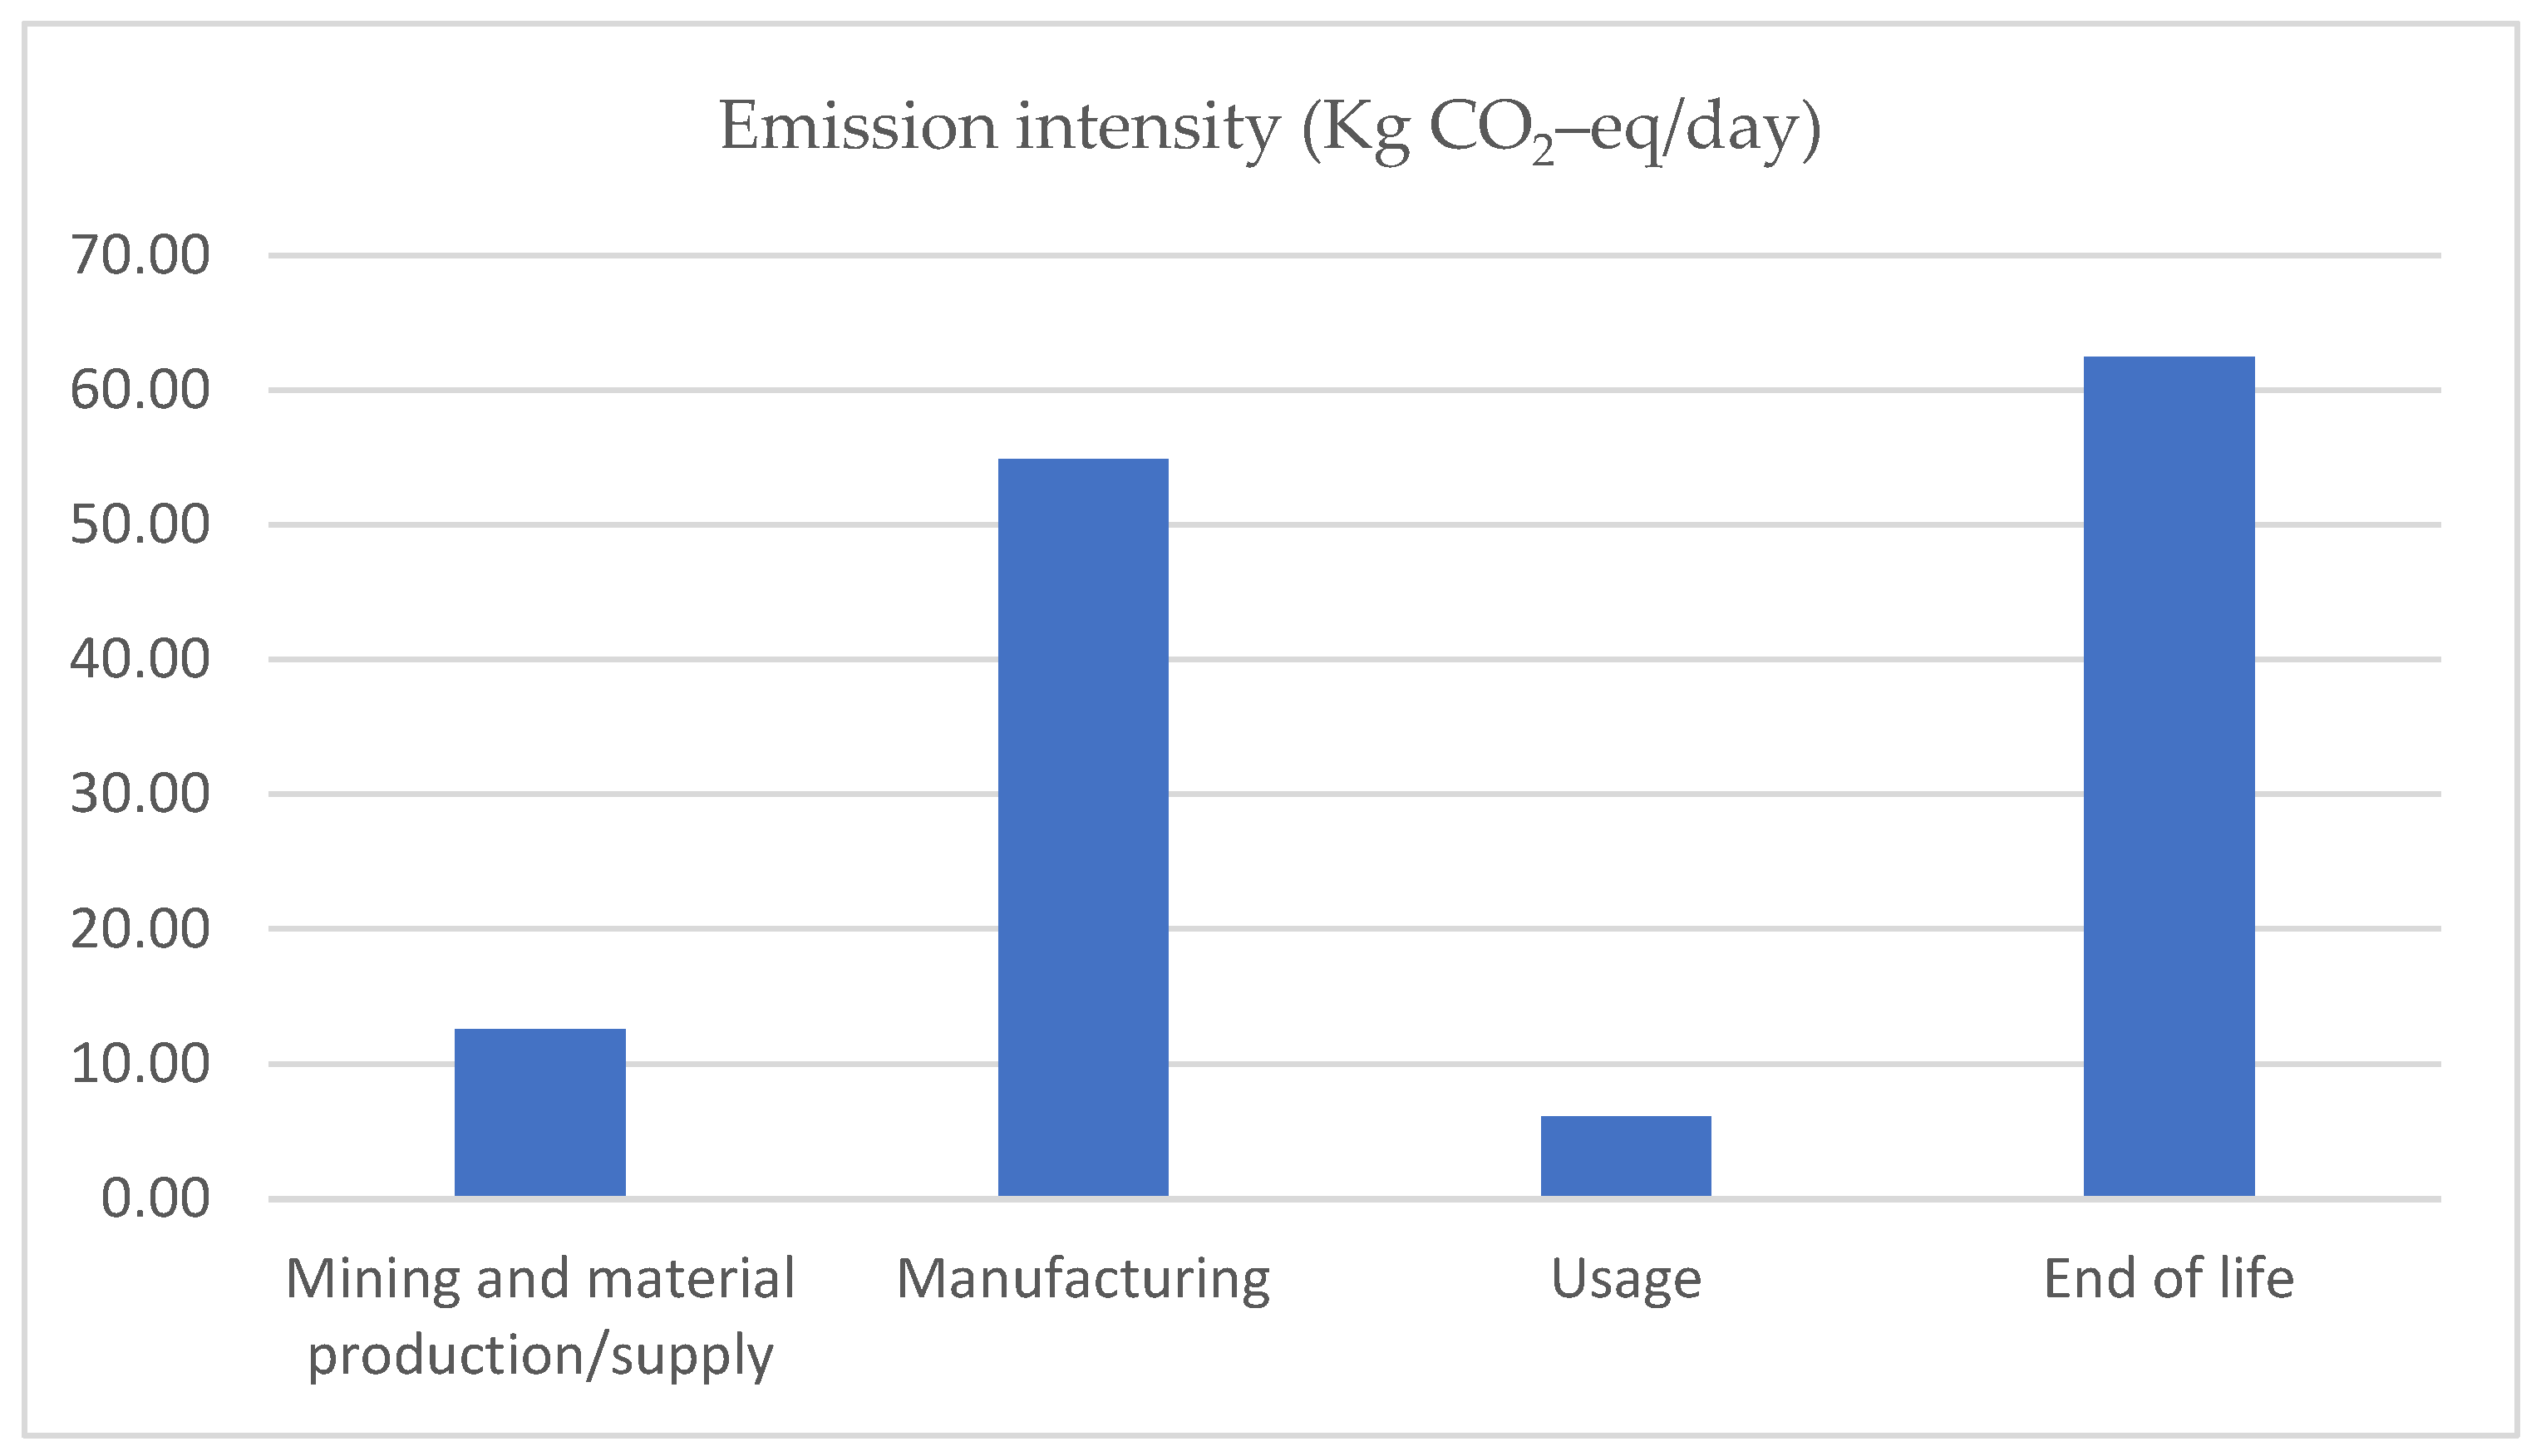
Table 2 provides values for GHG emissions, timespan, and emission intensity for different life cycle phases.
The emission intensity during manufacturing (54.89 Kg CO2–eq/day) and end of life (62.44 Kg CO2–eq/day) is significantly higher than during the mining and material production/supply (12.54 Kg CO2–eq/day) and use phases (6.08 Kg CO2–eq/day). These results are quite the opposite when we consider and compare the aggregate emissions for each life cycle phase. Figure 3 provides the emission intensity of the product during different life cycle phases.

6. Implications of Emission Intensity in the Context of Circular Economy

In the context of circular economy, products, processes, and service systems need to be intentionally designed for closing the loop, using a systemic approach [34]. The systemic approach considers three main functions in a circular system, namely business model, product design, and supply chain; thus, this approach stresses the necessity of mutual and dynamic interaction among these functions throughout the whole life cycle of the product for successful implementation of CE [34,35]. LCA as a decision support tool can play an important role in providing the essential information required to properly design these three functions and their interactions from an environmental point of view.
In this context, products follow multiple life cycles such as maintain/prolong, reuse/redistribute, refurbish/remanufacture, and recycle [36]. Depending on the characteristics of the products being assessed, the emissions during these loops can be significantly different from each other. In a circular scenario, products need to be designed for longevity with several use phases and predefined recovery strategies (i.e., circular products) [34,37]. The circular products need to be taken back after each use cycle according to the recovery options such as reuse, refurbish, remanufacture, or recycle. Therefore, the circular products are expected to have a longer use phase than conventional products. The complexity of the environmental impacts during the life cycle of circular products increases when different users utilize the same product, and this complexity is disregarded in conventional LCA.
As discussed previously, in the conventional LCA approach the emissions are aggregated for the whole life of a product to calculate the environmental impacts. However, aggregating these emissions into a single value leads to difficulty in identifying the sources of the emissions and the associated loops and activities. In contrast, in a CE context, it is extremely important to understand the emission intensity during different loops (i.e., reuse, remanufacture, recycle, etc.) as it has implications for product design, business model design, and supply chain design. In a circular scenario, all these functions should be designed while considering the emission intensity during different life cycle phases.
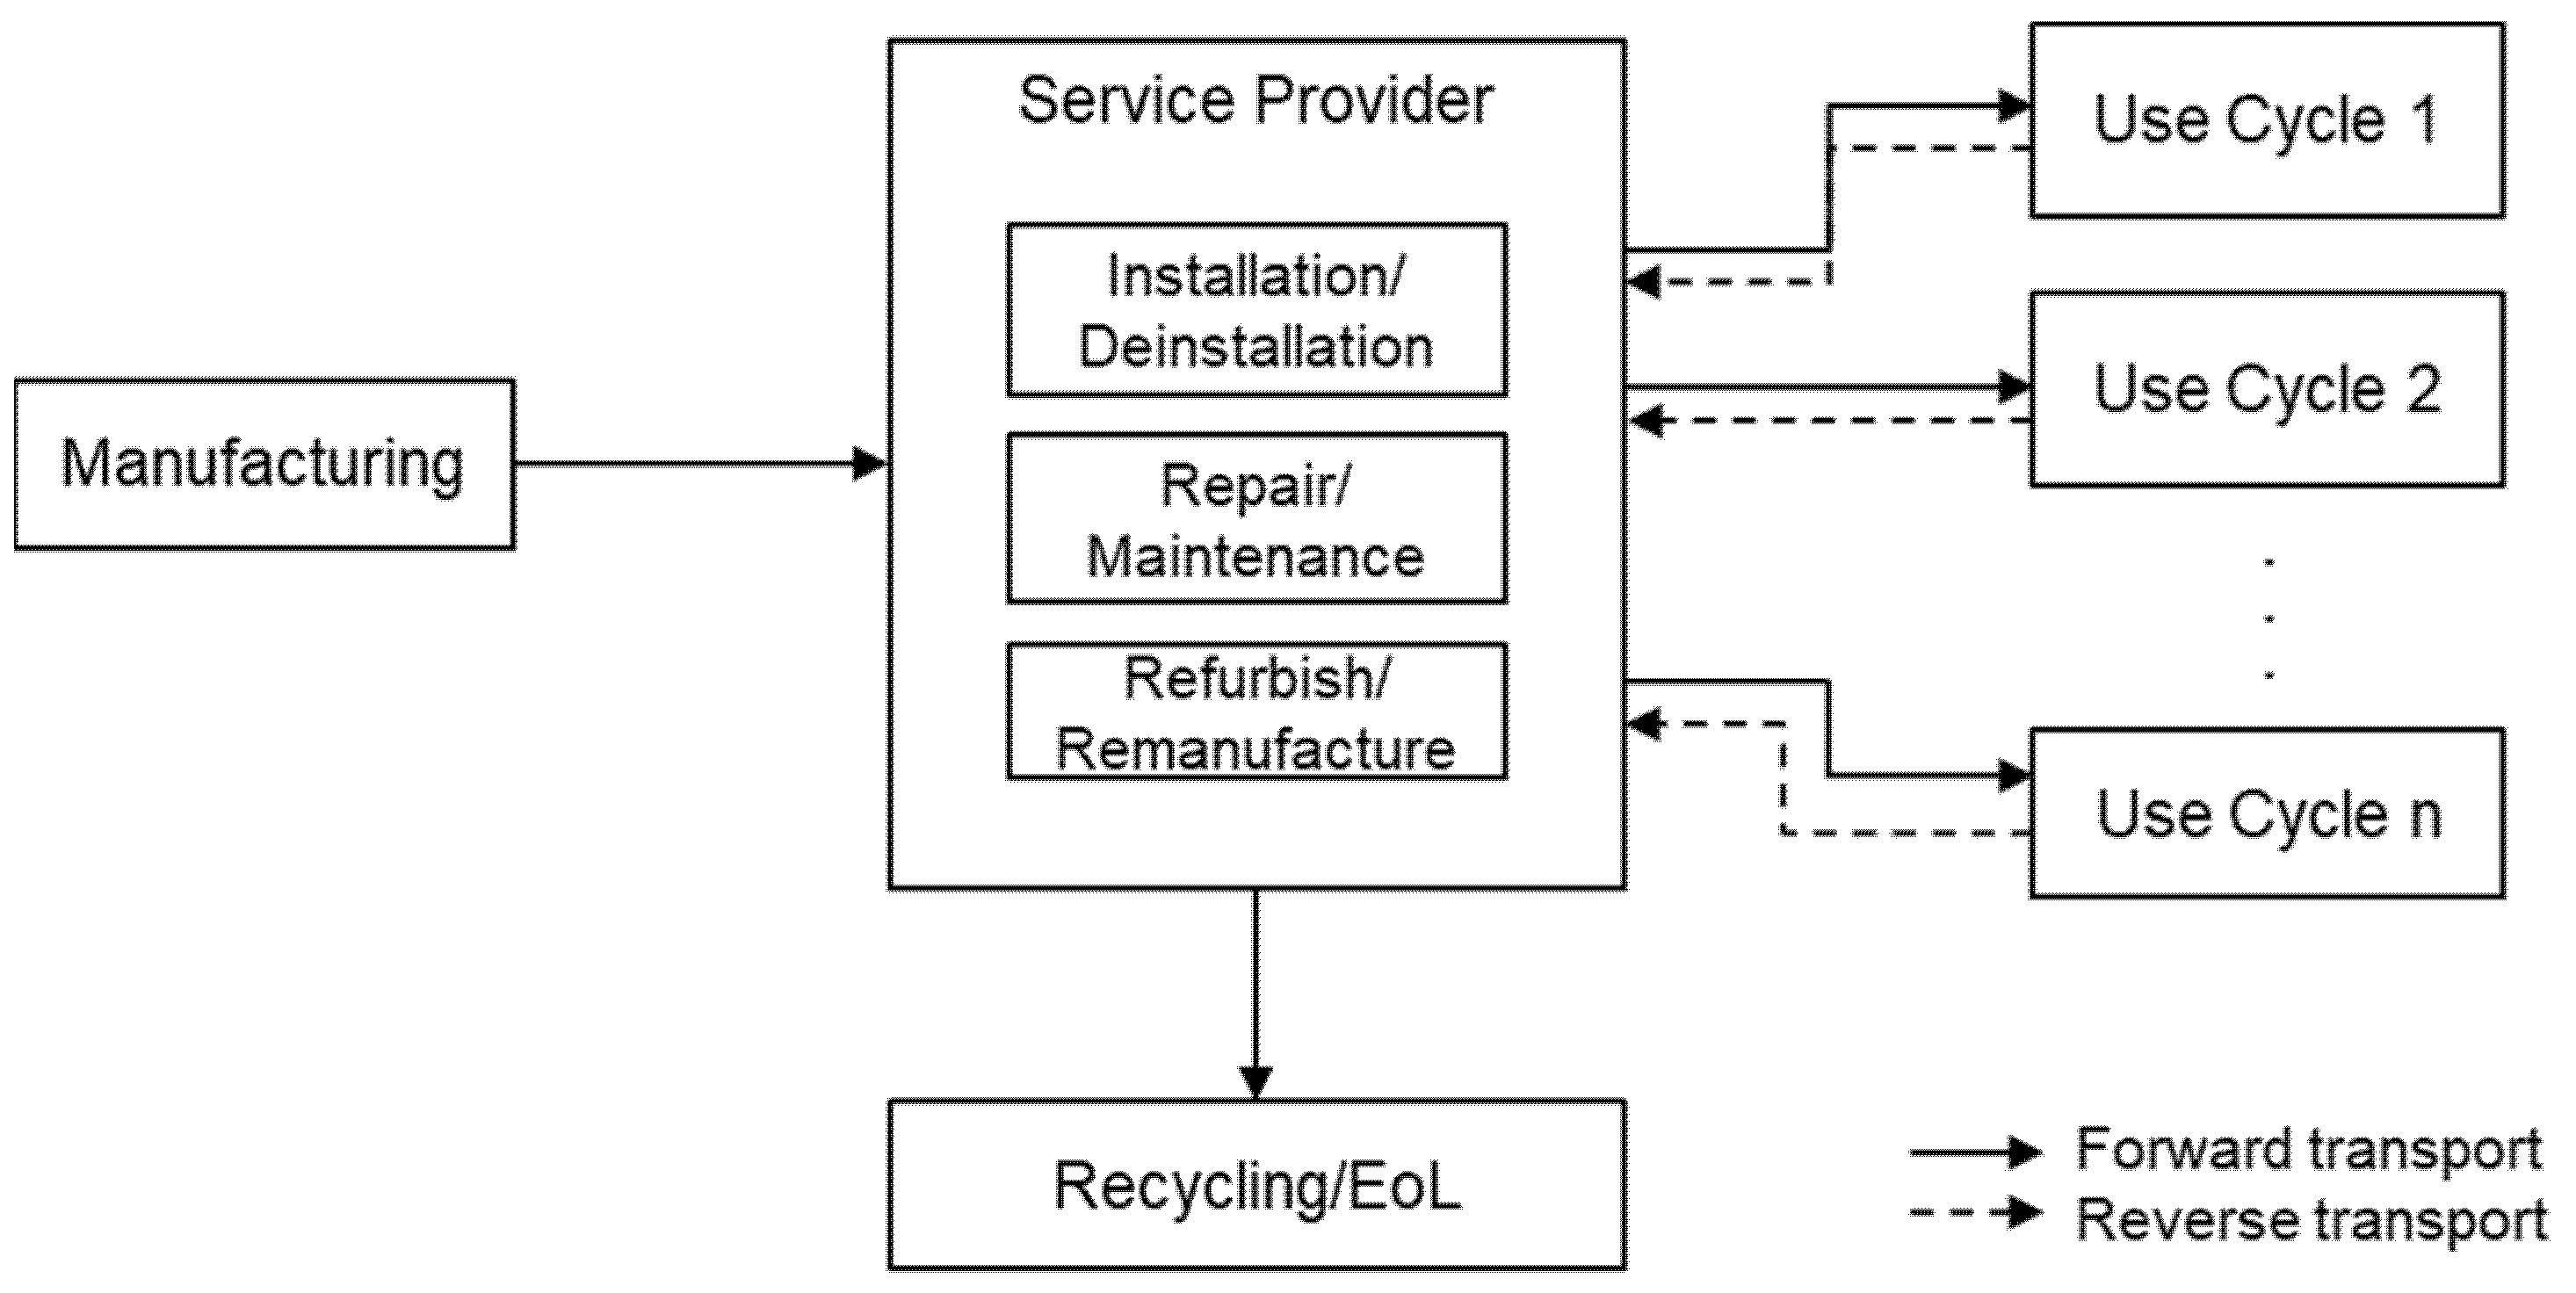
Here, we will use an example to illustrate the implications of emission intensity for the life cycle assessment of a circular product. The case of a circular washing machine offered in a pay-per-wash (PPW) business model is used to illustrate the implications. The washing machine is long-lasting and designed for multiple life cycles, hence capable of being reused, refurbished, and recycled. The system boundary flowchart of the circular washing machine used for illustrative purposes is shown in Figure 4. It is assumed that, after manufacturing, the washing machine is transported to the service provider whose role is to deploy the washing machines in the market, provide service and maintenance, and carry out recovery operations. The total number of use cycles the washing machine goes through during its entire life cycle depends on the duration of the contract for which the PPW service is offered and the willingness of the customer to extend the service contract or terminate it. At the end of each use cycle (EoU), the condition of the washing machine is assessed and recovery operations take place accordingly to bring the machine to as-good-as-new condition for the next use cycle. At the end of life (EoL), the washing machine goes to EoL treatment.
Simulation modeling is employed to highlight the emission intensity per unit of time during each life cycle phase (i.e., manufacturing, forward transport, use, reverse transport, refurbishing, and EoL) of a circular washing machine. Emissions data for individual life cycle phases have been extracted from an existing LCA study of household washing machines [38] which also considers refurbishment options. Let f ( t ) i be the function representing the GHG emission intensity at time t of the life cycle phase i . The definite integral of f ( t ) i over the interval [ a i ,   b i ] , which represents the duration of life cycle phase i , expressed as F ( t ) i = a i b i f ( t ) i d t can be interpreted as the aggregated GHG emissions in the life cycle phase i . Therefore, the area underneath the GHG emission intensity curve y = f ( t ) i over the interval [ a i ,   b i ] represents the aggregated GHG emissions in life cycle phase i . The total GHG emissions during the entire life cycle of the product can be expressed using Equation (2).
F ( t ) = i = 1 n F ( t ) i = i = 1 n a i b i f ( t ) i d t
where,
f ( t ) i GHG emission intensity at time t in life cycle phase i
[ a i ,   b i ] Timespan of life cycle phase i
F ( t ) i Aggregate GHG emissions in life cycle phase i
n Number of life cycle phases
F ( t ) Aggregate GHG emissions over the entire life cycle.
The circular washing machine is designed for a total of 15 years of useful life (i.e., 5400 days) and emissions amount per day are calculated during its different life cycle phases (i.e., manufacturing, forward transport, use cycles, reverse transport, refurbishing, recycling). The outcomes of scenarios with three and five use cycles in a PPW business model are shown in Figure 5 and Figure 6 respectively. It can be observed that in both scenarios the emission intensity per day during the use phase is minor with respect to the other life cycle phases (e.g., manufacturing, transportation, refurbishing, and recycling). Moreover, increasing the number of use cycles of the same product causes more emissions due to the more frequent transportation (i.e., product return to the service provider and redistribution) and required recovery operations. The example clearly shows that analyzing the temporal variability in inventory data and calculating the emission intensity during different life cycle phases have implications for product design (e.g., designing a long-lasting washing machine that requires minor recovery operations after each use cycle) and business model design (e.g., analyzing the optimum number of use cycles considering both the economic and the environmental perspective), as well as supply chain design (e.g., designing forward and reverse transport including location decision for maintenance/refurbishment operations) to coordinate take-back and redistribution of products efficiently, in order to improve the environmental performance.

7. Discussion and Conclusions

This work aimed to analyze the temporal variability in inventory data for life cycle assessment and its implications in the context of a CE. It acknowledges the importance of considering both the timespan and the amount of emissions for individual life cycle phases of a product at the inventory analysis stage of an LCA study. Building on the work of [4,29], it proposes a complementary approach to the conventional aggregate emission-based LCA approach and argues for calculating and comparing the emission intensity for individual life cycle phases based on their timespan and amount of emissions. Emission intensity is defined as the emission amount per unit of time during a particular life cycle phase of a product. In the conventional LCA approach, mostly and especially in energy-using products, the use phase appears to dominate the emissions as emissions are generated over a long timespan. This aggregation-based approach to analyze and interpret inventory data has had a profound impact on practice and policy leading to major changes in product design (e.g., the lightweighting of automobiles to improve fuel efficiency during use phase) as well as policies and regulations to improve the environmental performance of products (e.g., Ecodesign and Car Labeling Directives) with a major focus on the use phase. Thus, the aim here was to understand how the emission intensity-based approach to LCA might change the implications and recommendations of LCA results.
This is particularly important in the context of CE, as conventional LCA is used for cradle-to-grave products and does not consider the environmental impacts of circular products with multiple use cycles. In comparison to conventional products, circular products have numerous life cycle activities, which increase the complexity of their environmental impacts. Ignoring the timespan of individual life cycle phases in the LCA study of circular products leads to difficulty in identifying hotspots of emission-intensive loops and activities. Furthermore, analysis of the environmental impacts of circular products requires a systemic approach that considers interactions between product design, business model design, and supply chain design. The emission intensity-based approach to LCA can provide information to better design these functions and their interactions to achieve an overall better environmental performance of the system. The example of a circular washing machine in Section 6 shows that by calculating and comparing the emission intensity during different phases, the emission-intensive hotspots shifted from the use phase to the manufacturing, transportation, and recovery phases. Comparing the two emission intensity-based life cycle scenarios of a circular washing machine reveals a strong interaction between product, business model, and supply chain design and their impact on the generated amount of emissions.
From the example, it appears that business model design has a significant impact on the amount of emissions generated during the life cycle of a circular product. In particular, the business model for a circular product should consider the optimum number of use cycles. In terms of economic performance, short-term contracts may be more attractive for customers, but they lead to a high number of use cycles, hence higher environmental impact due to high emission intensity during transportation and recovery operations.
Similarly, product design has a major impact on the emission intensity during different life cycle phases and the total amount of emissions generated during the entire life cycle of a circular product. The lifespan of the product must be designed according to the number of use cycles considered in the business model design. Furthermore, the product should be designed such that the emission intensity during recovery processes (i.e., refurbishing, remanufacturing, and recycling) is low, as product design can make the recovery process less or more emission-intensive.
Lastly, supply chain design significantly affects the environmental performance of circular products. Circular products may require more frequent transportation which is an emission-intensive activity; therefore, it is important to consider supply chain network design including mode of transport, load, and location decisions necessary for recovery operations on a circular product.
This work concludes that, to perform LCA, the timespan of individual life cycle phases should be considered as an important factor. Calculating and comparing emission intensity during different life cycle phases of a product can help to identify the hotspots of emission-intensive activities. This is particularly important in the context of a CE. Emission intensity-based LCAs of circular products have implications for product, business model, and supply chain design. The proposed emission intensity-based LCA approach provides the critical information needed to assess the environmental impacts of a circular system. Besides, the hotspots can be identified to improve the product, business model, and supply chain design and their interactions for better environmental performance.

Author Contributions

Conceptualization, S.S.-u.-H. and A.R.; methodology, S.S.-u.-H. and M.R.; software, M.R.; validation, S.S.-u.-H. and M.R.; formal analysis, S.S.-u.-H. and M.R.; investigation, S.S.-u.-H. and M.R.; resources, A.R. and F.M.A.A.; data curation, S.S.-u.-H. and M.R.; writing—original draft preparation, S.S.-u.-H. and M.R.; writing—review and editing, F.M.A.A., N.S. and A.R.; visualization, S.S.-u.-H. and M.R.; supervision, A.R.; project administration S.S.-u.-H.; funding acquisition, A.R. All authors have read and agreed to the published version of the manuscript.

Funding

This research received no external funding.

Institutional Review Board Statement

Not applicable.

Informed Consent Statement

Not applicable.

Data Availability Statement

The data presented in this study are available on request from the corresponding author.

Acknowledgments

This work received support from the Circular Economy Initiative at KTH (CE@KTH) and the European Union’s Horizon 2020 research and innovation program under grant agreement No 776577-2.

Conflicts of Interest

The authors declare no conflict of interest.

References

  1. Bevilacqua, M.; Ciarapica, F.E.; Giacchetta, G. LCA Process in the Eco-Design Process. In Design for Environment as a Tool for the Development of a Sustainable Supply Chain; Springer: London, UK, 2012; pp. 33–60. [Google Scholar] [CrossRef]
  2. ISO 14040:2006 Environmental Management—Life Cycle Assessment—Principles and Framework. Available online: https://www.iso.org/standard/37456.html (accessed on 1 January 2021).
  3. Owens, J.W. Life-Cycle Assessment: Constraints on Moving from Inventory to Impact Assessment. J. Ind. Ecol. 1997, 1, 37–49. [Google Scholar] [CrossRef]
  4. Yuan, C.; Wang, E.; Zhai, Q.; Yang, F. Temporal discounting in life cycle assessment: A critical review and theoretical framework. Environ. Impact Assess. Rev. 2015, 51, 23–31. [Google Scholar] [CrossRef]
  5. ISO. 14044:2006 Environmental Management—Life Cycle Assessment—Requirements and Guidelines. Available online: https://www.iso.org/standard/38498.html (accessed on 1 January 2021).
  6. Anand, C.K.; Amor, B. Recent developments, future challenges and new research directions in LCA of buildings: A critical review. Renew. Sustain. Energy Rev. 2017, 67, 408–416. [Google Scholar] [CrossRef]
  7. Finnveden, G.; Hauschild, M.Z.; Ekvall, T.; Guinée, J.; Heijungs, R.; Hellweg, S.; Koehler, A.; Pennington, D.; Suh, S. Recent developments in life cycle assessment. J. Environ. Manag. 2009, 91, 1–21. [Google Scholar] [CrossRef]
  8. Weidema, B.P. New Developments in the Methodology for LCA. In Proceedings of the 3rd International Conference on Ecobalance, Tsukuba, Japan, 25–27 November 1998. [Google Scholar]
  9. Gibon, T.; Schaubroeck, T. Lifting the fog on characteristics and limitations of hybrid LCA—A reply to “Does hybrid LCA with a complete system boundary yield adequate results for product promotion? Int. J. Life Cycle Assess. 2017, 22, 1005–1008. [Google Scholar] [CrossRef]
  10. Yang, Y. Does hybrid LCA with a complete system boundary yield adequate results for product promotion? Int. J. Life Cycle Assess. 2017, 22, 456–460. [Google Scholar] [CrossRef]
  11. Yang, Y.; Heijungs, R.; Brandão, M. Hybrid life cycle assessment (LCA) does not necessarily yield more accurate results than process-based LCA. J. Clean. Prod. 2017, 150, 237–242. [Google Scholar] [CrossRef]
  12. Rebitzer, G.; Ekvall, T.; Frischknecht, R.; Hunkeler, D.; Norris, G.; Rydberg, T.; Schmidt, W.-P.; Suh, S.; Weidema, B.P.; Pennington, D.W. Life cycle assessment: Part 1: Framework, goal and scope definition, inventory analysis, and applications. Environ. Int. 2004, 30, 701–720. [Google Scholar] [CrossRef]
  13. Curran, M.A. Strengths and limitations of life cycle assessment. In Background and Future Prospects in Life Cycle Assessment; Springer: Berlin/Heidelberg, Germany, 2014; pp. 189–206. [Google Scholar]
  14. Huijbregts, M.A. Application of uncertainty and variability in LCA. Int. J. Life Cycle Assess. 1998, 3, 273. [Google Scholar] [CrossRef]
  15. Reap, J.; Roman, F.; Duncan, S.; Bras, B. A Survey of Unresolved Problems in Life Cycle Assessment. Part 1: Goal and Scope and Inventory Analysis. Available online: https://www.infona.pl/resource/bwmeta1.element.springer-4f0f90bb-d984-3957-8d68-e5ab47285d65 (accessed on 1 January 2021).
  16. Margni, M.; Curran, M.A. Life cycle impact assessment. In Life Cycle Assessment Handbook: A Guide for Environmentally Sustainable Products; Curran, M.A., Ed.; Scrivener Publishing LLC: Salem, MA, USA, 2012; pp. 67–103. [Google Scholar]
  17. Reap, J.; Roman, F.; Duncan, S.; Bras, B. A Survey of Unresolved Problems in Life Cycle Assessment. Part 2: Impact Assessment and Interpretation. Available online: https://link.springer.com/article/10.1007/s11367-008-0009-9 (accessed on 1 January 2021).
  18. Owens, J.W. Life-Cycle Assessment in Relation to Risk Assessment: An Evolving Perspective. Risk Anal. 1997, 17, 359–365. [Google Scholar] [CrossRef]
  19. Østergaard, N.; Thorsted, L.; Miraglia, S.; Birkved, M.; Rasmussen, F.N.; Birgisdottir, H.; Kalbar, P.; Georgiadis, S. Data driven quantification of the temporal scope of building LCAs. Procedia CIRP 2018, 69, 224–229. [Google Scholar] [CrossRef]
  20. Miller, S.A.; Moysey, S.; Sharp, B.; Alfaro, J. A stochastic approach to model dynamic systems in life cycle assessment. J. Ind. Ecol. 2013, 17, 352–362. [Google Scholar] [CrossRef]
  21. Björk, H.; Rasmuson, A. A method for life cycle assessment environmental optimisation of a dynamic process exemplified by an analysis of an energy system with a superheated steam dryer integrated in a local district heat and power plant. Chem. Eng. J. 2002, 87, 381–394. [Google Scholar] [CrossRef]
  22. Su, S.; Li, X.; Zhu, Y.; Lin, B. Dynamic LCA framework for environmental impact assessment of buildings. Energy Build. 2017, 149, 310–320. [Google Scholar] [CrossRef]
  23. Guinée, J.; Heijungs, R.; Oers, L.V.; Meent, D.V.D.; Vermeire, T.; Rikken, M. LCA Impact Assessment of Toxic Releases. Generic Modelling of Fate, Exposure and Effect for Ecosystems and Human Beings with Data for about 100 Chemicals; Dutch Ministry of Housing, Spatial Planning and Environment: Leiden, The Netherlands, 1996; p. 100. [Google Scholar]
  24. Sohn, J.; Kalbar, P.; Goldstein, B.; Birkved, M. Defining Temporally Dynamic Life Cycle Assessment: A Review. Integr. Environ. Assess. Manag. 2020, 16, 314–323. [Google Scholar] [CrossRef]
  25. Beloin-Saint-Pierre, D.; Albers, A.; Hélias, A.; Tiruta-Barna, L.; Fantke, P.; Levasseur, A.; Benetto, E.; Benoist, A.; Collet, P. Addressing temporal considerations in life cycle assessment. Sci. Total Environ. 2020, 743, 140700. [Google Scholar] [CrossRef]
  26. Lueddeckens, S.; Saling, P.; Guenther, E. Temporal issues in life cycle assessment—A systematic review. Int. J. Life Cycle Assess. 2020, 25, 1385–1401. [Google Scholar] [CrossRef]
  27. Kendall, A.; Chang, B.; Sharpe, B. Accounting for Time-Dependent Effects in Biofuel Life Cycle Greenhouse Gas Emissions Calculations. Environ. Sci. Technol. 2009, 43, 7142–7147. [Google Scholar] [CrossRef]
  28. Hellweg, S.; Hofstetter, T.B.; Hungerbuhler, K. Discounting and the environment should current impacts be weighted differently than impacts harming future generations? Int. J. Life Cycle Assess. 2003, 8, 8. [Google Scholar] [CrossRef]
  29. Yuan, C.Y.; Simon, R.; Mady, N.; Dornfeld, D. Embedded temporal difference in Life Cycle Assessment: Case study on VW Golf A4 CAR. In Proceedings of the 2009 IEEE International Symposium on Sustainable Systems and Technology, Phoenix, AZ, USA, 18–20 May 2009; pp. 1–6. [Google Scholar]
  30. Castro, M.B.G.; Remmerswaal, J.A.M.; Reuter, M.A. Life cycle impact assessment of the average passenger vehicle in the Netherlands. Int. J. Life Cycle Assess. 2003, 8, 297–304. [Google Scholar] [CrossRef]
  31. Samaras, C.; Meisterling, K. Life Cycle Assessment of Greenhouse Gas Emissions from Plug-in Hybrid Vehicles: Implications for Policy. Environ. Sci. Technol. 2008, 42, 3170–3176. [Google Scholar] [CrossRef] [PubMed] [Green Version]
  32. Xiao, R.; Zhang, Y.; Liu, X.; Yuan, Z. A life-cycle assessment of household refrigerators in China. J. Clean. Prod. 2015, 95, 301–310. [Google Scholar] [CrossRef]
  33. Broch, F.; Warsen, J.; Krinke, S. Implementing life cycle engineering in automotive development as a helpful management tool to support design for environment. In Life Cycle Management; Guido, S., Margin, M., Eds.; Springer: Dordrecht, The Netherlands, 2015; pp. 319–329. [Google Scholar] [CrossRef] [Green Version]
  34. Rashid, A.; Asif, F.M.A.; Krajnik, P.; Nicolescu, C.M. Resource Conservative Manufacturing: An essential change in business and technology paradigm for sustainable manufacturing. J. Clean. Prod. 2013, 57, 166–177. [Google Scholar] [CrossRef]
  35. Rashid, A.; Roci, M.; Asif, F.M.A. Circular Manufacturing Systems. In Handbook of the Circular Economy; Miguel, B., David, L., Goran, F., Eds.; Edward Elgar Publishing: Cheltenham, UK, 2020. [Google Scholar]
  36. Foundation, E.M. Infographic—Circular Economy System Diagram. Available online: https://www.ellenmacarthurfoundation.org/circular-economy/infographic (accessed on 15 July 2020).
  37. Asif, F.M.A.; Bianchi, C.; Rashid, A.; Nicolescu, C.M. Performance analysis of the closed loop supply chain. J. Remanuf. 2012, 2. [Google Scholar] [CrossRef] [Green Version]
  38. WRAP. Environmental Life Cycle Assessment (LCA) Study of Replacement and Refurbishment Options for Domestic Washing Machines; MDD019; Waste and Resources Action Programme: Banbury, UK, 2010. [Google Scholar]
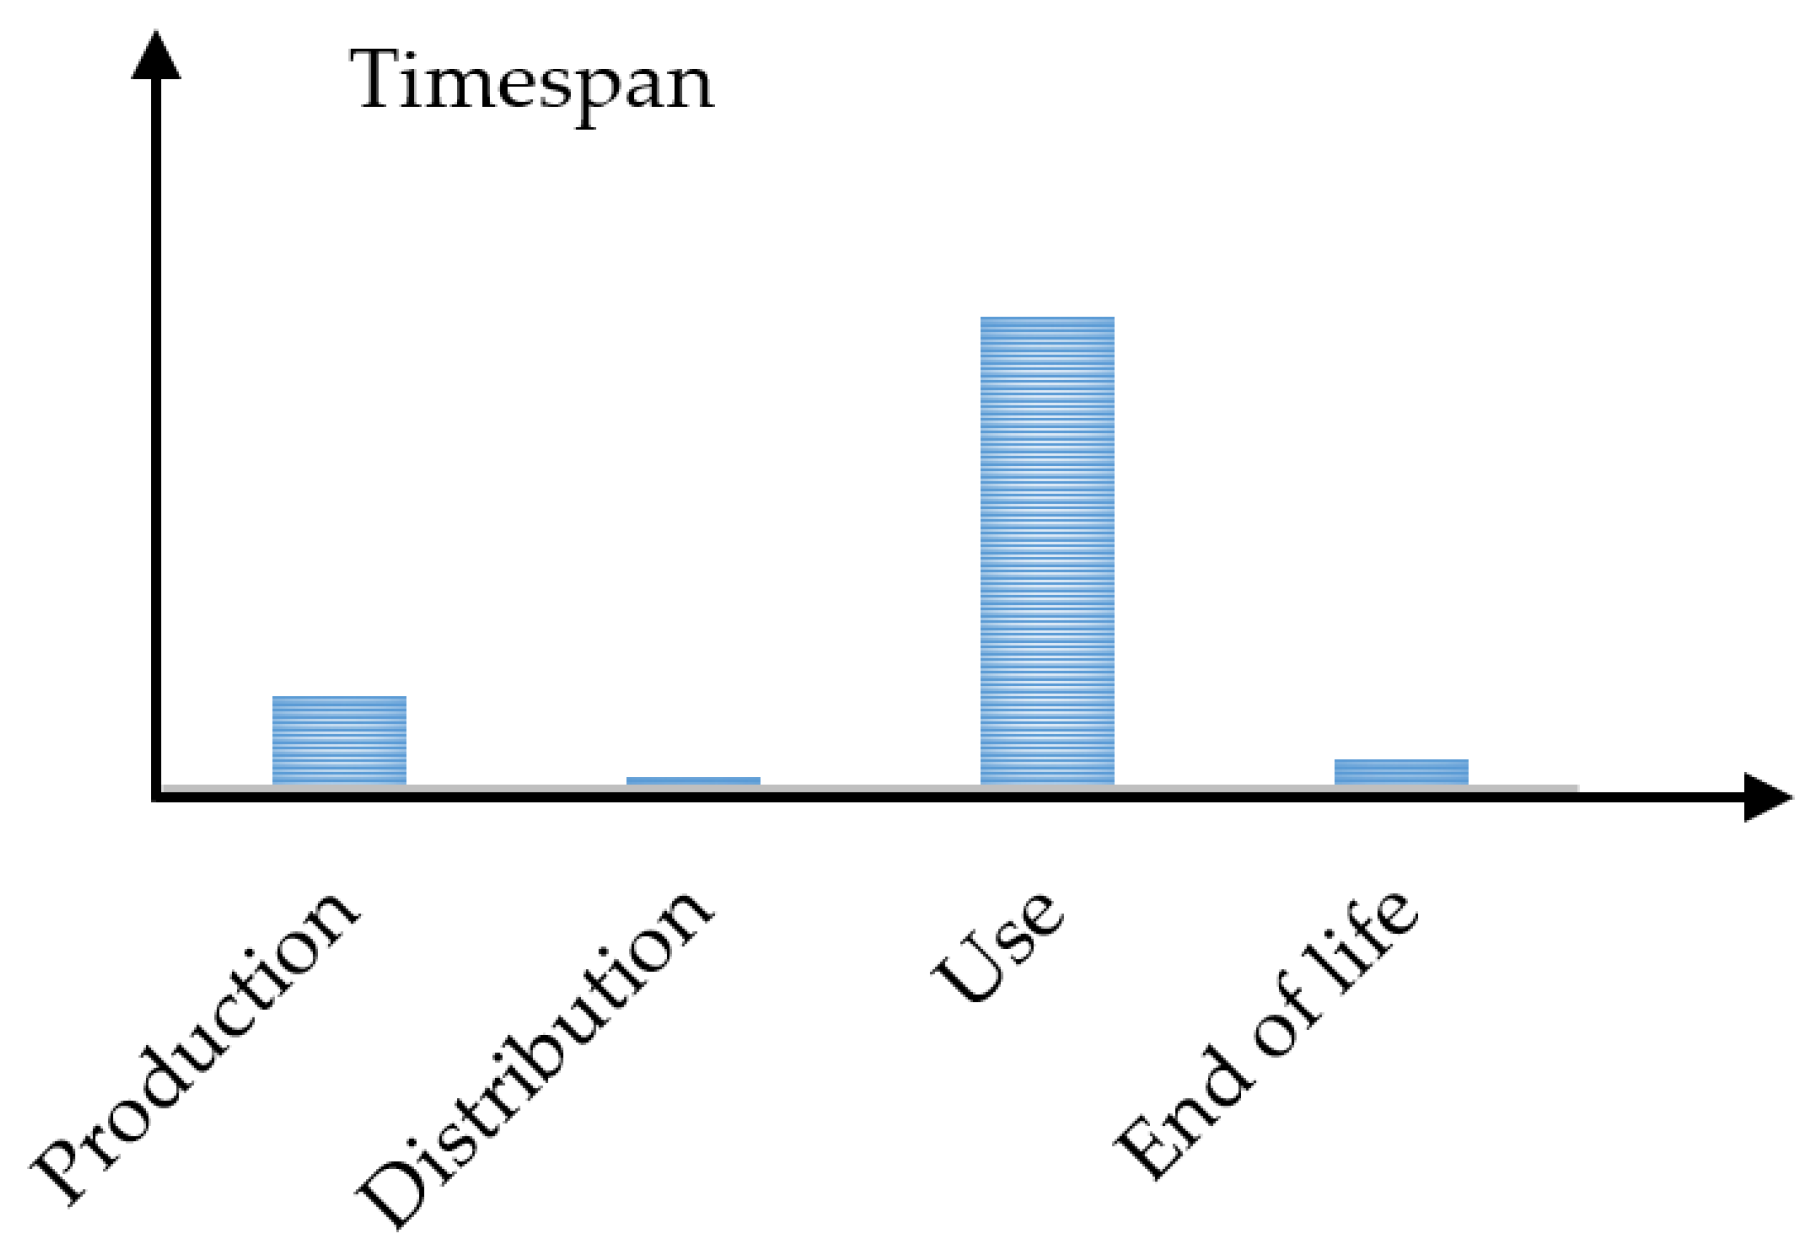
Figure 1. Illustrative graph of timespan of different life cycle phases.
Sustainability 13 00344 g001
Figure 2. Illustrative graph of aggregate emissions during the entire life cycle.
Sustainability 13 00344 g002
Figure 3. Emission intensity during different life cycle phases of a Golf VII, 1.6 TDI (based on the work of [29,33]).
Sustainability 13 00344 g003
Figure 4. System boundary flow chart of a circular washing machine in a pay per wash business model (EoL: end of life).
Sustainability 13 00344 g004
Figure 5. Emission intensity during different life cycle phases of a circular washing machine with three use cycles in a pay per wash business model.
Sustainability 13 00344 g005
Figure 6. Emission intensity during different life cycle phases of a circular washing machine with five use cycles in a pay per wash business model.
Sustainability 13 00344 g006
Table 1. Implications of conventional LCA results for practice and policy.
ReferenceProduct TypeIdentified Significant IssuesImplications for Practice Implications for Policy
[30] Automotive
(Passenger Vehicle)
The largest environmental impact occurs in the use phase due to the combustion and depletion of fossil fuelsFuture efforts should consider the reduction of the environmental impact of the use phaseFuture legislation efforts should be based on the environmental impact of the emissions rather than only on their amounts
[31] Automotive
(Plug-in Hybrid Vehicle -PHEVs)
Electricity consumption in the use phase has a major impact on GHG emissions;
lithium-ion battery materials and
production account for 2–5% of life cycle emissions
The lifetime and performance of the battery is an
important parameter for the economic and environmental
success of PHEVs
Public policies
that complement PHEV adoption should focus on encouraging charging with low-carbon electricity
[32] Household RefrigeratorElectricity consumption in the use phase has the highest environmental impact along with material consumption during the production phaseStudy suggests improvements in product design, advances in manufacture practices, consumer encouragement, supply chain optimizationEmphasizes the importance of a better understanding of the life cycle environmental impacts of Chinese refrigerators and ways to improve its sustainability
[33] Automotive
(Passenger Vehicle)
Use phase is responsible for 79% of GHG emissionsMass reduction with lightweight design optionsLife cycle-based improvement forms an integral part of
Volkswagen’s corporate policy and environmental strategy
Table 2. GHG emissions, timespan, and emission intensity during different life cycle phases (based on the work of [29,33]).
Life Cycle Phases.GHG Emissions
(Kg CO2–eq)
Timespan
(days)
Emission Intensity
(Kg CO2–eq/day)
Mining and material production/supply4439.8035412.54
Manufacturing1180.2021.554.89
Usage22,199.0036506.08
End of life281.004.562.44
Publisher’s Note: MDPI stays neutral with regard to jurisdictional claims in published maps and institutional affiliations.