Associations of Physical Activity and Sedentary Behaviour Assessed by Accelerometer with Body Composition among Children and Adolescents: A Scoping Review


Abstract
1. Introduction
2. Materials and Methods
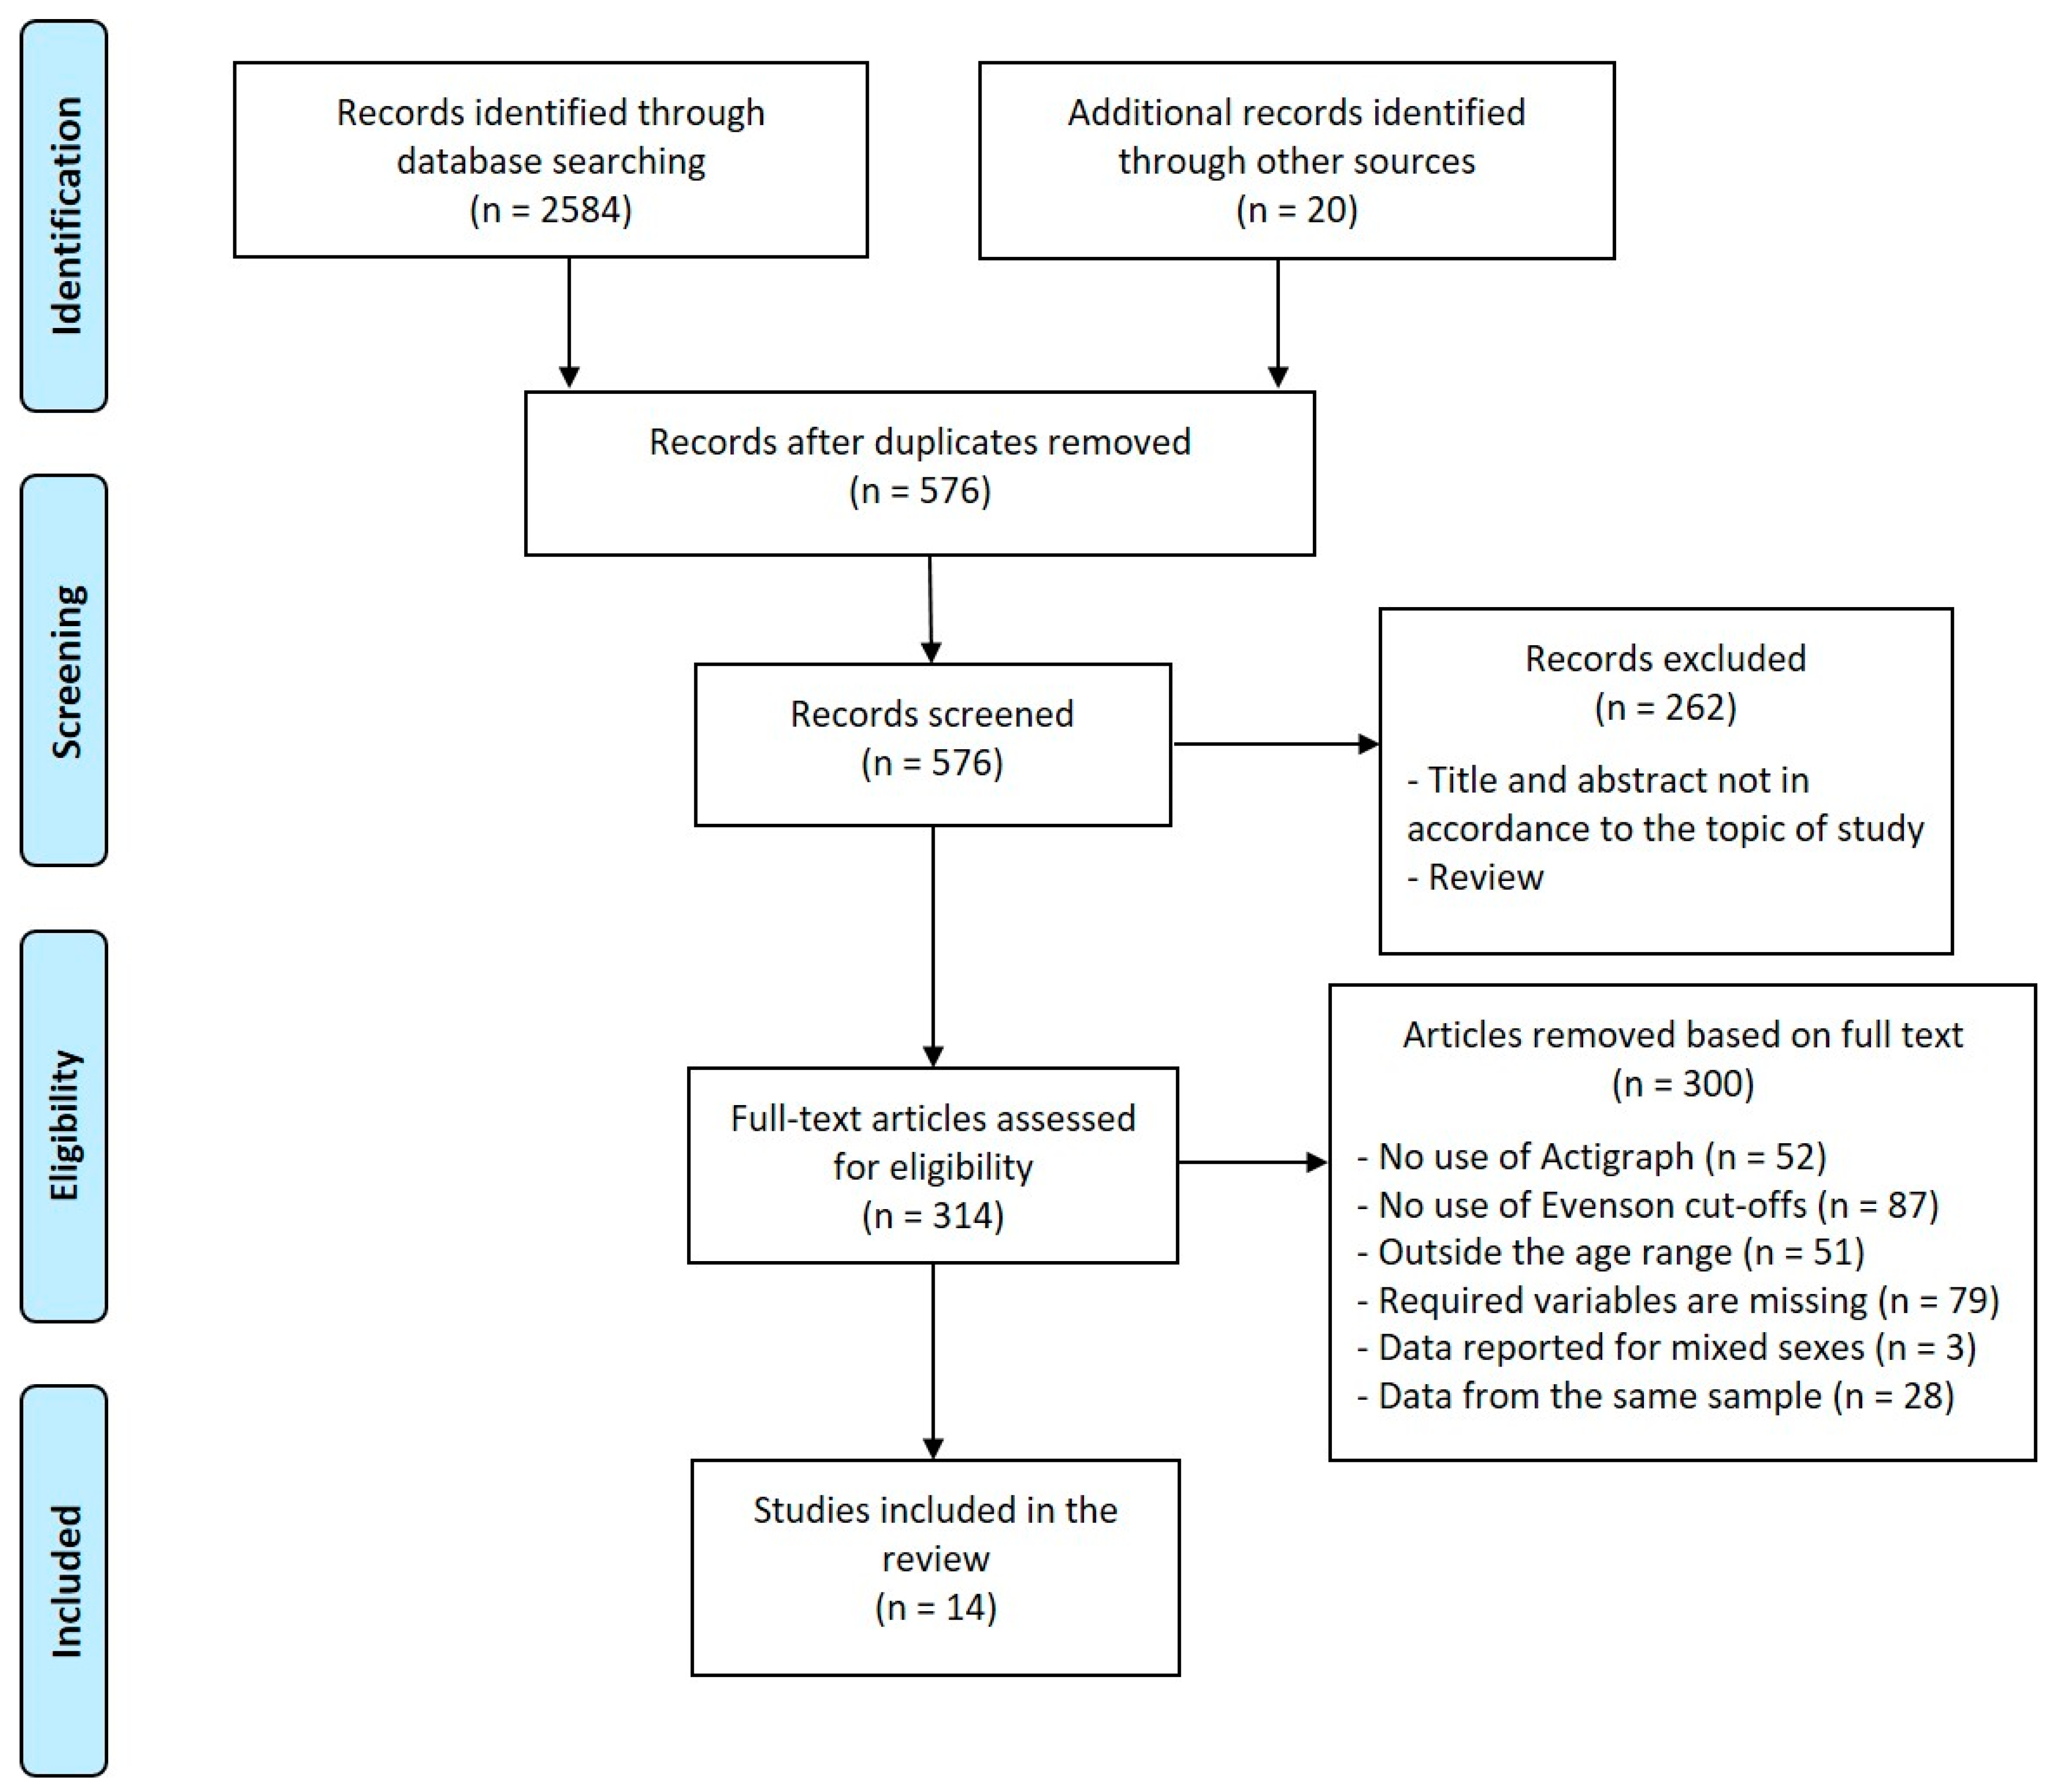
2.1. Searching Strategy
2.2. Criteria for Inclusion and Exclusion
2.3. Examined Variables
2.4. Statistical Analysis
3. Results
3.1. Description of Included Studies
3.2. General Overview
4. Discussion
4.1. Trend of PA and Body Composition with Age, Sex and Population
4.2. Association between PA and Body Composition Parameters
4.3. Strength and Limitations
5. Conclusions
Author Contributions
Funding
Institutional Review Board Statement
Informed Consent Statement
Data Availability Statement
Conflicts of Interest
References
- Ha, A.S.; Ng, J.Y.Y.; Lonsdale, C.; Lubans, D.R.; Ng, F.F. Promoting physical activity in children through family-based intervention: Protocol of the “Active 1 + FUN” randomized controlled trial. BMC Public Health 2019, 19, 218. [Google Scholar] [CrossRef]
- Zaccagni, L.; Rinaldo, N.; Bramanti, B.; Gualdi-Russo, E. Relation between lifestyle behaviors and body composition patterns among healthy young Italians: A cross-sectional study. J. Sports Med. Phys. Fit. 2018, 58, 1652–1656. [Google Scholar] [CrossRef]
- NCD Risk Factor Collaboration (NCD-RisC). Worldwide trends in body-mass index, underweight, overweight, and obesity from 1975 to 2016: A pooled analysis of 2416 population-based measurement studies in 128 9 million children, adolescents, and adults. Lancet 2017, 390, 2627–2642. [Google Scholar] [CrossRef]
- NCD Risk Factor Collaboration (NCD-RisC). Rising rural body-mass index is the main driver of the global obesity epidemic in adults. Nature 2019, 569, 260–264. [Google Scholar] [CrossRef] [PubMed]
- Ness, A.R.; Leary, S.D.; Mattocks, C.; Blair, S.N.; Reilly, J.J.; Wells, J.; Ingle, S.; Tilling, K.; Smith, G.D.; Riddoch, C. Objectively measured physical activity and fat mass in a large cohort of children. PLoS Med. 2007, 4, e97. [Google Scholar] [CrossRef] [PubMed]
- Metcalf, B.; Henley, W.; Wilkin, T. Effectiveness of intervention on physical activity of children: Systematic review and meta-analysis of controlled trials with objectively measured outcomes (EarlyBird 54). BMJ 2012, 345, e5888. [Google Scholar] [CrossRef] [PubMed]
- Harris, K.C.; Kuramoto, L.K.; Schulzer, M.; Retallack, J.E. Effect of school-based physical activity interventions on body mass index in children: A meta-analysis. CMAJ 2009, 180, 719–726. [Google Scholar] [CrossRef] [PubMed]
- Waters, E.; de Silva-Sanigorski, A.; Hall, B.J.; Brown, T.; Campbell, K.J.; Gao, Y.; Armstrong, R.; Prosser, L.; Summerbell, C.D. Interventions for preventing obesity in children. Cochrane Database Syst. Rev. 2011, CD001871. [Google Scholar] [CrossRef] [PubMed]
- Wilks, D.C.; Sharp, S.J.; Ekelund, U.; Thompson, S.G.; Mander, A.P.; Turner, R.M.; Jebb, S.A.; Lindroos, A.K. Objectively measured physical activity and fat mass in children: A bias-adjusted meta-analysis of prospective studies. PLoS ONE 2011, 6, e17205. [Google Scholar] [CrossRef] [PubMed]
- Kwon, S.; Janz, K.F.; Letuchy, E.M.; Burns, T.L.; Levy, S.M. Active lifestyle in childhood and adolescence prevents obesity development in young adulthood. Obesity 2015, 23, 2462–2469. [Google Scholar] [CrossRef]
- Katzmarzyk, P.T.; Barreira, T.V.; Broyles, S.T.; Champagne, C.M.; Chaput, J.-P.; Fogelholm, M.; Hu, G.; Johnson, W.D.; Kuriyan, R.; Kurpad, A.; et al. Physical Activity, Sedentary Time, and Obesity in an International Sample of Children. Med. Sci. Sports Exerc. 2015, 47, 2062–2069. [Google Scholar] [CrossRef] [PubMed]
- Kelley, G.A.; Kelley, K.S.; Pate, R.R. Exercise and BMI in Overweight and Obese Children and Adolescents: A Systematic Review and Trial Sequential Meta-Analysis. BioMed Res. Int. 2015, 2015, 704539. [Google Scholar] [CrossRef] [PubMed]
- McClung, H.L.; Ptomey, L.T.; Shook, R.P.; Aggarwal, A.; Gorczyca, A.M.; Sazonov, E.S.; Becofsky, K.; Weiss, R.; Das, S.K. Dietary Intake and Physical Activity Assessment: Current Tools, Techniques, and Technologies for Use in Adult Populations. Am. J. Prev. Med. 2018, 55, e93–e104. [Google Scholar] [CrossRef] [PubMed]
- Treuth, M.S.; Hou, N.; Young, D.R.; Maynard, L.M. Validity and reliability of the Fels physical activity questionnaire for children. Med. Sci. Sports Exerc. 2005, 37, 488–495. [Google Scholar] [CrossRef]
- Trost, S.G.; Loprinzi, P.D.; Moore, R.; Pfeiffer, K.A. Comparison of accelerometer cut points for predicting activity intensity in youth. Med. Sci. Sports Exerc. 2011, 43, 1360–1368. [Google Scholar] [CrossRef]
- Duncan, S.; Stewart, T.; Bo Schneller, M.; Godbole, S.; Cain, K.; Kerr, J. Convergent validity of ActiGraph and Actical accelerometers for estimating physical activity in adults. PLoS ONE 2018, 13, e0198587. [Google Scholar] [CrossRef]
- Wijndaele, K.; Westgate, K.; Stephens, S.K.; Blair, S.N.; Bull, F.C.; Chastin, S.F.M.; Dunstan, D.W.; Ekelund, U.; Esliger, D.W.; Freedson, P.S.; et al. Utilization and Harmonization of Adult Accelerometry Data: Review and Expert Consensus. Med. Sci. Sports Exerc. 2015, 47, 2129–2139. [Google Scholar] [CrossRef]
- Colley, R.C.; Garriguet, D.; Janssen, I.; Craig, C.L.; Clarke, J.; Tremblay, M.S. Physical activity of Canadian children and youth: Accelerometer results from the 2007 to 2009 Canadian Health Measures Survey. Health Rep. 2011, 22, 15–23. [Google Scholar]
- Vanhelst, J.; Béghin, L.; Duhamel, A.; Bergman, P.; Sjöström, M.; Gottrand, F. Comparison of uniaxial and triaxial accelerometry in the assessment of physical activity among adolescents under free-living conditions: The HELENA study. BMC Med. Res. Methodol. 2012, 12, 26. [Google Scholar] [CrossRef]
- Smith, M.P.; Horsch, A.; Standl, M.; Heinrich, J.; Schulz, H. Uni- and triaxial accelerometric signals agree during daily routine, but show differences between sports. Sci. Rep. 2018, 8, 15055. [Google Scholar] [CrossRef]
- Freedson, P.; Pober, D.; Janz, K.F. Calibration of accelerometer output for children. Med. Sci. Sports Exerc. 2005, 37, S523–S530. [Google Scholar] [CrossRef] [PubMed]
- Puyau, M.R.; Adolph, A.L.; Vohra, F.A.; Butte, N.F. Validation and calibration of physical activity monitors in children. Obes. Res. 2002, 10, 150–157. [Google Scholar] [CrossRef] [PubMed]
- Treuth, M.S.; Schmitz, K.; Catellier, D.J.; McMurray, R.G.; Murray, D.M.; Almeida, M.J.; Going, S.; Norman, J.E.; Pate, R. Defining accelerometer thresholds for activity intensities in adolescent girls. Med. Sci. Sports Exerc. 2004, 36, 1259–1266. [Google Scholar] [PubMed]
- Mattocks, C.; Leary, S.; Ness, A.; Deere, K.; Saunders, J.; Tilling, K.; Kirkby, J.; Blair, S.N.; Riddoch, C. Calibration of an accelerometer during free-living activities in children. Int. J. Pediatr. Obes. 2007, 2, 218–226. [Google Scholar] [CrossRef]
- Evenson, K.R.; Catellier, D.J.; Gill, K.; Ondrak, K.S.; McMurray, R.G. Calibration of two objective measures of physical activity for children. J. Sports Sci. 2008, 26, 1557–1565. [Google Scholar] [CrossRef]
- Diouf, A.; Thiam, M.; Idohou-Dossou, N.; Diongue, O.; Mégné, N.; Diallo, K.; Sembène, P.M.; Wade, S. Physical activity level and sedentary behaviors among public school children in dakar (senegal) measured by paq-c and accelerometer: Preliminary results. Int. J. Environ. Res. Public Health 2016, 13, 998. [Google Scholar] [CrossRef]
- Malina, R.M.; Koziel, S.; Bielicki, T. Variation in subcutaneous adipose tissue distribution associated with age, sex, and maturation. Am. J. Hum. Biol. 1999, 11, 189–200. [Google Scholar] [CrossRef]
- Kirchengast, S. Gender differences in body composition from childhood to old age: An evolutionary point of view. J. Life Sci. 2010, 2, 1–10. [Google Scholar] [CrossRef]
- Grant, M.J.; Booth, A. A typology of reviews: An analysis of 14 review types and associated methodologies. Health Inf. Libr. J. 2009, 26, 91–108. [Google Scholar] [CrossRef]
- Moher, D.; Liberati, A.; Tetzlaff, J.; Altman, D.G. Preferred reporting items for systematic reviews and meta-analyses: The PRISMA Statement. Open Med. 2009, 3, e123–e130. [Google Scholar]
- Tricco, A.C.; Lillie, E.; Zarin, W.; O’Brien, K.K.; Colquhoun, H.; Levac, D.; Moher, D.; Peters, M.D.J.; Horsley, T.; Weeks, L.; et al. PRISMA Extension for Scoping Reviews (PRISMA-ScR): Checklist and Explanation. Ann. Intern. Med. 2018, 169, 467–473. [Google Scholar] [CrossRef] [PubMed]
- Ben Jemaa, H.; Mankaï, A.; Mahjoub, F.; Kortobi, B.; Khlifi, S.; Draoui, J.; Minaoui, R.; Karmous, I.; Ben Hmad, H.; Ben Slama, F.; et al. Physical Activity Level Assessed by Accelerometer and PAQ-C in Tunisian Children. Ann. Nutr. Metab. 2018, 73, 234–240. [Google Scholar] [CrossRef] [PubMed]
- Benítez-Porres, J.; Alvero-Cruz, J.R.; Sardinha, L.B.; López-Fernández, I.; Carnero, E.A. Valores de corte para clasificar niños y adolescentes activos utilizando el cuestionario de actividad física: PAQ-C y PAQ-A. Nutr. Hosp. 2016, 33, 1036–1044. [Google Scholar] [CrossRef]
- Bernhardsen, G.P.; Stensrud, T.; Nystad, W.; Dalene, K.E.; Kolle, E.; Ekelund, U. Early life risk factors for childhood obesity-Does physical activity modify the associations? The MoBa cohort study. Scand. J. Med. Sci. Sports 2019, 29, 1636–1646. [Google Scholar] [CrossRef] [PubMed]
- Chaput, J.P.; Lambert, M.; Mathieu, M.E.; Tremblay, M.S.; O’Loughlin, J.; Tremblay, A. Physical activity vs. sedentary time: Independent associations with adiposity in children. Pediatr. Obes. 2012, 7, 251–258. [Google Scholar] [CrossRef] [PubMed]
- de Moraes Ferrari, G.L.; Oliveira, L.C.; Araujo, T.L.; Matsudo, V.; Barreira, T.V.; Tudor-Locke, C.; Katzmarzyk, P. Moderate-to-Vigorous Physical Activity and Sedentary Behavior: Independent Associations With Body Composition Variables in Brazilian Children. Pediatr. Exerc. Sci. 2015, 27, 380–389. [Google Scholar] [CrossRef]
- Gába, A.; Mitáš, J.; Jakubec, L. Associations between accelerometer-measured physical activity and body fatness in school-aged children. Environ. Health Prev. Med. 2017, 22, 43. [Google Scholar] [CrossRef]
- Hallal, P.C.; Reichert, F.F.; Clark, V.L.; Cordeira, K.L.; Menezes, A.M.B.; Eaton, S.; Ekelund, U.; Wells, J.C. Energy expenditure compared to physical activity measured by accelerometry and self-report in adolescents: A validation study. PLoS ONE 2013, 8, e77036. [Google Scholar] [CrossRef]
- Herrmann, D.; Buck, C.; Sioen, I.; Kouride, Y.; Marild, S.; Molnár, D.; Mouratidou, T.; Pitsiladis, Y.; Russo, P.; Veidebaum, T.; et al. Impact of physical activity, sedentary behaviour and muscle strength on bone stiffness in 2-10-year-old children-cross-sectional results from the IDEFICS study. Int. J. Behav. Nutr. Phys. Act. 2015, 12, 112. [Google Scholar] [CrossRef]
- Janz, K.F.; Boros, P.; Letuchy, E.M.; Kwon, S.; Burns, T.L.; Levy, S.M. Physical Activity, Not Sedentary Time, Predicts Dual-Energy X-ray Absorptiometry-measured Adiposity Age 5 to 19 Years. Med. Sci. Sports Exerc. 2017, 49, 2071–2077. [Google Scholar] [CrossRef]
- Joensuu, L.; Syväoja, H.; Kallio, J.; Kulmala, J.; Kujala, U.M.; Tammelin, T.H. Objectively measured physical activity, body composition and physical fitness: Cross-sectional associations in 9- to 15-year-old children. Eur. J. Sport Sci. 2018, 18, 882–892. [Google Scholar] [CrossRef] [PubMed]
- McCormack, L.; Meendering, J.; Specker, B.; Binkley, T. Associations Between Sedentary Time, Physical Activity, and Dual-Energy X-ray Absorptiometry Measures of Total Body, Android, and Gynoid Fat Mass in Children. J. Clin. Densitom. 2016, 19, 368–374. [Google Scholar] [CrossRef] [PubMed]
- Santos-Magalhaes, A.F.; Aires, L.; Martins, C.; Silva, G.; Teixeira, A.M.; Mota, J.; Rama, L. Heart rate variability, adiposity, and physical activity in prepubescent children. Clin. Auton. Res. 2015, 25, 169–178. [Google Scholar] [CrossRef]
- Sardinha, L.B.; Magalhães, J.P.; Santos, D.A.; Júdice, P.B. Sedentary patterns, physical activity, and cardiorespiratory fitness in association to glycemic control in type 2 diabetes patients. Front. Physiol. 2017, 8, 262. [Google Scholar] [CrossRef]
- Amo-Setién, F.J.; Leal-Costa, C.; Abajas-Bustillo, R.; González-Lamuño, D.; Redondo-Figuero, C. Factors associated with grip strength among adolescents: An observational study. J. Hand Ther. 2020, 33, 96–102. [Google Scholar] [CrossRef] [PubMed]
- Ainsworth, B.E.; Caspersen, C.J.; Matthews, C.E.; Mâsse, L.C.; Baranowski, T.; Zhu, W. Recommendations to improve the accuracy of estimates of physical activity derived from self report. J. Phys. Act. Health 2012, 9 (Suppl. 1), S76–S84. [Google Scholar] [CrossRef]
- Spruijt-Metz, D.; Wen, C.K.F.; Bell, B.M.; Intille, S.; Huang, J.S.; Baranowski, T. Advances and Controversies in Diet and Physical Activity Measurement in Youth. Am. J. Prev. Med. 2018, 55, e81–e91. [Google Scholar] [CrossRef]
- Cain, K.L.; Sallis, J.F.; Conway, T.L.; Van Dyck, D.; Calhoon, L. Using accelerometers in youth physical activity studies: A review of methods. J. Phys. Act. Health 2013, 10, 437–450. [Google Scholar] [CrossRef]
- Troiano, R.P.; Berrigan, D.; Dodd, K.W.; Mâsse, L.C.; Tilert, T.; McDowell, M. Physical activity in the United States measured by accelerometer. Med. Sci. Sports Exerc. 2008, 40, 181–188. [Google Scholar] [CrossRef]
- Ellis, K.; Kerr, J.; Godbole, S.; Staudenmayer, J.; Lanckriet, G. Hip and Wrist Accelerometer Algorithms for Free-Living Behavior Classification. Med. Sci. Sports Exerc. 2016, 48, 933–940. [Google Scholar] [CrossRef]
- Aadland, E.; Kvalheim, O.M.; Anderssen, S.A.; Resaland, G.K.; Andersen, L.B. The multivariate physical activity signature associated with metabolic health in children. Int. J. Behav. Nutr. Phys. Act. 2018, 15, 77. [Google Scholar] [CrossRef] [PubMed]
- Robusto, K.M.; Trost, S.G. Comparison of three generations of ActiGraphTM activity monitors in children and adolescents. J. Sports Sci. 2012, 30, 1429–1435. [Google Scholar] [CrossRef] [PubMed]
- Kozey, S.L.; Staudenmayer, J.W.; Troiano, R.P.; Freedson, P.S. Comparison of the ActiGraph 7164 and the ActiGraph GT1M during self-paced locomotion. Med. Sci. Sports Exerc. 2010, 42, 971–976. [Google Scholar] [CrossRef] [PubMed]
- John, D.; Tyo, B.; Bassett, D.R. Comparison of four ActiGraph accelerometers during walking and running. Med. Sci. Sports Exerc. 2010, 42, 368–374. [Google Scholar] [CrossRef] [PubMed]
- Grydeland, M.; Hansen, B.H.; Ried-Larsen, M.; Kolle, E.; Anderssen, S.A. Comparison of three generations of ActiGraph activity monitors under free-living conditions: Do they provide comparable assessments of overall physical activity in 9-year old children? BMC Sports Sci. Med. Rehabil. 2014, 6, 26. [Google Scholar] [CrossRef] [PubMed]
- Robertson, W.; Stewart-Brown, S.; Wilcock, E.; Oldfield, M.; Thorogood, M. Utility of accelerometers to measure physical activity in children attending an obesity treatment intervention. J. Obes. 2011, 2011. [Google Scholar] [CrossRef]
- Trost, S.G.; Mciver, K.L.; Pate, R.R. Conducting accelerometer-based activity assessments in field-based research. Med. Sci. Sports Exerc. 2005, 37, S531–S543. [Google Scholar] [CrossRef]
- Aadland, E.; Ylvisåker, E. Reliability of the Actigraph GT3X+ Accelerometer in Adults under Free-Living Conditions. PLoS ONE 2015, 10, e0134606. [Google Scholar] [CrossRef]
- Trost, S.G.; Ward, D.S.; Moorehead, S.M.; Watson, P.D.; Riner, W.; Burke, J.R. Validity of the computer science and applications (CSA) activity monitor in children. Med. Sci. Sports Exerc. 1998, 30, 629–633. [Google Scholar] [CrossRef]
- O’Neil, M.E.; Fragala-Pinkham, M.A.; Forman, J.L.; Trost, S.G. Measuring reliability and validity of the ActiGraph GT3X accelerometer for children with cerebral palsy: A feasibility study. J. Pediatr. Rehabil. Med. 2014, 7, 233–240. [Google Scholar] [CrossRef]
- Brocklebank, L.A.; Falconer, C.L.; Page, A.S.; Perry, R.; Cooper, A.R. Accelerometer-measured sedentary time and cardiometabolic biomarkers: A systematic review. Prev. Med. 2015, 76, 92–102. [Google Scholar] [CrossRef] [PubMed]
- Rey Lopez, J.P.; Sabag, A.; Martinez Juan, M.; Rezende, L.F.M.; Pastor-Valero, M. Do vigorous-intensity and moderate-intensity physical activities reduce mortality to the same extent? A systematic review and meta-analysis. BMJ Open Sport Exerc. Med. 2020, 6, e000775. [Google Scholar] [CrossRef] [PubMed]
- Malina, R.M.; Eisenmann, J.C.; Cumming, S.P.; Ribeiro, B.; Aroso, J. Maturity-associated variation in the growth and functional capacities of youth football (soccer) players 13–15 years. Eur. J. Appl. Physiol. 2004, 91, 555–562. [Google Scholar] [CrossRef]
- Weber, D.R.; Leonard, M.B.; Zemel, B.S. Body composition analysis in the pediatric population. Pediatr. Endocrinol. Rev. 2012, 10, 130–139. [Google Scholar] [PubMed]
- Kindblom, J.M.; Lorentzon, M.; Hellqvist, A.; Lönn, L.; Brandberg, J.; Nilsson, S.; Norjavaara, E.; Ohlsson, C. BMI changes during childhood and adolescence as predictors of amount of adult subcutaneous and visceral adipose tissue in men: The GOOD Study. Diabetes 2009, 58, 867–874. [Google Scholar] [CrossRef] [PubMed]
- Strong, W.B.; Malina, R.M.; Blimkie, C.J.R.; Daniels, S.R.; Dishman, R.K.; Gutin, B.; Hergenroeder, A.C.; Must, A.; Nixon, P.A.; Pivarnik, J.M.; et al. Evidence based physical activity for school-age youth. J. Pediatr. 2005, 146, 732–737. [Google Scholar] [CrossRef]
- Tremblay, M.S.; LeBlanc, A.G.; Kho, M.E.; Saunders, T.J.; Larouche, R.; Colley, R.C.; Goldfield, G.; Connor Gorber, S. Systematic review of sedentary behaviour and health indicators in school-aged children and youth. Int. J. Behav. Nutr. Phys. Act. 2011, 8, 98. [Google Scholar] [CrossRef]
- Prentice-Dunn, H.; Prentice-Dunn, S. Physical activity, sedentary behavior, and childhood obesity: A review of cross-sectional studies. Psychol. Health Med. 2012, 17, 255–273. [Google Scholar] [CrossRef]
- Gualdi-Russo, E.; Zaccagni, L.; Manzon, V.S.; Masotti, S.; Rinaldo, N.; Khyatti, M. Obesity and physical activity in children of immigrants. Eur. J. Public Health 2014, 24, 40–46. [Google Scholar] [CrossRef]
- Draper, C.E.; Tomaz, S.A.; Stone, M.; Hinkley, T.; Jones, R.A.; Louw, J.; Twine, R.; Kahn, K.; Norris, S.A. Developing Intervention Strategies to Optimise Body Composition in Early Childhood in South Africa. BioMed Res. Int. 2017, 2017, 5283457. [Google Scholar] [CrossRef]
- de Araújo, L.G.M.; Turi, B.C.; Locci, B.; Mesquita, C.A.A.; Fonsati, N.B.; Monteiro, H.L. Patterns of Physical Activity and Screen Time Among Brazilian Children. J. Phys. Act. Health 2018, 15, 457–461. [Google Scholar] [CrossRef] [PubMed]
- Gerber, M.; Müller, I.; Walter, C.; du Randt, R.; Adams, L.; Gall, S.; Joubert, N.; Nqweniso, S.; Smith, D.; Steinmann, P.; et al. Physical activity and dual disease burden among South African primary schoolchildren from disadvantaged neighbourhoods. Prev. Med. 2018, 112, 104–110. [Google Scholar] [CrossRef]
- Ferrari, G.L.; Kovalskys, I.; Fisberg, M.; Gómez, G.; Rigotti, A.; Sanabria, L.Y.C.; García, M.C.Y.; Torres, R.G.P.; Herrera-Cuenca, M.; Zimberg, I.Z.; et al. Comparison of self-report versus accelerometer—Measured physical activity and sedentary behaviors and their association with body composition in Latin American countries. PLoS ONE 2020, 15, e0232420. [Google Scholar] [CrossRef] [PubMed]
- Guthold, R.; Stevens, G.A.; Riley, L.M.; Bull, F.C. Global trends in insufficient physical activity among adolescents: A pooled analysis of 298 population-based surveys with 1·6 million participants. Lancet Child. Adolesc. Health 2020, 4, 23–35. [Google Scholar] [CrossRef]
- Christakoudi, S.; Tsilidis, K.K.; Muller, D.C.; Freisling, H.; Weiderpass, E.; Overvad, K.; Söderberg, S.; Häggström, C.; Pischon, T.; Dahm, C.C.; et al. A Body Shape Index (ABSI) achieves better mortality risk stratification than alternative indices of abdominal obesity: Results from a large European cohort. Sci. Rep. 2020, 10, 14541. [Google Scholar] [CrossRef]
- Giudici, K.V.; Martini, L.A. Comparison between body mass index and a body shape index with adiponectin/leptin ratio and markers of glucose metabolism among adolescents. Ann. Hum. Biol. 2017, 44, 489–494. [Google Scholar] [CrossRef]
- Freedman, D.S.; Sherry, B. The validity of BMI as an indicator of body fatness and risk among children. Pediatrics 2009, 124 (Suppl. 1), S23–S34. [Google Scholar] [CrossRef]
- Achamrah, N.; Colange, G.; Delay, J.; Rimbert, A.; Folope, V.; Petit, A.; Grigioni, S.; Déchelotte, P.; Coëffier, M. Comparison of body composition assessment by DXA and BIA according to the body mass index: A retrospective study on 3655 measures. PLoS ONE 2018, 13, e0200465. [Google Scholar] [CrossRef]
- Lee, S.Y.; Ahn, S.; Kim, Y.J.; Ji, M.J.; Kim, K.M.; Choi, S.H.; Jang, H.C.; Lim, S. Comparison between Dual-Energy X-ray Absorptiometry and Bioelectrical Impedance Analyses for Accuracy in Measuring Whole Body Muscle Mass and Appendicular Skeletal Muscle Mass. Nutrients 2018, 10, 738. [Google Scholar] [CrossRef]
- Alkahtani, S.A. A cross-sectional study on sarcopenia using different methods: Reference values for healthy Saudi young men. BMC Musculoskelet. Disord. 2017, 18, 119. [Google Scholar] [CrossRef]
- Duz, S.; Kocak, M.; Korkusuz, F. Evaluation of body composition using three different methods compared to dual-energy X-ray absorptiometry. Eur. J. Sport Sci. 2009, 9, 181–190. [Google Scholar] [CrossRef]
- Benito, P.J.; Gómez-Candela, C.; Cabañas, M.D.; Szendrei, B.; Castro, E.A. Comparison between different methods for measuring body fat after a weight loss program. Rev. Bras. Med. Esporte 2019, 25, 474–479. [Google Scholar] [CrossRef]
- Must, A.; Tybor, D.J. Physical activity and sedentary behavior: A review of longitudinal studies of weight and adiposity in youth. Int. J. Obes. 2005, 29 (Suppl. 2), S84–S96. [Google Scholar] [CrossRef]
- Hong, H.-R.; Ha, C.-D.; Kong, J.-Y.; Lee, S.-H.; Song, M.-G.; Kang, H.-S. Roles of physical activity and cardiorespiratory fitness on sex difference in insulin resistance in late elementary years. J. Exerc. Nutr. Biochem. 2014, 18, 361–369. [Google Scholar] [CrossRef] [PubMed]
- Ishikawa-Takata, K.; Kaneko, K.; Koizumi, K.; Ito, C. Comparison of physical activity energy expenditure in Japanese adolescents assessed by EW4800P triaxial accelerometry and the doubly labelled water method. Br. J. Nutr. 2013, 110, 1347–1355. [Google Scholar] [CrossRef] [PubMed][Green Version]
- Lv, Y.; Cai, L.; Gui, Z.; Zeng, X.; Tan, M.; Wan, N.; Lai, L.; Lu, S.; Tan, W.; Chen, Y. Effects of physical activity and sedentary behaviour on cardiometabolic risk factors and cognitive function in children: Protocol for a cohort study. BMJ Open 2019, 9, e030322. [Google Scholar] [CrossRef] [PubMed]
- Migueles, J.H.; Cadenas-Sanchez, C.; Ekelund, U.; Delisle Nyström, C.; Mora-Gonzalez, J.; Löf, M.; Labayen, I.; Ruiz, J.R.; Ortega, F.B. Accelerometer Data Collection and Processing Criteria to Assess Physical Activity and Other Outcomes: A Systematic Review and Practical Considerations. Sports Med. 2017, 47, 1821–1845. [Google Scholar] [CrossRef]
- Matthews, C.E.; Ainsworth, B.E.; Thompson, R.W.; Bassett, D.R.J. Sources of variance in daily physical activity levels as measured by an accelerometer. Med. Sci. Sports Exerc. 2002, 34, 1376–1381. [Google Scholar] [CrossRef]


| Reference | Study Name and Design | Accelerometer: Model, Location, Duration | Conclusions on the Association of PA or ST with Body Composition |
|---|---|---|---|
| Ben Jemaa et al., 2018 [32] | Cross-sectional study | Actigraph GT3X+ on the right hip at least for 3 weekdays and 1 weekend day | MVPA was negatively correlated with %Fat (mixed sexes) |
| Benitéz-Porres et al., 2016 [33] | Cross-sectional study | Actigraph GT3X on the right hip. Only participants with ≥4 complete days, including 1 weekend day, were included. A day was considered valid if it contained ≥10 h of wear time for weekdays and ≥8 h for weekend days | not assessed |
| Bernhardsen et al., 2019 [34] | Part of Norwegian Mother and Child Cohort Study (MoBa), a prospective population-based cohort study. Data from a sub-cohort of 1603 participants born between 2002 and 2004 | Actigraph GT3X+ on right hip of all participants providing at least one valid day | MVPA was negatively associated with BMI and FM only in boys |
| Chaput et al., 2012 [35] | QUebec Adiposity and Lifestyle InvesTigation in Youth (QUALITY) Cross-sectional study | Actigraph LS 7164 on the right hip. A valid day was defined as 10 or more hours of monitor wear time; respondents with four or more valid days were retained for analyses | MVPA was negatively associated with %Fat (mixed sexes). No association for ST. |
| Diouf et al., 2016 [26] | Cross-sectional study | Actigraph GT3X+ triaxial worn on the right mid-axilla line at the level of the iliac crest for at least four valid days of data, including one weekend day with greater than 10 h/day of wear time. A valid day was defined as recording at least 600 min of measured wear time between 07:00 a.m. to bedtime 22:59. | not assessed |
| Ferrari et al., 2015 [36] | Part of the International Study of Childhood Obesity, Lifestyle and the Environment (ISCOLE), a multinational cross-sectional study conducted in twelve countries (Australia, Brazil, Canada, China, Colombia, Finland, India, Kenya, Portugal, South Africa, United Kingdom, and United States). Here there are data only from Brazilian sample | Actigraph GT3X+ worn at the hip on an elasticized belt, on the right midaxillary line, at least for 4 days (including at least one weekend day) with at least 10 h/day of waking wear time | MVPA was negatively associated with BMI and %Fat in males (VPA in females). No association for ST. |
| Gába et al., 2017 [37] | Cross-sectional study | Actigraph was worn at the hip for a minimum of 10 h of wearing time per day and at least 4 days including one weekend day | MVPA was negatively associated with Fat Mass, %Fat, Fat Mass Index only in girls (VPA with the same traits in boys) |
| Hallal et al., 2013 [38] | A subsample of the 1993 Pelotas (Brazil) Birth Cohort study at the mean age of 13.3 years. Cross-sectional | Actigraph GT1M worn on the left side of the hip for 6 days. Days with <600 min of registered data and periods of time above 60 min of consecutive zero counts were excluded | not assessed |
| Herrmann et al., 2015 [39] | IDEFICS study (Identification and prevention of dietary- and lifestyle-induced health effects in children and infants), a prospective population-based cohort study of children from 7 European countries | ActiTrainer or GT1M Actigraph uniaxial accelerometers worn on right hip for three consecutive days, including 1 weekend day, for at least 6 h per day. Both types of accelerometers have been observed to measure comparable MVPA levels (except for lower PA levels). | not assessed |
| Janz et al., 2017 [40] | Part of Iowa Bone Development Study- a longitudinal study investigating bone health and body composition in seven measurement waves at approximate ages 5 years (yr) (wave 1), 8 yr (wave 2) -used in this review-, 11 yr (wave 3), 13 yr (wave 4), 15 yr (wave 5), 17 yr (wave 6), and 19 yr (wave 7) | Actigraph uniaxial accelerometers model 7164 in waves 1 to 4 (used in this study), model GT1m in wave 5, and model GT3x+ in waves 6 and 7 for at least 10 h/day and a minimum of 3 d within 15 months of the DXA scan, worn at the hip on the midaxillary line | MVPA was negatively associated with Fat Mass in both males and females. No association for ST. |
| Joensuu et al., 2018 [41] | Part of research related to Finnish Schools ’ on the Move program (LIKES Research Centre for Physical Activity and Health)-longitudinal- 2013 | Actigraph GT3X+ at the hip, for at least 2 weekdays and 1 weekend day, 17 h/day. | not assessed |
| McCormack et al., 2016 [42] | Cross-sectional study | Actigraph G3TX+ accelerometers worn on the right hip for at least 3 valid weekdays and 1 valid weekend day. One day was considered valid if the child had a minimum of 10 h of wear time during waking hours. | MVPA was negatively correlated with %Fat in mixed sexes and boys (no in females). ST was positively correlated with %Fat in mixed sexes and boys (no in females). |
| Santos-Magalhaes et al., 2015 [43] | Cross-sectional study | Actigraph GT3X worn on the right hip for at least 2 weekdays and 1 weekend day. A minimum recording of 8 h/day was the criteria to accept daily PA | MVPA was significantly greater in normal weight than in overweight and obese. ST did not differ. |
| Sardinha et al., 2017 [44] | A school-based cluster randomized controlled trial (clinical trial registry: ISRCTN76013675) to evaluate the impact of an intervention in childhood obesity between 2010 and 2011- cross-sectional and prospective study | GT1M Actigraph worn on the right hip for at least three days of recording (two weekdays and one weekend day). A minimum of 600 min was required for inclusion in the analysis | MVPA was negatively associated with Fat Mass (mixed sexes). No association for ST. |
| Reference | N | Age (Years) | Country | ST (min/d) | MVPA (min/d) | Stature (cm) | Weight (kg) | BMI (kg/m2) | %F | FM (kg) | FFM (kg) | FFMI (kg/m2) |
|---|---|---|---|---|---|---|---|---|---|---|---|---|
| Herrmann et al., 2015 [39] | 1409 | 8.1 ± 1.2 | Europe * | 336 ± 90 § | 48 ± 25 | 135.2 ± 9.0 | 32.5 ± 8.7 | 17.8 | 28.9 | 9.4 | 23.1 ± 4.1 a | 12.6 |
| Santos-Magalhaes et al., 2015 [43] | 26 | 8.2 ± 1.2 | Portugal | 325.6 ± 79.7 | 60.7 ± 27.2 | 133.5 ± 9.7 | 35.8 ± 12.8 | 19.5 ± 4.7 | 31.4 ± 9.2 b | 11.2 | 24.6 | 13.8 |
| Janz et al., 2017 [40] | 201 | 8.7 ± 0.7 | USA | 324 ± 66 § | 58.2 ± 25.8 | 135 ± 7.3 | 33.4 ± 9.0 | 18.3 | 24.6 | 8.2 ± 5.8b | 25.2 | 13.8 |
| Ben Jemaa et al., 2018 [32] | 21 | 9.3 ± 0.9 | Tunisia | 583.9 | 68.8 ± 17.3 | 137.1 ± 6.9 | 31.6 ± 6.2 | 16.8 | 22.7 ± 5.1 c | 7.2 | 24.4 | 13.0 |
| Chaput et al., 2012 [35] | 299 | 9.6 ± 0.8 | Canada | 341 ± 82 | 55.9 ± 26.4 | - | 38.2 ± 11.6 | - | 24.9 ± 11.0 b | 9.5 | 28.7 | - |
| Gába et al., 2017 [37] | 156 | 9.9 ± 1.2 | Czech Republic | 379.3 ± 48.5 | 46.7 ± 21.3 | 143.8 ± 9.4 | 37.4 ± 9.2 | 17.9 ± 2.8 | 16.1 ± 8.3 a | 6.7 ± 5.2 a | 30.7 | 14.9 |
| Diouf et al., 2016 [26] | 20 | 10 ± 1 | Senegal | 428 ± 89 | 85 ± 40 | 142.1 ± 6.5 | 34.1 ± 9.4 | 16.9 | 16.5 c | 5.7 ± 1.2 c | 24.7 ± 3.8 c | 12.2 |
| Sardinha et al., 2017 [44] | 197 | 10 ± 0.6 | Portugal | 518.2 ± 59.2 | 65.9 ± 24.5 | 142 ± 7 | 37.8 ± 8.6 | 18.6 ± 3.5 | 26.7 | 10.1 ± 5.6b | 27.7 | 13.7 |
| Ferrari et al., 2015 [36] | 238 | 10.1 ± 0.5 | Brazil | 492.5 | 71.2 ± 28 | 144.4 ± 7.1 | 41.5 ± 12.6 | 19.9 ± 4.7 | 21.3 ± 9.5 a | 8.8 | 32.7 | 15.7 |
| McCormack et al., 2016 [42] | 44 | 10.1 ± 0.9 | USA | 550 ± 62 | 71 ± 25 | 141.5 ± 7.5 | 38 ± 8.2 | 19.0 | 29.1 ± 6.3 b | 10.4 ± 4.5b | 23.2 ± 3.9b | 11.6 |
| Benitéz-Porres et al., 2016 [33] | 83 | 10.9 ± 1.2 | Spain | 599.3 ± 60.7 | 63.9 ± 14.7 | 145.6 ± 10.1 | 42.7 ± 10.8 | 19.9 ± 3.4 | 22.9 ± 11 d | 9.8 | 32.9 | 15.5 |
| Bernhardsen et al., 2019 [34] | 98 | 10.9 ± 0.6 | Norway | 501 ± 61.6 | 75 ± 26.9 | 148 ± 6 | 39.2 ± 6.9 | 17.8 ± 2.5 | 24.7 ± 6.2 b | 10 ± 4.2 b | 29.4 ± 3.6 b | 13.4 |
| Joensuu et al., 2018 [41] | 263 | 12.4 ± 1.3 | Finland | 485.5 ± 74.9 | 58.2 ± 23.3 | 155.2 ± 11.1 | 44.6 ± 11.9 | 18.2 ± 3.1 | 14.7 ± 7.8 a | 6.6 | 38.0 | 15.4 ± 1.7 |
| Hallal et al., 2013 [38] | 9 | 12.9 ± 0.3 | Brazil | 660 ± 82 | 79 | 159.5 ± 10.5 | 51.9 ± 12.2 | 20.4 | 22.7 | 11.8 ± 6.8c | 40.1 ± 7.6c | 15.8 |
| Benitéz-Porres et al., 2016 [33] | 115 | 15.4 ± 1.3 | Spain | 643.1 ± 67.2 | 65.9 ± 23.3 | 167.6 ± 8.4 | 61.5 ± 13.7 | 21.8 ± 4.2 | 16.6 ± 7.6 d | 10.2 | 51.3 | 18.3 |
| Reference | N | Age (Years) | Country | ST (min/d) | MVPA (min/d) | Stature (cm) | Weight (kg) | BMI (kg/m2) | %F | FM (kg) | FFM (kg) | FFMI (kg/m2) |
|---|---|---|---|---|---|---|---|---|---|---|---|---|
| Herrmann et al., 2015 [39] | 1544 | 8.1 ± 1.2 | Europe * | 342 ± 90 § | 36 ± 18 | 134.7 ± 9.1 | 32.1 ± 8.3 | 17.7 | 33.6 | 10.8 | 21.3 ± 4.0 a | 11.7 |
| Santos-Magalhaes et al., 2015 [43] | 24 | 8.4 ± 1 | Portugal | 347.1 ± 66.5 | 52.1 ± 16.5 | 133.6 ± 6.8 | 36 ± 8.7 | 20.0 ± 3.5 | 37.3 ± 6.4 b | 13.4 | 22.6 | 12.7 |
| Janz et al., 2017 [40] | 214 | 8.7 ± 0.6 | USA | 330 ± 66 § | 40.6 ± 18.9 | 133.0 ± 6.8 | 32 ± 8.7 | 18.1 | 29.1b | 9.3 ± 5.9 | 22.7 | 12.8 |
| Diouf et al., 2016 [26] | 22 | 9 ± 1 | Senegal | 416 ± 79 | 65 ± 28 | 137.3 ± 8.2 | 31.7 ± 8.6 | 16.8 | 24.2 | 7.5 ± 1.0 c | 21.1 ± 3.5 c | 11.2 |
| Ben Jemaa et al., 2018 [32] | 19 | 9.4 ± 1 | Tunisia | 498.8 | 49.8 ± 22.7 | 139.6 ± 8.3 | 36.1 ± 8.6 | 18.5 | 31.1 ± 8.2 c | 11.2 | 24.9 | 12.8 |
| Chaput et al., 2012 [35] | 251 | 9.6 ± 0.9 | Canada | 343 ± 82 | 37.5 ± 17.9 | - | 38 ± 11.2 | - | 30.3 ± 10.0 b | 11.5 | 26.5 | - |
| Gába et al., 2017 [37] | 209 | 9.8 ± 1.3 | Czech Republic | 394.4 ± 51.7 | 37.4 ± 16.7 | 142.5 ± 8.9 | 35.8 ± 8.8 | 17.4 ± 2.8 | 18.1 ± 7.3 a | 6.9 ± 4.4 a | 28.9 | 14.2 |
| Sardinha et al., 2017 [44] | 189 | 9.9 ± 0.6 | Portugal | 525.4 ± 67.1 | 53.7 ± 18.4 | 143 ± 7 | 39.7 ± 8.6 | 19.1 ± 3.2 | 30.5 | 12.1 ± 5.1 b | 27.6 | 13.5 |
| McCormack et al., 2016 [42] | 43 | 10.0 ± 0.8 | USA | 580 ± 48 | 51 ± 22 | 140.0 ± 6.5 | 35.0 ± 7.0 | 17.9 | 31.5 ± 6.1 b | 10.3 ± 4.0 b | 20.7 ± 3.5 b | 10.6 |
| Ferrari et al., 2015 [36] | 247 | 10.1 ± 0.5 | Brazil | 507.3 ± 66.7 | 48.2 ± 18.0 | 145.3 ± 7.7 | 41 ± 10.9 | 19.5 ± 4.1 | 24.7 ± 8.3 a | 10.1 | 30.9 | 14.6 |
| Benitéz-Porres et al., 2016 [33] | 63 | 10.7 ± 1.3 | Spain | 609 ± 61.2 | 61.3 ± 12.7 | 143.2 ± 10.9 | 40 ± 12.7 | 19.1 ± 4.0 | 22.9 ± 6.6 d | 9.2 | 30.8 | 15.0 |
| Bernhardsen et al., 2019 [34] | 88 | 11.0 ± 0.6 | Norway | 508.0 ± 55.6 | 59 ± 17.4 | 149 ± 8 | 40 ± 8.4 | 17.9 ± 2.3 | 28.1 ± 5.8 b | 11.5 ± 4.6 b | 28.6 ± 4.8 b | 12.9 |
| Joensuu et al., 2019 [41] | 331 | 12.4 ± 1.3 | Finland | 511.0 ± 66.6 | 47.3 ± 18.0 | 155.1 ± 9.3 | 45.7 ± 10.2 | 18.8 ± 3.0 | 20.4 ± 6.9 a | 9.3 | 36.4 | 14.8 ± 1.4 |
| Hallal et al., 2013 [38] | 16 | 13.1 ± 0.3 | Brazil | 661 ± 78 | 64 | 159 ± 5.6 | 51.7 ± 9.5 | 20.5 | 30.2 | 15.6 ± 5.8 c | 37.3 ± 6.5 c | 14.8 |
| Benitéz-Porres et al., 2016 [33] | 119 | 15.2 ± 1.4 | Spain | 642.7 ± 83.4 | 48.1 ± 18.9 | 160.2 ± 6 | 57.5 | 22.4 ± 4.6 | 21.2 ± 7.7 d | 12.2 | 45.3 | 17.7 |
| Predictors | FFMI | BMI | %F | ||||||
|---|---|---|---|---|---|---|---|---|---|
| β | t | p | β | t | p | β | t | p | |
| Age | 0.935 | 111.445 | 0.000 | 0.312 | 18.322 | 0.000 | −0.933 | −71.602 | 0.000 |
| MVPA | 0.006 | 0.449 | 0.653 | −0.074 | −4.005 | 0.000 | −0.059 | −3.845 | 0.000 |
| ST | −0.098 | −5.489 | 0.000 | 0.546 | 23.699 | 0.000 | 0.259 | 14.849 | 0.000 |
| Sex (male) | 0.234 | 21.116 | 0.000 | 0.087 | 6.102 | 0.000 | −0.325 | −26.335 | 0.000 |
| R2 | 0.776 | 0.624 | 0.705 | ||||||
| R2 adj | 0.776 | 0.623 | 0.705 | ||||||
| p | <0.001 | <0.001 | <0.001 | ||||||
Publisher’s Note: MDPI stays neutral with regard to jurisdictional claims in published maps and institutional affiliations. |
© 2020 by the authors. Licensee MDPI, Basel, Switzerland. This article is an open access article distributed under the terms and conditions of the Creative Commons Attribution (CC BY) license (http://creativecommons.org/licenses/by/4.0/).
Share and Cite
Gualdi-Russo, E.; Rinaldo, N.; Toselli, S.; Zaccagni, L. Associations of Physical Activity and Sedentary Behaviour Assessed by Accelerometer with Body Composition among Children and Adolescents: A Scoping Review. Sustainability 2021, 13, 335. https://doi.org/10.3390/su13010335
Gualdi-Russo E, Rinaldo N, Toselli S, Zaccagni L. Associations of Physical Activity and Sedentary Behaviour Assessed by Accelerometer with Body Composition among Children and Adolescents: A Scoping Review. Sustainability. 2021; 13(1):335. https://doi.org/10.3390/su13010335
Chicago/Turabian StyleGualdi-Russo, Emanuela, Natascia Rinaldo, Stefania Toselli, and Luciana Zaccagni. 2021. "Associations of Physical Activity and Sedentary Behaviour Assessed by Accelerometer with Body Composition among Children and Adolescents: A Scoping Review" Sustainability 13, no. 1: 335. https://doi.org/10.3390/su13010335
APA StyleGualdi-Russo, E., Rinaldo, N., Toselli, S., & Zaccagni, L. (2021). Associations of Physical Activity and Sedentary Behaviour Assessed by Accelerometer with Body Composition among Children and Adolescents: A Scoping Review. Sustainability, 13(1), 335. https://doi.org/10.3390/su13010335