Abstract
Due to the spread of COVID-19 worldwide in 2020, the tourism industry is facing a calamitous crisis as migration and travel between the countries has been restricted. The purpose of this study is to explore changes in Korean tourism behavior after COVID-19. Korean social media data was collected from the World Health Organization’s declaration of a public health emergency of international concern, in January 2020, to August 2020, the summer vacation season. Keywords were extracted via text mining, and the current perspectives of Koreans concerning tourism that manifest content analysis were investigated. In addition, UCINET 6 was used to visualize related words by conducting centrality analysis, CONCOR (CONvergent CORrelation) analysis, and semantic system network analysis. The analysis showed that Korean tourists have increased their preference for domestic travel, and showed interest in government subsidies. Korean tourists also showed greater interest in eco-trips and gourmet trips. Although this study is limited to Korea, it can be used as a regional strategy.
1. Introduction
Due to the spread of COVID-19 worldwide in 2020, the tourism industry is facing a calamitous crisis as migration and travel between the countries has been restricted. The World Health Organization (WHO) declared a public health emergency of international concern (PHEIC) on 30 January 2020, and declared the COVID-19 virus a Pandemic on 11 March 2020 [1]. According to UNWTO (specialized agency of the United Nations, World Tourism Organization), the number of global tourists in 2020 decreased by 65% from January to August when compared to the same period last year. The Asia and the Pacific area suffered a substantial drop of 79% [2]. As COVID-19 swept across the world, travel restrictions and border shutdowns were introduced in many countries and regions in order to curb its spread.
In Korea, as COVID-19 started to spread aggressively, Asian countries such as China, Japan, and Taiwan took measures such as refraining from travel to Korea and stopping direct flights to protect their citizens. As a result, the number of foreign tourists visiting Korea from February to March decreased to 768,709, down by 71.9% from the same period last year [3]. However, from the time South Korea recorded 10,000 confirmed cases on 3 April 2020, there had been, to date, an average of less than 100 daily confirmed cases, and the total COVID-19 death toll was 466 as of 1 November 2020 [4]. The number of domestic tourists on Jeju, the most popular resort in Korea, has surpassed that of last year in August 2020. This proves that domestic tourism is gradually recovering [5].
Studies on how COVID-19 has impacted the tourism industry show that countries with higher exposure to international tourism have a higher COVID-19 death rate [6], and that countries that reduce tourism revenue by prohibiting entry of tourists have significant job losses and bankruptcies [7]. A survey conducted asked 203 people of the Algerian population about the need of tourists after the coronavirus, it revealed that people must enjoy leisure to relieve stress, and that the cost of tourism services must be affordable [8]. A survey of the Azores Archipelago residents concludes that residents will be spending their summer vacation in the same area in 2020 [9]. Similarly to Korea, the global tourism industry is facing the challenges of establishing communication with potential tourists, dispersing manuals for rapid response to infectious disease, and implementing aggressive marketing strategies [10].
The majority of research exploring tourist motivations and needs since the COVID-19 outbreak has focused on inquiry via surveys. Consequently, this study intends to explore the needs of tourists by applying big data from social media after the outbreak.
According to data published by the National Statistical Office (South Korea) in 2019, the number of one-person households is 8,488,621, accounting for 37.75% of the total population, and it is expected to rapidly grow in the future. Moreover, social interest in the ‘solo economy’ is increasing, and this trend has become a leading trend in the travel industry as well [11]. It implies that solo tourists who value an individual’s spending habits and have strong self-satisfaction tendencies, along with family and group tours, have become a major consumer of the travel market.
Thus, this study focuses on performing content analyses relevant to solo travel and group tours, using big data from social media since the COVID-19 outbreak. I employ a network analysis of the tourism sector as it has a resilient network industrial structure and therefore is sufficient for academic research [12]. I begin with a literature review that examines solo and group behavior. Next, we turn to the patterns revealed in various tourist segments in Korea. Text mining and semantic network analysis were performed in order to gather the necessary data. Text mining is a process of extracting statistically significant information from unstructured data and is a technique that derives patterns for evaluating and interpreting results by structuring text data. The main part of this paper presents the network analysis patterns. This research will enable tourism sector authorities to better understand and identify the tourism needs of tourists after COVID-19.
2. Literature Review
2.1. Tourists Motivation and Behavior
Motivation is the power to derive all actions, and is embraced as a critical concept in the process of understanding tourism behavior and choosing a destination [13]. Crompton [14] identifies psychological or social motives (push motives) which support the wish to travel. Pull motives affect the choice regarding the place to visit and are related to the attributes of the destination [15]. Although tourism motivation is one of the many variables that explain tourism behavior, it is particularly important because it is regarded as the driving force behind the behavior [16]. Tourism motivation is deeply related to the decision-making behavior of the tourist and is directly and indirectly associated with the satisfaction of the decision-maker’s needs. Thus, it is the most fundamental approach in the analysis of tourism consumer behavior [17].
Eliciting desire to go on a tour using tourism motivation is determined by how much each individual chooses to travel by motivational variables and how attracted he or she is to the various attributes of the destination [13]. The selective attribute of a tourist destination is a response to the tourist motive [18], and the tourist motive is manifested as a tourist behavior by external incentive factors, such as the attributes of the tourist destination [19]. Furthermore, tourism motivation has a positive effect on continuous information searches and Internet information searches. Subsequently, information searches have a positive effect on participation intention and electronic word of mouth intention [20]. It suggests that travel motivation influences information searches, which are the personal decision-making process for choosing the travel type.
Information Technology (IT) has dramatically transformed travel and tourism [21,22]. Search engines, in particular, have become the predominant force impacting travelers’ access to tourism products [23]. Information acquisition is an essential field in the tourism industry, as it heavily influences the tourists’ decision-making process [24,25]. Tourists tend to share acquired information, from choosing destinations to determining overall aspects of the tour, such as accommodation, food, and leisure [26,27]. Recent advances in IT have provided the fundamental tools to produce and share tourist information, and travelers can promptly and conveniently search and exploit information on the Internet without time and space constraints [28,29]. The more convenient it is to use information technology, the more convenient it is perceived. The more useful it is perceived, the more positively it affects users’ attitudes and behavioral intentions [30,31]. Among the attributes of tourism information, usefulness, reliability, and interactivity increase the satisfaction of tourism information. The more reliable information is, the greater the influence on the behavioral intention [32]. As information can be directly exchanged online between providers and tourists, instead of unilaterally and fragmented, the involvement of tourists has become an important variable in determining the importance of information [33]. The pattern of tourism has changed from pre-reservation to reservation at the point of departure, and with the enhancement of market transparency, which allows customers to receive global advice on travel, tourists are able to produce customized tourism products for themselves [34]. The Internet enables the accumulation of a large amount of travel information, and such an ecosystem accommodates each individual to structure such information in order to suit his or her specific needs.
What attracts Korean tourists to visit blogs is that they find it trustworthy. The bloggers are ordinary people that they can relate to and feel somewhat intimate with, and the blogs are operated as non-profit, unlike other for-profit websites where companies actively promote their products to maximize their benefits [35]. Tourists are attracted to the features of usefulness, playability, and ease of use [36]. The internet usage rate in Korea was 91.8% in 2019 [37], and the household usage rate in terms of age was 99.9% (20–29), 100% (30–39), 99.9% (40–49), 99.3% (50–59), and 89.1% (60–69). As the statistics show, the internet usage rate of Koreans is very high. Travel-related search behavior influences Internet information and determines the importance of travel information. The search behavior of prospective tourists most likely accounts for the highest frequency of words in big data analysis.
2.2. Solo Travel
As the social structure has changed, it is speculated that the population of single-person households will increase to 34.3% by 2035, in comparison to the 27.2% it was in 2015 [38]. Due to such social changes, words such as ‘Eating Alone’, ‘Drinking Alone’, ‘Alone Traveling’, etc., have been newly coined in recent years. With the rapid change in perception and increased interest in a solo economy lifestyle, the real estate, home appliance, food, and travel sectors are modifying their business marketing strategies to meet the needs of single-person households [39,40]. According to a survey conducted by Job Korea and Albamon, the reasons for acting alone are ‘because being alone is comfortable,’ ‘because I get to do whatever I want,’ ‘because it’s difficult to schedule with friends’ and ‘because it is less costly.’ A staggering 34.6% of the respondents replied that they unwillingly became cocooners because of COVID-19 in particular [41]. As seen in the surveys above, COVID-19 is expected to have a considerable impact on the tourism industry in multifaceted ways.
Most of the cocooners use social media frequently and actively use social media for travel too. Therefore, data produced and shared through social media has become a vital resource in the tourism market. This study collected and analyzed data from various social media networks.
Laesser, Bertelli, and Riklin [42] subdivided the solo travel market into the following four categories. 1. Solo travel is a single solo trip by a single-person household traveler, 2. Collective-Solo travel means a single-person household individual traveling with other households, 3. Collective-Solo travel refers to those who are a member of larger households but traveling alone, 4. Collective-Group tour is when a person is a member of a larger household and chooses to travel in a group. Although the concept of solo travel may vary depending on the country, it is generally used in opposition to group-package travel to designate an independent, individual, and free form of traveling [43]. Based on previous studies, this study defines solo travelers as individuals who travel alone regardless of what type of household they belong to.
Solo travelers have a higher return rate [44] and travel more frequently, more often, and for longer durations [45]. A solo traveler has a positive attitude to travel as the traveler him or herself plans and decides his or her own itinerary, accommodation, meals, transportation, etc.,. He or she also has a tendency to enjoy individual time and space, depending on his or her motive for the trip [46,47,48]. The behavioral and psychological analyses of female solo travelers in Asia demonstrates that solo travel has a significant effect on self-reflection and satisfaction in life. Self-reflection, in particular, has a mediating effect on the relationship between solo travel and satisfaction in life [49,50].
After the outbreak of COVID-19, it has become essential to have a profound understanding of tourism demand and to promote customized tourism policies. Big data in social media will be very useful for taking service strategies according to the types of tourists.
2.3. Group Tour
Infectious diseases caused by human contact lead to crises in the tourism industry. Early on, the WHO defined the tourism crisis as an event that hindered travelers’ trust and daily activities at a destination. Laws and Prideaux [51] state that this is what is interfering with the orderly operation of tourism today. The COVID-19 outbreak is a tourism crisis, and group tours have been more impacted as group tourists share their itinerary in the same space as others.
A ‘Group Tour’ can be defined as a type of tour in which a traveler and his or her family, friends, or others purchase a preset tour program, including transportation, accommodation, travel program (travel content), and travel cost [52].
A group tour generally uses travel agency packages and prefers convenient transportation and accommodation. Moreover, a large number of middle-aged to older-aged groups opt for group tour products, accompanied by travel agents. In most cases, overall satisfaction is determined by the tour guide, accommodation, food, and finalized program [53]. Although the preset transportation, accommodation, and travel itinerary provide convenience to group tourists, time restrictions limit their freedom [54]. In terms of behavioral characteristics, group tourists tend to search for information that suits their own needs, destination, and activities, and purchase the corresponding product [55]. Food and tour spots must be thoroughly considered when planning a travel program to increase the return rate of group tourists [56,57,58].
Travelers tend to postpone or cancel their trips when they learn of perceived risks, such as novel infectious diseases [59]. According to the results of the study on group tourists’ perception of the swine flu and the impact it had on decision-making, the more positively tourists perceived postponement or cancellation of overseas travel (attitude) and the more positively people around supported them (subjective norms), the higher the postponement or cancellation rate [60].
2.4. Social Network Analysis
Since the inception of the Internet, users have been creating data on it. Social media enables current consumers to play the role of content producers. Social media became an integral source for travelers due to its vastness of information [61]. Travelers rely heavily on online reviews and recommendations to plan their trips [62].
The social network analysis developed, based on graph theory, uses links representing the relationships between separate nodes, which correspond to individual knowledge, group knowledge, and information [63]. Provided that the nodes are interdependent, the characteristics of the network form the structural pattern between the nodes, and the characteristics of the nodes are defined based on the relationship between the nodes [11]. In other words, this method can be applied to determine various relationship structures in tourism. The relationships between tour groups and web connectivity based on the relationship between tour companies or stakeholders are examples of such [64]. Density analysis and centrality analysis, among various social network analysis methods, are most frequently used to understand the structure of social networks and the influence of nodes. As social network centrality is an index that measures the degree to which a specific node is located at the center of the network, it is applied to fathom the power of influence, mediation, and proximity by incorporating the concept of location into the information exchange [65]. A node with high centrality in social networks indicates that it has a substantial influence and accessibility for information while still being capable of spreading and controlling information [66]. Thus, information users with high centrality in the information network have a greater influence on information and greater accessibility than other users.
Academic research using network analysis is being actively conducted in the tourism sector. Researchers explore tourist routes through social network analysis, [67] examining the impact of consumer-generated content on business performance using data extrapolation from online travel agencies [68], and analyzing hidden factors of satisfaction regarding hotels using tripadvisor.com reviews [69]. These researches will have a significant impact in revealing the intangible relationship structure and influence in the tourism industry.
3. Methodology
3.1. Data Collection
Data was collected using Textom. Textom—a big data integrated processing solution—is a modified version of FullText Software developed by Professor Loet Leydedorff (University of Amsterdam) at The IMC Inc of Korea [70]. It is appropriate for creating and analyzing text mining and network matrix to discover meaningful information by collecting, analyzing, and refining a wide range of atypical and semi-unstructured text data existing on social media. Its reliability has been adequately proven as it has obtained a Good Software (GS) certificate from the Korea Information and Communication Technology Association [71]. In addition, diverse research results are being accumulated through scores of literature, registered in the National Research Foundation of Korea.
The data collection period is from 1 February to 31 August 2020 (7 months) in order to explore Korean’s perceptions of travel after the immense spread of COVID-19 in Daegu, Korea, following the WHO’s PHEIC declaration. The targets of the data collection are the News, Blogs, Cafes, and the Intellectuals sections of NAVER (a Korean online platform operated by Naver Corporation), and the News, Blogs, and Cafes sections of DAUM (a Korean web portal). The targets of the survey were news reporting on tourism status during the COVID-19 crisis, blogs primarily posting their personal travel experience, Net ‘Cafes’ where people with similar interests share information, and the Intellectuals section of travel Q&A. Internettrend reports that the sharing of portal sites for travel information from February and August 2020 was 37.13% for DAUM and 34.18% for NAVER [72]. That is, as many as 71.31% of Koreans gather and share information on travel with NAVER and DAUM.
First, we search keywords such as ‘Solo travel’, ‘Alone travel’, ‘One person travel’, and ‘Solo trip’. For ‘Group Tour,’ the keyword ‘Group Tour’ in Korean was searched. Moreover, among the unstructured text data collected from the websites, spam posts, and commercial, promotional posts were eliminated in order to collect more refined and accurate data. Solo Travel yielded 43,567 words, and 26,678 words were produced by Group Tour. The research process is shown in Figure 1.
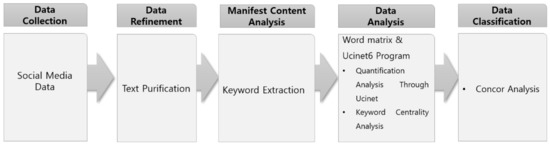
Figure 1.
Research Process.
3.2. Data Analysis
In this study, text mining and Semantic Network Analysis are used to analyze collected social media data.
Centrality analysis is conducted on the top 100 frequently used keywords extracted from raw data. Centrality indicates the degree to which a specific entity is located at the center of the network [64]. Degree Centrality and Eigenvector Centrality are examined in order to comprehend the centrality and influence of nodes. Degree Centrality is the centrality that measures how many connections a node in a network has. It measures the number of connections one node receives from all other nodes within the entire network. That is, it indicates the degree to which words are centered within many connections. Eigenvector Centrality extends the concept of centrality by including not only nodes of direct relationship but also indirect relationships of connected neighboring nodes. This means it calculates the impact on the networks [73].
UCINET 6 is used as a data analysis tool. UCINET 6 is the most routinely used program in social network analysis and is primarily used to analyze social data survey data that measures social relationships [74]. UCINET is packaged with the visualization tool Netdraw. Netdraw is an illustration program that expresses how frequently words are related and makes an impact on certain interactions.
A CONCOR analysis is conducted in order to identify structural equivalence, which is the most representative concept in network analysis along with Centrality. Convergent Correlation (CONCOR) is a method of finding similar groups by repeatedly executing the analysis until the correlation is found. In other words, it is the most effective method of finding clusters in a complex intertwined network.
4. Results
4.1. Manifest Content Analysis
Content analysis is to systematically and objectively analyze messages to infer new contexts and meanings. Of these, manifest content analysis is defined as describing what is occurring on the surface, what is and literally present, and as “staying close to the text.” [75].
The Korea Tourism Organization conducted a survey on 2,644,616 social big data in 2019 to analyze domestic travel trends. As a result, the characteristics of domestic travel trends are classified into six categories, as follows: From baby boomers to millennials, everyone enjoys together, values experience tour, keeps travel records, visits restaurants, enjoys travel at all times, and travels to nearby Gangwon-do. In addition, according to the survey conducted by Expedia of 600 Koreans, all generations responded that the reason for traveling is to have a special ‘experience’. The age people experience overseas travel is getting younger, and most generations prefer to keep their travel records.
The results of the data collected from 1 January to 31 December 2019, using the keywords ‘solo travel’ and ‘group tour,’ as shown in Table 1 and Table 2.

Table 1.
Top 100 frequent words from ‘Solo Travel’ (2019).
Table 2.
Top 100 frequent words from ‘Group Tour’ (2019).
As shown in Table 1, the survey shows a majority of keywords related to foreign countries such as ‘Europe(#18),’ ‘Japan (#22),’ ‘Taiwan(#37),’ ‘Bangkok(#41),’ ‘Tokyo(#50),’ and ‘Thailand(#52)’. Thus, overseas travel ranked 3rd. Many Asian countries ranked top, and many of those destinations are close to Korea. Keywords related to travel records such as ‘Photo(#8),’ ‘Review(#33),’ Narrative(#36),’ and ‘Travelog(#44)’ ranked high. ‘Experience(#35),’ ‘Mind (#40),’ ‘Healing(#46),’ and ‘Memory(#47)’ are ranked, and these keywords make it possible to infer the reason for the trip.
In Table 2, such keywords as ‘Family(#4),’ ‘Friend(#30),’ ‘Corporation(#53),’ and ‘School(#64)’ represent group tourists. With reference to accommodation, not only ‘Pension(#5)’ and ‘Hotel(#33),’ but also luxury resorts such as ‘Resort(#61)’ and ‘Private house(#88)’ rank high on the list. Additionally, keywords such as ‘Workshop(#36),’ ‘School excursion(#40),’ ‘Festival(#63),’ ‘Travel program(#73),’ ‘Travel theme(#79),’ and ‘Fishing(#86)’ illustrate the activities of group travelers.
In order to look at words related to travel after the COVID-19 outbreak, data for 7-month period from 1 February 2020 to 31 August 2020, using the keywords ‘solo travel’ and ‘group tour,’ as shown in Table 3 and Table 4. Figure 2 and Figure 3 are the visualizations of the network, reflecting the frequency of searches.
Table 3.
Top 100 frequent words from ‘Solo Travel’ (2020).
Table 4.
Top 100 frequent words from ‘Group Tour’ (2020).
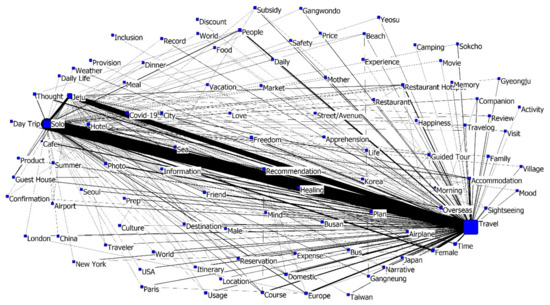
Figure 2.
Visualization of the keyword ‘Solo Travel.’.
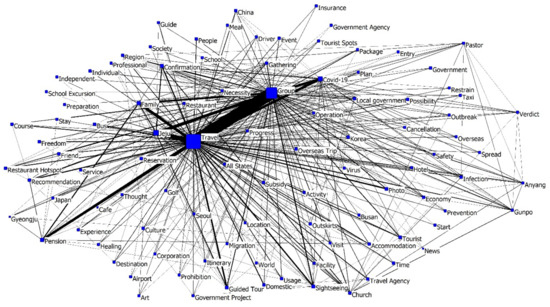
Figure 3.
Visualization of the keyword ‘Group Tour.’.
The top 100 keywords in ‘Solo Travel’ consist of keywords that are related to ‘travel selection factor’, ‘travel destination’, ‘travel recommendation’, and ‘travel expenses’. In travel destinations in particular, it is prominent that solo travelers are interested in domestic destinations. In comparison to Male, the word ‘Female’ has been searched more frequently, as seen in several previous studies [76,77,78].
During the COVID-19 pandemic of 2020, the word ‘COVID-19′ ranked fifth place in the solo travel category, while ‘Confirmation’ ranked below 50th, and ‘Cancellation’ ranked below 100th. It can be deduced that while solo travelers may have a certain level of anxiety regarding COVID-19, they do not consider it as high a risk component as group tourists do.
The top 100 related keywords in ‘Group Tour’ are linked to ‘travel selection factor’, ‘Jeju selection’, ‘Covid19 government policy’. ‘Jeju(#3)’ ranked third for both group tour and solo trip as a desirable destination. Unlike solo travelers, group tourists often purchase pre-planned packages offered by travel agencies in various forms, so it is likely that country-related words were specifically searched during the planning stage. Group tour keywords search reflects that group tourists tend to stay at the destination longer than solo travelers as ‘Day Trip’ was not included in the top 100 keywords. On the other hand, words that have the properties of a group tour, such as ‘Guided Tour(#9),’ ‘Travel Agency(#30),’ ‘Event(#39),’ ‘Facility(#53),’ ‘Service(#65),’ ‘Golf(#68),’ ‘Package(#73),’ and ‘Guide(#84)’ ranked high on the chart. Group tourists were interested in the services and amenities of the types of accommodation, such as pensions, hotels, or accommodations provided by a travel agency. Keywords (COVID-19, Confirmation, Infection, Cancellation, Prohibition, Spread, Prevention, Outbreak, Preparation, Virus, Church, Gunpo and Anyang (the names of the areas where COVID-19 spread)) that were directly related to COVID-19 were searched four times more frequently by group tourists than solo travelers. The data shows that they showed intense interest in COVID-19 outbreaks in the churches in Gunpo and Anyang, Korea, and considered delaying or canceling their trip. This proves that group tourists are more sensitive to the travel risks and constraints COVID-19 imposes, compared to solo travelers. In addition, group tour keywords included many words linked to COVID-19 related national and local government advisories. As group tours involve multiple people in a group, they tend to pay attention to the government’s travel advisory and policies.
According to Figure 2, ‘solo, healing, travel’ is connected by the thickest line in ‘solo travel,’ and ‘travel, COVID-19, Jeju’ is connected in the second thickest line. That is, ‘solo travel’ is referenced along with ‘healing,’ and there are frequent mentions of Jeju island travel due to COVID-19. Healing is multidimensional, it includes physical or biological, mental, spiritual, emotional, and social elements. Healing also can create synergy through combination of the elements. healing also comes from the perspective of health care [79].
Figure 3 reveals that keywords ‘Jeju,’ ‘family,’ ‘confirmation,’ ‘photo,’ guided tour’ spread out from ‘travel’ in the center, and the ‘group’ is connected to such keywords as ‘COVID-19,’ ‘gathering,’ ‘confirmation.’
4.2. Semantic Network Analysis
Semantic Network Analysis can visualize the semantic system and pattern of the communication process by extracting structured information from unstructured data. Semantic Network Analysis assesses the meaning through the structural relationship of words that are components of the message rather than each individual actor [80]. That is to say that this method makes it possible to structurally analyze which words are used and arranged in a specific subject in what manner. Semantic Network Analysis with UCINET 6 is utilized in this study to visualize keywords of solo travel and group tour embedded in social networks. The connection structure between words and the centrality of keywords are analyzed, and the degree of their relationship is quantified.
Table 5 and Table 6 exhibits the results of the analysis of the centrality of the top 100 words for solo trips and group tours. Table 5 shows that the keyword ‘COVID-19′ ranked #5 in ‘Solo Trip’ while #10 in Degree casualty and #17 in Eigenvector Centrality. It means that although COVID-19 exhibited a higher frequency in ‘Solo Trip,’ it has less centrality and less influence, despite being searched frequently. According to frequency, Subsidy ranked #16 while #30 in Degree Centrality and #53 in Eigenvector Centrality. It can be interpreted that solo travelers do not depend on government subsidies. In a comparison of frequency, ‘Accommodation,’ ‘Travel Agency,’ and ‘Course’ scored much higher in Eigenvector Centrality, this may be found as they tend to follow the itinerary set by the travel agency. As the frequency of the keyword ‘Domestic’ ranked #19 in solo trips and #17 in group tours, the outcome shows that travelers are highly interested in domestic travel. In addition, as it ranked #14 in Eigenvector for solo travel, indicating that travelers are interested in domestic day trips.
Table 5.
Comparison of frequency and centrality analysis with the keyword ‘Solo travel’ (2020).
Table 6.
Comparison of frequency and centrality analysis with the keyword, ‘Group tour’ (2020).
Eigenvector Centrality scores were higher than the frequency of ‘Women,’ ‘Recommendation,’ ‘Accommodation,’ ‘Schedule,’ ‘Bus,’ ‘Review,’ ‘Healing,’ and ‘Guest House’. That is to say that solo travelers tend to trust recommendations and reviews on the Internet and prefer guest houses to hotels and cheaper transportation methods like buses.
Through Eigenvector Centrality, I identified the influence of COVID-19 in ‘solo travel’ and ‘group tour’. Although COVID-19 ranked 5th and 4th in both travel types, the outcomes of Eigenvector Centrality are ‘solo travel’ 17th and ‘group tour’ 5th. It shows that the keyword COVID-19 is more influential to ‘group tour’. Government subsidy ranked #16 in frequency, whereas #22 in Degree Centrality and #30 in Eigenvector Centrality. This means solo travelers have stronger reactions to government subsidies than group tourists. In comparison to frequency, ‘Government’ and ‘society’ ranked much higher in Eigenvector Centrality, which means that government policies have a much greater influence on group tourists.
In a group tour, it is indicated that the use of government subsidies have a greater influence as keywords Friend and Use had higher Eigenvector Centrality while the Eigenvector on Itinerary was low, indicating that group tourists tend to adjust their itinerary based on that of tour companies.
CONCOR analysis shows the similarity between words and the connection patterns by analyzing their relationship. The greater the similarity of the pattern, the greater the structural equivalence of words, and then words with similarity form a cluster. Nods are represented in blue squares, and their size indicates frequency. The results of the CONCOR data analysis are shown in Figure 4 and Figure 5.
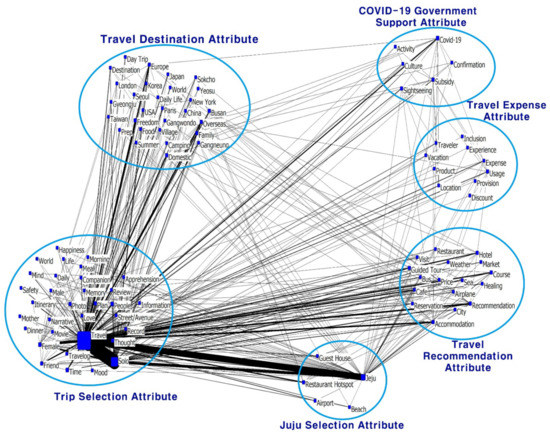
Figure 4.
‘Solo Travel’ CONCOR analysis (2020).
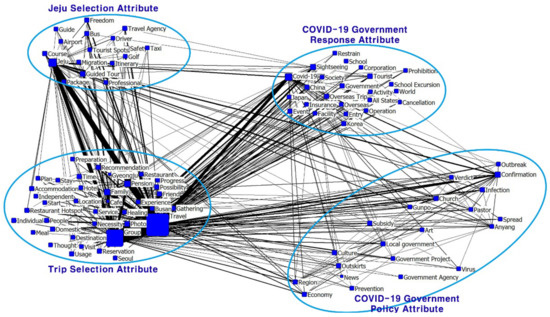
Figure 5.
‘Group Tour’ CONCOR analysis (2020).
‘Solo Trip’ was found to be two large clusters and four small clusters. The largest cluster includes ‘Travel,’ ‘Solo,’ and ‘Happiness.’ This cluster is named ‘Trip Selection Attribute’ cluster. The next largest cluster includes ‘Sokcho,’ ‘Gangneung,’ ‘Domestic,’ ‘London,’ ‘Europe,’ ‘Overseas’ and is named ‘Travel Destination Attribute.’ A smaller cluster consisting of keywords ‘COVID-19′ and ‘Subsidy’ is named ‘COVID-19 Government Support Attribute.’ Research reveals that solo travelers are interested in spending government subsidies on ‘Activity,’ ‘Sightseeing’ and ‘Culture.’ Next, the following cluster is relevant to travel expenses. This cluster is about if ‘Discount’ is applicable and what ‘Provision’ is provided to ‘Travelers,’ thus, making this cluster ‘Travel Expense Attribute’ cluster. At the bottom right, the cluster called ‘Jeju Selection Attribute’ is composed of keywords such as ‘cheap guest house’ solo travelers prefer and keywords that describe its magnificent beaches and popular restaurants. The next cluster represents ‘Travel Recommendation Attribute,’ and keywords include ‘Recommendation,’ ‘Healing,’ ‘Weather,’ and ‘Ocean.’
CONCOR analysis of ‘Group Tour’ includes four clusters. The largest cluster includes keywords such as ‘Travel,’ ‘Group,’ ‘Accommodation,’ ‘Hotel,’ ‘Restaurant’ and ‘Family’ that describe the types of travel, accommodation, meals, and travel company. This cluster is called the ‘Trip Selection Attribute’ cluster. The next largest cluster is composed of ‘COVID-19,’ ‘Insurance,’ ‘cancellation,’ ‘Government,’ ‘prohibition.’ It is named ‘COVID-19 Government Policy Attribute.’ Since the outbreak of COVID-19, tourists are interested in travel cancellations and government policy. Small clusters have uninterrupted interest in ‘Gunpo’ and ‘Anyang’ where the COVID-19 outbreak happened, as well as ‘Virus,’ ‘Spread’ and ‘COVID-19 status.’ Furthermore, they also focus on ‘Subsidy,’ ‘Local Government,’ ‘Government Project’ and ‘Government Agency,’ showing intense interest in what the government will offer. Thus, they are named ‘COVID-19 Government Support Attribute.’ ‘Jeju,’ ‘Travel Agency,’ ‘Tourist Spot,’ ‘Golf,’ etc.,’ in the upper left are named ‘Jeju Selection Attribute.’
5. Conclusions
Our research points to four key findings. First, after the COVID-19 outbreak, the preference for domestic travel and short-distance travel heightened. Group tours showed that keywords like ‘COVID-19,’ ‘Overseas Travel,’ ‘Insurance,’ ‘Cancellation,’ ‘Restrain,’ and ‘Sightseeing’ were equivalent. According to 2019 data, overseas travel ranked higher than domestic travel, excluding Jeju Island. However, the keyword ‘Domestic’ ranked at the top for both solo travel and group travel in 2020, and domestic travel attracted more attention in comparison to 2019 data. Furthermore, ‘Day Trip’ was frequently mentioned in solo travel, proving that tourists’ continued to have an interest in domestic travel. A survey, conducted by the Korea Culture and Tourism Institute, revealed that 45.8% of Koreans wished to travel domestically after the COVID-19 outbreak. Due to the government’s advisory on COVID-19, many people are canceling their personal trips, and schools and corporations are canceling field trips and corporate excursions. In both solo and group tours, the keyword ‘Domestic’ ranked first, proving that, now more than ever, domestic travel continuously piques tourists’ interest. As overseas travel after the COVID-19 outbreak became unpredictable, the need for measures to revitalize domestic tourism is imperative. Despite the sudden and quick spread of COVID-19, policies to minimize the damage consumers face due to cancellations must be instituted. Travelers can plan their trips more actively if the burden of economic losses due to cancellations is minimized. The tourism industry also needs guidance policies from the government to minimize the risks of purchasing insurance or deductibles.
Second, solo travelers and group travelers expressed interest in government subsidies in 2020. In Korea, discounted gift vouchers that can only be used in the market attained through supplementary budgets were issued to revitalize the traditional markets, and employees received payment of partial vacation expenses. Instead of being paid in cash, the vacation bonus was paid in Benepia credit, an online shopping mall dedicated to the Worker’s Vacation Support Project, to purchase travel products, accommodation, transportation, and admission tickets for tour facilities to support tourism. In particular, the government’s tourism subsidies have a limited expiration date and will expire if they are not used. In order to promote tourism, the government issued what is called the ‘National Tourist Gift Certificate’ to people who post on social network services after visiting local festivals and tourist spots or staying overnight. Furthermore, the government and local authorities provided subsidies to traditional cultural performances and local performance groups through the ‘Corona 19 Cultural Support Project’ to enable them to perform without being significantly affected by the audience size. The keyword ‘Subsidy’ appeared at the top of both solo and group tour searches, confirming Koreans’ sentiments to fulfill their desire to travel with government support. Specifically, the keyword ‘Subsidy’ in Eigenvector Centrality was higher for group tours than for solo trips. Keywords such as ‘Government,’ ‘Local Government,’ ‘Government Agency,’ and ‘Government Project,’ which were not present in solo travel, were frequently found in group tours, indicating that group tours and government policies and support have high correlations. Based on these results, national and local governments must strongly consider subsidies and strive to provide subsidies information.
Third, it is assumed that tourists will prefer eco-tours to experience tours. In 2019, cities such as Busan and Gangneung, with exquisite scenery, and Gyeongju, which is famous for school field trips, ranked high. Yet, in 2020, cities such as Yeosu, which is known for its beautiful ocean view, ranked higher than those previously mentioned cities. Jeju Island ranked high in both 2019 and 2020, and UNESCO designated it for bioregional management and as a Biosphere Reserve. The ‘Jeju Selective Attribute’ amongst group tour travelers depended on ‘Safety,’ ‘Golf,’ and ‘Freedom,’ while solo trip travelers focused on ‘Guest House,’ ‘Beach,’ and ‘Restaurant Hotspot.’ Travelers browsed for a safe place to appreciate the natural environment or to have a sense of freedom while exercising. Following the COVID-19 outbreak, the tourism industry must develop safe and nature-friendly travel destinations, as well as eco-environmental tourism courses, guaranteeing safe spaces in order to promote those destinations as safety-prioritized, sheltered resting spots.
Fourth, food tourism is preferred. The highest-ranking keywords for 2019 were not only the destination, type of accommodation, and motivation for travel but also the festivals (#63), themes (#79), fishing (#86), and participation (#100) that travelers can enjoy. In solo travel, keywords such as ‘Shopping’ (#84), ‘Trend’ (#85), and ‘Reading’ (#86) ranked high. In addition, in solo travel, ‘Cafes’ (#25) and ‘Restaurants’ (#31) ranked higher than in group travels (#85 and #55, respectively). However, in 2020, keywords like ‘Festival,’ ‘Theme,’ and ‘Shopping’ did not make it to the rankings. In 2020, many food-related keywords, such as ‘Cafe’ (#15), ‘Restaurant Hotspot’ (#17), ‘Restaurant’ (#79), ‘Meal’ (#91), and ‘Food’ (#95) ranked high.
The social media data analysis in this study demonstrates the transformations in Korean tourism behaviors following the COVID-19 outbreak and Koreans’ reactions to the government’s COVID-19-related tourism policies. This research will enable tourism sector authorities to better understand and identify tourism needs in the post-COVID-19 era.
Nevertheless, this study has its limitations. The first limitation is the scope of data included for analysis. The documents analyzed in this study were obtained from the Korean web portals NAVER and DAUM. As the two most popular sites with the largest number of users in Korea, NAVER and DAUM have a combined market share close to 80%. But, researchers should extensively analyze the contents of more globalized platforms, such as Instagram, Facebook, and Twitter, in future studies.
A second limitation is that the results of this study are limited to South Korea. Other countries have different responses to COVID-19; thus, the results of this study cannot be generalized. However, the data obtained through this study can be used as a case study of a regional strategy for coping with the COVID-19 crisis.
Moreover, this study is limited to two patterns: solo travel and group tour, although there are various other travel behaviors in Korea. Not all travel types have been studied following the COVID-19 outbreak. More diverse tourism behaviors need to be investigated to draw more concrete and extensive conclusions.
Author Contributions
Conceptualization, K.-W.K.; methodology, K.-W.K.; software, K.-W.K.; validation, Y.-A.S.; formal analysis, Y.-A.S.; resources, K.-W.K.; data curation, K.-W.K.; writing—original draft preparation, Y.-A.S.; writing—review and editing, H.-J.K.; visualization, Y.-A.S.; supervision, H.-J.K.; project administration, H.-J.K.; All authors have read and agreed to the published version of the manuscript.
Funding
This research received no external funding.
Data Availability Statement
Data is contained within the article.
Acknowledgments
This paper was supported by the KU Research Professor Program of Konkuk University.
Conflicts of Interest
The authors declare no conflict of interest.
References
- WHO. Timeline-COVID-19. Available online: https://www.who.int/news/item/08-04-2020-who-timeline---COVID-19 (accessed on 1 October 2020).
- UNWTO. International Tourism and COVID-19. Available online: https://www.unwto.org/international-tourism-and-COVID-19 (accessed on 1 October 2020).
- Herald Economy. Available online: http://biz.heraldcorp.com/view.php?ud=20200203000117&ACE%20.SEARCH=1 (accessed on 3 April 2020).
- KDCA (Korea Center for Disease Control and Prevention). Available online: https://www.cdc.go.kr/cdc_eng/ (accessed on 1 November 2020).
- KBS NEWS. Available online: http://news.kbs.co.kr/news/view.do?ncd=4508794 (accessed on 5 August 2020).
- Farzanegan, M.R.; Gholipour, H.F.; Feizi, M.; Nunkoo, R.; Andargoli, A.E. International Tourism and Outbreak of Coronavirus (COVID-19): A Cross-Country Analysis. J. Travel Res. 2020, 1–6. [Google Scholar] [CrossRef]
- Grech, V.; Grech, P.; Fabri, S. A risk balancing act—Tourism competition using health leverage in the COVID-19 era. Int. J. Risk Saf. Med. 2020, 31, 121–130. [Google Scholar] [CrossRef] [PubMed]
- Madani, A.; Boutebal, S.E.; Benhamida, H.; Bryant, C.R. The Impact of Covid-19 Outbreak on the Tourism Needs of the Algerian Population. Sustainability 2020, 12, 8856. [Google Scholar] [CrossRef]
- Couto, G.; Castanho, R.A.; Pimentel, P.; Carvalho, C.; Sousa, A.; Santos, C. The Impacts of COVID-19 Crisis over the Tourism Expectations of the Azores Archipelago Residents. Sustainability 2020, 12, 7612. [Google Scholar] [CrossRef]
- Korean Culture and Tourism Institute. Available online: https://know.tour.go.kr/ptourknow/knowplus/kChannel/kChannelPeriod/kChannelPeriodDetail19Re.do?seq=102903 (accessed on 11 November 2020).
- Scott, N.; Baggio, R.; Cooper, C. Network Analysis and Tourism: From Theory to Practice; Channel View Publications: Bristol, UK, 2007. [Google Scholar]
- Lee, S.H. Analysis of Domestic Travel Behavior of Solo Travelers and Their Implications; Korea Institute for Industrial Economics & Trade: Sejong, Korea, 2017. [Google Scholar]
- Uysal, M.; Hagan, L.A.R. Motivation of Pleasure Travel and Tourism. In VNR’s Encyclopedia of Hospitality and Tourism; Van Nostrand Reinhold: New York, NY, USA, 1993; pp. 798–810. [Google Scholar]
- Crompton, J. Motivations of pleasure vacations. Ann. Tour. Res. 1979, 6, 408–424. [Google Scholar] [CrossRef]
- Lundberg, D.E. The Tourist Business, 6th ed.; Van Nostrand Reinhold: New York, NY, USA, 1990. [Google Scholar]
- Fodness, D. Measuring tourist motivation. Ann. Tour. Res. 1994, 21, 555–581. [Google Scholar] [CrossRef]
- Kim, J.H.; Park, E.H. Cognitive Evaluation of Package Tourism Products and Customer Satisfaction: Controlling on the Mo-tivation of Tourists. Korean J. Tour. Res. 2017, 32, 225–248. [Google Scholar]
- McGhee, N.G.; Loker-Murphy, L.; Uysal, M. The international pleasure travel market: Motivations from a gendered perspective. J. Tour. Stud. 1996, 7, 45–57. [Google Scholar]
- Park, C.-W. An Analysis on the Differences Korean Tourists’ Motivation according to the Travel Typology. J. Int. Trade Commer. 2010, 6, 231–252. [Google Scholar] [CrossRef]
- Lee, J.E. The Relationship among Tourism Motivation, Information Search and Behavioral Intention. J. Event Sci. 2006, 5, 71–87. [Google Scholar]
- Sheldon, P. Tourism Information Technology; CAB International: Wallingford, UK, 1997. [Google Scholar]
- Wethner, H.; Klein, S. Information Technology and Tourism: A Challenging Relationship; Springer: Wien, Austria, 1999. [Google Scholar]
- Xiang, Z.; Wöber, K.; Fesenmaier, D.R. Representation of the Online Tourism Domain in Search Engines. J. Travel Res. 2008, 47, 137–150. [Google Scholar] [CrossRef]
- Kim, D.H. The Effect of Web Site Tourism Information Quality and Usefulness on User Satisfaction. J. Tour. Leis. Res. 2004, 16, 5–6. [Google Scholar]
- Park, H.J. End user behavior analysis based upon mobile tourism service experience focusing on university students. Int. J. Tour. Manag. Sci. 2008, 23, 101–124. [Google Scholar]
- Kwon, Y.G.; Park, H.J.; Lee, S.R. The Effect of Tourism Information Website on Satisfaction, Trust and Loyalty: Focused on Tourism Website by Jeju Province. J. Tour. Leis. Res. 2003, 15, 137–157. [Google Scholar]
- Lim, M.J.; Nam, I.S.; Jeong, G.H. Research Articles: An Evaluation of Festival Tourism Information by Importance-Performance Analysis: Focused on Geumsan Insam Festival. J. Tour. Leis. Res. 2007, 19, 111–130. [Google Scholar]
- Kim, D.G.; Jang, J.S.; Kang, J.E. The Research on Evaluating the Quality for an Website of Providing Tourism Information. J. Tour. Leis. Res. 2006, 18, 311–325. [Google Scholar]
- Park, E.S. How Mobile Tour Information Affects the Image and Satisfaction on that Spots. J. Tour. Leis. Res. 2015, 27, 41–58. [Google Scholar]
- Davis, F. Perceived usefulness, perceived ease of use and user acceptance of information technology. MIS Q. 1989, 13, 319–340. [Google Scholar] [CrossRef]
- Lopez, D.M.; Blobel, B.; Gonzalez, C. Information Information quality in healthcare social media—An architectural approach. Health Technol. 2016, 6, 17–25. [Google Scholar] [CrossRef]
- Lee, W.S.; Heo, J.; Moon, J. A study of tourism information and tourist behavior. J. Tour. Leis. Res. 2018, 30, 21–38. [Google Scholar] [CrossRef]
- Park, B.G.; Nah, Y.J.; Lim, C.K. An Exploratory Study on the Relationship Between Tourism Motivations and Online Tourism Information Search Behavior. J. Korea Contents Assoc. 2005, 5, 202–210. [Google Scholar]
- Bloch, M.; Pigneur, Y.; Steiner, T. The IT-Enabled Extended Enterprise, Applications in the Tourism Industry. In Proceedings of the 3rd International Conference on Information and Communications Technologies in Tourism, Innsbruck, Austria, 17–19 January 1996. [Google Scholar]
- Choi, H.Y.; Kim, H.K.; Lee, M.G. The Development of the Storytelling Marketing Strategy through the Analysis of Travel Blogs. J. Prod. Res. 2011, 29, 19–30. [Google Scholar]
- Jeong, B.O. Effects of Quality of Travel Blogs on Intention to Use Applying Extended Technology Acceptance Model and Information System Success Model. J. Tour. Stud. 2013, 25, 81–109. [Google Scholar]
- Nationally Accredited Designated Statistics. Available online: https://www.nia.or.kr/site/nia_kor/ex/bbs/View.do?cbIdx=99835&bcIdx=22505&parentSeq=22505 (accessed on 12 November 2020).
- Korean Statistical Information Service. Available online: https://kosis.kr/statisticsList/statisticsListIndex.do?menuId=M_01_01&vwcd=MT_ZTITLE&parmTabId=M_01_01 (accessed on 5 August 2020).
- Cho, S.H. A Study on Leisure Attitude, Leisure Immersion, Leisure Satisfaction of Hornyeojok. J. Cult. Prod. Des. 2017, 51, 33–43. [Google Scholar] [CrossRef]
- Lee, R.-S. The Effect of Solo Travel on Self-Reflection and Satisfaction of Life. J. Tour. Leis. Res. 2019, 31, 235–253. [Google Scholar] [CrossRef]
- Korea JoongAng Daily. Available online: https://news.joins.com/article/23890223 (accessed on 15 October 2020).
- Laesser, C.; Bertelli, P.; Riklin, T. Solo travel: Explorative insights from a mature market (Switzerland). J. Vacat. Mark. 2009, 15. [Google Scholar] [CrossRef]
- Lee, W.H. Market Characteristics and Direction on Foreign Individual Traveler (FIT) Policy; Korea Culture & Tourism Institute: Seoul, Korea, 2007. [Google Scholar]
- Jang, Y.R.; Kim, H.Y. An Empirical Study on Preference Tour Activities, Tour Constraints, Destination Selection Attribute of F.I.T. Tourist. Int. J. Tour. Manag. Sci. 2011, 26, 331–351. [Google Scholar]
- Chung, J.Y.; Baik, H.-J.; Lee, C.-K. The role of perceived behavioural control in the constraint-negotiation process: The case of solo travel. Leis. Stud. 2017, 36, 481–492. [Google Scholar] [CrossRef]
- Lee, Y.J.; Song, Y.M. The Satisfaction of the Japanese Tourist: What are Differences in Terms of Specific Satisfaction between Individual and Package Tour. East Asian Stud. 2012, 62, 297–330. [Google Scholar]
- Baik, H.J.; Lee, C.K.; Kim, J.O. Examining Structure Relationships between Travel Constraints, Negotiation, Attitude, and Behavior Intention for Domestic Solo Travelers: The Case of 2040 Ages of Single Household. J. Tour. Leis. Res. 2015, 27, 115–134. [Google Scholar]
- Kim, M.K.; Kim, J.E. The Study on Tourism Constraints Perception and Participation Intention by Motivation on ‘Travel Alone’ Focused on the University Students in Daegu-Gyeongbuk Area. Tour. Res. 2016, 41, 1–17. [Google Scholar]
- Jones, G.W.; Yanxia, Z.; Zhi, P.C.P. Understanding High Levels of Singlehood in Singapore. J. Comp. Fam. Stud. 2012, 43, 731–750. [Google Scholar] [CrossRef]
- Wang, H.; Abbott, D.A. Waiting for Mr. Right: The Meaning of Being a Single Educated Chinese Female Over 30 in Beijing and Guangzhou. Women Stud. Int. Forum 2013, 40, 222–229. [Google Scholar] [CrossRef]
- Laws, E.; Prideaux, B. Crisis Management: A Suggested Typology. J. Travel Tour. Mark. 2005, 19, 1–8. [Google Scholar] [CrossRef]
- Goldman, N.; Yang, Z. A codon-based model of nucleotide substitution for protein-coding DNA sequences. Mol. Biol. Evol. 1994, 11, 725–736. [Google Scholar] [CrossRef]
- Yu, Y.H.; Lee, J.H.; Lee, H.C. Determinants of revisit intention to Seoul by Chinese tourists: The comparison of group tourist and FIT. J. Tour. Leis. Res. 2016, 28, 241–256. [Google Scholar]
- Han, H.C.; Kim, K.H.; Kim, J.S. An Analysis of Tourist Destination Routes of Chinese Group Tourists and FIT Visiting in Seoul Korea. J. Hotel Resort 2017, 16, 39–57. [Google Scholar]
- Choi, H.H.; Oh, S.H.; Lee, J.H.; Kim, J.H. Travel Guidance Interface for FIT (Foreign Independent Tourists). J. Digit. Des. 2008, 8, 391–400. [Google Scholar]
- Poon, A. Tourism, Technology and Competitive Strategies; CAB: Oxford, UK, 1993. [Google Scholar]
- Wang, K.; Hsieh, A.C. Is the tour leader an effective endorser for grouppackage tour brochures? Tour. Manag. 2002, 23, 489–498. [Google Scholar] [CrossRef]
- Hanai, T.; Oguchi, T.; Ando, K.K. Yamaguchi Important attributes of lodgings to gain repeat business: A comparison between individual travels and group travels. Int. J. Hosp. Manag. 2008, 27, 268–275. [Google Scholar] [CrossRef]
- Reisinger, Y.; Mavondo, F. Travel Anxiety and Intentions to Travel Internationally: Implications of Travel Risk Perception. J. Travel Res. 2005, 43, 212–225. [Google Scholar] [CrossRef]
- Kim, D.Y.; Lee, C.K.; Song, H.J. The Effect of the Perception of Influenza A(H1N1) on International Travel Decision-making Process of Group Tourists. J. Tour. Sci. 2011, 35, 189–209. [Google Scholar]
- Xiang, Z.; Gretzel, U. Role of social media in online travel information search. Tour. Manag. 2010, 31, 179–188. [Google Scholar] [CrossRef]
- Zhang, L.; Pan, B.; Smith, W.; Li, X. An Exploratory Study of Travelers’ Use of Online Reviews and Recommendations. Inf. Technol. Tour. 2009, 11, 157–167. [Google Scholar] [CrossRef][Green Version]
- Shih, H.-Y. Network characteristics of drive tourism destinations: An application of network analysis in tourism. Tour. Manag. 2006, 27, 1029–1039. [Google Scholar] [CrossRef]
- Mai, T.T.T.; Ananda, S.J.; Zahra, P. Social network analysis in tourism services distribution channels. Tour. Manag. Perspect. 2016, 18, 59–67. [Google Scholar]
- Freeman, L.C. Social Network Analysis; Sage: London, UK, 2008. [Google Scholar]
- Opsahl, T.; Agneessens, F.; Skvoretz, J. Node centrality in weighted networks: Generalizing degree and shortest paths. Soc. Netw. 2010, 32, 245–251. [Google Scholar] [CrossRef]
- D’Agata, R.; Gozzo, S.; Tomaselli, V. Network analysis approach to map tourism mobility. Qual. Quant. 2012, 47, 3167–3184. [Google Scholar] [CrossRef]
- Qiang, Y.; Rob, L.; Bin, G.; Wei, C. The influence of user-generated content on traveler behavior: An empirical investigation on the effects of e-word-of-mouth to hotel online bookings. Comput. Hum. Behav. 2011, 27, 634–639. [Google Scholar]
- Yue, G.; Barnes, S.J.; Khuong, L.N.; Qiong, J. A Theoretical Approach to Online Review Systems: An Influence of Review Components Model. In Proceedings of the Pacific Asia Conference on Information Systems, Chiayi City, Taiwan, 27 June–1 July 2016; 2016. [Google Scholar]
- Oh, C.W. Analysis of Meaning of Social Conflict Discussion in Korea: Focusing on Key Word Network in Major Portals. J. Polit. Commun. 2017, 45, 37–67. [Google Scholar] [CrossRef]
- Ann, M.S. Multicultural keywords and network analysis using big data. Soc. Converg. Knowl. Trans. 2018, 6, 87–104. [Google Scholar]
- Internettrend. A Website That Provides the Share of Internet Search by Portal in Korea. Available online: http://www.internettrend.co.kr/trendForward.tsp (accessed on 10 October 2020).
- Park, S.H.; Lee, C.H. The traditional market activation factor derivation research through social big data-focused on Seoul City Mangwon market and Suyu market. Seoul Stud. 2018, 19, 1–18. [Google Scholar]
- Borgatti, S.P.; Everett, M.G.; Freeman, L.C. Ucinet: Encyclopedia of Social Network Analysis and Mining; Springer: New York, NY, USA, 2014. [Google Scholar]
- Kondracki, N.L.; Wellman, N.S.; Amundson, D.R. Content analysis: Review of methods and their applications in nutrition education. J. Nutr. Educ. Behav. 2002, 34, 224–230. [Google Scholar] [CrossRef]
- Willson, E.; Little, D.A. ‘Relative Escape’? The Impact of Constraints on Women Who Travel Solo. Tour. Rev. Int. 2005, 9, 155–175. [Google Scholar] [CrossRef]
- Xu, W.; Liu, M. Meanings of female solo travel: A perspective of autoethnography. Tour. Trib. 2018, 33, 23–38. [Google Scholar]
- Elaine, C.L.Y.; Mona, Y.; Catheryn, K.L. The meanings of solo travel for Asian women. Tour. Rev. 2019, 74, 1047–1057. [Google Scholar]
- Wilbert, M.G. Healing Places; Rowman & Littlefield Publishers: New York, NY, USA, 2003. [Google Scholar]
- Wang, W.; Rada, R. Structured hypertext with domain semantics. ACM Trans. Inf. Syst. 1998, 16, 372–412. [Google Scholar] [CrossRef]


Publisher’s Note: MDPI stays neutral with regard to jurisdictional claims in published maps and institutional affiliations. |
© 2020 by the authors. Licensee MDPI, Basel, Switzerland. This article is an open access article distributed under the terms and conditions of the Creative Commons Attribution (CC BY) license (http://creativecommons.org/licenses/by/4.0/).