Abstract
Energy consumption, economics, and environmental impacts of canola production were assessed using a combined technique involving an adaptive neuro-fuzzy inference system (ANFIS) and a multi-objective genetic algorithm (MOGA). Data were collected from canola farming enterprises in the Mazandaran province of Iran and were used to test the application of the combined modeling algorithms. Life cycle assessment (LCA) for one ha functional unit of canola production from cradle to farm gate was conducted in order to evaluate the impacts of energy, materials used, and their environmental emissions. MOGA was applied to maximize the output energy and benefit-cost ratio, and to minimize environmental emissions. The combined ANFIS–MOGA technique resulted in a 6.2% increase in energy output, a 144% rise in the benefit-cost ratio, and a 19.8% reduction in environmental emissions from the current canola production system in the studied region. A comparison of ANFIS–MOGA with the data envelopment analysis approach was also conducted and the results established that the former is a better system than the latter because of its ability to generate optimum conditions that allow for the assessment of a combination of parameters such as energy, economic, and environmental impacts of agricultural production systems.
1. Introduction
The agricultural production sector contributes about 14% of global net carbon dioxide emissions, hence, this sector is considered as a major emitter of atmospheric greenhouse gases (GHGs) in recent times [1]. To enable useful decisions for developing economically viable, energy-efficient, and environmentally friendly production systems, tools are required to allow evaluations of environmental impacts of agricultural production systems [2]. Life cycle assessment (LCA) is a comprehensive and internationally recognized tool for a cradle-to-grave evaluation of the environmental impacts of processes, products, and services, offering an insight into solutions that are aimed at reducing such impacts in order to achieve more sustainable production and consumption [3]. Energy, economics, and environmental life cycle assessments of agricultural and food products have already been studied in recent works [4,5,6,7,8,9].
Alternative knowledge acquisition approaches based on artificial neural networks (ANNs), fuzzy logic (FL), and genetic algorithms (GAs) have the advantages of producing good results in situations where data is imprecise, noisy, and inconsistent. Hematian et al. [10] performed a study involving the production of sugar beet and identified ways by which energy consumption can be optimized via the application of GA. They alluded to the proof of concept involving the use of the GA technique for the creation of optimized patterns for energy use for producing sugar beet. The combined systems of ANNs, FL, and GAs have all the advantages together, and therefore, they have recently attracted considerable attention. FL and data envelopment analysis (DEA) techniques were integrated by Sefeedpari et al. [11] in their study to address the ranking issue of dairy farms for milk production. Using both FL and ANNs, Jang [12] produced a fuzzy inference system that was implemented in the framework of adaptive networks, referred to as the adaptive neuro-fuzzy inference system (ANFIS) approach.
ANFIS applies an ANN learning algorithm to set a fuzzy rule with suitable membership functions (MFs) considering the input and output data. It is an appropriate solution for function approximation in which a hybrid learning algorithm is applied to the location and shape of MFs, which renders it suitable for complex system modeling [13]. Arkhipov et al. [14] used ANFIS to evaluate the ecological conditions through the bio-indicators; later, this combined technique was applied to the prediction of crop yields based on different energy inputs [15]. A multi-stage ANFIS technique was applied by Khoshnevisan et al. [16] to estimate potato yield via the use of varied combinations of energy input parameters.
GA is a branch of evolutionary algorithms (EAs) often implemented to find solutions for optimization-related problems from methods that are stimulated by natural evolution. It has been applied in various fields of study by multiple researchers and widely considered to be an effective technique for optimization-related studies [17,18]. In an LCA study conducted by Khoshnevisan et al. [19], a multi-objective genetic algorithm (MOGA) and DEA were used to assess the environmental benefits associated with cropping systems [19]. They relied on mathematical relations for estimating fitness functions. A growing body of literature has employed the GA technique to solve the allocation problem in life cycle inventory. One of such body of literature includes the study performed by Cellura et al. [20] who, without the use of computational methods, attempted to solve multi-output systems characterized by a rectangular matrix of technological coefficients. Khoshnevisan et al. [19] used the multi-objective genetic algorithm (MOGA) for solving an optimization problem based on watermelon yield and environmental impacts. In another engineering application of combined approaches, first, the neural fuzzy networks approach was utilized for modeling fluid dispensing processes for microchip encapsulation, and then the developed models were applied to formulate a MOGA problem to find the optimum values for the fluid dispensing process parameters [21].
Most of these studies separately used artificial intelligence techniques for either prediction or optimization of performance parameters in agricultural production systems. To the best of the authors’ knowledge, there has been no known study involving both modeling and optimization techniques for an energy, economic, and environmental performance evaluation of agricultural systems. Therefore, the objective of this study was to evaluate the performance of an ANFIS–MOGA model to model and optimize the energy, economic, and environmental life cycle assessment of oilseed production. A multi-stage ANFIS model was used to estimate energy consumption, cost-effectiveness, and the environmental impacts associated with the production of canola. Then, the developed models were used to formulate a MOGA in order to determine the optimal combined parameters involving energy input and output as well as establish any potential benefit-to-cost (B/C) ratio and minimize environmental emissions from the production process.
2. Materials and Methods
2.1. Sampling and Data Acquisition
The primary data for the energy and economic productivity analyses as well as the data for life cycle inventory analysis of canola production were collected from farm visits and structured face-to-face interviews with the canola producers in Mazandaran province, northern Iran. This region is characterized by a mild and humid climate along the Caspian shoreline with an annual rainfall that averages around 1200 to 1300 mm. The simple random sampling method was employed for the purpose of sampling and the sample size was calculated as 150 farms. In terms of area, the interviewers surveyed 416.60 ha, representing about 5% of the total planted area in the region.
A methodology involving physical material flows was used for the energy analysis through which the input and output parameters for crop husbandry were determined. The energy coefficients used were from published papers [22,23,24,25,26]. The inputs were in the form of machinery, diesel fuel and lubricants, agrochemicals (herbicides, fungicides, and insecticides), nitrogen fertilizers, chemical fertilizers (phosphorus (P2O5), potassium (K2O), sulfur (S)), and farmyard manure (FYM). The outputs were canola grain and straw. The procedure for the LCA in the present study followed the ISO 14040:2006 standard [27], and the goal was to examine the environmental profile of canola production and to identify cost reduction measures as well as increase the environmental sustainability of the product from a life cycle perspective. The functional unit chosen for the analysis was 1 ha of canola production during a single production period.
The focus of this study was to apply ANFIS–MOGA for prediction and optimization of the energy, economic, and environmental indicators associated with the production of canola, in the agricultural phase, rather than the analysis of the processing phase; hence the cradle-to-farm gate system boundaries were considered. Figure 1 represents a simplified diagram that shows the major stages of the product life cycle.
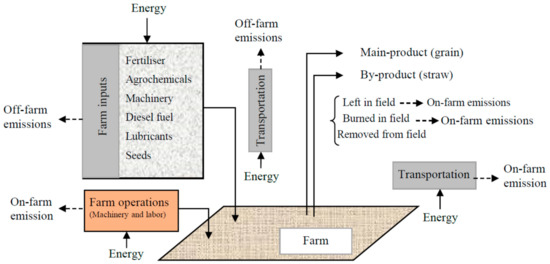
Figure 1.
System boundaries, inputs, outputs, and emissions for canola production.
2.2. Inventory Analysis
The inventory data included off-farm raw material inputs and on-farm emissions. On-farm emissions often involve nitrogen emissions, which usually contribute significantly to the final results of LCA studies. In the process of synthetic N production from converting atmospheric N2 to a form available to plants (NH4+ or NO3−), although nitrogen availability is not a limiting factor, the use of fossil energy is a limiting factor and it should be considered [28]. Weeding operations are usually one of the main problems for canola production in the region. Common herbicides used to suppress the growth of weed by local farmers include Treflan, Gallant super, and Leontral. Diazinon and Tilt agrochemicals are also a common pesticide and fungicide often used to control pests and fungi, respectively. To model commercial agrochemicals, their corresponding chemical groups and active ingredient percentages according to inventory data from the Ecoinvent database and information from the company were applied. Diesel fuel and lubricating oil used by tractors and combined harvesters were estimated using data obtained from the operators of the heavy-duty equipment. The data for transportation was collected by interviewing local experts.
The inventory data for emissions linked to the application of inputs were determined according to the methods and coefficients described in [1,28]. Fertilizer application results in emissions of a variety of gases that not only contribute to global warming, but also create environmental problems such as acidification, eutrophication, and other conditions with significant impact on the ecosystem. For instance, most fertilizers contain nitrogen. Once those fertilizers are applied to agricultural systems, two conditions are likely to occur: One is that the fertilizer gets absorbed by the plants, and the other is the conversion of the fertilizer into various forms via an oxidation process. This means that direct field emissions of gases such as ammonia (NH3), nitrous oxide (N2O), and NOx as well as nitrates (NO3−) are likely to occur and may lead to environmental issues mentioned above, including the contamination of groundwater. The same is true for phosphorous-containing fertilizers that result in the emission of phosphorus, which is equally responsible for the contamination of surface water. The models presented in Table 1 were used to calculate indirect N2O emission from the atmospheric deposition of chemical fertilizers and farmyard manure.

Table 1.
Coefficients for estimating the on-farm emissions related to the application of inputs in canola production.
Upon the application of N-containing fertilizers, nitrate (NO3−) is formed via ammonium (NH4+) conversion, a nitrification process solely responsible for the natural source of nitrate in the environment. The NO3- is easily absorbed by plant roots, yet remains susceptible to leaching into deeper soil levels where it is unavailable for uptake by plants or even microorganisms. About 30% of the N content of fertilizers and manure leaches deeper down into the soil and groundwater. For the calculation of indirect N2O from the atmospheric deposition of chemical fertilizers and manure, the Intergovernmental Panel on Climate Change (IPCC) guidelines were followed. The amount of N2O emitted through atmospheric deposition is a function of the proportion of the applied N that volatilizes as NH3 and NOx, and the amount converted into N2O.
During the denitrification process, soil NOx finds its way to the atmosphere where it affects the stratospheric layer of the ozone, a condition known as the greenhouse effect. About 21% of direct N2O emitted from chemical fertilizers and farmyard manure is in the form of NOx [1]. Phosphorous from chemical fertilizers and manure contaminates the surface and groundwater due to leaching, run-off, and soil erosion, and it is a major cause of freshwater eutrophication [29]. It was assumed that 0.05% of phosphorus content of fertilizers and manure reaches freshwater resources.
An emission factor of 0.7 (kg CO2e/man-h) [31] was considered to estimate the environmental emissions associated with labor use in the canola production process. For the calculation of on-farm emissions of diesel fuel combustion, the “traction” data set was used. It covers the combustion of diesel-powered tractors at an average load. In addition, all agrochemicals used for crop production were assumed to end up in the agricultural soil compartment. Thus, the agrochemicals used as inputs were considered as emissions. Transformation products from pesticides were excluded from the analysis [1].
Inventory data for the production of inputs (e.g., fertilizer, agrochemicals, and machinery) and field emissions came from the Ecoinvent®3.0 database included in the SimaPro 8.0.3 software (Amersfoort, The Netherlands) [32].
2.3. ANFIS
The ANFIS was initially proposed by Jang in 1993 [12]. The basic structure of a fuzzy inference system (FIS) is a five-layered feed-forward network as follows (Figure 2) [33].
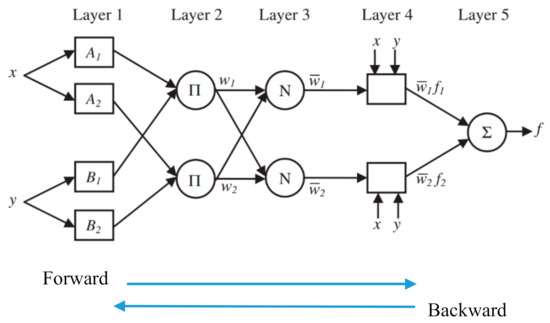
Figure 2.
Schematic diagram of an adaptive neuro-fuzzy inference system [33].
ANFIS uses a hybrid learning algorithm to identify the membership function parameters of a single output for the FIS of the Sugeno type. A combination of least squares and backpropagation gradient descent methodologies are implemented to train the membership functions parameters, and consequently to simulate the relationship between a given set of input and output data. Since the concept of ANFIS has been elaborated in previous studies [16], only a brief description of this system is presented here. For simplicity, the abovementioned system is supposed to have two inputs (x, y) and one output (z). Considering a Sugeno fuzzy model, the fuzzy rules between the input and output data are generated as follows [34]:
- Rule 1: If (x is A1) and (y is B1) then (f1 = p1x+q1y+r1)
- Rule 2: If (x is A2) and (y is B2) then (f2 = p2x+q2y+r2)
where Ai and Bi represent the fuzzy sets, fi denotes the output, and {pi, qi, ri} denote the modifiable parameters which are optimized during the training process.
The node functions of each layer for the two-rule ANFIS architecture, as presented in Figure 2, are briefly described as follows:
Layer 1: Every node i in this layer is an adaptive node with a node function,
where x denotes the input to node i, Ai represents the linguistic label associated with this node function, and Oi1 is the membership function of Ai. To the input y, the node functions in the same layer are of the same function family as x. Generally, is chosen to be bell-shaped or gauss-shaped between 0 and 1, as follows:
or
where {ai, bi, ci} are the premise parameters.
Layer 2: Every node in this layer is a fixed node, operating as a simple multiplier. The outputs of these nodes are defined as follows:
Layer 3: In this layer, each node is adaptive, and it is labeled as N. The ith node calculates the ratio of the ith rule’s firing strength to the sum of all rules’ firing strengths. The outputs of this layer are called normalized firing strengths.
Layer 4: Every node in this layer is an adaptive node with a function as [33]:
where denotes the output of layer 3, and {pi, qi, ri} represent the consequent parameters.
Layer 5: In this final layer, the single node is fixed and labeled as ∑, which calculates the overall output as the sum of all incoming signals as follows:
The ANFIS model is characterized by constraints in terms of the number of inputs, which often does not exceed 5. However, should the number of ANFIS inputs go beyond 5, there is an increase in the rule numbers and computational time. In such an event, a number of solutions are possible, one of which is to apply the principal component analysis (PCA) technique, or rely on data clustering to reduce the number of criteria. Considering the data obtained from the canola production process in the region of study, eight energy input parameters include labor, machinery, diesel fuel, agrochemicals, nitrogen fertilizer, other chemical fertilizers, farmyard manure, and seeds. A clustering approach was proposed to classify the input parameters into four groups. Accordingly, the proposed model was developed using seven ANFIS sub-networks (Figure 3).
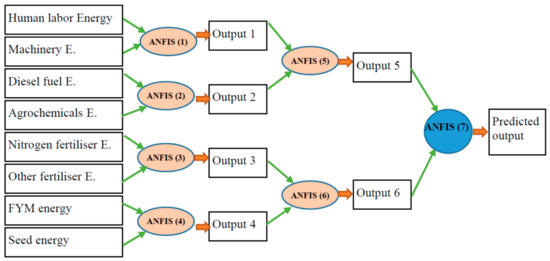
Figure 3.
Three-stage ANFIS structure to predict the energy output, economic productivity, and environmental emissions of canola production.
In order to evaluate the performance of developed ANFIS models, the quality parameters, including the root mean square error (RMSE), the mean absolute error (MAE), coefficient of determination (R2), normalized mean bias error (NMBE), and coefficient of variation of the root mean square error (CVRMSE), were estimated by considering the observed and predicted values.
2.4. Multi-Objective Genetic Algorithm (MOGA)
Genetic algorithms are random search optimization techniques that are based on a selection strategy linked to the principles of the strongest in retaining genetic information during specific functions; MOGA utilizes a non-dominated sorting genetic algorithm, NSGA-II [35], to allow for the identification of feasible solutions.
Following the flowchart of applying genetic algorithms (Figure 4), first the problem is defined, an initial random population is generated, and fitness functions are evaluated; then, all individuals in the population undergo the operations of selection, crossover, and mutation to produce a new population in the next generation. The fitness is evaluated by calculating the objective functions. Individuals with higher fitness are selected for the nesting frequency. Consequently, on average, each successive generation’s population improves until it meets the stopping criteria specified in the problem definition and therefore the individual with higher fitness in the final generation is selected as the optimum solution [35,36]. When solving multi-objective problems, the objective functions of interest are in competition; as such, they cannot simultaneously attain their high fitness values. In this case, a non-dominated solution set, also called the Pareto frontier, was employed instead of a single solution [35].
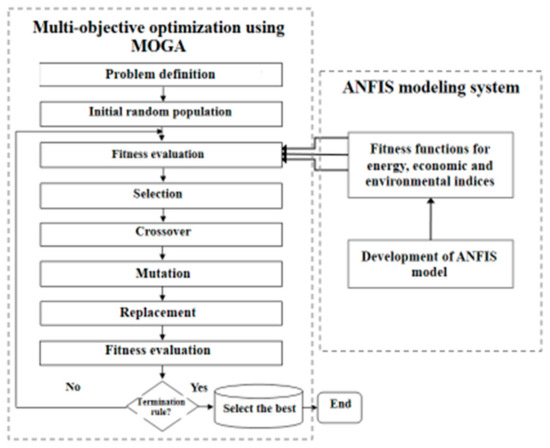
Figure 4.
The flowchart for the development of adaptive neuro-fuzzy inference systems and the application of multi-objective genetic algorithm.
In this study, three objective genetic algorithms were applied to maximize the energy output and B/C ratio, and to minimize the environmental emissions associated with canola production. The fitness functions were obtained by a three-stage ANFIS method (Figure 4). The minimum and maximum values of energy consumption by different inputs were considered limits for problem formulation.
2.5. Optimization Performance Evaluation
The performance of the application of the combined ANFIS–MOGA method was evaluated using the DEA technique. Efficiency of a decision-making unit (DMU) in DEA is defined as technical efficiency, pure technical efficiency, and scale efficiency, which is estimated by dividing the technical efficiency score by the pure technical efficiency score. The conceptual framework for DEA models is described in a previous study [37].
For conducting life cycle assessment, the SimaPro 8.0.3 software (Amersfoort, The Netherlands) was used. The programming part for modeling with multi-stage ANFIS and optimization by MOGA was performed in a MATLAB 8.5 (R2015b) environment. The Efficiency Measurement System (EMS) version 1.3 (Dortmund, Germany) was employed for the DEA models.
3. Results
3.1. Energy Use, Economics, and Environmental Impacts of Canola Production
Labor, machinery, diesel fuel and lubricant, agrochemicals (herbicides, fungicides, and insecticides), nitrogen fertilizer, other chemical fertilizers (including phosphorus, potassium, and sulfur), farmyard manure, and canola seeds all made up the input parameters of the oilseed canola production in the region. Irrigation water and electrical energy were not applied to canola production in the region of study. Statistical information for energy inputs as well as certain indices of energy consumption are presented in Table 2. The results revealed that 5188 to 27,887 MJ ha−1 (average 15,209 MJ ha−1) energy was consumed for canola production, whereas the output energy was estimated to be 56,696 MJ ha−1. The minimum and maximum values for the input parameters were considered the lower and upper bounds for MOGA problem definition.
Table 2.
Energy use and energy output of canola production in the studied region.
An economic evaluation of the production of canola was conducted by estimating the total production revenue, B/C ratio, and variable and fixed costs of production (Table 3). The total cost of production was estimated to be USD 707 ha−1, and the contributions of variable and fixed costs were estimated to be 69.4% and 30.6%, respectively. A division of the total production revenue by the total cost of production resulted in a B/C ratio of 1.60.
Table 3.
Economic analysis of canola production.
The environmental life cycle assessment was conducted by following the CML-IA [38] method. The impact categories included abiotic depletion (fossil fuels), global warming (GWP100a), ozone layer depletion (ODP), human toxicity, terrestrial ecotoxicity, freshwater aquatic ecotoxicity, marine aquatic ecotoxicity, photochemical oxidation, acidification, and eutrophication. GWP was estimated to be 2454 kg CO2eq ha−1 (Table 4), and it was mainly due to chemical fertilizer application in the field, as well as diesel fuel burning for farm operations. Acidification and eutrophication impacts of canola production were estimated to be for 48.4 kg SO2eq ha−1 and 37.34 kg PO43−eq ha−1, respectively (Table 4). Marine aquatic ecotoxicity for canola production was estimated to be 873,286.3 kg 1,4-DBeq ha−1 (Table 4). These results correlate favorably with previous findings in the literature [39,40,41], thus further support the idea that fertilizers contribute significantly to environmental emissions during agricultural practices. In a previous study in Chile, the acidification potential for the production of canola and sunflowers was reported as 16 kg SO2eq ha−1 and 23 kg SO2eq ha−1, respectively. In addition, the eutrophication potential for the production of rapeseed and sunflowers totaled 7.2 and 9 kg PO4eq ha−1, respectively.
Table 4.
Environmental impacts of canola production in the studies region (Functional unit: 1 ha).
Total environmental emissions weighted score was estimated to be 2488.7 pPt ha−1. Additionally, marine aquatic ecotoxicity, eutrophication, and acidification were estimated to be 1502.0, 235.9, and 202.6 pPt ha−1, respectively.
3.2. ANFIS Modeling
To identify the best combination of input variables in sub-network models, the ANFIS program written in MATLAB was run several times. The results showed that a combination of input variables did not affect the results of the predicted model, even though different combinations of input variables were used. The same was true for the prediction of the three indices mentioned above. The triangular membership function was considered for this analysis.
The results of the three-stage ANFIS modeling are listed in Table 5. The findings are a representation of the model configuration and error analysis. Output energy was considered an exogenous parameter and showed R2 values that correlated the predicted output energy by a coefficient of determination of 0.90. These results indicate that a three-stage ANFIS technique can be used to precisely predict energy output. The CVRMSE in the final stage was 9%, and the estimated NMBE for the final ANFIS model was found to be 0.7% overestimating. Using the B/C ratio modeling by the three-stage ANFIS, it can be noted that the R2 value for both the observed and predicted B/C ratio was 0.87. It is also glaring that the RMSE in the third level decreased to 0.15. Additionally, the CVRMSE percent for the final ANFIS model decreased to 9% and the NMBE was estimated to be 0.34% underestimating. To model a final score of environmental emissions, the results revealed that the coefficient of determination for observed and predicted values was found to be 0.92, an indication that environmental emissions can be accurately predicted using the three-level ANFIS. The results for error analysis also indicated that the three-stage ANFIS method is capable of closely predicting the final score of environmental emissions from canola production.
Table 5.
Results of the three-level ANFIS for modeling energy, economic, and environmental indices of canola production.
The results obtained further strengthened our confidence in the three-stage ANFIS model, which was able to provide a precise estimation of the output parameters on the basis of the energy inputs. The correlation coefficient and RMSE for the final ANFIS model were found to be 0.99 and 0.03, respectively.
3.3. Multi-Objective Optimization
The best combinations of energy requirements from different inputs for 30 individual inefficient farmers obtained by application of ANFIS–MOGA are presented in Table 6. Using this information, it is possible to advise a farmer on how to improve operating practices by following target energy requirements from different inputs in order to maximize output energy and the B/C ratio, and to minimize environmental emissions from production. This gives the average energy usage in optimal conditions (MJ ha−1), the total input and output energy, as well as the energy ratio and B/C ratio, including the final score of the environmental emissions from production. Therefore, the dissemination of these results can offer information that can facilitate better farm management practices and help improve the performance of farmers for canola production. As evident in Table 6, although the total energy input varied from 8151 to 19,853 MJ ha−1, the output energy ranged from 46,193 to 75,251 MJ ha−1 and the B/C ratio ranged from 1.95 to 5.44. In addition, the final scores of the environmental emissions from the canola production process were estimated to be in the range of 334 to 3184 pPt ha−1.
Table 6.
Neuro-fuzzy-genetic results of the optimization of the energy, economic, and environmental life cycle assessments for canola production.
The results of the multi-objective optimization of the parameters under study (energy, economic, and environmental indices) are presented in Table 7. Energy consumption by nitrogen fertilizer and diesel fuel, the major energy consumption inputs in the current situation, decreased by 9.9% and 2.4%, respectively, whereas an increase of 7.4% was recorded for machinery energy. A simultaneous increase in machinery use and decrease in diesel fuel consumption can happen by applying better machinery management; therefore, proper matching of the tractor and the efficient operation of farm tractors are necessary for optimum agricultural production conditions (e.g., maximizing the fuel efficiency and tractive efficiency, applying “gear-up, throttle-down” practices, and selecting an optimum travel speed [42]). In addition, the use of labor and agrochemicals in the optimum situation increased by 21.1% and 17%, respectively. These inputs are usually applied in weeding operations. Manure application showed an increase from 298 to 112 MJ ha−1. The results of the ANFIS–MOGA application revealed that when total energy input increases by 1.7%, the total output energy increases by about 6.2%, and consequently the energy ratio increases by 8.7%. On the other hand, the B/C ratio increases from 1.60 to 3.90, and the final score for environmental emissions decreases by 19.8%, should the farmers adhere to the recommendations of this assessment. Hematian et al. [10] studied the optimization of energy consumption for sugar beet production by applying GA. They reported an optimum situation of a 22% reduction in the total energy requirement for sugar beet production.
Table 7.
Results of the multi-objective optimization of energy, economic, and environmental indices using the ANFIS–MOGA approach.
3.4. Optimization through DEA Approach
The DEA approach was undertaken in order to determine farm efficiency from the energy, economic, and environmental perspectives. The results for efficiency estimation, presented in Table 8, show that the average technical efficiency varied from 0.64 to 1, with an average value of 0.91 and standard deviation of 0.1. This implies that if the farmers operate efficiently from a technical and scale point of view, an average of 9% energy inputs could be saved without any alterations in output parameters related to energy, economic, or environmental emissions.
Table 8.
Efficiency scores of canola farms by applying the data envelopment analysis (DEA) approach.
The mean pure technical efficiency of farms was found to be 0.95, an indication that about 5% of energy inputs could be saved through efficient technical farm operations. Scale efficiency was calculated as 0.96, a value that corresponds to a total energy input savings of 4% at constant output parameters, should the farmers operate at an optimum scale. In a previous study [43] the technical, pure technical, and scale efficiencies of horticultural crop production enterprises were reported as 0.75, 0.80, and 0.94 for tomato production and 0.81, 0.89, and 0.91 for asparagus production, respectively.
The optimum energy requirements and the energy savings of the various input parameters based on the results of the pure technical efficiency estimation are given in Table 9. Under optimum conditions, nitrogen fertilizer and diesel fuel energy decreased by 7% and 12%, which corresponds to input parameters to the values of 6665 and 4589 MJ ha−1, respectively. In addition, labor and machinery energy requirements were estimated as 117 and 1007 MJ ha−1, respectively. In view of this, the parameters with the highest inefficient use of energy in the canola production system included labor, machinery, diesel fuel, and agrochemicals. Under optimum production conditions, the total energy input decreased by 9%, corresponding to 13,838 MJ ha−1, and output energy decreased by 8%, an amount that corresponds to 52,380 MJ ha−1 of energy. Similarly, the B/C ratio and total environmental emissions decreased by 18% and 5%, respectively. Chauhan et al. [44] alluded that a total energy input of 1093.8 MJ ha−1 (11.6%) could be saved from the production of paddy. Similar results on total energy saving were also reported for wheat production, with about 9.8% and 7.1% savings, respectively [45].
Table 9.
Results of the optimization of energy, economic, and environmental indices using the DEA approach.
In summary, the results of the DEA showed that there was a decrease in the inefficient use of energy input and output, as well as in the B/C ratio and the total environmental emissions of the canola production process. With regard to the ANFIS–MOGA model, the results indicated that optimum production conditions were achieved under different circumstances of the same parameters with only the final score of the environmental emissions reported to have decreased. The results of the comparison between the two methods indicated that the ANFIS–MOGA method is more advantageous in finding the practical and reasonable optimum solutions for the combination of mixing energy, economic, and environmental aspects of farming systems. Hence, the method is considered useful for modeling and optimizing agricultural production systems from an energy, economic, and environmental point of view.
4. Conclusions
This study proposed a combined method of ANFIS and MOGA for the modeling and prediction of energy, economic, and environmental emissions from the agricultural production of canola in the Mazandaran province of Iran. The potential application of this combined system for optimizing agricultural inputs in the production process of canola was investigated using data obtained from farm visits and face-to-face interviews of the canola producers. The multi-stage ANFIS system was used to predict output parameters from energy inputs to establish the optimum inputs necessary for canola production. Consequently, a MOGA approach was applied to determine the best combination of output energy, B/C ratio, and total environmental emissions. The modeling results indicated that a three-stage ANFIS structure comprising four ANFIS models in the first stage, two ANFIS models in the second stage, and one final model in the third stage had the best performance for the prediction, showing R2 values of 0.90, 0.87, and 0.92 for the prediction of output energy, B/C ratio, and environmental emissions final scores, respectively.
The results of the MOGA application showed that optimum production condition is achieved when the total energy input increases by 1.7%, total output energy increases by 6.2%, and consequently the energy ratio increases by 8.7%. Conversely, the B/C ratio equally increases from 1.60 to 3.90 and the final score of environmental emissions decreases by 19.8%, should the farmers, as previously stated, follow the recommendations of this study.
A comparison of the results of the ANFIS–MOGA method to those of the DEA revealed that the former has superior performance because of its ability to find the practical and reasonably optimum solutions for the combination of mixing energy, economic, and environmental aspects. In light of this conclusion, it is therefore suggested that the ANFIS–MOGA method can be used for the modeling and optimization of performance parameters in agricultural production systems. It can also be extended to the system-level evaluation of other agricultural, food, and biobased products from energy, economic, and environmental perspectives and different geographic regions.
Some of the limitations of this work include collection of data from different geographic locations, and evaluation of model performance in real agricultural enterprises.
Author Contributions
Conceptualization, S.H.M.-A. and S.R.; methodology, S.H.M.-A.; software, S.H.M.-A.; validation, S.H.M.-A. and S.R.; formal analysis, S.H.M.-A.; investigation, S.H.M.-A.; resources, S.H.M.-A.; data curation, S.H.M.-A.; writing—original draft preparation, S.H.M.-A.; writing—review and editing, S.H.M.-A. and A.M.; visualization, S.H.M.-A. and A.M.; supervision, S.R. All authors have read and agreed to the published version of the manuscript.
Funding
This research received no external funding.
Institutional Review Board Statement
Not applicable.
Informed Consent Statement
Not applicable.
Data Availability Statement
The data presented in this study are available on request from the corresponding author.
Conflicts of Interest
The authors declare no conflict of interest.
References
- IPCC. 2006 IPCC Guidelines for National Greenhouse Gas Inventories; Cambridge University Press: Cambridge, UK, 2006. [Google Scholar]
- Kulak, M.; Nemecek, T.; Frossard, E.; Chable, V.; Gaillard, G. Life cycle assessment of bread from several alternative food networks in Europe. J. Clean. Prod. 2015, 90, 104–113. [Google Scholar] [CrossRef]
- Iribarren, D.; Vázquez-Rowe, I.; Moreira, M.T.; Feijoo, G. Further potentials in the joint implementation of life cycle assessment and data envelopment analysis. Sci. Total Environ. 2010, 408, 5265–5272. [Google Scholar] [CrossRef] [PubMed]
- Mohammadi, A.; Cowie, A.; Mai, T.L.A.; Brandão, M.; De La Rosa, R.A.; Kristiansen, P.; Joseph, S. Climate-change and health effects of using rice husk for biochar-compost: Comparing three pyrolysis systems. J. Clean. Prod. 2017, 162, 260–272. [Google Scholar] [CrossRef]
- Schmidt, J.H. Life cycle assessment of five vegetable oils. J. Clean. Prod. 2015, 87, 130–138. [Google Scholar] [CrossRef]
- De Gennaro, B.; Notarnicola, B.; Roselli, L.; Tassielli, G. Innovative olive-growing models: An environmental and economic assessment. J. Clean. Prod. 2012, 28, 70–80. [Google Scholar] [CrossRef]
- Mohammadi, A.; Cowie, A.L.; Cacho, O.; Kristiansen, P.; Mai, T.L.A.; Joseph, S. Biochar addition in rice farming systems: Economic and energy benefits. Energy 2017, 140, 415–425. [Google Scholar] [CrossRef]
- Notarnicola, B.; Hayashi, K.; Curran, M.A.; Huisingh, D. Progress in working towards a more sustainable agri-food industry. J. Clean. Prod. 2012, 28, 1–8. [Google Scholar] [CrossRef]
- Ghasemi-Mobtaker, H.; Keyhani, A.; Mohammadi, A.; Rafiee, S.; Akram, A. Sensitivity analysis of energy inputs for barley production in Hamedan Province of Iran. Agric. Ecosyst. Environ. 2010, 137, 367–372. [Google Scholar] [CrossRef]
- Hematian, A.; Bakhtiari, A.A.; Yaghubi, O.; Zarei-Shahamat, E. Optimization of Energy Consumption in Sugar-Beet Production Using Genetic Algorithm “A Case study in Kermanshah Province, Iran”. Int. J. Agron. Plant Prod. 2013, 4, 1351–1356. [Google Scholar]
- Sefeedpari, P.; Rafiee, S.; Akram, A.; Mousavi-Avval, S.H. Application of Fuzzy Data Envelopment Analysis for Ranking Dairy Farms in the View of Energy Efficiency. J. Anim. Prod. Adv. 2012, 2, 284–296. [Google Scholar]
- Jang, J.-S.R. ANFIS: Adaptive-network-based fuzzy inference system. IEEE Trans. Syst. Man Cybern. 1993, 23, 665–685. [Google Scholar] [CrossRef]
- Buragohain, M.; Mahanta, C. A novel approach for ANFIS modelling based on full factorial design. Appl. Soft Comput. 2008, 8, 609–625. [Google Scholar] [CrossRef]
- Arkhipov, M.; Krueger, E.; Kurtener, D. Evaluation of Ecological Conditions Using Bioindicators: Application of Fuzzy Modeling, Computational Science and Its Applications. In Computational Science and Its Applications–ICCSA 2008; Gervasi, O., Murgante, B., Laganà, A., Taniar, D., Mun, Y., Gavrilova, M.L., Eds.; Springer: Berlin, Heidelberg, 2008; pp. 491–500. [Google Scholar]
- Naderloo, L.; Alimardani, R.; Omid, M.; Sarmadian, F.; Javadikia, P.; Torabi, M.Y.; Alimardani, F. Application of ANFIS to predict crop yield based on different energy inputs. Measurement 2012, 45, 1406–1413. [Google Scholar] [CrossRef]
- Khoshnevisan, B.; Rafiee, S.; Omid, M.; Mousazadeh, H. Prediction of potato yield based on energy inputs using multi-layer adaptive neuro-fuzzy inference system. Measurement 2014, 47, 521–530. [Google Scholar] [CrossRef]
- Abhishek, K.; Datta, S.; Mahapatra, S.S. Multi-objective optimization in drilling of CFRP (polyester) composites: Application of a fuzzy embedded harmony search (HS) algorithm. Measurement 2016, 77, 222–239. [Google Scholar] [CrossRef]
- Momeni, E.; Nazir, R.; Armaghani, D.J.; Maizir, H. Prediction of pile bearing capacity using a hybrid genetic algorithm-based ANN. Measurement 2014, 57, 122–131. [Google Scholar] [CrossRef]
- Khoshnevisan, B.; Bolandnazar, E.; Band, S.S.; Shariati, H.M.; Anuar, N.B.; Kiah, M.L.M. Decreasing environmental impacts of cropping systems using life cycle assessment (LCA) and multi-objective genetic algorithm. J. Clean. Prod. 2015, 86, 67–77. [Google Scholar] [CrossRef]
- Cellura, M.; Longo, S.; Marsala, G.; Mistretta, M.; Pucci, M. The Use of Genetic Algorithms to Solve the Allocation Problems in the Life Cycle Inventory. In Assessment and Simulation Tools for Sustainable Energy Systems; Cavallaro, F., Ed.; Green Energy and Technology, vol 129; Springer: London, UK, 2013; pp. 267–284. [Google Scholar]
- Chan, K.; Kwong, C.K.; Tsim, Y. Modelling and optimization of fluid dispensing for electronic packaging using neural fuzzy networks and genetic algorithms. Eng. Appl. Artif. Intell. 2010, 23, 18–26. [Google Scholar] [CrossRef]
- Mousavi-Avval, S.H.; Rafiee, S.; Jafari, A.; Mohammadi, A. Improving energy use efficiency of canola production using data envelopment analysis (DEA) approach. Energy 2011, 36, 2765–2772. [Google Scholar] [CrossRef]
- Rafiee, S.; Mousavi-Avval, S.H.; Mohammadi, A. Modeling and sensitivity analysis of energy inputs for apple production in Iran. Energy 2010, 35, 3301–3306. [Google Scholar] [CrossRef]
- Mohammadi, A.; Rafiee, S.; Jafari, A.; Keyhani, A.; Mousavi-Avval, S.H.; Nonhebel, S. Energy use efficiency and greenhouse gas emissions of farming systems in north Iran. Renew. Sustain. Energy Rev. 2014, 30, 724–733. [Google Scholar] [CrossRef]
- Zentner, R.P.; Basnyat, P.; Brandt, S.; Thomas, A.; Ulrich, D.; Campbell, C.A.; Nagy, C.; Frick, B.; Lemke, R.; Malhi, S.; et al. Effects of input management and crop diversity on non-renewable energy use efficiency of cropping systems in the Canadian Prairie. Eur. J. Agron. 2011, 34, 113–123. [Google Scholar] [CrossRef]
- Alluvione, F.; Moretti, B.; Sacco, D.; Grignani, C. EUE (energy use efficiency) of cropping systems for a sustainable agriculture. Energy 2011, 36, 4468–4481. [Google Scholar] [CrossRef]
- ISO (International Organization for Standardization). ISO 14040: Environmental Management. Life Cycle Assessment. Principles and Framework; ISO: Geneva, Switzerland, 2006. [Google Scholar]
- Nemecek, T.; Kägi, T. Life Cycle Inventories of Swiss and European Agricultural Production Systems. Final Report Ecoinvent V2. 0 No 15a. Available online: https://www.researchgate.net/publication/263239333_Life_Cycle_Inventories_of_Agricultural_Production_Systems/citation/download (accessed on 18 December 2020).
- Prasuhn, V.; Grünig, K. Evaluation der Ökomassnahmen-Phosphorbelastung der Oberflächengewässer Durch Bodenerosion; Eidgenössische Forschungsanstalt für Agrarökologie und Landbau: Zürich, Switzerland, 2001; 152p. [Google Scholar]
- Bolandnazar, E.; Keyhani, A.; Omid, M. Determination of efficient and inefficient greenhouse cucumber producers using Data Envelopment Analysis approach, a case study: Jiroft city in Iran. J. Clean. Prod. 2014, 79, 108–115. [Google Scholar] [CrossRef]
- Nguyen, T.L.T.; Hermansen, J.E. System expansion for handling co-products in LCA of sugar cane bio-energy systems: GHG consequences of using molasses for ethanol production. Appl. Energy 2012, 89, 254–261. [Google Scholar] [CrossRef]
- Pre-Consultants, SimaPro 8.0.2. Available online: http://www.pre-sustainability.com/simapro (accessed on 18 December 2020).
- Zanaganeh, M.; Mousavi, S.J.; Etemad-Shahidi, A. A hybrid genetic algorithm–adaptive network-based fuzzy inference system in prediction of wave parameters. Eng. Appl. Artif. Intell. 2009, 22, 1194–1202. [Google Scholar] [CrossRef]
- Takagi, T.; Sugeno, M. Derivation of Fuzzy Control Rules from Human Operator’s Control Actions. In Proceedings of the IFAC Symposium on Fuzzy Information, Knowledge Representation and Decision Analysis, Marseille, France, 19–21 July 1983; pp. 55–60. [Google Scholar]
- Deb, K.; Pratap, A.; Agarwal, S.; Meyarivan, T. A fast and elitist multiobjective genetic algorithm: NSGA-II. IEEE Trans. Evol. Comput. 2012, 6, 182–197. [Google Scholar] [CrossRef]
- Segal, E.M.; Rhode-Barbarigos, L.; Adriaenssens, S.; Coelho, R.D.F. Multi-objective optimization of polyester-rope and steel-rope suspended footbridges. Eng. Struct. 2015, 99, 559–567. [Google Scholar] [CrossRef]
- Mousavi-Avval, S.H.; Rafiee, S.; Jafari, A.; Mohammadi, A. Improving energy productivity of sunflower production using data envelopment analysis (DEA) approach. J. Sci. Food Agric. 2011, 91, 1885–1892. [Google Scholar] [CrossRef]
- CML. CML—IA (Version 4.2); Institut of Environmental Sciences, Leiden University: Leiden, The Netherlands, 2013. [Google Scholar]
- Iriarte, A.; Rieradevall, J.; Gabarrell, X. Life cycle assessment of sunflower and rapeseed as energy crops under Chilean conditions. J. Clean. Prod. 2010, 18, 336–345. [Google Scholar] [CrossRef]
- Bernesson, S.; Nilsson, D.; Hansson, P.-A. A limited LCA comparing large- and small-scale production of rape methyl ester (RME) under Swedish conditions. Biomass Bioenergy 2004, 26, 545–559. [Google Scholar] [CrossRef]
- Stephenson, A.; Dennis, J.; Scott, S. Improving the sustainability of the production of biodiesel from oilseed rape in the UK. Process. Saf. Environ. Prot. 2008, 86, 427–440. [Google Scholar] [CrossRef]
- Grisso, R.D.; Kocher, M.F.; Vaughan, D.H. Predicting Tractor Fuel Consumption. Appl. Eng. Agric. 2004, 20, 553–561. [Google Scholar] [CrossRef]
- Iráizoz, B.; Rapún, M.; Zabaleta, I. Assessing the technical efficiency of horticultural production in Navarra, Spain. Agric. Syst. 2003, 78, 387–403. [Google Scholar] [CrossRef]
- Chauhan, N.S.; Mohapatra, P.K.; Pandey, K.P. Improving energy productivity in paddy production through benchmarking—An application of data envelopment analysis. Energy Convers. Manag. 2006, 47, 1063–1085. [Google Scholar] [CrossRef]
- Singh, G.; Singh, S.; Singh, J. Optimization of energy inputs for wheat crop in Punjab. Energy Convers. Manag. 2004, 45, 453–465. [Google Scholar] [CrossRef]


Publisher’s Note: MDPI stays neutral with regard to jurisdictional claims in published maps and institutional affiliations. |
© 2020 by the authors. Licensee MDPI, Basel, Switzerland. This article is an open access article distributed under the terms and conditions of the Creative Commons Attribution (CC BY) license (http://creativecommons.org/licenses/by/4.0/).