Article

Feeding Models to Optimize Dairy Feed Rations in View of Feed Availability, Feed Prices and Milk Production Scenarios

1
Animal and Veterinary Sciences Department, College of Agricultural & Marine Sciences, Sultan Qaboos University, Muscat 123, Oman
2
Animal Husbandry in the Tropics and Subtropics, University of Kassel and Georg-August Universität Göttingen, Steinstr. 19, 37213 Witzenhausen, Germany
*
Author to whom correspondence should be addressed.
Sustainability 2021, 13(1), 215; https://doi.org/10.3390/su13010215
Submission received: 30 October 2020 / Revised: 1 December 2020 / Accepted: 5 December 2020 / Published: 4 January 2021
(This article belongs to the Special Issue Farming 4.0: Towards Sustainable Agriculture)

Abstract

:
In the global dairy production sector, feed ingredient price and availability are highly volatile; they may shape the composition of the feed ration and, in consequence, impact feed cost and enteric methane (CH4) emissions. The objective of this study is to explore the impact of changes in feed ingredients’ prices and feed ingredients’ availability on dairy ration composition, feed cost and predicted methane yield under different levels of milk production. To meet the research aim, a series of multi-period linear programming models were developed. The models were then used to simulate 14 feed rations formulations, each covering 162 months and three dairy production levels of 10, 25 and 35 kg milk/d, representing a total of 6804 feed rations altogether. Across milk production levels, the inclusion of alfalfa hay into the feed rations declined from 55% to 38% when daily milk production increased from 10 to 35 kg, reflecting the cows’ increased energy requirements. At a daily milk production level of 35 kg, CH4 production (per kg milk) was 21% and 53% lower than in average and low milk producing cows, respectively, whereas at 10 kg of milk production the potential to reduce CH4 production varied between 0.6% and 5.5% (average = 3.9%). At all production levels, a reduction in CH4 output was associated with an increase in feed costs. Overall, and considering feeding scenarios in low milk producing cows, feed cost per kg milk was 30% and 37% higher compared to that of average and high milk production, respectively. The feed ration modeling approach allows us to account for the interaction between feed ingredients over time, taking into consideration volatile global feed prices. Overall, the model provides a decision-making tool to improve the use of feed resources in the dairy sector.

1. Introduction

Global dairy production is expected to increase by 35% in the coming decade [1]. Such growth requires judicious allocation of resources in terms of land, water, animals and feed, in order to enhance the operation’s environmental as well as economic sustainability. Dairy feeding systems vary widely depending on geographical location, utilized breeds, production level and the availability of feed resources [2]. These variations may also reflect variations in feed costs, milk production costs and the emission of greenhouse gasses (GHG), notably enteric methane (CH4) [3,4]. Furthermore, in the global dairy production sector, feed ingredient price and availability are highly volatile; they may shape the composition of the feed ration and, in consequence, enteric CH4 emissions per animal and per kg of milk. A feed commodity switch that responds to changing feed prices may induce changes to the overall feed costs and CH4 yield. Alqaisi et al. (2019) [5] evaluated dairy feeding scenarios under alternative feed availabilities and relative prices. In that study, only one level of milk production was considered for feed formulation, in order to explain monthly variations in ration composition and feed costs. The current work provides further analyses and considers varying levels of milk production, since this typically varies between herds, between lactations and within the lactation period. These variables need to be accounted for in feed formulation, since they are affecting feed costs and CH4 emissions in dairy production. In dairy production, feed is the most expensive component, typically representing 50–70% of total milk production costs [2,6]. Yet, the actual share of feed costs in the total milk production costs is highly dependent on feeding systems, which vary widely worldwide [2]. Feed costs are driven by the availability of feeds, feed input prices and overall diet composition. Furthermore, dairy production level drives the feed cost per day or per kg of milk produced, since it reflects the animal’s efficiency. However, information about feed cost under different milk production levels and the associated CH4 emission is not thoroughly evaluated in the literature in relation to feed ingredients supply. Alqaisi et al. (2019) [5] demonstrated that CH4 emission is associated with the feeding system practiced (i.e., grain versus meal feeding). Using available historical market feed prices for feed formulation could be instrumental in providing estimates on feed ration composition, overall feed costs and the resulting CH4 emissions under scenarios of changing feed availability (e.g., availability of corn and absence of wheat or barley) and dairy production levels.
Wilkinson and Garnsworthy (2017) [7] reported that the environmental impact of feed use by dairy cows may be reduced via diet formulation but depends on the availability of raw materials for concentrate feeds and level of milk output. In feed formulation, linear programming (LP) has been widely used to formulate least cost rations for livestock feed requirements. However, the issues of commodity prices and dietary dynamics over time, and their relationship with feed ration composition, feed cost change, CH4 emission and milk yield have not been comprehensively evaluated. In diet formulation, decisions need to be made frequently (daily, weekly or monthly). Therefore, the traditional LP approach needs to incorporate changing feed prices, milk production levels and time variables to adequately depict necessary changes in rations that reduce costs and perhaps CH4 emissions. From an economic point of view, dairy farmers might be more interested in feed cost reduction than CH4 emission mitigation. Historically, milk production cost was lowered by increasing milk yield [8]. However, reducing CH4 emissions has not been thoroughly evaluated in relation to feed ingredient supply, which might become a challenging issue in the future due to the disruption in ingredients production. Since increasing milk yield is associated with improving feed efficiency, increasing milk production per cow has been reported to reduce CH4 emissions per kg of milk [3,9]. With fluctuating feed commodity prices, multi-period LP modeling could be used to recommend dietary switching from one feed commodity to the other (i.e., switch from corn to wheat, or from soybean meal (SBM) to distiller’s dried grains with solubles (DDGS)) [5]. The authors concluded that the magnitude of the feed commodity switch is price-dependent. Accordingly, this approach can explore dietary options that result in varying CH4 emissions and may provide further options for lowering feed costs and CH4 production under limited feed resource availability. Since we propose a feeding model that captures market price changes, diet composition might change accordingly, and therefore CH4 emissions might change subject to the monthly dietary change instances. In this context, we hypothesize that the feed ingredients’ inclusion rates are correlated with feed prices and determine feed cost as well as the CH4 emissions of cows, whose effects depend on the level of milk production. Therefore, evaluating potential changes in feeding systems, feed cost and CH4 emissions requires a periodic (multi-period) tool that mimics the feed trading and feed production process in response to feed ingredients’ availability. In consequence, the objectives of this study are to (1) develop multi-period LP feed models for dairy cows with three levels of milk production, (2) demonstrate the potential use of the method in different commodity feed availability situations (feeding scenarios), (3) illustrate the impact of a feed commodity switch on the vulnerability of feeding systems and on CH4 emissions, and (4) explore the relationships between feed cost, feed commodity switch and the predicted CH4 emissions.

2. Materials and Methods

Diet formulation is a continuous process based on daily, weekly and monthly trends. In the current study, we use global monthly feed commodity prices dependent on their availability. We hypothesize that changes in feed ration formulation, which are feed-price-dependent in an LP formulation, are correlated with the costs of individual feeds and affect enteric CH4 emissions. The formulation considers three levels of milk production (10, 25 and 35 kg/d), representing a low, average and high milk production level. The three levels correspond to usual variations in milk production levels between dairy herds and during a lactation period, and they also represent distinctly different energy and nutrient requirements. These variables will lead to different diets and provide changes to feed costs and CH4 emissions. In addition to the grains and cereal meals that are used to supply energy and protein to fulfil the animals’ requirements, alfalfa hay was used as a fiber source for dairy cows; this choice is justified by its global importance in dairy cattle rations, and due to the availability of its market prices.

2.1. Multi-Period LP Model

The proposed approach is based on monthly analyses of the output of linear programming models. The objective of the multi-period LP models is to produce a feed blend at a minimum cost in different periods (defined here as a month) and for cows varying in their production, either between individuals, or within the lactation period of one individual. The model selects the optimal proportion of feed ingredients to produce the least costly diet given feed nutritional composition, animal nutritional requirements and feed prices. Consequently, least feed costs are compared to commodity use alternatives (i.e., corn versus wheat) and enteric CH4 emissions that result from the LP formulation.
To determine the time (defined by the month) when a feed ration adjustment is required, and the proportion of an alternative feed commodity to be included into the new feed ration, a multi-period LP model was developed for dairy cow feeding for 14 case scenarios representing the potential feed commodity availability in a region provided by international trade. These feeding scenarios allow for an evaluation of simulated diets and their vulnerability to changes in feed availability options and feed price volatility. The first six scenarios (S1 to S6) were based on grains, and one meal source typically used to formulate rations, while the remaining eight scenarios included additional options for agricultural by-products (meals).
Unlike static LP models, the multi-period LP model developed in this study minimizes a sequence of objective functions and provides time series relationships between decision variables and constraints via optimized solutions. The resulting relationships are estimated using the open source R programming software version 3.5 [10]. The model provides, but is not limited to, a sequence of results from multiple periods by retrieving values from a sequence of successfully solved single-period LP models. The results produced by this model allow the decision-maker to investigate the relationships between objective function values, values of the decision variables, values of the constraints, dual variables (the reduced costs) and the sensitivity of the objective function. In many respects, the model serves to provide an efficient sensitivity analysis of the optimal feed mix under alternative input prices and animal nutritional requirements.

2.2. Model Structure

The general structure of the multi-period LP is described for each milk production level as follows:
f o r   t = 1 ,   ,   162
min T C i =   i = 1 n c i t x i t
s u b j e c t   t o
a i j t x i t   b j t     j   J
x i t   0
where TCt is the total cost of the feed ration in period t (month), cit is the per-unit cost of feed ingredient i at period t and xit is the quantity of feed ingredient i in the feed ration in period t. J is the set of nutrients that must be considered in the feed ration, with j being one of the nutrients of the set of J, aijt the quantity of nutrient j in feed ingredient i in period t and bjt the required amount of each nutrient j in the feed ration in period t.
The sign of the relationship for each of the nutrients depends on the particular nutrient and the nutrient balance that must exist in the ration. It is important to note that our model assumes that the nutrient composition of feed ingredients is the same across periods, whereas the nutrient requirements for the model cow changes per production level. The general structure of the model for one particular scenario is shown in Table 1.
Each table is divided into two parts: The upper part includes multi-period price data of the objective function, namely the monthly feed ingredient/commodity prices, while the lower part of the table consists of information relevant to the feed ration composition and the model’s right and left hand side constraints (RHS, LHS) and boundaries for three levels of daily milk production (10, 25 and 35 kg). The monthly feed commodity prices are saved in an external text format file and linked to the LP model in the R console with functions to iterate the optimization for each individual monthly set of prices subject to the model parameters. Monthly feed prices were collected from the World Bank (2018) [11], Ca-soap (Nurisol) prices were provided by Heinrich Nagel KG, Germany, the US average monthly alfalfa hay prices were obtained from (https://hayandforage.com) [12] and DDGS prices were obtained from USDA (2018) [13]. Figure 1 shows the historical feed ingredient prices used in our study.
The minimization of the objective function in each period is subject to a set of constraints. These are the standard feed requirement variables for each milk production level, which are composed of the weight of total formulated feed ration in kg or percentage dry matter (DM), metabolizable energy (ME) in Megajoules (MJ), the dietary Crude Protein (CP) in gram per kg of DM, Undegradable Crude Protein (UCP) in gram per kg of DM, Neutral Detergent Fiber (NDF) in percentage, physically effective NDF (peNDF) in percentage, fat content in percentage, non-fiber carbohydrate (NFC) in percentage, Calcium (Ca) and Phosphorus (P) in gram per kg of DM. Furthermore, upper boundaries were set to the model for the feed inclusion rate in the case of DDGS and RSM feeding. Ultimately, the optimized feed ration results are given in dry matter percentages. The nutritional requirements for the three standard model cows and feed composition data were taken from the NRC (2001) [14]. The peNDF content was calculated according to Mertens (1997) [15]. In particular, all “model cows” are standard cows with daily milk production of 10, 25 and 35 kg, milk fat of 3.5%, milk protein of 3%, and gaining between 500 g and 300 g of live weight (including gravity products) per day.
The corresponding estimated DM feed intake is 12.4 kg per day for the low milk producing cow (10 kg/d), 20.3 kg for the average milk producing cow (25 kg/d) and 23.6 kg per day for the high milk producing cow (35 kg/d). Therefore, feed efficiency expressed as kg of milk per kg of DM intake estimates would be 0.8, 1.23 and 1.5 for the low, average and high milk producing cow, respectively. The ME concentrations were set to 8 MJ, 10 MJ and 11 MJ per kg of DM of the formulated ration and CP concentrations were set to 119 g, 141 g and 152 g per kg of DM of the formulated ration for the low, average and high yielding cow, respectively [14]. UCP dietary content was set to 22 g, 49 g and 55 g per kg of DM of the formulated ration for the low, average and high producing cow, respectively. The nutrient requirements and feed composition of the “model cows” are listed in Table 1. Figure 2 illustrates the multi-period LP model inputs and outputs for 14 dairy feeding scenarios and for three levels of milk production.
The modeling approach considers the variations in milk production level within a herd or between herds, which is expected to induce changes to the feed ration subject to market feed prices. However, milk production fluctuation due to seasonal differences between regions was not captured in the current analysis due to the added complexity of including it in the same feeding model. The non-zero, non-negative constraint directions were assumed in equality and non-equality forms.
The major objective of this study was to develop a decision-making tool with an economic perspective. Yet, for each scenario and each month, the analysis also provides results for the enteric methane yield (CH4) that would be potentially emitted by each of the model cows consuming the designed feed ration. The amount of CH4 was predicted using the equation: CH4 (MJ/d) = 3.41 + 0.520 × DMI (kg/d) − 0.996 × ADF (kg/d) + 1.15 × NDF (kg/d) ([16], Equation 10c) and was converted to g CH4/kg milk, where DMI is the intake of dry matter, and acid detergent fiber (ADF) and NDF are the daily intakes of these components expressed in kg. The daily intakes of ADF and NDF were estimated by multiplying their corresponding monthly LHS computed values by DMI for each production level. The reason for using this methane yield estimation model is that it includes the dietary parameters that were computed in the current LP models, accounts for the variations in CH4 emissions caused by NDF and ADF values, and has a low prediction error (RMSPE% = 30.5) and a relatively high R2 of 0.67.
The multi-period approach to the LP model was implemented in R; the solution time per scenario varied depending on the instance being solved but was within the range of one-half to one second. The solutions of the LP model for each of the scenario-months give the optimal feed ingredient inclusion rate, in percentages, that minimizes the total formulated feed cost. In total, 6804 diets were formulated, representing 14 scenarios over a period of 162 months each and for three production levels (14 × 162 × 3) between January 2005 and May 2018. A total of 6804 objective functions (least formulated feed cost) and 68,040 constraints (RHS) were obtained from successfully solved LPs. Furthermore, a total of 50,679 decision variables were obtained. Data on upper and lower feed prices, the objective function and the dual variables (including the RHS duals and sensitivity results) were obtained but not presented in the current study due to their large size.

2.3. Statistical Analysis

The root mean square error (RMSE) was used to calculate the deviation of the multi-period LP formulated nutrients from the assigned model constraints using the formula:
R M S E = 1 N i = 1 N ( y i x i ) 2
where yi and xi are the LHS and RHS constraints of CP, UCP and ME. Accordingly, RMSE% was calculated using the following formula:
R M S E   % = 100   ×   N i = 1 N y i 1 N i = 1 N ( y i x i ) 2

2.4. Modeled Scenarios

Taking as a basis the model structure described herein, 14 simulation scenarios were defined. The scenarios represent a potential long-term feeding strategy on a farm and in a region, given that feeds are provided through trade or production activity. The scenarios therefore assume that some feed items, such as grains or by-products, might be continuously available in some regions at an affordable price, though they might be completely absent or very expensive in other regions. To our knowledge, such a multi-period LP model for long-term evaluation of trade and animal feed production has not yet been evaluated for its efficacy in this particular industry.

2.5. Scenario Definitions

The definition of scenarios and resulting analysis is based on the availability of feeds:
Scenario 1 (S1) assumes that wheat, barley and SBM commodities are used in ration formulation. The reasoning for using these feeds is to evaluate the feeding system’s vulnerability/switch when there is only a limited number of feeds available, and to examine if wheat and barley price spreads correlate with commodity inclusion rates. Scenario 2 (S2) assumes that wheat is not available and that only corn and barley grains are available in addition to SBM. The simulation elaborates on the vulnerability/switch of feeding systems for these commodities. Scenario 3 (S3) assumes that barley and sorghum are available, SBM is included, and there is no access to corn or wheat. Scenario 4 (S4) assumes that barley is not available and only wheat and corn grains are accessible. The scenario elaborates on the corn-wheat price spread and the associated effect on inclusion levels. Scenario 5 (S5) assumes that only corn and sorghum are available in the market. Scenario 6 (S6) assumes no limitations on grain availability for corn, wheat, sorghum and barley, and allows for the use of SBM. Scenario 7 (S7) includes the by-product DDGS as a protein and energy source in addition to SBM, with barley and corn grains available. The objective of the analysis in this scenario is to evaluate the degree to which DDGS inclusion will affect the inclusion rates of grains and meals over time. Scenario 8 (S8) includes the grain commodities of barley, corn and sorghum in addition to SBM and DDGS.
Scenario 9 (S9) includes the grain commodities of barley and corn, and assumes that canola meal is available as a protein source in addition to DDGS and SBM. Scenario 10 (S10) assumes that DDGS is not accessible or traded, while SBM and canola meal are available as protein feeds. Scenario 11 (S11) omits corn, which is replaced by sorghum, and allows for the inclusion of DDGS. Scenario 12 (S12) assumes the availability of dietary SBM, DDGS and corn. This scenario allows for the evaluation of the magnitude of corn use under the availability of DDGS and the magnitude of DDGS as a partial substitute for alfalfa hay. Scenario 13 (S13) assesses the use of canola meal under limited DDGS availability (limiting inclusion to a maximum level of 10%) and in the absence of barley. Scenario 14 (S14) assumes the availability of SBM, DDGS, canola meal, barley, wheat, corn and sorghum. In all simulated scenarios, alfalfa hay is included and assumed to be available as a forage source in addition to the bypass fat Ca-soap (a widely used energy-rich feed additive) and dicalcium phosphate (DCP; a source of Ca and P). This selective inclusion of additional feeds is interesting for feed producers and dairy farmers, since we hypothesize that alfalfa hay could be partly replaced when high fiber meals and grains are available for feeding or vice versa. The modeled scenarios are justified by the fact that not all feed commodities are available in each region or traded on a regular basis, reflecting the variety of dairy feeding systems prevailing in different regions. On the one hand, these commodities are globally available and extensively used, and on the other they are often satisfactory to formulate nutritional dairy feed rations for varying production levels.

3. Results and Discussion

3.1. Feed Rations Selection Across Scenarios and Dairy Production Levels

Table S1 (see the Supplementary tables) shows a summary of the composition of the formulated feed rations for a low, average and high yielding cow simulated between 2005 and 2018. In the grain-based scenarios (scenarios 1 to 6), formulated feed rations feature a maximization of alfalfa hay inclusion rate varying in average between 54% and 71% of total feed DM. Across milk production levels, the level of alfalfa hay inclusion declined with increasing daily milk production from 10 to 35 kg. For instance, in S4, alfalfa hay inclusion declined from 71% at the 10 kg to 50% at the 35 kg level. Since ME requirements increased with increasing milk yield, the grain inclusion rate increased in parallel. In grain-based scenarios, grain inclusion varied between scenarios and across production levels and was favoring barley grain inclusion at a range of 33% to 51%. Even when more grain feeding options were included in a feeding scenario, barley inclusion was the highest in comparison to corn, sorghum and wheat inclusions. When barley was omitted from the low yielding cow rations in S4, the feed ration featured an average increase in alfalfa hay of 14%, which reduced grain inclusion to 28% in the total DM of formulated feed rations. However, at a 35 kg production in S4, barley was replaced by corn and wheat. When all grains were included in S6, wheat was not selected for any productivity level, and sorghum was a more important dietary component than corn. Compared to S6, corn in S5 (which omitted barley) was more important and comprised a large proportion of the feed rations across production levels. Further, SBM was not included in any of the feeding scenarios at the 10 kg level, as the daily CP requirement could be fulfilled by grains and alfalfa hay. However, at 35 kg daily milk production, SBM inclusion increased and varied on average between 9% and 12%.
The low grain inclusion for the low yielding cow is driven by the low energy requirement of 8 MJ/kg DM, where a basic diet of barley and alfalfa hay could fulfill the requirements. Ca-soap was an important energy source at the high milk production level, but only in the grain-based feeding, with the inclusion rate varying between 1% and 2%. The dietary selection of Ca-soap was driven by the increasing ME demand of 11 MJ/kg of DM in the high milk producing cow. Overall, grain-based feeding maximized the inclusion of SBM and alfalfa hay compared to multiple meal feeding scenarios. In the meal-based scenarios (S7 to S14), the inclusion of DDGS and canola meal significantly reduced the alfalfa hay use compared to the grain-based scenarios. In average, alfalfa hay inclusion varied between 30% and 63% for the high and low yielding cows, respectively, whereas DDGS inclusion varied between 6% and 20% for high and low yielding cows, respectively. Moreover, in the meal-based scenarios, SBM was only important in the absence of DDGS and barley grain. Compared to grain-based scenarios, the availability of additional meal sources such as DDGS and canola did not affect grain inclusion significantly. Unlike in grain feeding scenarios in which SBM was not important for low producing cows’ rations, in the meal feeding scenarios DDGS was selected in all scenarios, except in S10, since canola meal was used in the formulation. The presence of additional meal sources minimized the inclusion of dietary SBM and alfalfa hay. In average, and taking all scenarios and production levels into account, dietary meal inclusion was 10% greater (i.e., 14% inclusion rate) in meal feeding scenarios than in grain feeding scenarios (i.e., 4% inclusion rate), while the alfalfa hay inclusion rate was 11% greater in the grain scenarios than in the meal scenarios (i.e., in average 52% versus 43% in the grain and meal feeding scenarios, respectively). Most of the dietary variations between grain and meal feeding scenarios were driven by the greater inclusion rate of alfalfa hay in the grain feeding scenarios. Therefore, meals are important feeding sources for partly replacing alfalfa hay. Table S2 (see the Supplementary tables) provides a summary of the dairy rations’ concentrations of CP, UCP and ME and the associated optimization errors (representing deviations from the RHS constraints) for all studied scenarios and milk production levels from the solved time series analyses. The model evaluation is based on the calculated root mean squared error (RMSE) in absolute and percentage terms. In relation to the multiple formulation data obtained from successfully solved LPs, the magnitude of the error in the proposed models was calculated. The major optimization errors are due to deviations in crude protein results imposed by the constraints on feed formulation requirements.
In feed ration formulation for low milk production, the average RMSE% for CP varied between 26% and 31% in grain- and meal-based diets, respectively (i.e., in average 41 versus 53 g CP excess/kg DM formulated feed in grain and meal based diets, respectively), which is significantly greater than that under average and high milk production. At 25 kg milk diet formulation, RMSE% for CP was lowest and ranged between 10% and 17% (i.e., 15 vs. 27 g CP excess/kg of DM in grain- and meal-based diets, respectively). At a milk production of 35 kg, RMSE% for CP did not vary between grain- and meal-based feeding scenarios, with CP excess being 32 g/kg of DM formulated feed. In meal feeding scenarios, the decision of including SBM in high yielding cows’ diet is subject to DDGS and barley availability. For instance, in the absence of barley in S12 and S13, SBM was included at different rates, in spite of DDGS being included in the formulation. Moreover, in grain feeding scenarios, SBM was included at maximum levels ranging between 9% and 10%, which can be compared with DDGS inclusion rates of 18% and 20% in meal feeding scenarios with fully available DDGS and barley. Furthermore, ME was limiting in high yielding cows’ diets, in particular in the grain feeding scenarios, which justified a greater inclusion of SBM, causing an excess in the formulated CP. This conclusion was supported by the inclusion of additional energy supplied by Ca-soap, which was greater in the grain feeding than in the meal feeding scenarios. However, RMSE% of ME was greatest in the 10 kg milk feed ration (i.e., ME excess varied between 2 and 3 MJ/kg of DM), while it was lowest in the 35 kg milk diet. In this regard, Alqaisi et al. (2019) [5] stated that the magnitude at which the CP formulation error could be minimized depends on the level of competitiveness between meal feeds, which is not only quality-dependent, but also price-dependent.

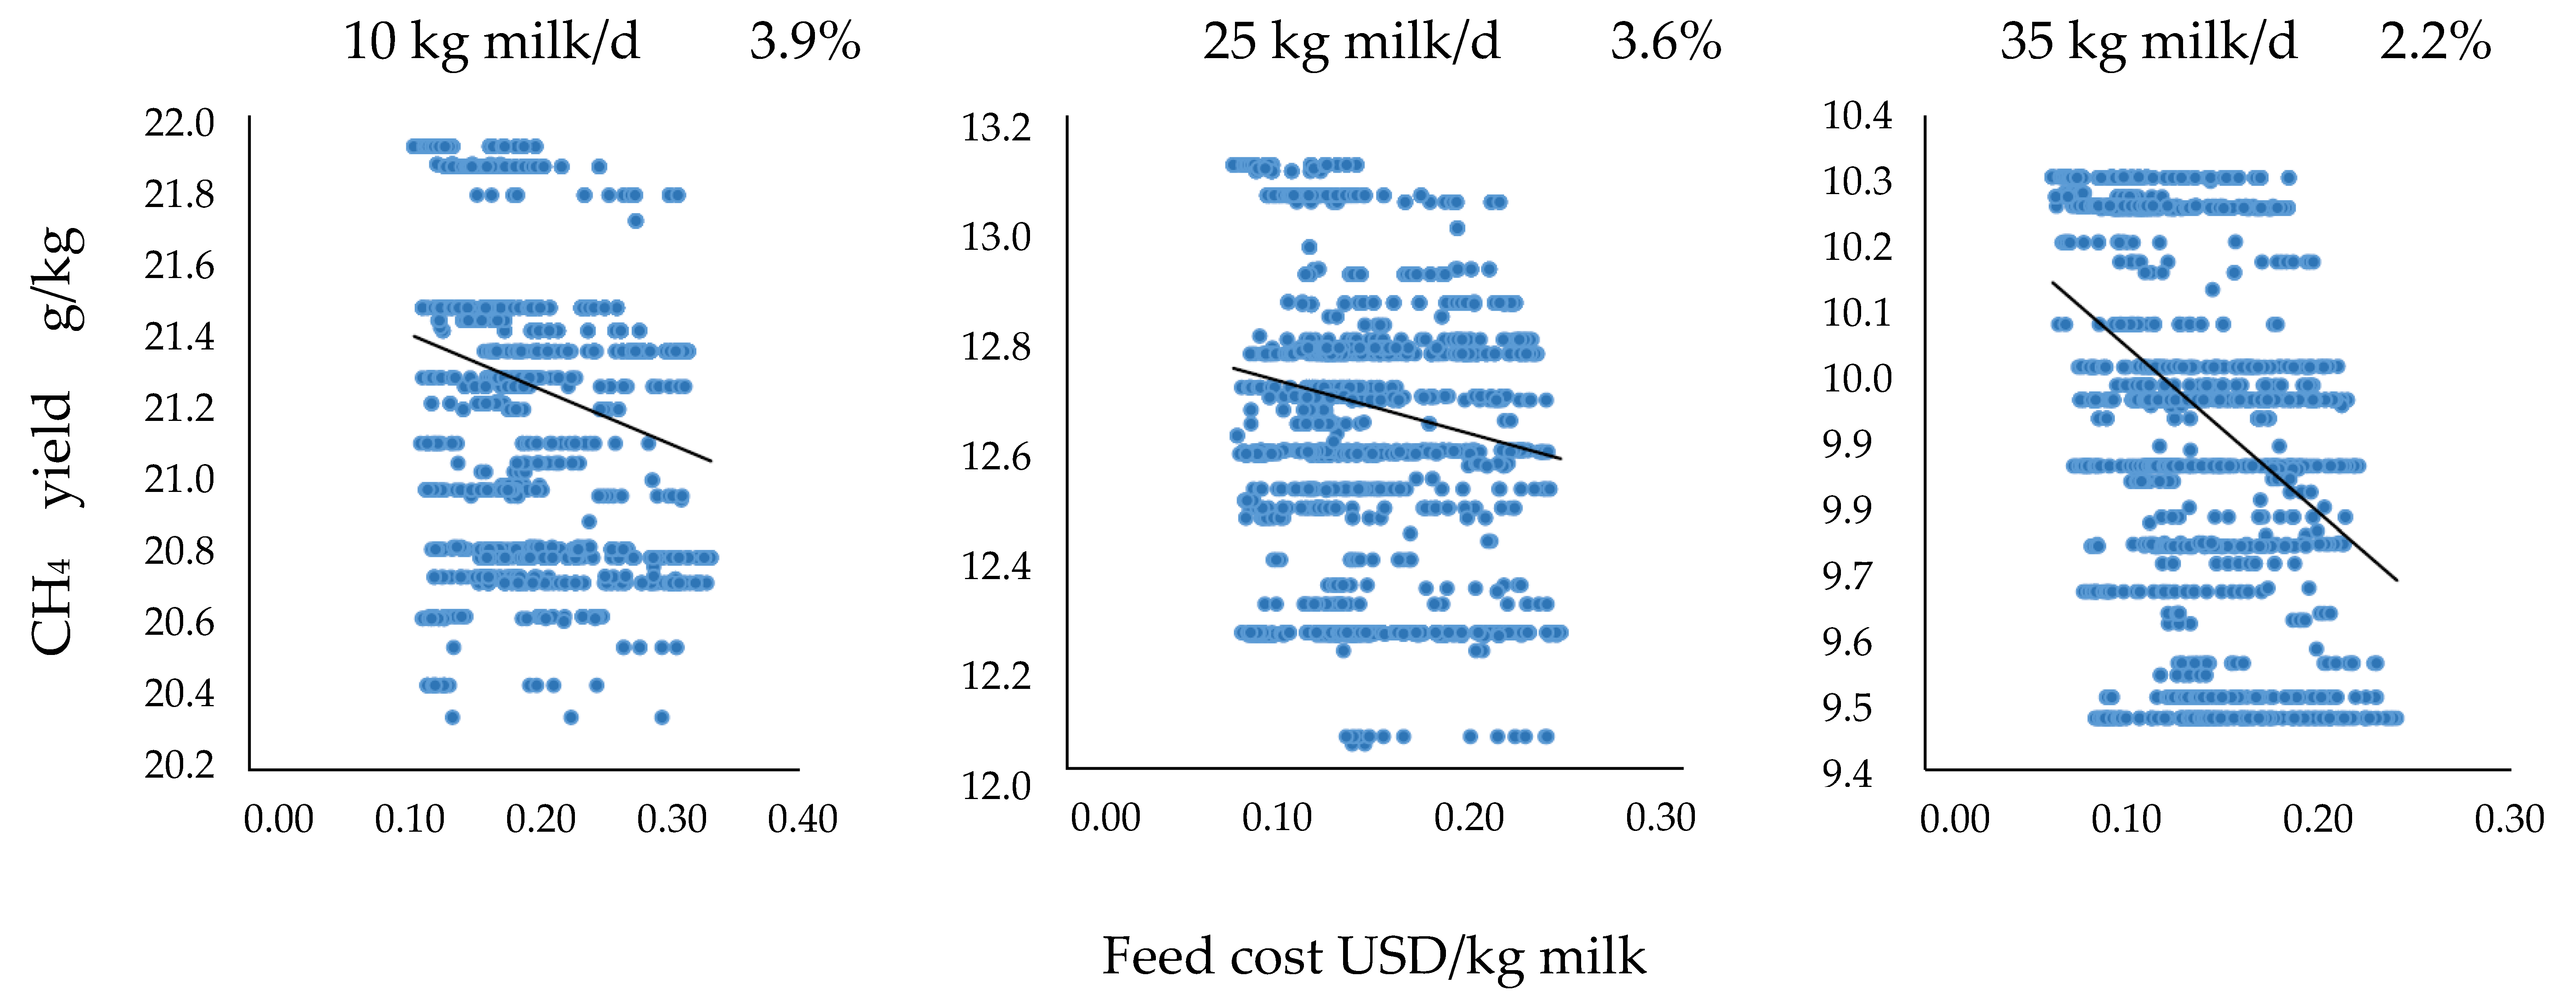
3.2. Predicted Methane Production in Relation to Feed Cost

Figure 3 and Figure 4 (and further graphical illustrations in the supplementary Figures S1–S3) show the predicted CH4 yield (g CH4/kg milk) and feed ration cost (USD/kg milk) at different levels of milk production and for different feeding scenarios throughout the study duration. The predicted levels of CH4 emissions reflect the feed ration composition across scenarios and levels of milk production. In average, the emission of the 10 kg milk producing cow varied between 20.7 and 21.6 g CH4/kg milk. At 25 kg milk production, the predicted CH4 was 40% lower compared to the 10 kg milk producing cow, and varied between 12.2 and 12.9 g CH4/kg milk. At a high daily milk production of 35 kg, CH4 production varied between 9.47 and 10.25 g CH4/kg milk. This emission level is 21% and 53% lower than in the average and low milk producing cows, respectively. The magnitude of CH4 reduction (the relative proportion between minimum and maximum CH4 production) in each feeding scenario and across production levels is elaborated in the same figures in percentage terms. At 10 kg milk production, the potential to reduce CH4 production varied between 0.6% in S1 and 5.5% in S8 (average = 3.9%). At 25 kg milk production, the potential to reduce CH4 production was lower than in a 10 kg milk producing cow and varied between 0.1% and 5.7% (average = 3.2%). At 35 kg milk production, the potential to reduce CH4 production was lower than in the 25 and 10 kg milk producing cows and varied between 0.3 and 4.2% (average = 2.2%). Our results could be interpreted in such a way that the potential for selecting feed rations that reduce CH4 production declines with increasing milk production.
Furthermore, Figure 5 (and supplementary Figure S4) presents results on CH4 production per day and per kg of milk produced in relation to feed ration cost.
When considering all formulated feed rations, feeding scenarios and milk production levels, a typical and expected relationship between CH4 production and feed cost per kg of milk is obtained. Overall, within each milk production level, the decline in CH4 production increases the daily feed cost and feed cost per kg milk, as indicated by the negative slopes.
However, the negative slope (−2.6) is greater at a high production level, compared to that at the average and low milk production levels, which indicates that the reduction in CH4 yield may induce a lower cost, compared to the higher cost required to reduce CH4 yield at the average and low production levels. This is in part due to the small variation (2.2%) between the minimum and maximum CH4 yield at a high milk production level. This seems to be a reasonable conclusion since a decline in CH4 production may also indicate an improvement in the formulated feed rations (i.e., greater ME/kg DM), nutrient selection and nutrient supply, which adds further costs to the total feed ration in all feeding scenarios.
Our observations illustrate that the CH4 yield increases significantly with a declining milk production level. Furthermore, the daily feed cost was highest at the 35 kg milk production level compared to average and low milk production levels. However, at 35 kg milk production, feed cost per kg milk was lowest. This reflects the high feed efficiency of 1.5 (kg milk/kg DM feed), estimated for the high milk producing cow. Furthermore, at a low daily milk production (10 kg), alfalfa hay was included in the ration at a rate of 55%, which may explain the high feed ration cost per kg of milk; besides, feed efficiency at this level of milk production is expected to be low. Methane emission is positively related to the dietary NDF content and inversely to concentrate contents [17]. In our study, within each milk production level, the magnitude of CH4 reduction reflects the feed ration switch (between months) which depends on feed prices and feed ingredient availability. Therefore, with frequent CH4 emission evaluation (on a monthly or weekly basis), there should emerge a relationship between the magnitude of CH4 emissions and feed cost. The use of optimization models for the reduction of the environmental impacts of dairy systems has been suggested as a great tool, with particular emphasis on the trade-offs between CH4 emissions and feeding costs [18]. Cottle et al. (2011) [19] and Knapp et al. (2014) [9] revealed feeding alteration strategies that lead to reducing CH4 per kg of milk. As in the present study, [9] revealed that an increase in DMI (due to a higher dietary ME concentration) and, accordingly, in feed efficiency, would be expected to reduce the enteric methane yield between 2 and 6% for each kilogram increase in DMI, which is in agreement with our results.
Like in our results, Moraes et al. (2015) [20] reported an increase in feed cost associated with reducing CH4 emission. In the latter study, feed cost and CH4 emission were expressed per cow per day, whereas in our study we also expressed feed cost and CH4 yield per kg of milk. Expressing enteric CH4 yield per kg of milk was reported to be the correct and the most useful basis nutritionally, environmentally and economically [9]. In conclusion, CH4 yield and feed cost per kg of milk across milk production levels show a low CH4 yield and feed cost at high milk production compared to average and low milk production levels. In the Supplementary Materials, Figures S5 and S6 show the feed cost expressed in USD per kg of milk for all evaluated scenarios and milk production levels. Comparing feed cost across milk production level and feeding scenarios, feed cost was lowest at high milk production level and ranged between 0.11 and 0.16 USD per kg milk in S7 and S5 scenarios, respectively. In the average milk producing cow, feed cost was 5% greater than with high milk production and ranged between 0.14 and 0.16 USD per kg of milk in S4 and S8 scenarios, respectively. In a low milk producing cow, feed cost increased by 30% and 37% (compared to average and high milk production feed costs) and ranged between 0.20 and 0.23 USD per kg of milk in S4 and S8 scenarios, respectively. The variations in feed cost levels reflect the improved milk production efficiency across milk production levels. As in the study of Richardson et al. (2019) [21], our results illustrate the feed economic benefits of an increased milk production level. Our results agree with Buza et al. (2014) [22], who suggested a monthly evaluation of feed cost and milk profitability on dairy farms. Furthermore, Buza et al. (2014) [22] demonstrated a lower income over feed cost at low milk production level (i.e., 18 kg milk/d) compared to that at maximum milk production level (i.e., 31.5 kg milk/d). This could also be expected for our result, since feed cost per kg milk was highest at low milk production. However, since milk price was not used in the current analysis, it was not possible to confirm this conclusion. Evaluating the method used in our study, the primary limitation of the used model is that the set of linear constraints (minimum nutritional requirements), combined with the relative prices in the objective function, consistently yielded corner solutions, which was observed in some feed formulas. It is these corner solutions that lead to the discrete changes in feed inputs (e.g., completely substituting barley for corn in some scenarios), in which it might be interesting to further evaluate models that generate smoother transitions between inputs. Furthermore, we assumed a constant DMI across feeding scenarios within a milk production level (i.e., DMI does not change when dietary ME concentration changes), and therefore the current modeling framework might not capture the effect of dietary ME content on the DMI level.

4. Conclusions

The current study explored the impact of changes in feed ingredients’ prices and feed ingredients’ availability on dairy ration composition, feed cost and predicted methane yield under different levels of milk production. The results demonstrate the potential of using the LP method for different feed supply situations in order to improve feed efficiency in dairy production. The method further allows for the estimation of cows’ CH4 production subject to dietary changes across months. Within each milk production level, the magnitude of CH4 reduction reflects the monthly switch in feed commodities which depends on feed price and feed availability. The study shows that CH4 mitigation has greater potential in low producing cows than in average and high yielding cows. These cows are mostly located in low income countries in Asia, Africa and Latin America. Therefore, our results can be primarily utilized to improve the efficiency of low yielding cows, which would be a key strategy to mitigate CH4 and improve economic benefits from dairy production in different geographical locations. This conclusion is supported by the fact that feed ingredients’ production may be disrupted in a particular geographical region for many reasons, which may affect the supply to other regions. Finally, the model provides diet selection options that can improve dairy herds’ efficiency and mitigate the environmental impacts of milk production.

Supplementary Materials

The following are available online at https://www.mdpi.com/2071-1050/13/1/215/s1, Figure S1: Feed cost (USD/kg milk) and predicted CH4 yield (g CH4/kg milk) for fourteen feeding scenarios for the low milk producing cow (10 kg/d), Figure S2: Feed cost (USD/kg milk) and predicted CH4 yield (g CH4/kg milk) for fourteen feeding scenarios for the average milk producing cow (25 kg/d), Figure S3: Feed cost (USD/kg milk) and predicted CH4 yield (g CH4/ kg milk) for fourteen feeding scenarios for the high milk producing cow (35 kg/d), Figure S4: Daily feed cost in relation to predicted CH4 yield across fourteen dairy feeding scenarios and three milk production levels, Figure S5: Minimum, maximum, and average feed ration cost USD/kg milk, Figure S6: Feed cost (USD /kg milk) in fourteen dairy feeding scenarios for three milk production levels between Jan 2005 and May 2018, Table S1: Summary of minimum, maximum, and average feed ingredient inclusion rate (% of dry matter) in fourteen dairy feeding scenarios and for three milk production levels (10, 25 and 35 kg/d) formulated between January 2005 and May 2018 (total formulated feed rations= 6804), Table S2: Statistics and RMSE of formulated crude protein (CP, g/kg DM), Undegradable crude protein (UCP, g/kg DM), and Metabolizable Energy (ME, MJ/kg DM) in fourteen dairy feeding scenario and for three milk production levels between January 2005 and May 2018 (total formulated feed rations= 6804).

Author Contributions

O.A. developed the models, collected data, analyzed the data and drafted the earlier manuscript versions. E.S. edited the drafted manuscript and provided substantial inputs to the methods and discussion parts. All authors have read and agreed to the published version of the manuscript.

Funding

This research received no external funding.

Acknowledgments

The authors would like to thank the German Academic Exchange Service (DAAD), whose fellowship program for visiting scientists (OA) enabled our cooperation on this work.

Conflicts of Interest

The authors declare no conflict of interest.

References

  1. Hemme, T. IFCN Dairy Report; International Farm Comparison Network, IFCN Dairy Research Center: Kiel, Germany, 2019. [Google Scholar]
  2. Hemme, T.; Alqaisi, O.A.; Ndambi, O.A.; Boelling, D. IFCN Contribution to the IDF/FAO/IFCN Joint Project, World Mapping of Animal Feeding Systems in the Dairy Sector; International Dairy Federation: Rome, Italy, 2014. [Google Scholar]
  3. Hagemann, M.; Hemme, T.; Ndambi, O.A.; Alqaisi, O.; Sultana, M.N. Bechmarking of greenhouse gas emission of bovine milk production systems for 38 countries. Anim. Feed Sci. Technol. 2011, 166, 46–58. [Google Scholar] [CrossRef]
  4. Alqaisi, O.; Hemme, T.; Latacz-Lohmann, U.; Susenbeth, A. Evaluation of food industry by-products as feed in semi-arid dairy farming systems: The case of Jordan. Sustain. Sci. 2014, 9, 361–377. [Google Scholar] [CrossRef]
  5. Alqaisi, O.; Moares, L.; Ndambi, O.; Williams, R. Optimal dairy feed input selection under alternative feeds availability and relative prices. Inf. Process. Agric. 2019, 6, 438–453. [Google Scholar] [CrossRef]
  6. Alqaisi, O.; Ndambi, O.A.; Hemme, T. Global view on feed cost and feed efficiency on dairy farms. All Feed 2011, 2. Available online: http://www.allaboutfeed.net/Process-Management/Management/2011/7/Global-view-on-feed-costand-feed-efficiency-on-dairy-farms-AAF011993W/ (accessed on 17 October 2018).
  7. Wilkinson, J.M.; Garnsworthy, P.C. Dietary options to reduce the environmental impact of milk production. J. Agric. Sci. 2017, 155, 334–347. [Google Scholar] [CrossRef]
  8. Miglior, F.; Fleming, A.; Malchiodi, F.; Brito, L.F.; Martin, P.; Baes, C.F. A 100-Year Review: Identification and genetic selection of economically important traits in dairy cattle. J. Dairy Sci. 2017, 100, 10251–10271. [Google Scholar] [CrossRef] [PubMed]
  9. Knapp, J.R.; Laur, G.L.; Vadas, P.A.; Weiss, W.P.; Tricarico, J.M. Invited review: Enteric methane in dairy cattle production: Quantifying the opportunities and impact of reducing emissions. J. Dairy Sci. 2014, 97, 3231–3261. [Google Scholar] [CrossRef] [PubMed] [Green Version]
  10. R Core Team. R: A Language and Environment for Statistical Computing; R Foundation for Statistical Computing: Vienna, Austria, 2018; Available online: https://www.R-project.org/ (accessed on 25 November 2018).
  11. World Bank. World Bank Monthly Commodity Feed Prices 2018. Available online: http://www.worldbank.org/en/research/commodity-markets (accessed on 12 February 2019).
  12. Monthly US Hay Price. Available online: https://hayandforage.com (accessed on 12 February 2019).
  13. USDA. Biofuel Feedstock and Coproduct Market Data 2018. 2019. Available online: https://www.ers.usda.gov/webdocs/DataFiles/53657/table09.xls?v=43074 (accessed on 12 February 2019).
  14. National Research Council (NRC). Nutrient Requirements of Dairy Cattle: Seventh Revised Edition; The National Academies Press: Washington, DC, USA, 2001; pp. 266–289. [Google Scholar]
  15. Mertens, D.R. Creating a system for meeting the fiber requirements of dairy cows. J. Dairy Sci. 1997, 80, 1463–1481. [Google Scholar] [CrossRef]
  16. Ellis, J.L.; Kebreab, E.; Odongo, N.E.; McBride, B.W.; Okine, E.K.; France, J. Prediction of methane production from dairy and beef cattle. J. Dairy Sci. 2007, 90, 3456–3467. [Google Scholar] [CrossRef] [PubMed]
  17. Yates, C.M.; Cammell, S.B.; France, J.; Beever, D.E. Prediction of methane emissions from dairy cows using multiple regression analysis. In Proceedings of the British Society of Animal Science; British Society of Animal Science: Penicuik, UK, 2000; p. 94. [Google Scholar]
  18. Moraes, L.E.; Wilen, J.E.; Robinson, P.H.; Fadel, J.G. A linear programming model to optimize diets in environmental policy scenarios. J. Dairy Sci. 2012, 95, 1267–1282. [Google Scholar] [CrossRef] [PubMed]
  19. Cottle, D.J.; Nolan, J.V.; Wiedemann, S.G. Ruminant enteric methane mitigation: A review. Anim. Prod. Sci. 2011, 51, 491–514. [Google Scholar] [CrossRef]
  20. Moraes, L.E.; Fadel, J.G.; Castillo, A.R.; Casper, D.P.; Tricarico, J.M.; Kebreab, E. Modeling the trade-off between diet costs and methane emissions: A goal programming approach. J. Dairy Sci. 2015, 98, 5557–5571. [Google Scholar] [CrossRef] [Green Version]
  21. Richardson, C.M.; Baes, C.F.; Amer, P.R.; Quinton, C.; Martin, P.; Osborne, V.R.; Pryce, J.E.; Miglior, F. Determining the economic value of daily dry matter intake and associated methane emissions in dairy cattle. Animal 2020, 14, 171–179. [Google Scholar] [CrossRef]
  22. Buza, M.H.; Holden, L.A.; White, R.A.; Ishler, V.A. Evaluating the effect of ration composition on income over feed cost and milk yield. J. Dairy Sci. 2014, 97, 3073–3080. [Google Scholar] [CrossRef] [PubMed] [Green Version]
Figure 1. Feed ingredient prices used in the study.
Sustainability 13 00215 g001
Figure 2. Illustration of the multi-period linear programming feed formulation model inputs and outputs for 14 dairy feeding scenarios and for three levels of milk production.
Sustainability 13 00215 g002
Figure 3. Feed cost (USD/kg milk) and predicted CH4 yield (g CH4/kg milk) in selected feeding scenarios (feeding scenario 6, 13 and 14) for three levels of milk production. * Percentage numbers show the difference between the lowest and highest methane yield within each feeding scenario.
Sustainability 13 00215 g003
Figure 4. Summary results of feed cost (USD/kg milk) and predicted CH4 yield (g CH4/kg milk) for three milk production levels and 14 dairy feeding scenarios.
Sustainability 13 00215 g004
Figure 5. Feed cost per kg milk in relation to predicted CH4 yield across 14 dairy feeding scenarios and three milk production levels. The percentage numbers on the graphs show the difference between the lowest and highest methane yield within milk production level.
Sustainability 13 00215 g005
Table 1. The multi-period LP model structure in R with decision variables, objective function and the RHS constraints for three milk production levels (10, 25 and 35 kg/d).
Monthly Feed Prices SBMDDGSCanola MealBarleyWheatCornSorghumAlfalfa HayCa-SoapDicalcium Phosphate
Objfn1 Ob1P1Ob2P1Ob3P1Ob4P1Ob5P1Ob6P1Ob7P1Ob8P1Ob9P1Ob10P1
Objfn2 Ob1P2Ob2P2Ob3P2Ob4P2Ob5P2Ob6P2Ob7P2Ob8P2Ob9P2Ob10P2
Objfn3
Objfnn Ob1PnOb2PnOb3PnOb4PnOb5PnOb6PnOb7PnOb8PnOb9PnOb10Pn
RHS Constraints
Constraints UnitSBMDDGSCanola mealBarleyWheatCornSorghumAlfalfa hayCa-soapDicalcium phosphate 10 kg milk25 kg milk35 kg milk
Constraint 1Weight kg1111111111“=“111
Constraint 2CPg/kg DM4992973781241429411619200“≥“119147152
Constraint 3UCPg/kg DM175172113353354715200“≥“224955
Constraint 4NFC%271619637076692500“≤“444444
Constraint 5Fat%1.6105.42.22.34.23.12.584.50“≤“555
Constraint 6MEMJ/kg DM13.812.711.512.21313.111.58.226.20“≥“81011
Constraint 7NDF%153930211310114200“≥“, “≤“27–3527–3327–33
Constraint 8Ca g/kg DM4181101150176“≥“4.076.036.7
Constraint 9Pg/kg DM7.16.611.63.84.332.82.40205“≥“2.643.83.6
Constraint 10peNDF%615.511.914.783.86.539.500“≥“222222
Upper bound %inf2015infinfinfinfinfinf2
Lower bound 0000000000
RHS: right hand side, LP: linear programming, objfn1 to n: data represent the monthly objective function (feed price Ob1P1 to Ob10Pn) of each feed included in each LP model, inf: infinitive upper feed inclusion limit, SBM: soybean meal, DDGS: distiller’s dried grains with solubles, CP: crude protein, UCP: undegradable crude protein, NFC: non-fiber carbohydrate, ME: metabolizable energy, NDF: neutral detergent fiber, Ca: calcium, P: phosphorus, peNDF: physically effective NDF calculated according to Mertens et al. (1997).
Publisher’s Note: MDPI stays neutral with regard to jurisdictional claims in published maps and institutional affiliations.

