Article

Total Organic Carbon Assessment in Soils Cultivated with Agave tequilana Weber in Jalisco, Mexico

by
Celia De La Mora-Orozco
1,*,
José G. Flores-Garnica
2,
Lucia M. Vega-Ramírez
3,
Irma J. González-Acuña
4,
Juan Nápoles-Armenta
5 and
Edgardo Martínez-Orozco
3
1
Departament of Integral Watershed Management, National Institute of Forestry, Agricultural and Livestock Research, Tepatitlán de Morelos, Jalisco C.P. 47600, Mexico
2
Departament of Forest Fire, National Institute of Forestry, Agricultural and Livestock Research, Guadalajara, Jalisco C.P. 44660, Mexico
3
Academic Unit Arandas, Departament of Environmental Engineering, Technological Institute José Mario Molina Pasquel y Henríquez, National Technological of México, Arandas, Jalisco C.P. 47180, Mexico
4
Department of Soil Fertility, National Institute of Forestry, Agricultural and Livestock Research, Santiago Ixcuintla, Nayarit C.P. 63300, Mexico
5
Faculty of Agronomy, Autonomus University of Nuevo León, General Escobedo, Nuevo León C.P. 66050, Mexico
*
Author to whom correspondence should be addressed.
Sustainability 2021, 13(1), 208; https://doi.org/10.3390/su13010208
Submission received: 11 November 2020 / Revised: 21 December 2020 / Accepted: 21 December 2020 / Published: 28 December 2020
(This article belongs to the Special Issue Environmental Remediation)

Abstract

:
The Agave tequilana Weber is an important commercial crop in the State of Jalisco, Mexico. However, the agave cultivation generates significant soil loss. For that reason, knowledge about the implementation of the agriculture management practices, such as manure application and the combination of inorganic fertilizers and manure, are relevant. The objective of this research was to determine the effect of agricultural management practices on the total organic carbon (TOC) in the soil in three study locations: Arandas, Tepatitlán, and Acatic in the Altos Sur region of Jalisco. A random sampling was carried out in each study location, 12 samples were obtained for each location at 0–30 cm deep, and a total of 36 samples were analyzed. The evaluated parameters were the potential hydrogen (pH), electrical conductivity (EC), bulk density (BD), soil-water saturation (SWS), total nitrogen (TN), and total organic carbon (TOC). Basic statistics and correlations between parameters were generated. In addition, to estimate TOC from a multivariate analysis, models were developed based on the lowest Akaike information criterion (AIC) and of the classification and regression trees (CART). ANOVA and Tukey test were determined. Results demonstrated a significant difference in the TOC percentages between the study locations. The Tukey test showed that there is no difference in TOC content between the Tepatitlán and Arandas sites, but there is a difference between these two sites and the Acatic. The latter resulted with the lowest values of TOC. Long-term studies are recommended to develop crop management strategies.

1. Introduction

The importance of carbon dioxide (CO2) is recognized as a main component of plant and animal physiology [1]. However, in recent decades, its relevance is associated with climate change because the increase in its concentration in the atmosphere is responsible for the increase in the planet’s temperature [1]. Furthermore, land cultivation, land use change, and deforestation produce approximately 1.6 Pg C of CO2 per year, whereas the burning of fossil fuels is estimated at 8.3 Pg C yr−1 [1]. It is currently recognized that soils function as carbon sinks, in addition to representing a cheap, safe, and easy solution to mitigate anthropic CO2 emissions into the atmosphere [2,3]. However, it should be considered that some land use practices are important sources of greenhouse gas (GHG) emissions into the atmosphere, within which agriculture contributes approximately 16% of GHGs [4].
Crop management practices are associated with the concentration of total organic carbon in the soil (TOC) [5], as these practices can cause changes in the soil properties [6]. Therefore, it is generally recommended to adopt management practices in crops, such as manure application and the combination of organic and inorganic fertilizers because, in addition to increasing the amount of TOC, they improve the structure of the soil, are a source of nutrients, control erosion, retain water, increase the agronomic productivity, improve conductivity and aggregation, and reduce compaction [7,8,9,10]. In the accumulation and composition of organic matter, it is also important the type of soil, the depth, and the pH conditions [11].
Regarding TOC, although low-impact management practices are recommended for some crops, such as conservation tillage [12,13], in general, the importance of tillage and crop rotation [14,15,16,17] is mentioned to achieve optimal TOC levels. In addition to this, the intensity and quality of the organic matter added to the soil affects, consequently, the quality of the soil, which will be a function of the rate at which it becomes part of the TOC [18].
Thus, the application of manure, although it increases productivity in crops [8,19,20], does not imply a high retention of C. For example, when applying 200 Mg ha−1 and r−1, only 3–6% of the C is retained [8], whereas other works report between 11% and 18% [20]. Specifically, between 0.7 and 0.3 Mg C ha−1 yr−1 are reported in land where manure has been applied for several years [21]; however, this C has little permanence when the manure application is stopped, as part of the C corresponds to a primary accumulation in the active biological fraction of the soil. In accordance with the above, the comprehensive use of various management practices is recommended, including a combination of inorganic fertilizers and biofertilizers [22]. Nevertheless, to determine the possible benefits in the use of the different management practices, it is still considered necessary to carry out long-term studies, as the changes are slow and difficult to detect [23,24,25].
In Mexico, some soils show different degrees of deterioration due to inadequate management practices [26], where the management of agricultural soils is responsible for 6.21% of GHG emissions [27]. Specifically, intensive tillage, which is a common practice in most rainfed agricultural lands, favors the loss of organic matter in the soil [28]; however, there is a higher TOC content using low-impact management, such as conservation tillage (zero tillage, minimum tillage, or direct seeding) [29]. Thus, this increase can reach more than 40% TOC after 6 years, or a TOC increase rate of 0.2 Mg ha−1 yr−1 [30]. Although this type of evaluation must be done in the medium and long term, in Mexico, the experiments to identify changes in TOC are of short duration, which makes it difficult to estimate the storage or temporary loss of C [31].
From this perspective, there are several crops of commercial importance in the State of Jalisco, Mexico, such as the blue agave (Agave tequilana Weber), whose nomination of origin and quality certification, in the tequila region, was achieved in 1995 [32]. In addition to this, there has been a growing demand for tequila in the world, which has contributed to the dedication of more land to its cultivation in Jalisco [33]. In this way, about 80% of the agave used for the production of tequila in Jalisco is grown in the Altos Sur Region of the state. Nevertheless, the agave cultivation generates significant soil loss. For that reason, several agriculture management practices such as the mature application have been implemented.
Agave production is, in general, similar to a monoculture, although it is also managed as a polyculture, interspersed with corn, beans, peanuts, hibiscus and fruit trees, or through crop rotation [34]. On the other hand, the cultivation of agave is done in soils that present organic matter values lower than 3%, and herbicides are used in its management at least in some stage of the development of the crop. Alternatively, the incorporation of organic matter into the soil is observed during cattle grazing [35], thus it is considered that cattle are a cheap means of adding fertilizer to the soil and controlling weeds. On the other hand, some producers use chemical control, although an integrated control is also used, applying herbicides and mechanical or manual control [36]. However, to define the adequate cultivation of blue agave, it is necessary to have reliable information to determine the natural and anthropogenic changes that it can generate in the environment. Among these aspects is the research on its carbon amount in soils, which is relevant to keep soil structure. Accordingly, the objective of this research was to determine the effect of agricultural management practices on the amount of total organic carbon in the soil in three agave locations in the Altos Sur region of Jalisco. Additionally, the correlations between the total organic carbon content with other soil variables were determined.

2. Materials and Methods
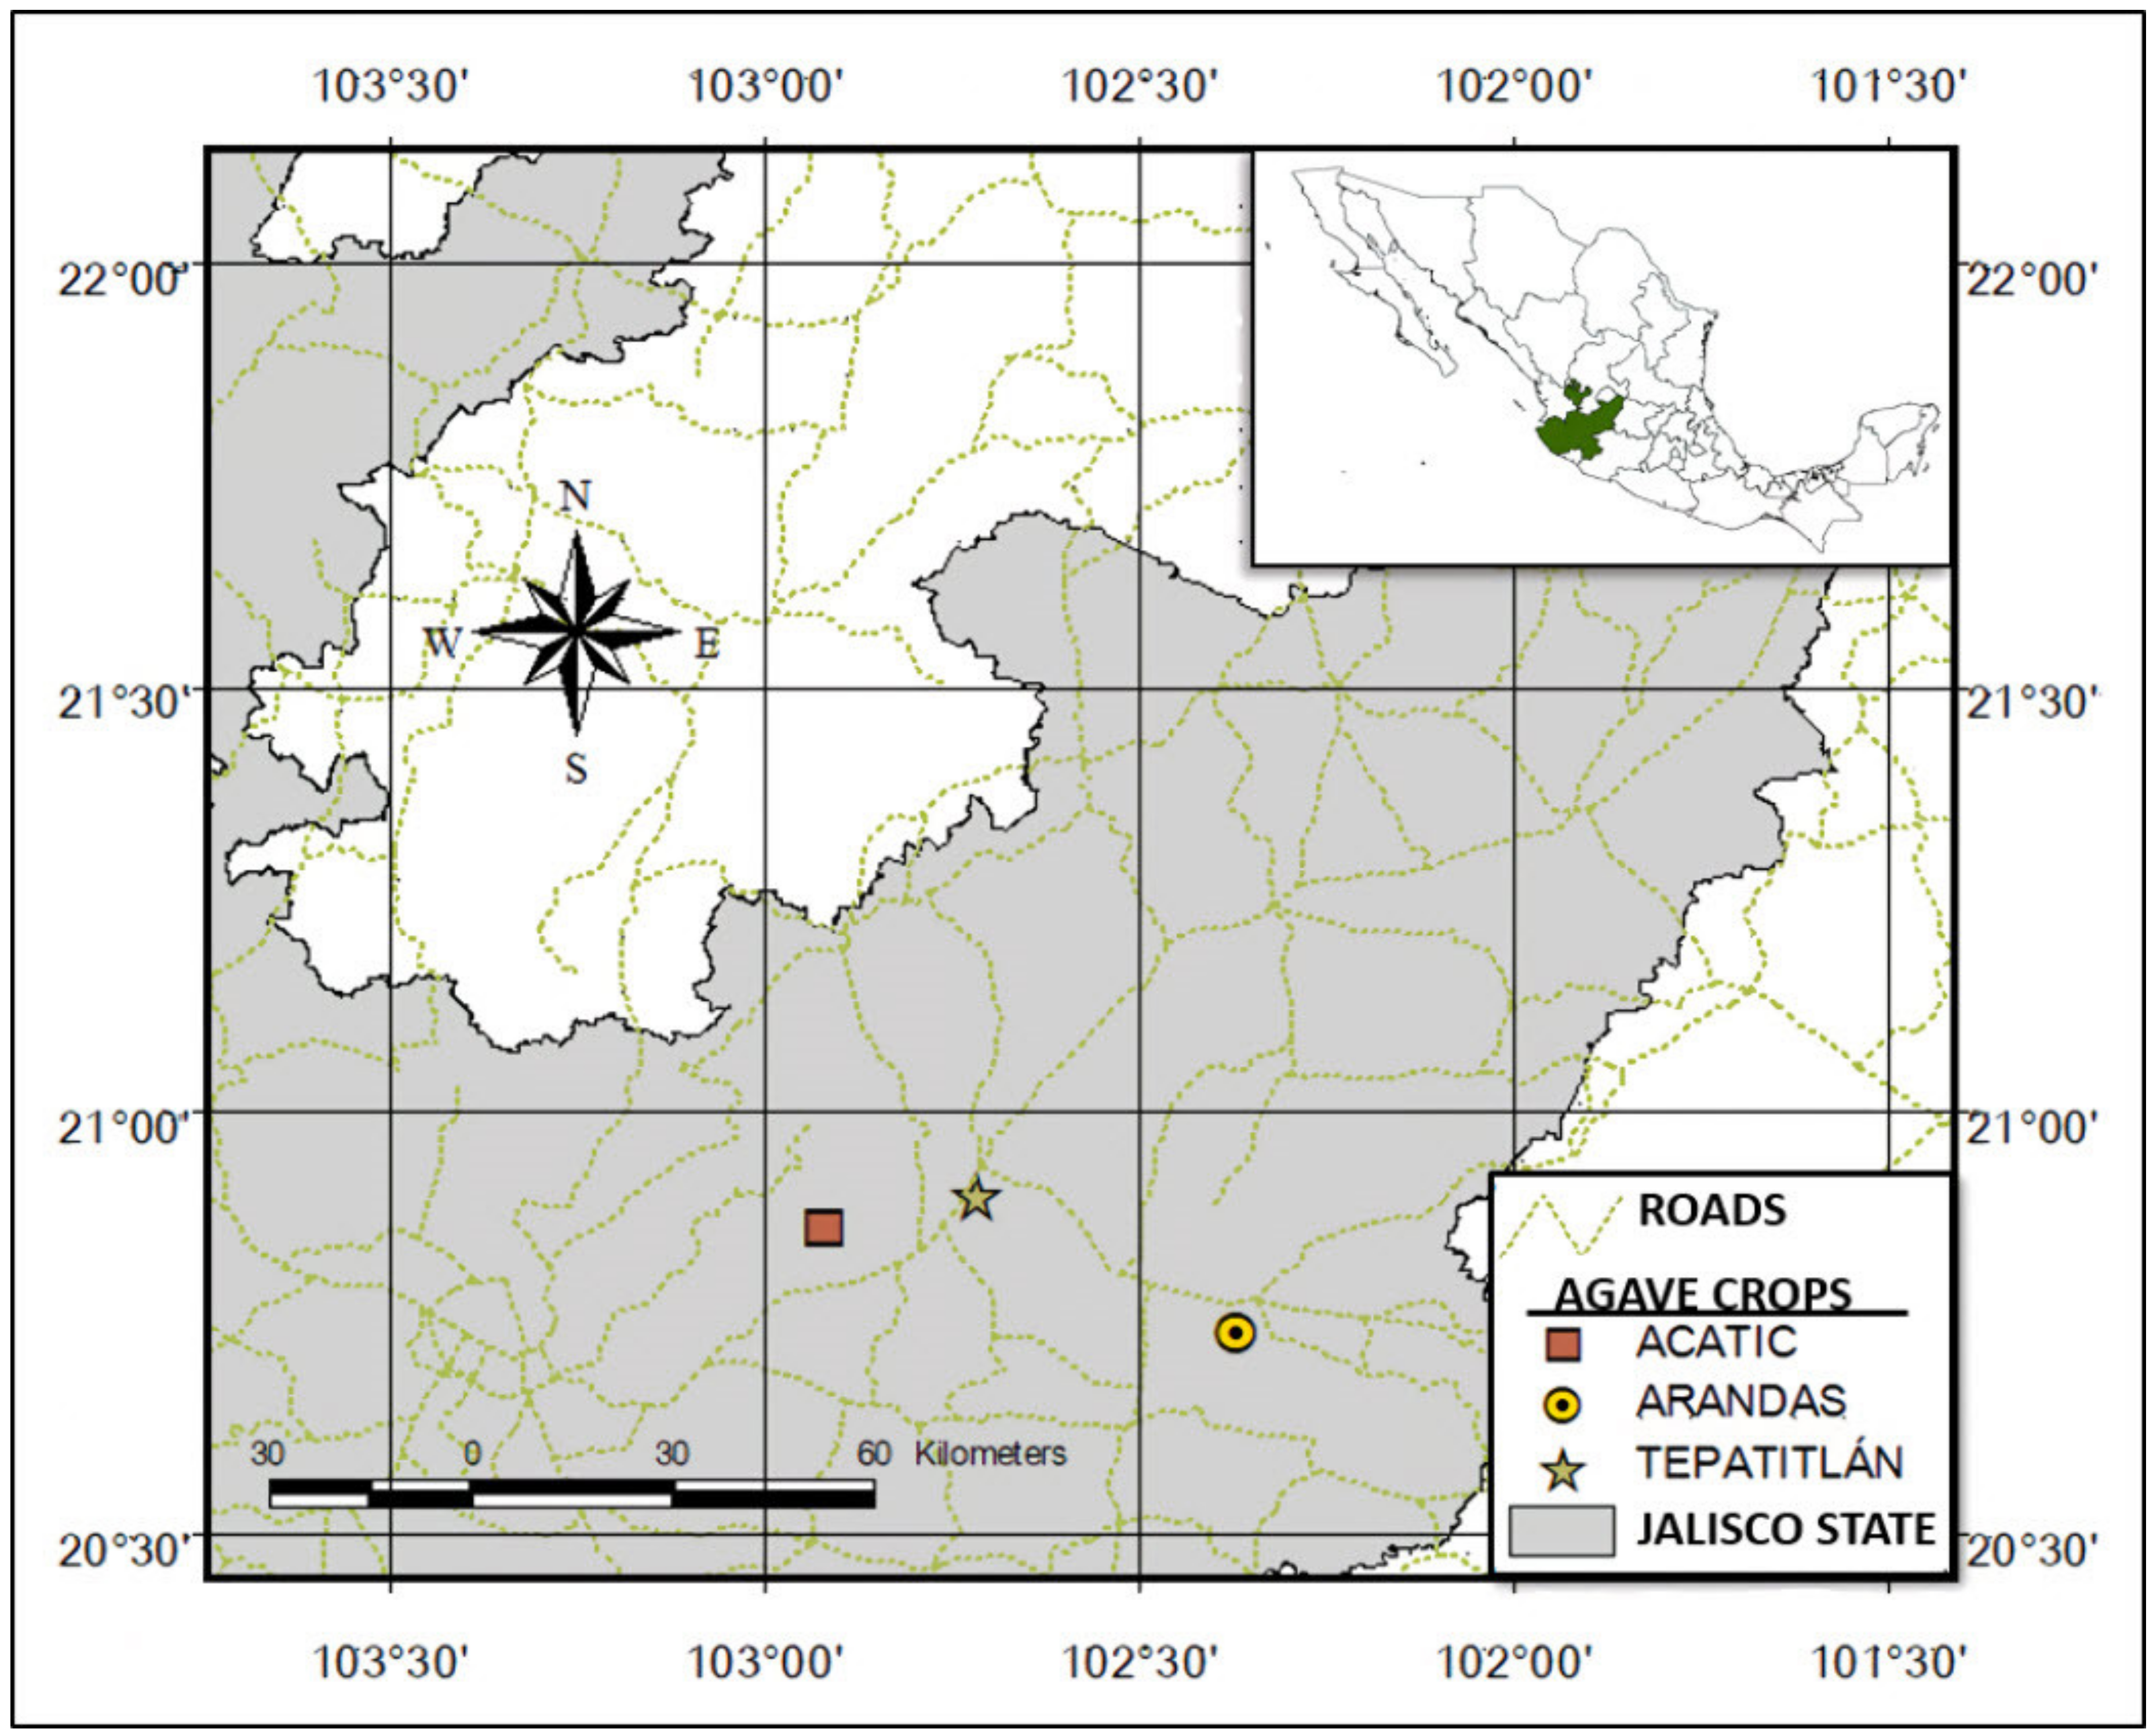
2.1. Study Area

The study considered the evaluation of three management practices in the cultivation of agave, which are carried out in three locations in the Altos Sur Region of Jalisco: Arandas, Tepatitlán de Morelos, and Acatic (Figure 1). The selection criteria for these sites were the agricultural management practices used in cultivation in the last 10 years. The characteristics of the three study locations are described in Table 1.
Agronomic management practices in each study site:
(a)
Arandas; application of organic fertilizers every two years before the rainy season (48 ton ha−1 chicken manure) and inorganic fertilizers (Urea, Triple 16, Tropicote, and Nitro max)
(b)
Tepatitlán; organic fertilizers once a year before the rainy season (30 ton ha−1 pig manure) and inorganic fertilizers twice per year (Biovida, Earth Black, Phosphito, and Axione)
(c)
Acatic; application of inorganic fertilizers twice per year (Triple 16, Potassium, and Nitrogen)

2.2. Soil Sampling

A random sampling was carried out in each study location (Arandas, Tepatitlán, and Acatic), five subsamples (which were mixed to obtain one composite sample) were collected every six agave rows; in total, 12 samples were obtained for each locality for a total of 36 samples analyzed. The samples were collected at a depth of 0–30 cm, which were duly identified and placed in plastic bags for their transfer and their subsequent analysis in the Soil Fertility Laboratory of the Experimental Field, Santiago Ixcuintla (Nayarit), of the Instituto Nacional de Investigaciones Forestales, Agrícolas y Pecuarias (INIFAP).
The preparation of the soil samples was carried out in accordance with the AS-01 protocol “Preparation of the soil sample for mainly physical and soil fertility determinations” [38]. This methodology recommends the following process for soil samples: (1) wet weighing; (2) drying in stainless steel trays at room temperature for approximately five days; and (3) determine dry weight. Once the soil was dried, the samples were crushed with a TECNAL soil mill (model TE 330) and sieved with a mesh (2 mm). The parameters that were analyzed, as well as the method and equipment used, are shown in Table 2.

2.3. Data Analysis

First, the basic statistics of each one of the evaluated parameters of the soil samples were generated. Afterwards, the TOC behavior was determined in relation to independent variables: bulk density (BD), total nitrogen (TN), pH, electrical conductivity (EC), and saturation point (SP), for which the coefficients of determination were calculated based on the proportion of variation in carbon explained by each one of the independent variables. In this way, the models that best adjusted in relation to each independent variable were generated. Subsequently, an analysis of the correlation (Pearson) that existed between each one of the variables was carried out, in order to determine if some variables could be omitted.
To estimate the TOC from a multivariate analysis approach, first, a multivariate linear model was generated, in which all the independent variables were included. Subsequently, to select the variables that most influence the TOC, a model was generated through the “stepwise” process, where the selection was based on the lowest Akaike information criterion (AIC). These models were also compared using the corresponding coefficient of determination. Within this multivariate perspective, an analysis was made based on classification and regression trees (CART), as it represents a more robust alternative, mainly in reference to out-of-trend values (“outliers”). Finally, a comparison is made of the total organic carbon (TOC) values in relation to the three sites included in the study (Acatic, Tepatitlán, and Arandas), for which the corresponding analysis of variance (ANOVA) was applied to determine significant differences between the three study sites; once significant differences were observed, the subsequent Tukey test was determined.

3. Results

3.1. Soil Properties

It was observed that the mean pH for the Arandas site was 6.146 (±0.344), whereas in Tepatitlán the average was 6.366 (±0.205) (Table 3). Finally, the site in Acatic presented the highest pH values; the average was 7.440 (±0.241), so it is considered as a neutral soil. This value represents a difference of 1.190 with respect to the sites in Arandas and Tepatitlán. Significant differences in pH values were observed between the three sites (p = 0.001).
Regarding the EC, the results showed averages of 0.294 (±0.187), 0.271 (±0.123), and 0.153 (±0.037) dS m−1, for Arandas, Tepatitlán, and Acatic, respectively.
In the case of bulk density (BD), the average values were 1.311 (±0.035), 1.310 (±0.026), and 1.285 (±0.038) g cm−3 for Arandas, Tepatitlán, and Acatic, respectively. On the other hand, it was observed that the mean and standard deviation for the saturation point (%) was 47.00 (±0.905), 45.16 (±6.593), and 46.41 (±3.496) for Arandas, Tepatitlán, and Acatic, respectively. The mean and standard deviation for the saturation point was 47.00 (±0.905), 45.16 (±6.593), and 46.41 (±3.496) for Arandas, Tepatitlán, and Acatic, respectively.

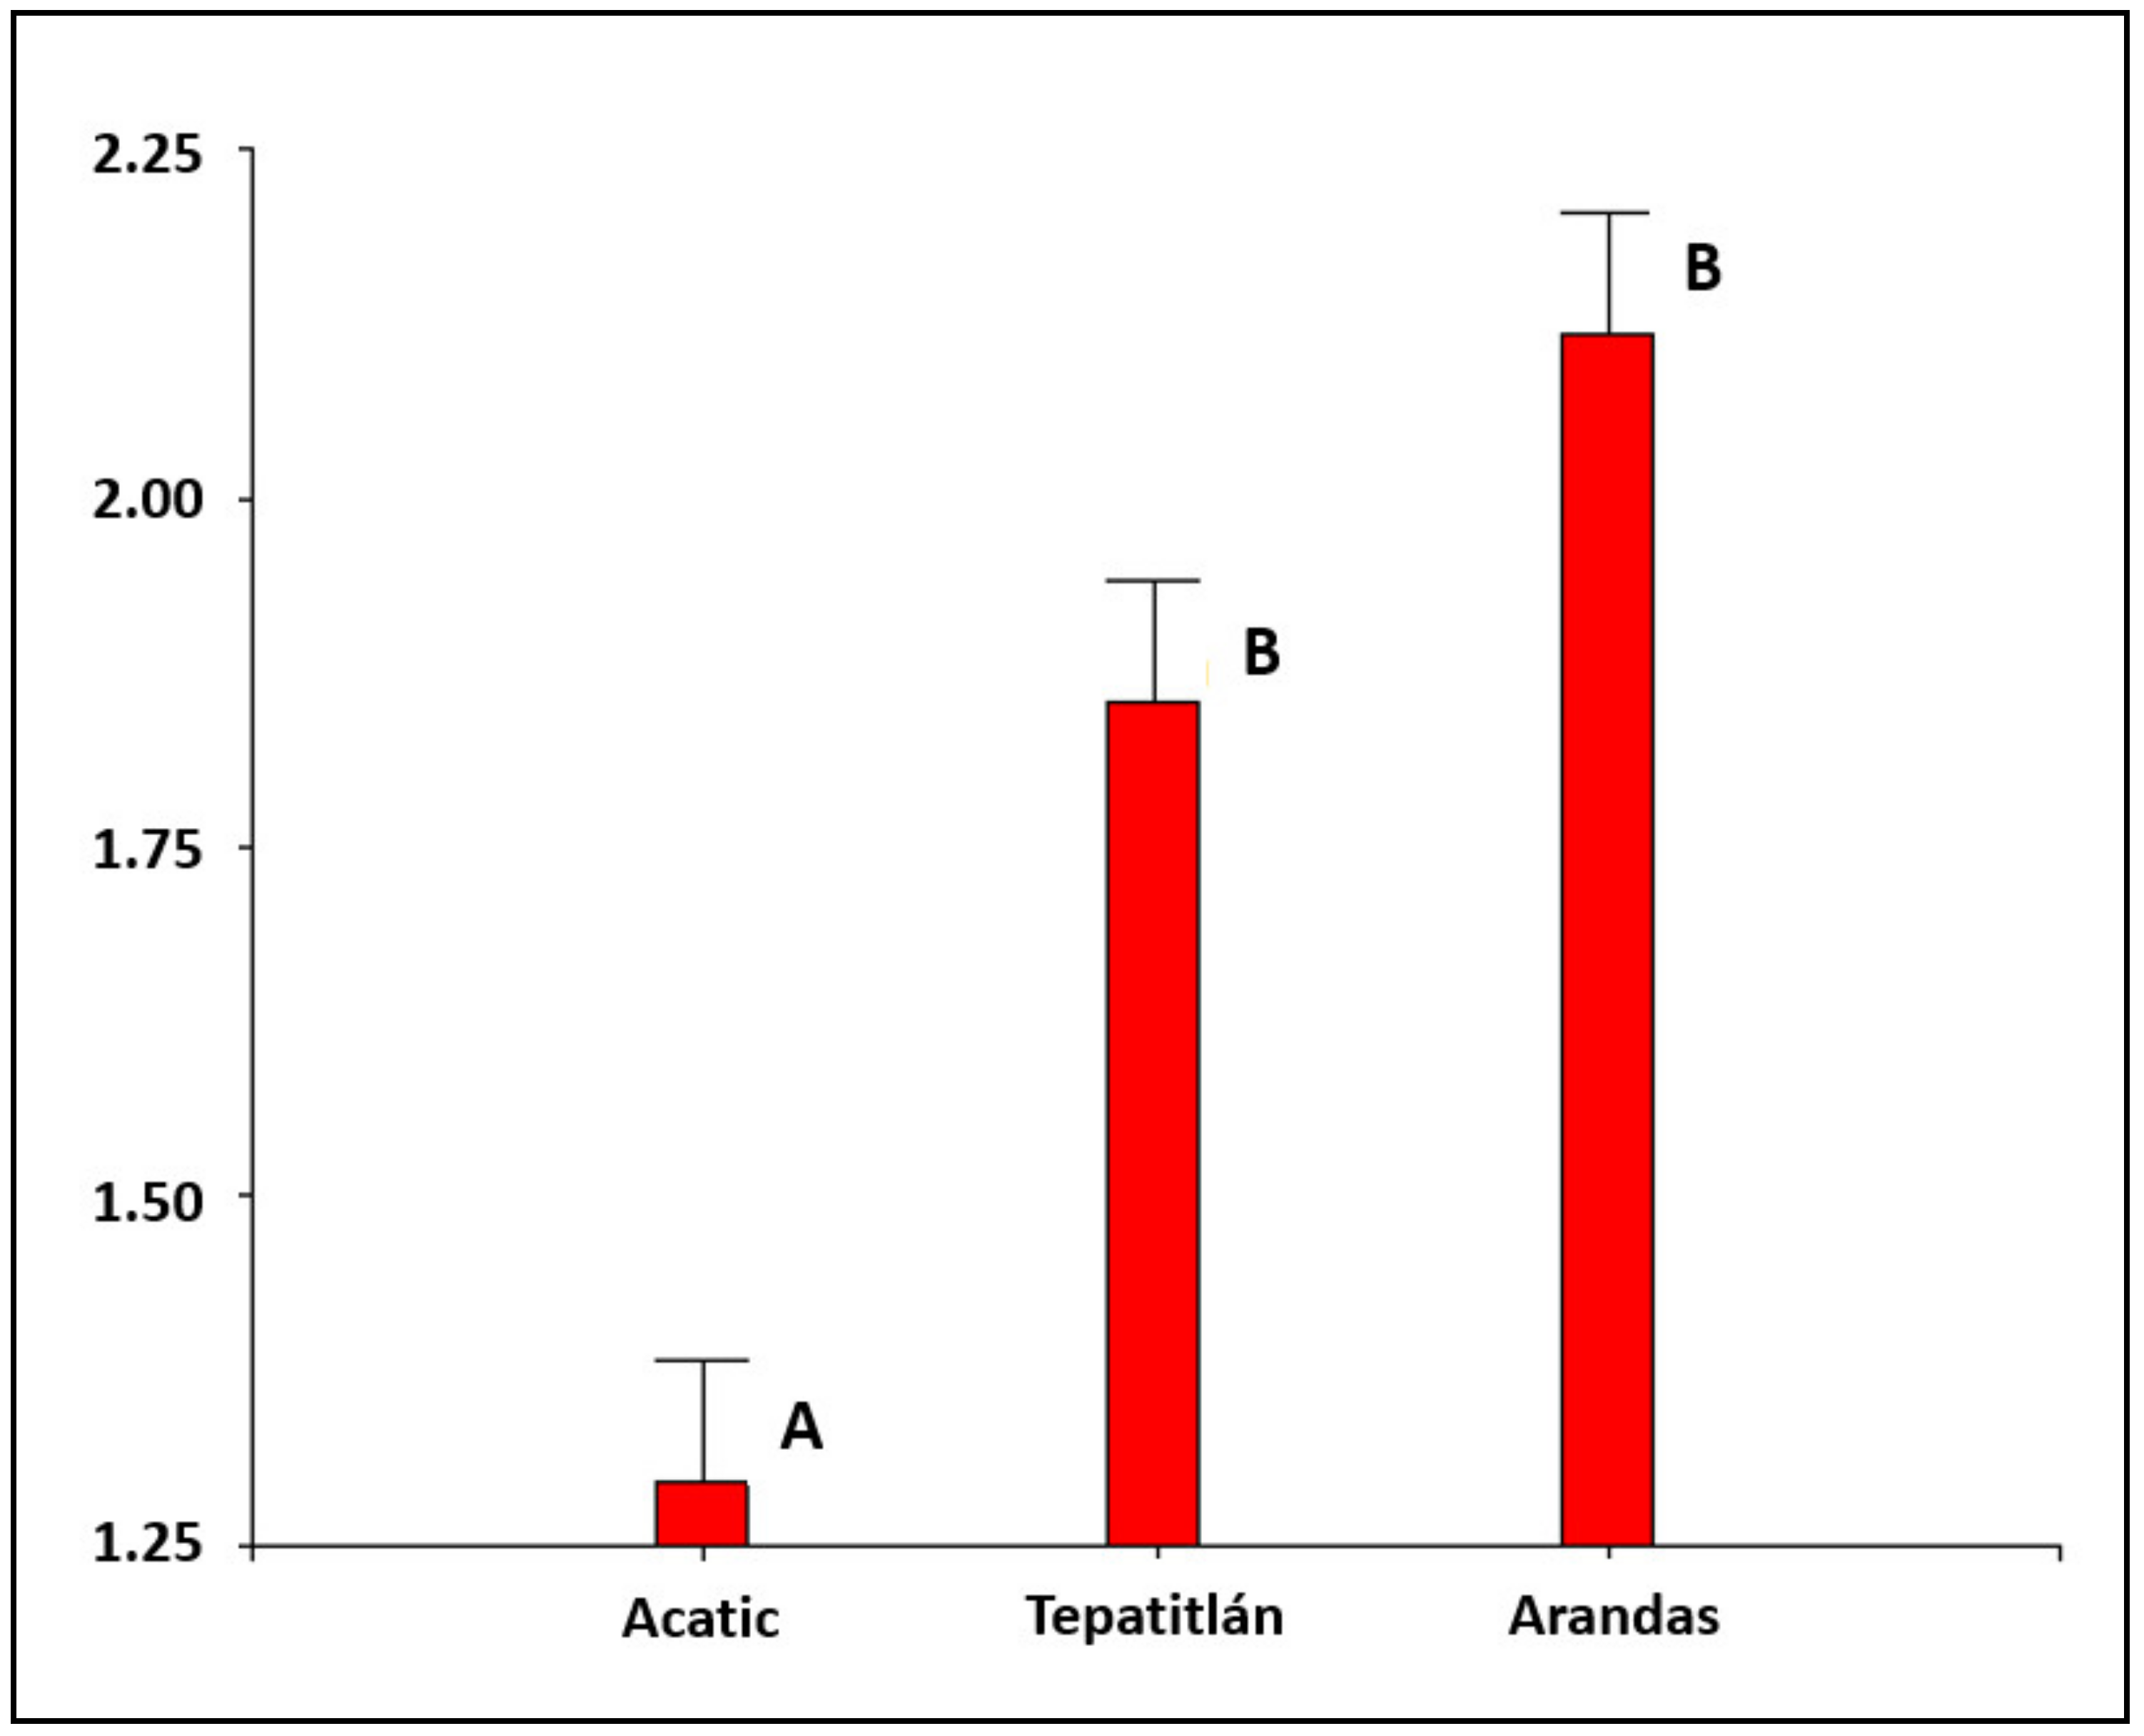
3.2. Soil Nitrogen and Organic Carbon

The results showed little variability in the averages obtained in the determination of TN (%). In the three sites, the values fluctuated between 0.174 (±0.023), 0.164 (±0.041), and 0.135 (±0.041) for Arandas, Tepatitlán, and Acatic, respectively.
In the case of TOC concentration (%), some differences were observed between the locations. In Arandas an average of 2.10 (±0.205) was obtained, whereas in Tepatitlán an average of 1.84 (±0.404) and in Acatic an average value of 1.26 (±0.282) were determined. The results showed statistically significant differences with a value of p = 0.001.

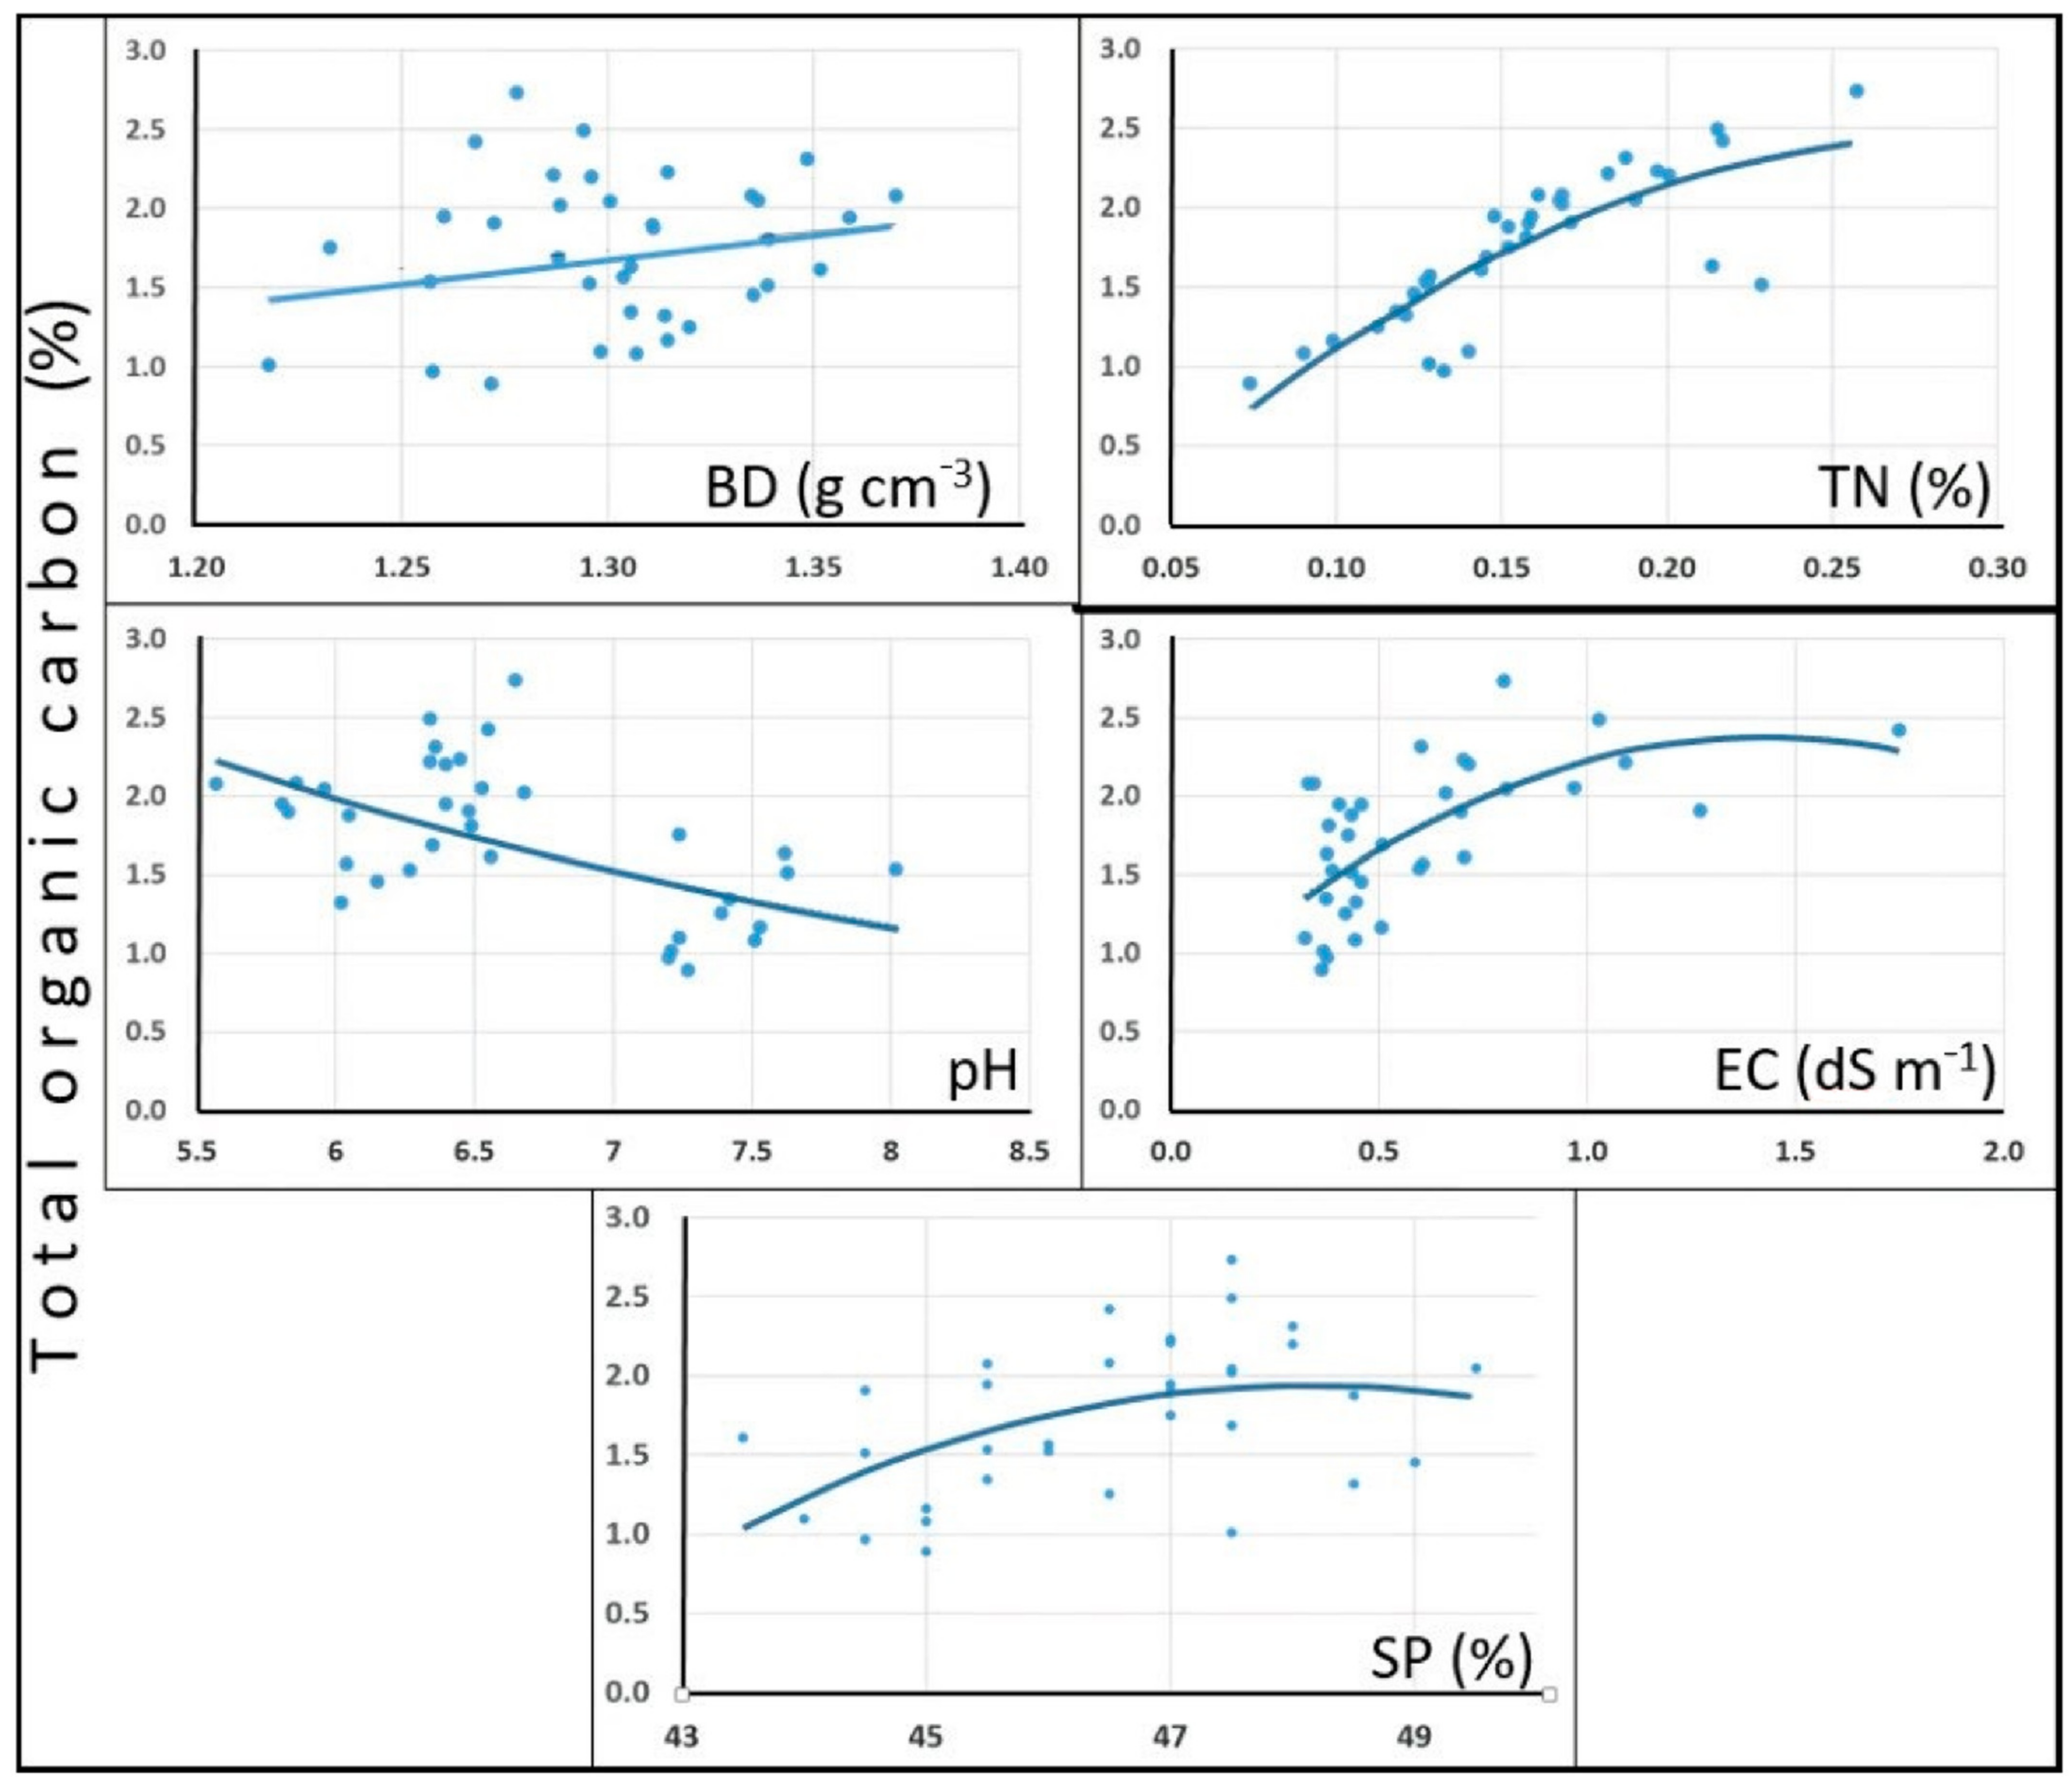
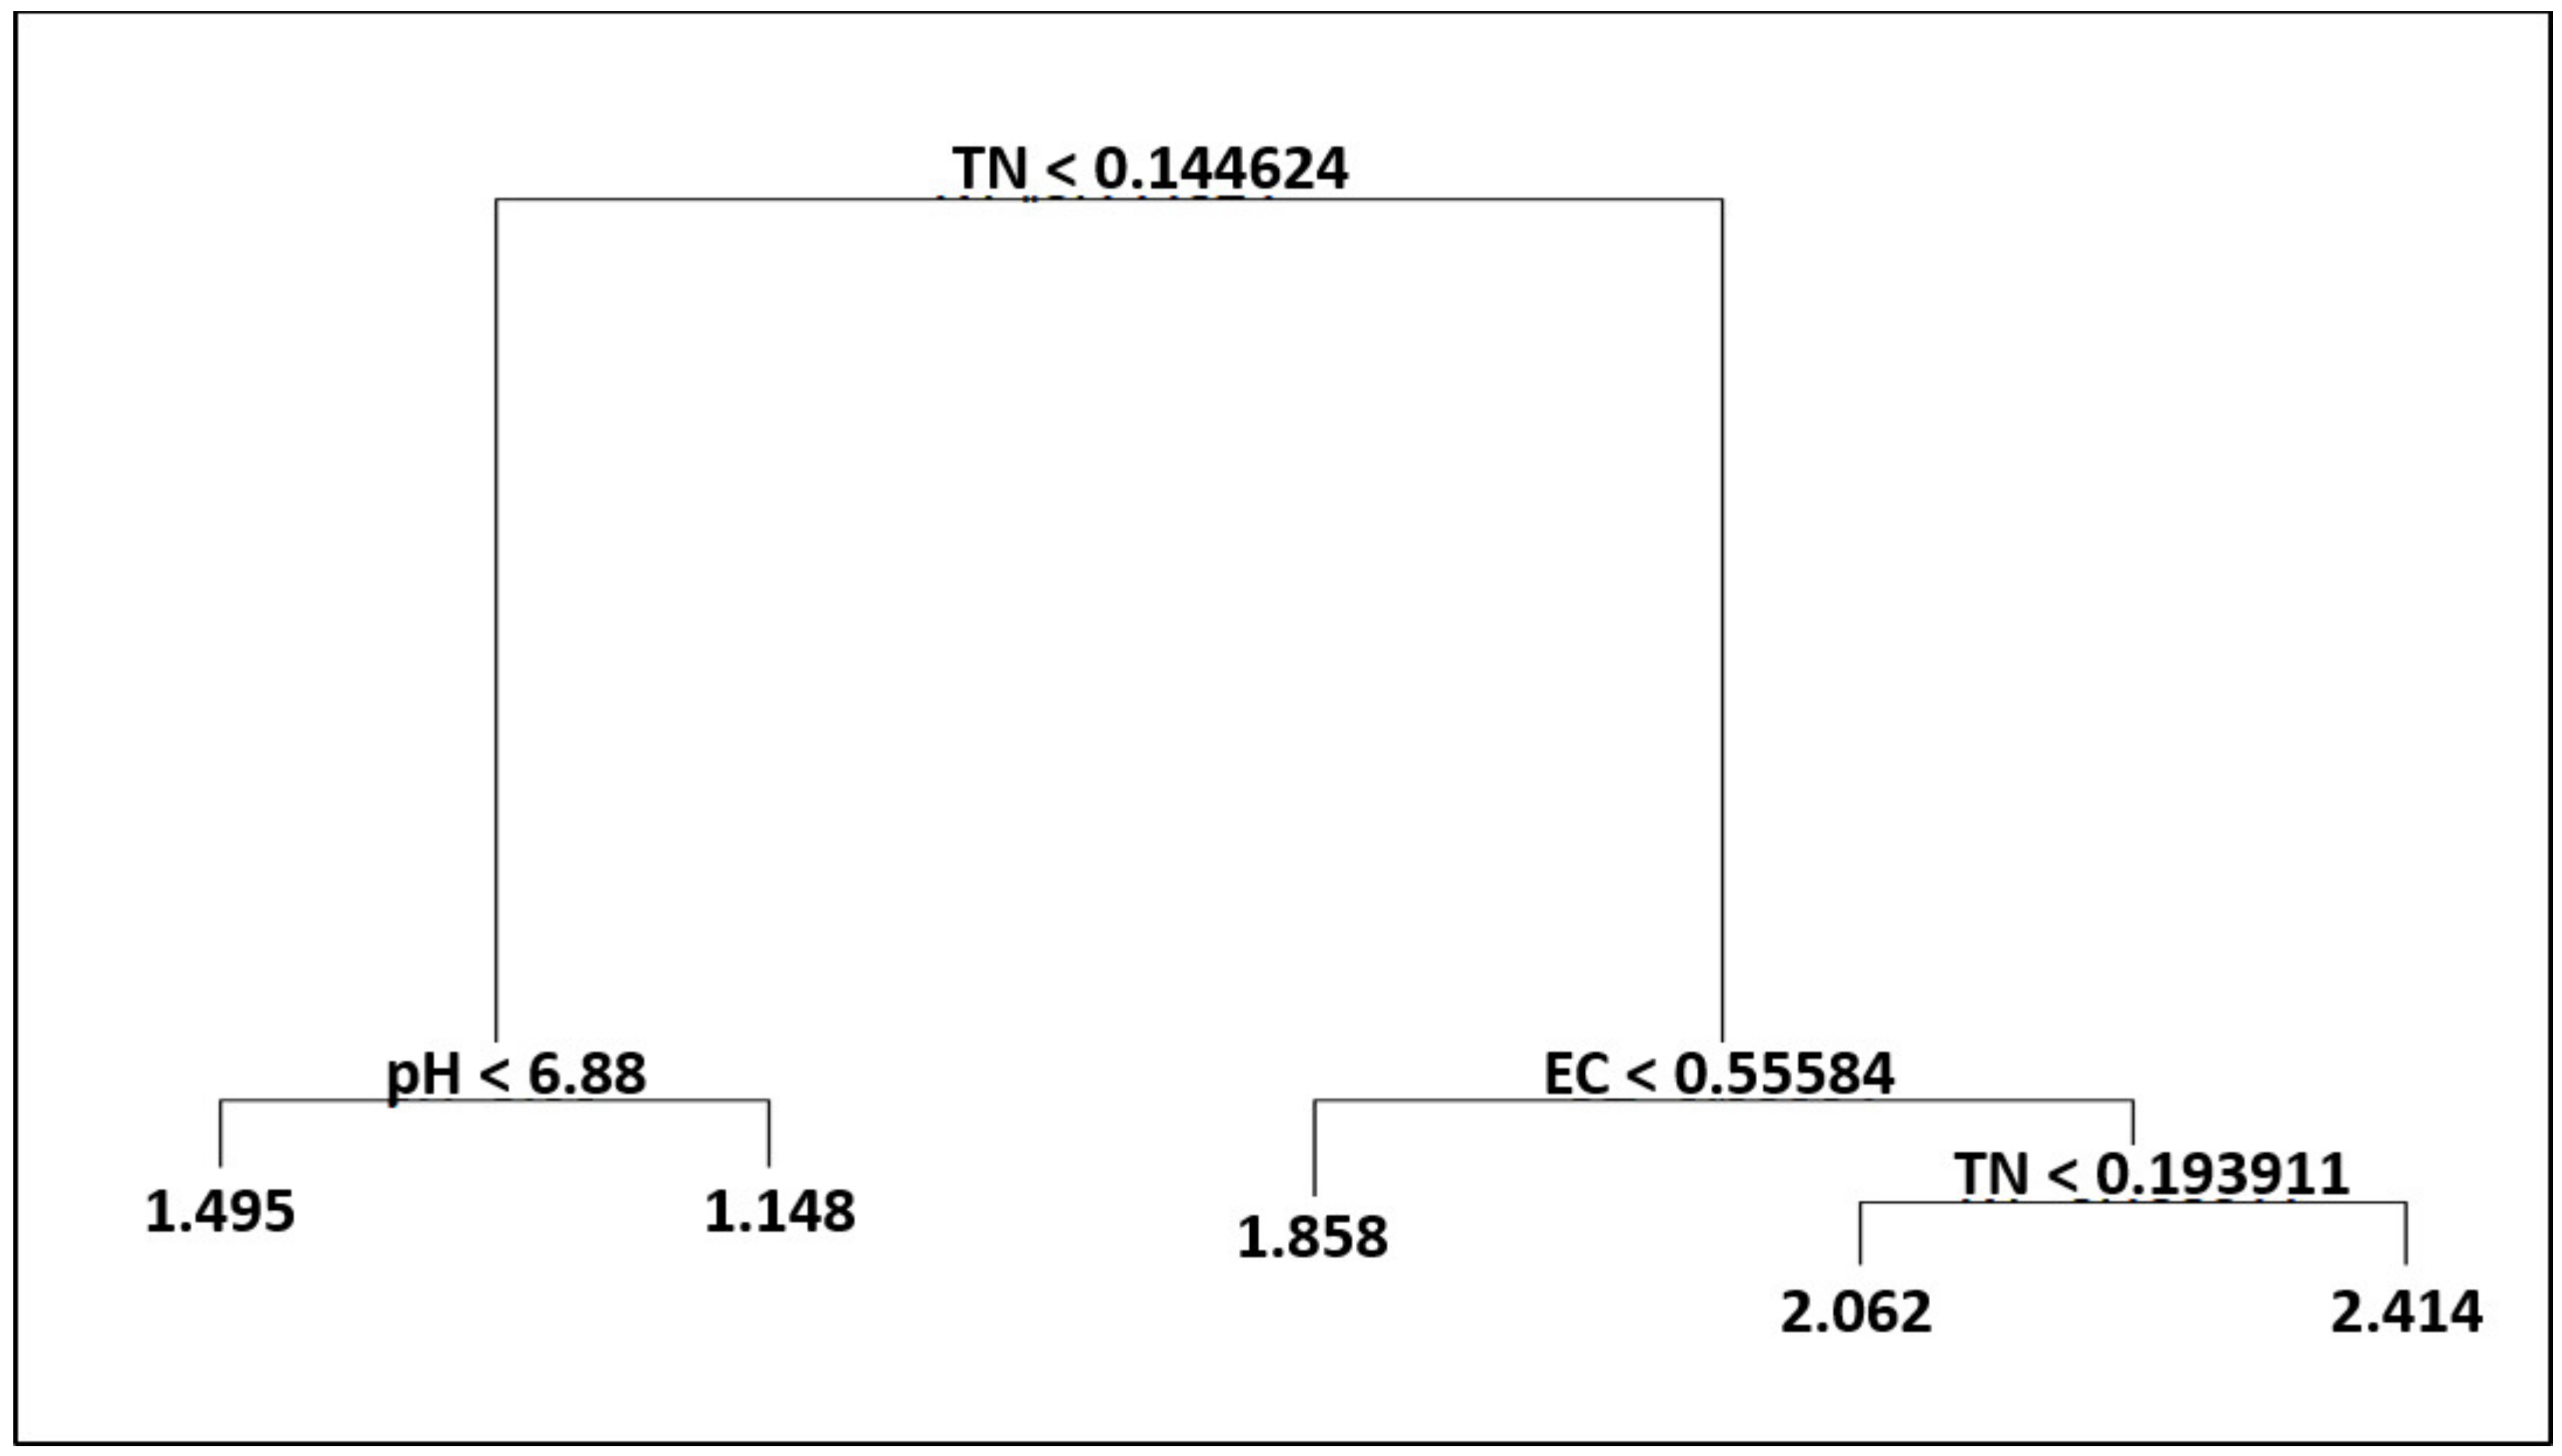
3.3. Correlations between Parameters

Figure 2 shows how the total organic carbon (TOC) values behaved in relation to the independent variables, where the clear trend between TN and TOC stands out, followed by a trend between SP and TOC. On the other hand, although it is clear that there is a negative trend between pH and TOC, two groups of values were observed, the first one between approximately 5.5 and 6.5 pH, whereas the second one is between 7.3 and 8 pH, which leaves a data gap between the values of 6.5 and 7.3. Furthermore, both groups show considerable dispersion in relation to the trend line. In the case of EC, the trend is strongly defined by a possible “outlier” (1.75), as most of the data are located, in a dispersed way, between 0.332 and 1.0 approximately. Finally, the relationship between BD and TOC presents the highest graphic dispersion, mainly in the mean values.
The modeling of the trends of the independent variables in relation to the TOC is presented in Table 4, where it is observed that most of the variables were adjusted to a polynomial model and the variable that best explained the proportion of variation in TOC was TN, which coincides with its graphical trend (Figure 2). In general, the rest of the variables presented a determination coefficient (R2), where the correlation of TOC with BD was the lowest.
Before performing the multivariate analysis, the correlations that existed between the soil variables were defined to determine if there were two, or more, strongly correlated variables and better understand their influence on the multivariate analysis. Table 5 shows that, in a low proportion, SP is correlated with BD, whereas TN is correlated with BD and EC. As for the pH, it is related to SP, although negatively as in the case of its correlation with TOC. Without considering TOC, the rest of the variables correlate with each other in a rather low way, which implies that, in general, it could not be suggested to eliminate any of the variables in the multivariate analysis.
The estimation of TOC in the soil (Table 6), considering a multivariate model, resulted in a high correlation (R2 = 0.8492). However, only pH, EC, and TN were found to be significant variables in estimating TOC, which, in theory, would imply that the model could work well without the variables SP and BD. To corroborate the latter, the “stepwise” process was run to determine which variables had a significant influence on the estimation of TOC from the multivariate analysis. Table 7 shows the values that correspond to the number of variables considered in the TOC estimation models. As indicated in the linear model (Table 6), the lower value of the Akaike information criterion (AIC) does not consider the inclusion of SP or BD.
The linear model resulting from the “stepwise” process is presented in Table 8, where it is observed that the variables pH and TN were highly significant in the estimation of TOC. In the case of EC, this variable presented a significance value very close to the acceptable limit (p = 0.05), for which it was selected in the “stepwise” process. This is explained because the AIC considers not only the least number of variables included in the model but also the best possible correlation (R2). Thus, it is important to highlight that the R2 value obtained with this model was 0.8397, which does not differ much from the R2 value of the multiple linear model that considers all the variables (0.8492). This implies that, as a general rule, the model with the least amount of work will always be chosen; especially in data collection, that is the model with the fewest variables.
Considering that the trend of the variables, in relation to the percentage of TOC, presented some values considered as “outliers”, the process of regression and classification trees (CART) was tested, which is a more robust process in the case of the presence of values outside the trend (“outliers”) of the data. To develop this tree, we started by considering all the independent variables, eventually selecting the most significant variables in the estimation. The resulting tree is presented in Figure 3, where it is observed that, as with the “stepwise” process, only the variables TN, pH, and EC were selected. Furthermore, the most relevant variable is TN, with which the dichotomous process of the tree begins. That is, if the TN values are less than 0.144624 then the left “branch” is taken; otherwise, the right “branch” is taken. In the left “branch”, there is another node where it is specified that pH values lower than 6.88 will have a TOC percentage of 1.495; otherwise, the value will be 1.148. The same logic is followed from the right “branch”.
Finally, the analysis of variance showed a significant difference in the TOC percentages between the study sites in Acatic, Tepatitlán, and Arandas (p < 0.0001), which indicates a very low degree of error (Table 9). The results of the corresponding Tukey test (Figure 4) showed that there is no difference in TOC content between the Tepatitlán and Arandas sites, but there is a difference between these two sites and the Acatic. The latter resulted with the lowest values of the percentage of TOC.

4. Discussion

According to Castellanos et al. [40], the evaluated soils are slightly acidic. In this sense, the pH in Acatic is considered, relatively, as the more favorable soil for the cultivation of agave, which requires soils without a tendency to acidity. However, Ruíz et al. [41], stated that the convenient pH range for this crop is between 6.0 and 8.0; therefore, in the three sites the pH value is not considered a limiting factor for its production.
On the other hand, the correlation between pH and TOC was significant, with a negative trend. The results obtained in this research coincide with that reported by Sánchez-Hernández et al. [13] who mention a high correlation between acidic pH values and the amount of organic matter OM, and C in soils with different crops. However, the pH values that these authors report were slightly acidic (4.1 and 5.2), ranking below the values found in this study (minimum 6.1). In this sense, the bidirectional relationship between pH and organic matter must also be considered, as the content of organic matter affects pH reactions [42], and also pH influences decomposition processes of compounds that are carbon sources [43,44]. In the case of EC, the results are below the critical limits for agave, as it is tolerant to salts and its productivity decreases to values greater than 1.5 dS m−1 [41].
On the other hand, the magnitude of the BD varies according to the texture [40], which coincides with what was mentioned by Antúnez et al. [45], where values indicate that the soils are relatively homogeneous with a similar sandy clay texture. Halvorson et al. [46] mentions that the BD tends to decrease when organic amendments are added to the soil, which implies that as the TOC concentration increases, the biomass increases and, at the same time, the soil aeration improves. In this sense, Du et al. [47] reported a negative correlation between TOC and BD in the first 0.2 m of soil, which does not coincide with the results obtained in the present research, where the correlation between BD with TOC was positive. On the other hand, some studies report a higher BD in soils, regardless of whether or not they had chemical fertilizers [48], which is consistent with what was obtained in the present research, as the results were similar in the three sites studied (with manure, organic fertilizers and chemical fertilizers, and chemical fertilizers).
In the case of the saturation point (SP), which refers to the maximum amount of water that the soil can retain, it is affected by the concentration of organic matter, as well as the content and type of clays [40]. This is important because the soils assessed in this research have a similar texture and, as indicated by Castellanos et al. [40], the maximum amount of water that the soil can retain is largely affected by the content and type of clays. A small difference (0.60%) was observed between Arandas and Tepatitlán, and a difference of 1.83% was observed between Arandas and Acatic. In this way, the results coincide with those reported by Srinivasarao et al. [48], where a trend was found in the increase of SP and the increase of organic matter in the soil, specifically when applying organic amendments, compared with the use of inorganic fertilizers. In this sense, it is important to note that chicken manure is applied in the cultivation of agave in Arandas, in combination with inorganic fertilizers, obtaining a SP of 47.00%. Whereas in Tepatitlán, which uses the combination of organic fertilizers and inorganic fertilizers, a SP of 46.41% was observed, and in Acatic, which only applied inorganic fertilizers, the SP was equal to 45.16%.
To understand the results obtained in relation to total nitrogen (TN), it should be considered that nitrogen-based fertilizers are used to increase agricultural production; however, it has been reported that excessive use decreases microbial activity in the soil [49]. On the other hand, Windeatt et al. [50] reported that the combination of crop residues and nitrogen can increase C in soils between 21.3% and 32.5%. Similarly, the application of a combination of organic fertilizers, with or without manure, can increase the amount of C in the soil layer between 0 and 60 cm [51]. The above implies that TN is a nutrient of great importance in the amount of C in the soil, which was observed in the results of the present investigation, where the trend between TN and TOC was high. Furthermore, TN was the variable that best explained the proportion of carbon variation, being a significant variable in estimating TOC. In this way, results of the present study coincide with that reported by Álvarez [52], who reports that there is a positive relationship between nitrogen in the soil and TOC. Although this nitrogen–TOC relationship could also be attributed to management practices such as tillage [53].
Regarding the TOC concentration (%), statistically significant differences (p = 0.001) were observed between the three study sites, where the highest value was obtained in Arandas (2.10%), followed by Tepatitlán (1.84%) and finally Acatic (1.26%). However, the difference between Arandas and Tepatitlán (0.26%) represents 10,813 ton ha−1 of C. However, if a statistically significant difference were observed between Arandas and Acatic, with a variation in the percentage of 0.84%, equivalent to 33,768 t ha−1 of C., according to the above, unlike only applying chemical fertilizers, it was evident that the TOC percentage was higher in the sites where organic fertilizers are used, even in combination with chemical fertilizers. However, the results of this research are below those reported by Gulde et al. [22], as they mention between 11% and 18% retention of C, in agricultural lands in which manure was applied for 22 years. Similarly, the results do not coincide with what was reported for sites where manure has been applied for 15 years, observing retention of C between 3% and 6% [10].

5. Conclusions

Results obtained in this research demonstrated that agronomic management practices have an impact in the TOC amount in soils cultivated with Agave tequilana Weber. It was determined that there are significant differences in the TOC in the soil of the three sites under analysis. Furthermore, some differences (about 0.26%) were observed among Arandas and Tepatitlán, which suggest that the amount of organic fertilizer and the application frequency may have some effect in the TOC in the soil. On the other hand, it was notable the differences among Arandas and Acatic, (about 0.84% of TOC) which demonstrated that the use of management practices contributed significantly to the soil TOC.
On the other hand, the correlation between pH and TOC was significant, with a negative trend. A positive correlation between BD and TOC was found, and a trend was found in the increase of SP by increasing organic matter in the soil, specifically when applying organic fertilizer. Furthermore, TN was the variable that best explained the proportion of carbon variation, being a significant variable in estimating TOC from the multivariate model approach.
However, long-term studies are still considered necessary because changes in the amount of carbon in the soil under different management practices are slow and difficult to detect.

Author Contributions

Conceptualization, C.D.L.M.-O. and I.J.G.-A. designed the experiments; L.M.V.-R. and I.J.G.-A. performed most of the experimental work. E.M.-O. and J.N.-A. participated in data integration. C.D.L.M.-O. and J.G.F.-G. participated in the analysis of the results. C.D.L.M.-O., J.G.F.-G., I.J.G.-A., L.M.V.-R., J.N.-A., and E.M.-O. wrote the manuscript. All authors have read and agreed to the published version of the manuscript.

Funding

This research received no external funding.

Institutional Review Board Statement

Not applicable.

Informed Consent Statement

Not Applicable.

Data Availability Statement

The data presented in this study are available on request from the corresponding author. The data are not publicly available due to not having a public repository at the moment of this publication.

Acknowledgments

We thank Clen Becerra Zamorano for assistance with soil samples analyses of the different parameters and the farmers for allow us to collect the soil samples.

Conflicts of Interest

The authors declare no conflict of interest.

References

  1. IPCC. Contribución de los Grupos de trabajo I, II y III al Cuarto Informe de evaluación del Grupo Intergubernamental de Expertos sobre el Cambio Climático. Available online: http://finanzascarbono.org/comunidad/pg/file/veronicagutman/read/171709/ (accessed on 7 July 2020).
  2. Turner, W.R.; Oppenheimer, M.; Wilcove, D.S. A force to fight global warming. Nature 2009, 462, 278–279. [Google Scholar] [CrossRef]
  3. Jones, H.P.; Hole, D.G.; Zavaleta, E.S. Harnessing nature to help people adapt to climate change. Nat. Clim. Chang. 2012, 2, 504–509. [Google Scholar] [CrossRef]
  4. Muñoz, T.; Mardones, C. Simulation of a CO2 e tax to mitigate impacts from Chilean agricultural and livestock sectors on climate change. Agrociencia 2016, 50, 271–285. [Google Scholar]
  5. Lal, R. Soil carbon sequestration impacts on global climate change and food security. Science 2004, 304, 1623–1627. [Google Scholar] [CrossRef] [PubMed] [Green Version]
  6. Mota, C.; Alcaraz-López, C.; Iglesias, M.; Martínez-Ballesta, M.; Carvajal, M. Absorción de CO2 por los cultivos más representativos de la Región de Murcia. Hortic. Glob. 2011, 294, 58–63. [Google Scholar]
  7. Blair, N.; Faulkner, R.; Till, A.; Korschens, M.; Schulz, E. Long-term management impacts on soil C, N and physical fertility: Part II: Bad Lauchstadt static and extreme FYM experiments. Soil Tillage Res. 2006, 91, 39–47. [Google Scholar] [CrossRef]
  8. Blair, N.; Faulkner, R.; Till, A.; Poulton, P. Long-term management impacts on soil C, N and physical fertility: Part I: Broadbalk experiment. Soil Tillage Res. 2006, 91, 30–38. [Google Scholar] [CrossRef]
  9. Lal, R. Restoring soil quality to mitigate soil degradation. Sustainability 2015, 7, 5875–5895. [Google Scholar] [CrossRef] [Green Version]
  10. Lal, R. Soil carbon sequestration to mitigate climate change. Geoderma 2004, 123, 1–22. [Google Scholar] [CrossRef]
  11. Sánchez-Hernández, R.; Ramos-Reyes, R.; Geissen, V.; Mendoza-Palacios, J.D.; Cruz-Lázaro, E.L.; Salcedo-Pérez, E.; Palma-López, D.J. Contenido de carbono en suelos con diferentes usos agropecuarios en el trópico mexicano. Terra Lat. 2011, 29, 211–219. [Google Scholar]
  12. Singh, Y.G.; Lal, R.; Swaroop, M.R.; Babu, S.; Das, A.; Bhowmik, S.N.; Datta, M.; Layak, J.; Saha, P. Conservation tillage and nutrient management effects on productivity and soil carbon sequestration under double cropping of rice in north Eastern region of India. Ecol. Indic. 2019, 105, 303–315. [Google Scholar]
  13. Heenan, D.; Chan, K.; Knight, P. Long-term impact of rotation, tillage and stubble management on the loss of soil organic carbon and nitrogen from a Chromic Luvisol. Soil Tillage Res. 2004, 76, 59–68. [Google Scholar] [CrossRef]
  14. Mandal, B.; Majumder, B.; Bandyopadhyay, P.; Hazra, G.; Gangopadhyay, A.; Samantaray, R.; Mishra, A.; Chaudhury, J.; Saha, M.; Kundu, S. The potential of cropping systems and soil amendments for carbon sequestration in soils under long-term experiments in subtropical India. Glob. Chang. Biol. 2007, 13, 357–369. [Google Scholar] [CrossRef]
  15. Majumder, B.; Mandal, B.; Bandyopadhyay, P.K.; Gangopadhyay, A.; Mani, P.; Kundu, A.L.; Mazumdar, D. Organic amendments influence soil organic carbon pools and crop productivity in nineteen year old rice-wheat agro-ecosystem. Soil Sci. Soc. Am. J. 2008, 72, 1–11. [Google Scholar] [CrossRef]
  16. Govaerts, B.; Verhulst, N.; Castellanos-Navarrete, A.; Sayre, K.D.; Dixon, J.; Dendooven, L. Conservation agriculture and soil carbon sequestration: Between myth and farmer reality. Crit. Rev. Plant Sci. 2009, 28, 97–122. [Google Scholar] [CrossRef]
  17. Teasdale, J.; Coffman, C.; Mangum, R.W. Potential long-term benefits of no-tillage and organic cropping systems for grain production and soil improvement. Agron. J. 2007, 99, 1297–1305. [Google Scholar] [CrossRef]
  18. De León-González, F.; Hernández-Serrano, M.; Etchevers, J.; Payan-Zelaya, F.; Ordaz-Chaparro, V. Short-term compost effect on macroaggregation in a sandy soil under low rainfall in the valley of Mexico. Soil Tillage Res. 2000, 56, 213–217. [Google Scholar] [CrossRef]
  19. Stewart, C.E.; Paustian, K.; Conant, R.T.; Plante, A.F.; Six, J. Soil carbon saturation: Concept, evidence and evaluation. Biogeochemistry 2007, 86, 19–31. [Google Scholar] [CrossRef]
  20. Gulde, S.; Chung, H.; Amelung, W.; Chang, C.; Six, J. Soil carbon saturation controls labile and stable carbon pool dynamics. Soil Sci. Soc. Am. J. 2008, 72, 605–612. [Google Scholar] [CrossRef]
  21. Pimentel, D.; Hepperly, P.; Hanson, J.; Douds, D.; Seidel, R. Environmental, energetic, and economic comparisons of organic and conventional farming systems. BioScience 2005, 55, 573–582. [Google Scholar] [CrossRef]
  22. Srinivasarao, C.; Venkateswarlu, B.; Lal, R.; Singh, A.K.; Kundu, S.; Vittal, K.P.R.; Balaguravaiah, G.; Vijaya Shankar Babu, M.; Ravindra Chary, G.; Prasadbabu, M.B.B.; et al. Soil carbon sequestration and agronomic productivity of an Alfisol for a groundnut-based system in a semiarid environment in southern India. Eur. J. Agron. 2012, 43, 40–48. [Google Scholar] [CrossRef]
  23. Sanderman, J.; Farquharson, R.; Baldock, J. Soil carbon sequestration potential: A Review for Australian Agriculture—A report prepared for the Department of Climate Change and Energy Efficiency CSIRO. Natl. Res. Flagships 2009, 1–81. [Google Scholar]
  24. Roldán, A.; Salinas-Garcia, J.; Alguacil, M.; Caravaca, F. Changes in soil enzyme activity, fertility, aggregation and C sequestration mediated by conservation tillage practices and water regime in a maize field. Appl. Soil Ecol. 2005, 3, 11–20. [Google Scholar] [CrossRef]
  25. Báez, M.A.; Aguirre, M.J.F. Efecto de la Labranza de Conservación sobre las propiedades del suelo. Terra Latinoam. 2011, 29, 113–121. [Google Scholar]
  26. Zamora-Morales, B.; Mendoza-Cariño, M.; Sangerman-Jarquín, D.; Quevedo, A.; Bravo, A. La investigación científica en México: Secuestro de carbono orgánico en suelos agrícolas y de agostadero. Rev. Mex. Cienc. Agríc. 2019, 10, 155–164. [Google Scholar] [CrossRef] [Green Version]
  27. Semarnat, I. México Quinta Comunicación Nacional Ante la Convención Marco de las Naciones Unidas Sobre el Cambio Climático, 1st ed.; Secretaria de Medio Ambiente y Recursos Naturales: Ciudad de México, Mexico, 2012; p. 396. [Google Scholar]
  28. Cotler, H.; Martínez, M.; Etchevers, J.D. Carbono orgánico en suelos agrícolas de México: Investigación y políticas públicas. Terra Latinoam. 2016, 34, 125–138. [Google Scholar]
  29. Salinas-Garcia, J.; Baez-Gonzalez, A.; Tiscareno-Lopez, M.; Rosales-Robles, E. Residue removal and tillage interaction effects on soil properties under rain-fed corn production in Central Mexico. Soil Tillage Res. 2001, 59, 67–69. [Google Scholar] [CrossRef]
  30. Follett, R.F.; Castellanos, J.Z.; Buenger, E.D. Carbon dynamics and sequestration in an irrigated Vertisol in Central Mexico. Soil Tillage Res. 2005, 83, 148–158. [Google Scholar] [CrossRef]
  31. González-Molina, L.; Etchevers-Barra, J.; Paz-Pellat, F.; Diaz-Solis, H.; Fuentes-Ponce, M.; Covaleda-Ocon, S.; Pando-Moreno, M. Performance of the RothC-26.3 model in short-term experiments in Mexican sites and systems. J. Agric. Sci. 2011, 149, 415–425. [Google Scholar] [CrossRef]
  32. Ruíz, C.J.A.; Pimienta, B.E.; Zañudo, H.J. Regiones térmicas óptimas y marginales para el cultivo de Agave tequilana en el estado de Jalisco. Agrociencia 2002, 36, 41–53. [Google Scholar]
  33. Consejo Regulador Del Tequila, A.C. Información Estadística. CRT. 2020. Available online: https://www.crt.org.mx/EstadisticasCRTweb/. (accessed on 14 July 2020).
  34. Herrera-Pérez, L.; Juárez-Sánchez, J.; Ramírez-Valverde, B.; Hernández-Placencia, J. El cultivo de Agave tequilana Weber por pequeños productores de Tequila, Jalisco. AGROProductividad 2013, 6, 21–27. [Google Scholar]
  35. Herrera-Pérez, L.; Valtierra-Pacheco, E.; Ocampo-Fletes, I.; Tornero-Campante, M.A.; Hernández-Plascencia, J.A.; Rodríguez-Macías, R. Prácticas agroecológicas en Agave tequilana Weber bajo dos sistemas de cultivo en Tequila, Jalisco. Rev. Mex. De Cienc. Agrícolas 2017, 8, 3711–3724. [Google Scholar] [CrossRef] [Green Version]
  36. Moreno, A.H.; Estrella, N.; Escobedo, S.; Bustamante, A.; Gerritsen, P. Prácticas de manejo agronómico para la sustentabilidad: Características y medición en Agave tequilana weber en la región Sierra de Amula, Jalisco. Trop. Subtrop. Agroecosys 2011, 4, 159–169. [Google Scholar]
  37. Medina, G.G.; Ruíz, C.J.A.; Martínez, P.R.A. Los Climas de México: Una Estratificación Ambiental Basada en el Componente Climático, 1st ed.; Instituto Nacional de Investigaciones Forestales, Agrícolas y Pecuarias: Guadalajara, Mexico, 1998; p. 99. [Google Scholar]
  38. Secretaría de Medio Ambiente Y Recursos Naturales. NOM-021-RECNAT-2000 Especificaciones de Fertilidad, Salinidad y Clasificación de Suelos. Diario Oficial de la Federación, 31 December 2002. Available online: http://dof.gob.mx/nota_detalle.php?codigo=717582&fecha=31/12/2002(accessed on 21 July 2020).
  39. Cueto, A.W. Red de laboratorios para el análisis, uso, conservación y manejo del suelo (REDLAB). In Proceedings of the Taller regional de armonización de laboratorios de suelos para América Latina y el Caribe y lanzamiento de la Red Latinoamericana de Laboratorios de Suelos (LATSOLAN), Texcoco, Mexico, 1–3 March 2018. [Google Scholar]
  40. Castellanos, J.; Uvalle-Bueno, J.; Aguilar-Santelises, A. Manual de Interpretación de Análisis de Suelos y Aguas, 2nd ed.; Instituto de Capacitación para la Productividad Agrícola: Mexico City, Mexico, 2000. [Google Scholar]
  41. Ruíz, J.; Medina, G.; González, I.; Flores, H.; Ramírez, G.; Ortíz, C.; Byerly, K.; Martínez, R. Requerimientos Agroecológicos de Cultivos, 2nd ed.; Instituto Nacional de Investigaciones Forestales, Agrícolas y Pecuarias: Guadalajara, Mexico, 2013; p. 564. [Google Scholar]
  42. Martínez, H.E.; Fuentes, J.P.E.; Acevedo, E.H. Carbono orgánico y propiedades del suelo. R. Cienc. Suelo Nutr. Veg. 2008, 8, 68–96. [Google Scholar] [CrossRef]
  43. Singh, B.K.; Walker, J.A.; Morgan, W.; Wright, D.J. Effect of soil pH on the biodegradation of Chlorpyrifos and isolation of a Chlorpyrifos-Degrading bacterium. Appl. Environ. Microbiol. 2003, 69, 5198–5206. [Google Scholar] [CrossRef] [Green Version]
  44. Geissen, V.; Morales, G. Fertility of tropical soils under different land use systems-a case of study of soils in Tabasco, México. Appl. Soil Ecol. 2006, 31, 169–178. [Google Scholar] [CrossRef]
  45. Antúnez, B.A.; Felmer, E.S.; Vidal, S.M.; Morales, J.R.; Coz, L.E.; Fuentes, F.F. Propiedades Físico-Hídricas del Suelo en el Cultivo del Maíz Grano. In Riego por Pulsos en Maíz Grano, 1st ed.; Instituto de Investigaciones Agropecuarias: Rengo, Chile, 2015; pp. 31–50. [Google Scholar]
  46. Halvorson, A.D.; Reule, C.A.; Follett, R.F. Nitrogen fertilization effects on soil carbon and nitrogen in a dryland cropping system. Soil Sci. Soc. Am. J. 1999, 63, 912–917. [Google Scholar] [CrossRef]
  47. Du, Z.; Liu, S.; Li, K.; Ren, T. Soil organic carbon and physical quality as influenced by long-term application of residue and mineral fertilizer in the North China Plain. Soil Res. 2009, 47, 585–591. [Google Scholar] [CrossRef]
  48. Srinivasarao, C.; Deshpande, A.; Venkateswarlu, B.; Lal, R.; Singh, A.K.; Kundu, S.; Vittal, K.; Mishra, P.; Prasad, J.; Mandal, U. Grain yield and carbon sequestration potential of post monsoon sorghum cultivation in Vertisols in the semiarid tropics of central India. Geoderma 2012, 175, 90–97. [Google Scholar] [CrossRef]
  49. Frey, S.D.; Ollinger, S.; Nadelhoffer, K.E.; Bowden, R.; Brzostek, E.; Burton, A.; Caldwell, B.; Crow, S.; Goodale, C.L.; Grandy, A.S. Chronic nitrogen additions suppress decomposition and sequester soil carbon in temperate forests. Biogeochemistry 2014, 121, 305–316. [Google Scholar] [CrossRef]
  50. Windeatt, J.H.; Ross, A.B.; Williams, P.T.; Forster, P.M.; Nahil, M.A.; Singh, S. Characteristics of biochars from crop residues: Potential for carbon sequestration and soil amendment. J. Environ. Manag. 2014, 146, 189–197. [Google Scholar] [CrossRef] [PubMed]
  51. Nayak, A.; Gangwar, B.; Shukla, A.K.; Mazumdar, S.P.; Kumar, A.; Raja, R.; Kumar, A.; Kumar, V.; Rai, P.; Mohan, U. Long-term effect of different integrated nutrient management on soil organic carbon and its fractions and sustainability of rice–wheat system in Indo Gangetic Plains of India. Field Crop. Res. 2012, 127, 129–139. [Google Scholar] [CrossRef]
  52. Álvarez, R. A review of nitrogen fertilizer and conservation tillage effects on soil organic carbon storage. Soil Use Manag. 2005, 21, 38–52. [Google Scholar] [CrossRef]
  53. Poirier, V.; Angers, D.A.; Rochette, P.; Chantigny, M.H.; Ziadi, N.; Tremblay, G.; Fortin, J. Interactive effects of tillage and mineral fertilization on soil carbon profiles. Soil Sci. Soc. Am. J. 2009, 73, 255–261. [Google Scholar] [CrossRef]
Figure 1. Selected study locations, Acatic, Arandas, and Tepatitlán, Jalisco.
Sustainability 13 00208 g001
Figure 2. Percentages trend of total organic carbon in the soil in relation to the independent variables. BD—bulk density; TN—total nitrogen; pH; EC—electrical conductivity; and SP—saturation point.
Sustainability 13 00208 g002
Figure 3. Regression and classification tree (CART) resulting from the correlation of the carbon percentage with all the independent variables.
Sustainability 13 00208 g003
Figure 4. Intervals of means of the total organic carbon percentages in the soil of the three sites studied.
Sustainability 13 00208 g004
Table 1. Characteristics of the three study locations.
CharacteristicsArandasTepatitlánAcatic
Geographical location20° 39′ 59.5″ N
102° 22′ 02.0″ W
20° 51′ 03.8″ N
102° 42′ 59.8″ W
20° 48′ 15.6″ N
102° 55′ 08.8″ W
Elevation (masl)1670–23701270–18061164–2270
ClimateSemi-warm
Semi-humid
Semi-warm
Semi-humid
Semi-warm
Semi-humid
Average anual temperature (°C)17.317.818.7
Tmax (°C)30.229.130.7
Tmin (°C)5.45.86.2
Rainfall (mm)919868900
WRBVertisolLuvisolLuvisol
Source: Medina et al. [37].
Table 2. Parameters, methods, and equipment used in the analysis of soils samples.
ParameterMethodEquipment
pHPotenciometer
Electrical conductivity (dSm−1)NOM-021-RECNAT-2000
(AS-02) [38]
Potenciometer
Saturation point (%)Saturation column
Bulk density
(g cm−3)
Richards graduated cylinder method50 mL graduated cylinder
Total nitrogen
(%)
Protocol proposed by the Red
Nacional de Laboratorios para el análisis, uso, conservación y manejo del suelo [39]
Automated elemental analyzer with a thermal conductivity detector.
Total organic carbon (%)Thermo Scientific (Flash 2000)
Table 3. Mean and standard deviation of each evaluated parameter and location.
ParameterLocation
ArandasTepatitlánAcatic
pH6.146 (±0.344)6.366 (±0.205)7.440 (±0.241)
Electrical conductivity (dSm−1)0.294 (±0.187)0.271 (±0.123)0.153 (±0.037)
Bulk density (g cm−3)1.311 (±0.035)1.310 (±0.026)1.285 (±0.038)
Soil-water saturation (%)47.00 (±0.356)45.167 (±2.596)18.27 (±1.376)
Total nitrogen (%)0.174 (±0.023)0.164 (±0.041)0.135 (±0.046)
Total organic carbon (%)2.109 (±0.035)1.840 (±0.035)1.269 (±0.035)
Table 4. Correlation models between the percentage of total organic carbon in the soil and independent variables in agave plantations.
VariableModelEquationR2
BDPotentialTOC = 0.8863 × BD 2.41270.0501
TNPolynomialTOC = (−35.066 × TN2) + (20.75 × TN) − 0.60180.6806
pHExponentialTOC = 9.459 e(−0.26 × pH)0.3276
ECPolynomialTOC = (−0.8322 × EC2) + (2.3723 × EC) + 0.69310.4099
SPPolynomialTOC = (−0.0415 × SP2) + (3.9953 × SP) − 94.249 0.2420
TOC—total organic carbon; BD—bulk density; TN—total nitrogen; pH; EC—electrical conductivity; and SP—saturation point.
Table 5. Pearson correlation (R) between the soil variables of Agave tequilana cultivated area.
TOCECSPBDTNpH
TOC1.001.60 × 10−40.0100.312.40 × 10−95.20 × 10⁻⁴
EC0.591.000.380.351.70 × 10−30.26
SP0.440.161.000.630.090.01
BD0.17−0.160.091.000.570.06
TN0.810.510.290.1001.000.22
pH−0.55−0.19−0.43−0.31−0.211.00
Table 6. Coefficients of the multiple linear regression model with all the independent variables.
VariableValueStandard Errort ValuePr (>|t|)
Intercept−0.32852.1998−0.14930.8824
pH−0.22000.0670−3.28500.0027
EC0.28690.14082.03710.0512
SP0.03400.02661.27740.2120
AD0.4861.10180.44110.6625
TN7.30641.10386.61900.0000
Table 7. Values of the Akaike information criterion (AIC), according to the variables included in the model.
AICVariables
1.6235pH + EC + SP + BD + TN
1.5502pH + EC + SP + TN
1.5323pH + EC + TN
Table 8. Coefficients of the multiple linear regression model with the significant variables.
VariableValueStandard Errort ValuePr (>|t|)
Intercept2.10990.44914.69860.0001
pH−0.25950.05834.44960.0001
EC0.26790.13561.97640.0574
TN7.61721.06997.11960.0000
Table 9. Analysis of variance of the percentages of total organic carbon in relation to the three sites studied (Acatic, Tepatitlán, and Arandas).
Variance FactorSSdfMSFp Value
Model4.422.002.2123.29<0.0001
Site4.422.002.2123.29<0.0001
Error3.1333.00.09
Total7.5535.0
Publisher’s Note: MDPI stays neutral with regard to jurisdictional claims in published maps and institutional affiliations.

