Article

An Integrated Approach to the Realization of Saudi Arabia’s Energy Sustainability

by
Mohammed Siddig H. Mohammed
1,*,
Abdulsalam Alhawsawi
1,2 and
Abdelfattah Y. Soliman
1
1
Department of Nuclear Engineering, Faculty of Engineering, King Abdulaziz University, P.O. Box 80204, Jeddah 21589, Saudi Arabia
2
Center for Training & Radiation Prevention, King Abdulaziz University, P.O. Box 80204, Jeddah 21589, Saudi Arabia
*
Author to whom correspondence should be addressed.
Sustainability 2021, 13(1), 205; https://doi.org/10.3390/su13010205
Submission received: 17 November 2020 / Revised: 16 December 2020 / Accepted: 17 December 2020 / Published: 28 December 2020
(This article belongs to the Collection Secure and Sustainable Energy System)

Abstract

:
As system thinking is a recognized approach to the comprehension and realization of energy sustainability, this paper applies a holistic representation to the World Energy Trilemma Index (WETI) key indicators using Bayesian Belief Networks (BBN) to illuminate the probabilistic information of their influences in Saudi Arabia’s context. The reached realization is suggested to inform the policies to improve energy sustainability, and thus the country’s rank in the WETI. The analysis used two groups of learning cases, one used the energy statistics of the period from 1995 to 2019 to show the outlook of the Business as Usual path, and the other addressed the projected data for the period from 2018 to 2037 to investigate the expected impact of the new policies. For both BAU and new policies, the BBN calculated the improvement, stability, and declining beliefs. The most influential factors on energy sustainability performance were the electricity generation mix, CO2 emissions, energy intensity, and energy storage. Moreover, the interlinkage between the influential indicators and their causes was estimated in the new policies model. A back-casting analysis was carried out to show the changes required to drive the improvement belief to 100%. The compiled BBN can be used to support structuring policymaking and analyzing the projections’ outcomes by investigating different scenarios for improvement probabilities of energy sustainability.

1. Introduction

The United Nations’ (UN) 2030 agenda for Sustainable Development was announced in 2015 under the main title and objective of “Transforming Our World,” and indeed, the world is witnessing transformations that are implemented and measured by the 17 Sustainable Development Goals (SDGs) and their indicators [1].
The SDG seven aims to ensure access to affordable, reliable, sustainable, and modern energy for all the world’s population. The interaction of SDG 7 targets with the targets of SDG 1: No poverty, SDG 2: Zero hunger, SDG 3: Good health and wellbeing, SDG 6: Clean water and sanitation, SDG 8: Decent work and economic growth, and SDG 13: Climate actions have been analyzed and the mutual impacts identified to be reinforcing, enabling, or constraining. In addition, the mutual influence between SDG 7 and the other 16 SDGs has been presented [2], which demonstrated that energy sustainability is crucial for sustainable development.
The discussion and analysis of energy sustainability have been approached in the literature by several methods. A procedure has been proposed to evaluate the Sustainable Useful Index of energy-producing processes. The index assesses the ability to maintain the viability and usefulness of energy sources considering the produced, spent, avoided, and direct energy. The definition does not satisfy the broad concept of energy sustainability [3]. Within the same perspective, energy sustainability analysis has been performed at short-term and long-term levels and applied to a case study on the production of distributed H2O [4].
Energy sustainability analysis for developing countries in the light of SDGs has been attempted. However, the authors limited the discussion on the role of a hybrid power system in improving energy sustainability in urban areas making a case study based on data from an Iranian city [5].
The authors of [6] have studied non-renewable energy and renewable energy efficiency for simultaneous achievement of economic growth and environmental sustainability in the Middle East and North Africa. The scope of the study has not included some important aspects of energy sustainability, such as the social dimension (energy equity and affordability).
Grigoroudis et al. presented a definition and mathematical model based on various indicators that cover the adequacy, reliability, affordability, social, and environmental requirements. The model rates energy sustainability on a 0 to 1 scale using Fuzzy Logic reasoning. The methodology is more integrated than the previous studies, however, one shortcoming is the potential subjectivity associated with assessment by Fuzzy Evaluation [7].
One of the comprehensive and informative methodologies on the performance of energy sustainability is World’s Energy Trilemma Index (WETI) [8], published since 2010 by The World Energy Council, the UN’s accredited energy body. Consistent with the World Energy Council definition of energy sustainability, the WETI ranks the countries energy performance on three dimensions: Energy security, energy equity, and environmental sustainability. The index helps to assess the effectiveness of energy policies for enabling balanced transition management, perform a comparative analysis using the experiences of countries with relevant socioeconomics and energy infrastructure, and eventually inform the policies on the required adjustments.
The WETI has been investigated using several methods to assess its reliability. The research in [9] has praised the value of the WETI in guiding countries to address the energy trilemma. Nonetheless, it has argued that the preferences among the trilemma can change from country to country, which requires weighing the trilemma dimensions adaptably. The research suggested the use of interval decision making and stochastic multicriteria acceptability analysis to measure countries’ energy performance, and developed an alternative ranking scheme. In another contribution to addressing the preference variation of the trilemma dimensions, the interval decision matrix and the principal component analysis were used to evaluate the top ten performers in the 2015 version of WETI and produce a comparison rank that debated the weights assigned to the WETI indicators [10]. Principal Component Analysis has been applied to assess the methodology of the WETI using Pearson Correlation test, Kaiser–Meyer–Olkin Measure of Sampling Adequacy and Bartlett’s Test of Sphericity. The conclusion was made from the results of Cronbach’s Alpha test, and the authors deemed the WETI ranking unreliable [11].
Nevertheless, the methodology of WETI has been revised over the years since its first release, the most recent revisions were in the 2019 version that included the data sources, indicators, weighting, and indexation [8] (p. 42) and further refinements in 2020 report [12] (p. 63).
The ranking is based on grading the performance of each of the dimensions from A to D. Although Saudi Arabia is the world’s leading oil producer and is among the top 20 countries in terms of Gross Domestic Product (GDP) [13], it was ranked 78 out of 127 in the 2019 WETI, mainly because of the poor performance in the Environmental Sustainability dimension scoring 35/100 (D) and the average performance in the Energy Security 55/100 (C), while scoring 98/100 (A) in the Energy Equity.
Saudi Arabia’s ranking in 2019 retreated from positions 47, 53, and 47 in the years 2016, 2017, and 2018, respectively. In the years from 2016 to 2018, Saudi Arabia kept a consistent grade of BAD. Therefore, the comparative ranking fluctuation could be attributed to the performances of other countries as their ranks were rolling up and down. The downgrade in 2019 ranking is mainly due to the decline in the energy security dimension that has consistently been graded with B due to lack of energy diversity in the past three years, to a C grade in 2019, which again can be attributed to the outpace of other countries besides the geopolitical tensions in the region. The strength of Saudi Arabia in the energy trilemma is in the energy equity dimension due to the availability and affordability of fuel and electricity.
The 2020 WETI was released recently [12]. Saudi Arabia is ranked 55 out of 108 countries, however, the progress from 78 in 2019 does not indicate a corresponding improvement in energy sustainability performance since the grade is still BAD. The quasi progress could be because fewer countries were included in 2020 and also because of the performance swings of the other countries.
In 2018, Saudi Arabia’s total primary energy supply was 133,291 ktoe of oil and 78,009 ktoe of natural gas, 221,836 GWh of the electricity was generated from natural gas, 125,860 GWh from oil, and 155 GWh from solar Photovoltaic (Solar PV) [14]. The access to electricity covers 100% of the population [15], and the fuel and electricity prices, although they have recently been witnessing subsidies reforms, are still affordable. The presented figures explain Saudi’s Energy Trilemma Index high score in energy equity and the low score of environmental sustainability. Moreover, the statistics show the reliance of the Saudi economy and the energy sector on oil and gas consumption and exports, which impacts the energy security score.
However, in recent years, and simultaneously with the efforts of the world to undergo an unprecedented transition to sustainable development, Saudi Arabia has announced an ambitious transformation plan known as Vision 2030 [16] that was built around three pillars: A vibrant society, a thriving economy, and an ambitious nation. One of the objectives of the vibrant society pillar is the maintenance of environmental sustainability, with one of its measures being the reduction of air pollution. The thriving economy pillar mainly aims at economic diversification, and it includes the objective of introducing renewables to the country’s energy mix, increasing the production of natural gas, and controlling energy consumption by introducing plans for fuel-targeted subsidies. The objectives mentioned above support the implementation of programs that can lead to enhancing energy security and environmental sustainability.
There are two main trends in the literature about the energy sector in Saudi Arabia, one is about alternative energy sources, mainly renewables, and the other is on energy economics. The status and potential of renewable energy resources in Saudi Arabia have been reviewed, and the possible roles of renewable energy in developing policies for secured and cost-effective energy have been examined [17]. Renewable energy solutions for the challenge of increasing oil consumption in Saudi Arabia have been discussed as well as the outlook of energy cost and clean environment [18]. The human resources requirements to meet the future of renewables in Saudi Arabia have been presented [19].
Regarding energy economics, different policy scenarios to decouple the reduction in fuel consumption and energy cost increase or optimizing the prices of industrial fuels and household electricity [20,21,22] to seek a more efficient energy system have been discussed.
The presented literature gives useful insights and solutions, however, they considered siloed elements of the energy system, which have not addressed the holism of energy sustainability.
This work proposes to apply the holistic approach of the system thinking [23] utilizing Bayesian Belief Network (BBN) to examine the influences of the indicators underpinning the implementation of energy security, energy equity, and environmental sustainability in Saudi Arabia’s context. The reached comprehension uncovers the probabilities of the impact and mutual interactions between the indicators and the likelihood of changes. The proposed method can support decision-making in energy policy prioritization, schedule, or amendments that can result in the improvement of Saudi’s energy sustainability and WETI rank.

2. Materials and Methods

BBN represents the probabilistic relationships between a set of variables in a Directed Acyclic Graph (DAG). The DAG is composed of nodes to denote the variables and links (arrows) to represent the causal connection between the variables. The relationship between the causes and effects is described by Conditional Probability Tables (CPT) to identify the belief that the effect variable will be in a specific state given the state of the cause variable.
If a state of a variable is changed, the change is transmitted through the links, and the network is solved using Bayes’ theorem.
P A | B = P ( B | A )   P A   P B
where P(A) is the prior distribution of variable A, P(A|B) is the posterior distribution (the probability of A given new data B), and P(B|A) the likelihood function [24] (p. 6).
Introductions and a detailed formal definition of BBN are given in [25,26,27].
In energy systems and energy policy, the BBN has been for providing a tool for policymaking in the renewable energy sector [28], decision-making in clean energy investment [29], assessment of power systems [30], and the integration of renewables into the grids [31].
BBN is used in this paper to examine the influences of some WETI indicators on energy sustainability in Saudi Arabia.
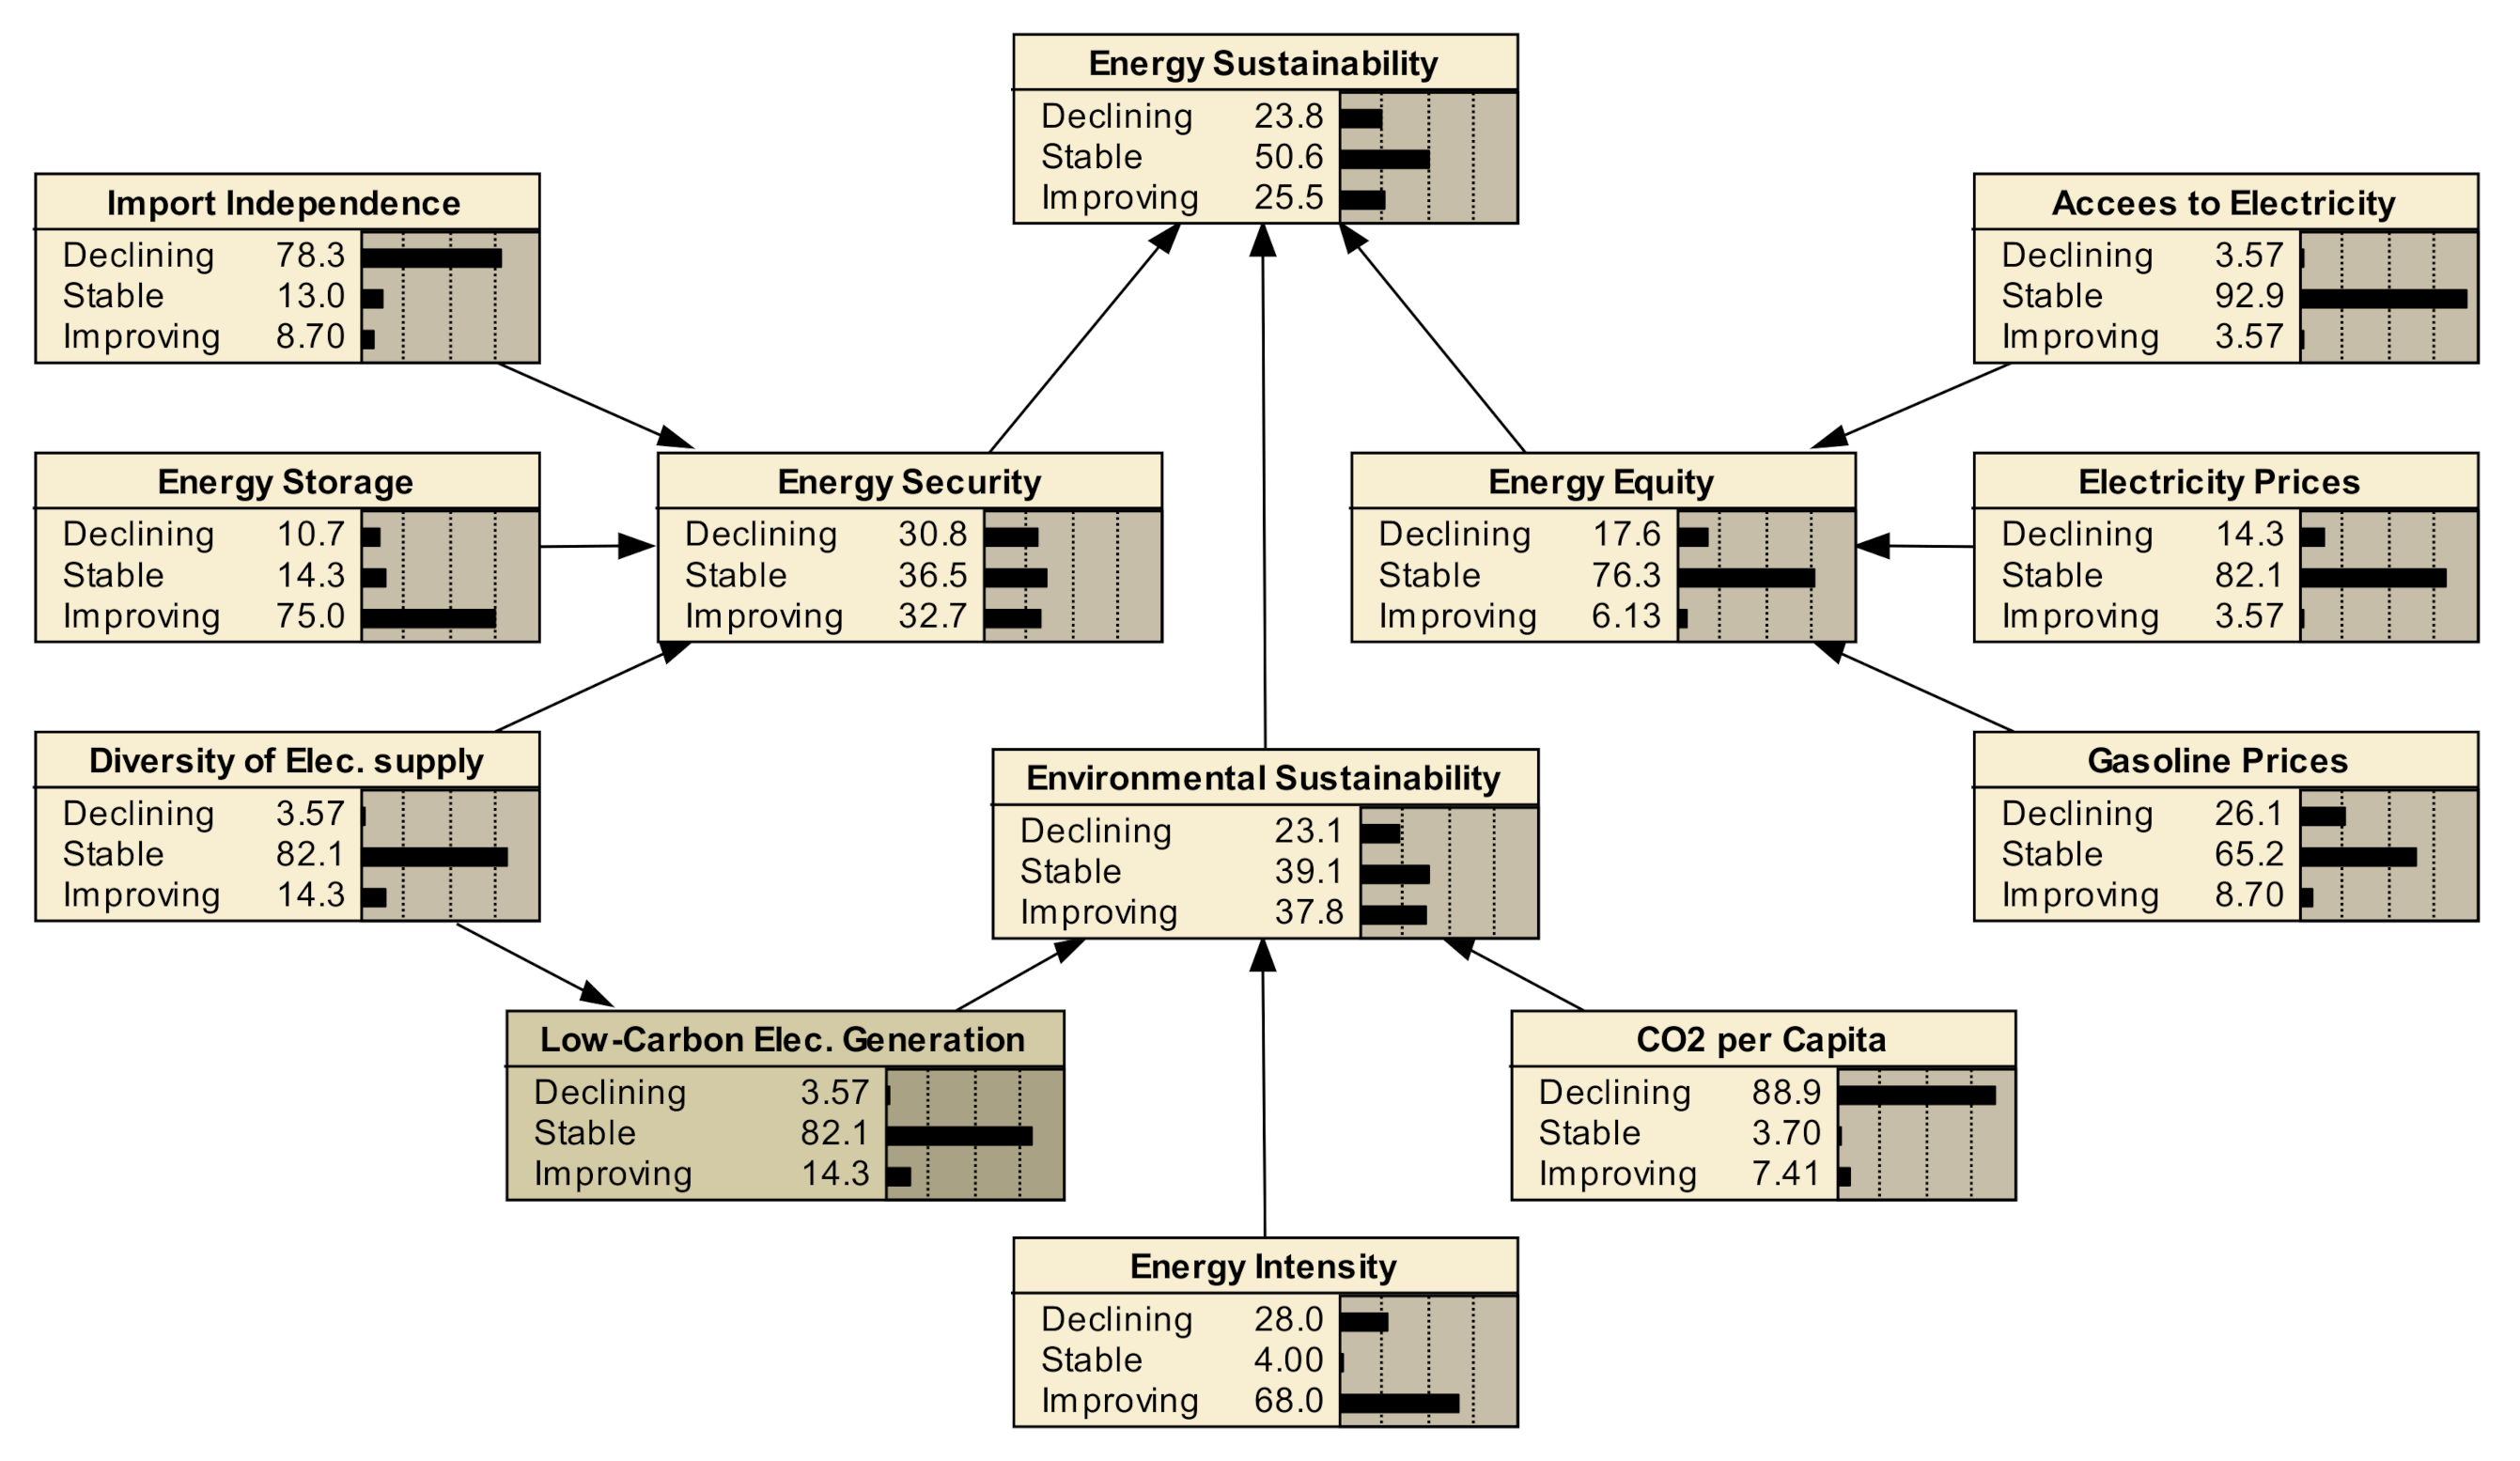
The calculation of the WETI is based on 32 indicators, however, twelve key metrics are used in the countries’ profiles to exhibit the performance. This paper considers nine key metrics shown in Figure 1, generated using Vensim system dynamics simulation software. The remaining three key metrics of the fourth dimension, the country context, are beyond the current scope.
Cases of examples or experiences data are provided to train the BBN to capture the believed states in different scenarios. The datasets measuring the indicators between the years 1990 and 2019 were obtained from various sources cited in Table 1, used to train the constructed BBN. Table 1 contains 25 cases, with each row being a case.
The oil refinery capacities were used to indicate the energy storage capacity, and the share of renewables in the electricity mix was used as an input for two indicators: Diversity of electricity generation and low-carbon electricity generation.
The selected metrics were represented using BBN. The states of the variables in the BBN were drawn from the data in Table 1. The states were described as declining, stable, or improving according to the comparison of the measurement of the specified year to the average of the preceding five years. If the change percent is zero, the state is named stable. Positive and negative percentages are named improving or declining depending on the specific indicator, for example, a negative change in CO2 emission is an improvement. The states of the indicators are given in Table 2.
However, the changes in the electricity generation sources were treated differently because the growth in the renewables shares in the electricity mix was negligible from 2008 to 2014, so they were not considered improvements. Then, from 2015 to 2019, the states were based on calculating the annual growth.
The states of the nodes in Figure 2 are shown with equal probability distributions indicating that the BBN needs CPTs and training data to be fully functional. The belief networks are implemented using the Netica toolkit [41].
The CPTs for energy security, energy equity, environmental sustainability, and overall energy sustainability were created based on the weights of the variables given in the description of the WETI in Annex A of [8]. For example, the WETI gives the energy security dimension a weight of 30% distributed equally between five indicators, 6% each. Therefore, in CPT of energy security’s three indicators used in this paper, equal probabilities of 0.33 were given to the declining, stable and improving statuses, which means, for instance, if the import independence and energy storage are declining but electricity generation diversity is improving, there will be 0.66 declining, 0.33 improving, and 0% stable probabilities.
For the effect variables, the size of the CPTs is the multiplication product of the numbers of the states of the effect and all its cause nodes. For the causes, it can be described by a marginal probability distribution. The probability tables are given in Appendix A.
The available data for the new policies for the period from 2018 to 2037 was mainly obtained from the energy policy simulator [42] jointly developed by Energy Innovation Policy and Technology LLC and King Abdullah Petroleum Studies and Research Center. The energy policy simulator presents data till 2050, nevertheless, the data of 20 cases (2018–2037) were used to provide a statistically acceptable representation for the near future period. The evaluation of the data to draw the states of the variables was done case by case. For example, the obtained electricity prices were for 2020, 2030, and 2035, so the periods between each interval were split between two states to describe the gradual increase or decrease.
The interconnections between the indicators were considered to recoup the missing data. The energy intensity and the CO2 emission per capita were calculated based on energy efficiency, energy equity, and low-carbon electricity generation. The information of the interconnections is based on an analysis of Saudi Arabia’s CO2 emissions drop in 2018 [43]. The energy efficiency was given improving states until 2030 and then stable states to 2037 based on the information in the Saudi Energy Efficiency Program that efficiency will be improved to reach a 20% consumption reduction by 2030 [44].
The states of the indicators are given in Table 3. The CPTs for energy intensity and CO2 per capita are given in Appendix B.

3. Results

Figure 3 shows the results of compiling the BBN using the 25 cases from Table 2, which reveal that the likelihood of improvement in energy sustainability was 25.5%, which is comparable to the declining likelihood of 23.8%, while the most likely prospect was the stability of the existing situation with a 50.6% chance.
Netica was used to carry out a sensitivity analysis, which revealed that the dependence of energy sustainability on energy security is comparable to that on environmental sustainability, and the strength of the energy equity effect is half of that of the other two dimensions. By taking the analysis to the level of the indicators, the most influential indicators were the diversity of the electricity supply followed by the energy intensity and then energy storage.
The used toolkit allows examining different scenarios by altering the states of the different variables. For example, a back-casting scenario was created by setting the improvement probability for energy sustainability to 100% and looking at changes imposed in the probabilities of the states of the cause variables (Figure 4). The back-casting results reaffirmed the previous sensitivity analysis. They showed that the most required improvement should be by further 12.5% in the diversity of electricity generation, which tacitly drives another 12.5% improvement in the share of low-carbon electricity generation, then 12.8% in energy intensity, and 8.2% in energy storage.
Similarly, many small incremental changes in the states of any of the variables can be attempted to examine the most probable routes for the improvement of each dimension or that of the overall energy sustainability.
The compiled BBN for the BAU path did not account for the interconnections between the variables. For example, the impact of low-carbon electricity generation on the CO2 emissions, fuel prices on energy intensity, and electricity generation mix on the affordability. The reason is that the paper studies the specific case of Saudi Arabia’s performance, where actual data that already represent the sum measurements are available and do not need further calculation or elicitation.
However, some of the interconnections were estimated to assess the energy sustainability landscape in the light of policy changes in the Saudi 2030 Vision (Figure 5). The improvement likelihood of energy sustainability was 33.6%, with a 53% probability that the performance will be steady during the specified period. The back-casting (Figure 6) and sensitivity analysis showed that the most influential group of indicators is that composed of the diversity of electricity generation, CO2 emission per capita, and energy intensity, respectively, in terms of the magnitudes of their strength. The groups in the second order of influence were energy storage and import independence with comparable strengths.

4. Discussion

System thinking is an appropriate approach to study energy sustainability policies. Probabilistic and mathematical modeling enables a formal realization of energy sustainability dynamics.
Applying Bayesian Belief Networks to Saudi Arabia’s context quantified the probability of improvement, decline, and steadiness of the Business as Usual scenario pertaining to the identified energy sustainability dimensions. A similar method was used by Daim et al. to support policy design in the state of Oregon, USA. It differs from the method in this paper in that the BBNs have been constructed by conversion from Causal Maps, which were developed by consulting experts and energy authorities in Oregon. The step of generating the Causal Maps is analogous to the adoption of the WETI indicators (causes) and dimensions (effects) in this work. The results offered networks with probabilities like those shown in Section 3, Figure 3, Figure 4, Figure 5 and Figure 6, describing the different states of the correlated factors [29].
The BBN application presented in [28] has sought a higher accuracy in the construction of the BBN by applying an augmented naive model to the quantitative data and k-folds analysis of the Bayesian models. The researchers examined the best scenarios to inform policymaking in Italy and Germany concerning geothermal energy and hydro energy. Another study aimed at computing probabilities of power system states to enable renewable energy integration into smart grids and improve power flow control. The approach addressed a more sophisticated issue of real-time modeling of power systems [31].
The scope of the previous studies was limited to exploring the scenarios of nuclear energy, renewable energy, and investments in different contexts. The contribution of this work is the use of BBN to model the entire energy sustainability system covering energy security, energy equity, and environmental sustainability.
This research was performed before the release of 2020 WETI. Saudi Arabia’s 2020 profile shows slight changes compared to 2019 scores: From 55 to 59.9 in energy security, from 98 to 99 in energy equity, and from 35 to 44.3 in environmental sustainability [45]. The change extent supports the findings of the research depicted in Figure 3 and described in Section 3 concerning the energy policy Business as Usual scenario.
For the 2030 policies, the study provided a tool to devise numerous states of each policy and evaluate the propagation of their impact to assist in identifying the critical engagements to achieve energy sustainability. For instance, CO2 per capita and energy intensity are interlinked with the parent variables being energy efficiency and energy equity, and the impact of the latter was mainly due to the fluctuations in the electricity prices. Therefore, the joint impact of energy efficiency and energy prices reform needs equal consideration to that given to energy resources diversification.
BBN is a useful decision support tool that can give insights and an improved understanding of the policy context and allows the examination of several alternatives. The sensitivity analysis that measures the interdependencies between the BBN nodes gives specific information that the policymakers can use to plan the desired adjustments for improved sustainability.
For enhanced accuracy in analyzing the new energy policies, a more complex BBN comprising the 32 indicators of the WETI and their causes is suggested. The most influential indicators identified in the suggested complex BBN can be further investigated to disclose the required finer interventions. Moreover, other system dynamic methods can be applied to attain different perceptions of interdependence.
The projected data can also be reinforced by experts’ judgment and stakeholder consultations to assist the policymakers in optimizing the options. This type of qualitative data can be used in BBN following methods like those described in [16,46] (pp. 11–12).

Author Contributions

Conceptualization, M.S.H.M., A.A. and A.Y.S.; sata curation, M.S.H.M.; investigation, M.S.H.M.; methodology, M.S.H.M.; project administration, A.A.; supervision, M.S.H.M.; validation, M.S.H.M.; writing—original draft, M.S.H.M.; writing—review & editing, M.S.H.M. and A.A. All authors have read and agreed to the published version of the manuscript.

Funding

This project was funded by the Deanship of Scientific Research (DSR) at King Abdulaziz University, Jeddah, under grant No. (J: 65-135-1441). The authors, therefore, acknowledge with thanks DSR for technical and financial support.

Institutional Review Board Statement

Not applicable.

Informed Consent Statement

Not applicable.

Data Availability Statement

Data set available on request to corresponding authors.

Conflicts of Interest

The authors declare no conflict of interest.

Appendix A. Conditional Probability Tables (CPTs) for the Energy Sustainability Network for the Period from 1995 to 2019

Table A1. Energy security CPT.
Import IndependenceEnergy StorageDiversity of Elec. SupplyDecliningStableImproving
DecliningDecliningDeclining10000
DecliningDecliningStable66.66633.3340
DecliningDecliningImproving66.666033.334
DecliningStableDeclining66.66633.3340
DecliningStableStable33.33466.6660
DecliningStableImproving33.33333.33333.333
DecliningImprovingDeclining66.666033.334
DecliningImprovingStable33.33333.33333.333
DecliningImprovingImproving33.333066.667
StableDecliningDeclining66.66633.3340
StableDecliningStable33.33466.6660
StableDecliningImproving33.33333.33333.333
StableStableDeclining33.33466.6660
StableStableStable01000
StableStableImproving066.66633.334
StableImprovingDeclining33.33333.33333.333
StableImprovingStable066.66633.334
StableImprovingImproving033.33366.667
ImprovingDecliningDeclining66.666033.334
ImprovingDecliningStable33.33333.33333.333
ImprovingDecliningImproving33.333066.667
ImprovingStableDeclining33.33333.33333.333
ImprovingStableStable066.66633.334
ImprovingStableImproving033.33366.667
ImprovingImprovingDeclining33.333066.667
ImprovingImprovingStable033.33366.667
ImprovingImprovingImproving00100
Table A2. Energy equity CPT.
Gasoline PricesElectricity PricesAccess to ElectricityDecliningStableImproving
DecliningDecliningDeclining10000
DecliningDecliningStable75250
DecliningDecliningImproving75025
DecliningStableDeclining75250
DecliningStableStable50500
DecliningStableImproving502525
DecliningImprovingDeclining75025
DecliningImprovingStable502525
DecliningImprovingImproving50050
StableDecliningDeclining50500
StableDecliningStable25750
StableDecliningImproving502525
StableStableDeclining25750
StableStableStable01000
StableStableImproving07525
StableImprovingDeclining255025
StableImprovingStable07525
StableImprovingImproving05050
ImprovingDecliningDeclining50050
ImprovingDecliningStable252550
ImprovingDecliningImproving25075
ImprovingStableDeclining252550
ImprovingStableStable05050
ImprovingStableImproving02575
ImprovingImprovingDeclining25075
ImprovingImprovingStable02575
ImprovingImprovingImproving00100
Table A3. Environmental sustainability CPT.
Low-Carbon Elec. GenerationEnergy IntensityCO2 per CapitaDecliningStableImproving
DecliningDecliningDeclining10000
DecliningDecliningStable90100
DecliningDecliningImproving90010
DecliningStableDeclining55450
DecliningStableStable45550
DecliningStableImproving454510
DecliningImprovingDeclining55045
DecliningImprovingStable451045
DecliningImprovingImproving45055
StableDecliningDeclining55450
StableDecliningStable45550
StableDecliningImproving454510
StableStableDeclining10900
StableStableStable01000
StableStableImproving09010
StableImprovingDeclining104545
StableImprovingStable05545
StableImprovingImproving04555
ImprovingDecliningDeclining55045
ImprovingDecliningStable451045
ImprovingDecliningImproving45055
ImprovingStableDeclining104545
ImprovingStableStable05545
ImprovingStableImproving04555
ImprovingImprovingDeclining10090
ImprovingImprovingStable01090
ImprovingImprovingImproving00100
Table A4. Overall energy sustainability CPT.
Energy EquityEnergy SecurityEnvironmental SustainabilityDecliningStableImproving
DecliningDecliningDeclining10000
DecliningDecliningStable66.66733.3330
DecliningDecliningImproving66.667033.333
DecliningStableDeclining66.66733.3330
DecliningStableStable33.33366.6670
DecliningStableImproving33.33333.33333.333
DecliningImprovingDeclining66.667033.333
DecliningImprovingStable33.33333.33333.333
DecliningImprovingImproving33.333066.667
StableDecliningDeclining66.66733.3330
StableDecliningStable33.33366.6670
StableDecliningImproving33.33333.33333.333
StableStableDeclining33.33366.3370
StableStableStable01000
StableStableImproving066.66733.333
StableImprovingDeclining33.33333.33333.333
StableImprovingStable066.66733.333
StableImprovingImproving033.33366.667
ImprovingDecliningDeclining66.667033.333
ImprovingDecliningStable33.33333.33333.333
ImprovingDecliningImproving33.333066.667
ImprovingStableDeclining33.33333.33333.333
ImprovingStableStable066.66733.333
ImprovingStableImproving033.33366.667
ImprovingImprovingDeclining33.333066.667
ImprovingImprovingStable033.33366.667
ImprovingImprovingImproving00100

Appendix B. CPTs for the Energy Intensity and CO2 per Capita for the Period from 2018 to 2037

Table A5. Energy intensity CPT.
Energy EquityEnergy EfficiencyDecliningStableImproving
DecliningDeclining10000
DecliningStable50500
DecliningImproving50050
StableDeclining50500
StableStable01000
StableImproving05050
ImprovingDeclining50050
ImprovingStable05050
ImprovingImproving00100
Table A6. CO2 emissions per capita CPT.
Energy EquityEnergy EfficiencyDecliningStableImproving
DecliningDeclining10000
DecliningStable75250
DecliningImproving75025
StableDeclining25750
StableStable01000
StableImproving07525
ImprovingDeclining25075
ImprovingStable02575
ImprovingImproving00100

References

  1. UN General Assembly. Transforming our World: The 2030 Agenda for Sustainable Development. In Proceedings of the Transforming Our World: The 2030 Agenda for Sustainable Development, New York, NY, USA, 21 October 2015. A/RES/70/1. [Google Scholar]
  2. Griggs, D.; Nilsson, D.J.; Stevance, M.; McCollum, A. A Guide to SDG Interactions: From Science to Implementation; International Council for Science: Paris, France, 2017. [Google Scholar]
  3. Di Addario, M.; Malavè, A.C.L.; Sanfilippo, S.; Fino, D.; Ruggeri, B. Evaluation of sustainable useful index (SUI) by fuzzy approach for energy producing processes. Chem. Eng. Res. Des. 2016, 107, 153–166. [Google Scholar] [CrossRef]
  4. Gómez-Camacho, C.E.; Ruggeri, B. Energy Sustainability Analysis (ESA) of Energy-Producing Processes: A Case Study on Distributed H2 Production. Sustainability 2019, 11, 4911. [Google Scholar] [CrossRef] [Green Version]
  5. Armin Razmjoo, A.; Sumper, A.; Davarpanah, A. Energy sustainability analysis based on SDGs for developing countries. Energy Sour. Part A Recover. Util. Environ. Eff. 2020, 42, 1041–1056. [Google Scholar] [CrossRef]
  6. Ibrahim, M.D.; Alola, A.A. Integrated analysis of energy-economic development-environmental sustainability nexus: Case study of MENA countries. Sci. Total Environ. 2020, 737, 139768. [Google Scholar] [CrossRef] [PubMed]
  7. Grigoroudis, E.; Kouikoglou, V.S.; Phillis, Y.A.; Kanellos, F.D. Energy sustainability: A definition and assessment model. Oper. Res. 2019, 1–41. [Google Scholar] [CrossRef]
  8. Council, W.E.; Wyman, O. World Energy Trilemma Index 2019; World Energy Council: London, UK, 2019. [Google Scholar]
  9. Song, L.; Fu, Y.; Zhou, P.; Lai, K.K. Measuring national energy performance via Energy Trilemma Index: A Stochastic Multicriteria Acceptability Analysis. Energy Econ. 2019, 66, 313–319. [Google Scholar] [CrossRef]
  10. Al Asbahi, A.A.M.H.; Gang, F.Z.; Iqbal, W.; Abass, Q.; Mohsin, M.; Iram, R. Novel approach of Principal Component Analysis method to assess the national energy performance via Energy Trilemma Index. Energy Rep. 2019, 5, 704–713. [Google Scholar] [CrossRef]
  11. Šprajc, P.; Bjegović, M.; Vasić, B. Energy security in decision making and governance—Methodological analysis of energy trilemma index. Renew. Sustain. Energy Rev. 2019, 114, 109341. [Google Scholar] [CrossRef]
  12. Council, W.E.; Wyman, O. World Energy Trilemma Index 2020; World Energy Council: London, UK, 2020. [Google Scholar]
  13. The World Bank. World Bank Data, Gross Domestic Product 2019. 2019. Available online: https://data.worldbank.org/indicator/NY.GDP.MKTP.CD (accessed on 3 June 2020).
  14. IEA. World Energy Balances; International Energy Agency: Paris, France, 2019. [Google Scholar]
  15. The World Bank. Access to Electricity (% of Population), World Bank Data. Available online: https://data.worldbank.org/indicator/EG.ELC.ACCS.ZS (accessed on 3 June 2020).
  16. Kingdom of Saudi Arabia Vision 2030. 2017. Available online: Vision2030.gov.sa (accessed on 1 March 2020).
  17. Amran, Y.H.A.; Amran, Y.H.M.; Alyousef, R.; Alabduljabbar, H. Renewable and sustainable energy production in Saudi Arabia according to Saudi Vision 2030; Current status and future prospects. J. Clean. Prod. 2020, 247, 119602. [Google Scholar] [CrossRef]
  18. Al-Douri, Y.; Waheeb, S.A.; Voon, C.H. Review of the renewable energy outlook in Saudi Arabia. J. Renew. Sustain. Energy 2019, 11, 015906. [Google Scholar] [CrossRef]
  19. Barhoumi, E.M.; Okonkwo, P.C.; Zghaibeh, M.; Belgacem, I.B.; Alkanhal, T.A.; Abo-Khalil, A.G.; Tlili, I. Renewable energy resources and workforce case study Saudi Arabia: Review and recommendations. J. Therm. Anal. Calorim. 2020, 141, 221–230. [Google Scholar] [CrossRef]
  20. Matar, W.; Murphy, F.; Pierru, A.; Rioux, B. Lowering Saudi Arabia’s fuel consumption and energy system costs without increasing end consumer prices. Energy Econ. 2015, 49, 558–569. [Google Scholar] [CrossRef] [Green Version]
  21. Matar, W.; Anwer, M. Jointly reforming the prices of industrial fuels and residential electricity in Saudi Arabia. Energy Policy 2017, 109, 747–756. [Google Scholar] [CrossRef]
  22. Matar, W.; Murphy, F.; Pierru, A.; Rioux, B.; Wogan, D. Efficient industrial energy use: The first step in transitioning Saudi Arabia’s energy mix. Energy Policy 2017, 105, 80–92. [Google Scholar] [CrossRef]
  23. Donella, H.M. Thinking in Systems—A Primer; Earthscan: London, UK, 2009. [Google Scholar]
  24. Pollino, C.A.; Henderson, C. Bayesian Networks: A Guide for Their Application in Natural Resource Management and Policy; Landscape Logic: San Diego, CA, USA, 2010. [Google Scholar]
  25. Jensen, F.V. An Introduction to Bayesian Networks; UCL Press: London, UK, 1996. [Google Scholar]
  26. Holmes, D.E.; Jain, L.C. Introduction to Bayesian Networks. In Innovations in Bayesian Networks; Springer: Berlin/Heidelberg, Germany, 2008; pp. 1–5. [Google Scholar]
  27. Niedermayer, D. An Introduction to Bayesian Networks and Their Contemporary Applications. In Innovations in Bayesian Networks; Springer: Berlin/Heidelberg, Germany, 2008; pp. 117–130. [Google Scholar]
  28. Moldir Zholdasbayeva, S.P.; Vasilios, Z. Bayesian Networks based Policy Making in the Renewable Energy Sector. In Proceedings of the ICAART 2020, Valleta, Malta, 22–24 February 2020. [Google Scholar]
  29. Daim, T.; Kayakutlu, G.; Suharto, Y.; Bayram, Y. Clean energy investment scenarios using the Bayesian network. Int. J. Sustain. Energy 2014, 33, 400–415. [Google Scholar] [CrossRef]
  30. Yu, D.C.; Nguyen, T.C.; Haddawy, P. Bayesian network model for reliability assessment of power systems. IEEE Trans. Power Syst. 1999, 14, 426–432. [Google Scholar] [CrossRef] [Green Version]
  31. Mengshoel, O.J.; Sundararajan, P.K.; Reed, E.; Piao, D.; Johnson, B. Renewable Energy Integration: Bayesian Networks for Probabilistic State Estimation. In International Workshop on Data Analytics for Renewable Energy Integration; Springer: Cham, Switzerland, 2018; pp. 63–82. [Google Scholar]
  32. The World Bank. Energy Imports, Net (% of Energy Use)—Saudi Arabia, World Bank Data. 2014. Available online: https://data.worldbank.org/indicator/EG.IMP.CONS.ZS?locations=SA (accessed on 1 July 2020).
  33. Saudi Arabia Oil Refinery Capacities. 2019. Available online: https://ycharts.com/indicators/saudi_arabia_oil_refinery_capacities (accessed on 19 August 2020).
  34. Our World in Data, Electricity Generation from Low-Carbon Sources. 2019. Available online: https://ourworldindata.org/grapher/low-carbon-electricity?tab=chart&year=latest&country=~SAU (accessed on 30 June 2020).
  35. Our World in Data, Energy Intensity. 2016. Available online: https://ourworldindata.org/grapher/energy-intensity?tab=chart&year=latest&country=~SAU (accessed on 30 June 2020).
  36. Saudi Arabia—CO2 Emissions Per Capita, World Data Atlas. 2018. Available online: https://knoema.com/atlas/Saudi-Arabia/CO2-emissions-per-capita#:~:text=In2018%2CCO2emissionsper,averageannualrateof2.20%25knoema.com (accessed on 20 August 2020).
  37. KAPSARC. Electricity Tariffs in Saudi Arabia, Data Portal. 2018. Available online: https://datasource.kapsarc.org/explore/dataset/electricity-prices-in-saudi-arabia0/table/?disjunctive.consumption_slab&disjunctive.sector&sort=consumption_slab (accessed on 20 August 2020).
  38. KAPSARC. Gasoline Prices, Data Portal. 2014. Available online: https://datasource.kapsarc.org/explore/dataset/gasoline-prices/table/?disjunctive.country&disjunctive.indicator&sort=time_period&refine.country=Saudi+Arabia&refine.indicator=Gasoline+Price+US$%2F+Liter (accessed on 20 August 2020).
  39. Fuel Price Data Saudi Arabia. 2014. Available online: https://energypedia.info/index.php?title=Fuel_Price_Data_Saudi_Arabia&action=formeditenergypedia.com (accessed on 20 August 2020).
  40. Fuel Prices in Saudi Arabia. 2020. Available online: https://www.thefuelprice.com/Fsa/en (accessed on 20 August 2020).
  41. Norsys Software Corp. Netica Application. Available online: https://www.norsys.com/netica.html (accessed on 1 August 2020).
  42. Energy Innovation Policy and Technology LLC and KAPSRC, Policy Solutions, The Energy Policy Simulator. 2020. Available online: https://saudiarabia.energypolicy.solutions/ (accessed on 24 June 2020).
  43. Howarth, N.; Lanza, A.; Al Shehri, T. What Is Behind the Recent Fall in Saudi Arabia’s CO2 Emissions? KAPSARC: Riyadh, Saudi Arabia, 2019. [Google Scholar]
  44. Saudi Energy Efficiency Center. Saudi Energy Efficiency Program. Available online: https://seec.gov.sa/en/about/saudi-energy-efficiency-program/ (accessed on 15 August 2020).
  45. World Energy Council. Saudi Arabia Country Profile. 2020. Available online: https://trilemma.worldenergy.org/#!/country-profile?country=SaudiArabia&year=2020 (accessed on 16 November 2020).
  46. Cain, J. Planning Improvements in Natural Resources Management Guidelines for Using Bayesian Networks to Support the Planning and Management of Development Programmes in the Water Sector and Beyond; Centre for Ecology and Hydrology: Wallingford, UK, 2001. [Google Scholar]
Figure 1. Causes tree energy sustainability using the selected key metrics.
Sustainability 13 00205 g001
Figure 2. Uncompiled BBN of energy sustainability.
Sustainability 13 00205 g002
Figure 3. Compiled energy sustainability network for the period from 1995 to 2019.
Sustainability 13 00205 g003
Figure 4. Back-casting 100% improvement probability of energy sustainability network for the period from 1995 to 2019.
Sustainability 13 00205 g004
Figure 5. Compiled energy sustainability network for the period from 2018 to 2037.
Sustainability 13 00205 g005
Figure 6. Back-casting 100% improvement probability of energy sustainability network for the period from 2019 to 2030.
Sustainability 13 00205 g006
Table 1. Energy statistics for the period from 1990 to 2019. The asterisks mean missing data.
Energy Imports % of Energy Use [32]Oil Refinery Capacities (Million Barrels/Day) [33]Share of Renewables in the Electricity Mix % [34]Energy Intensity (kW-h/2011$) [35]CO2 (Tons/Capita [36]Elect. Prices SR/kWh [37]Gasoline Prices SR/Liter [38,39,40]Access to Elect. (% of Population) [15]
1990−535.1881.86*3.21228211.425880.07*100
1991−586.6821.645*3.54914115.941750.05*100
1992−520.3271.66*2.77335816.494780.05*100
1993−490.7361.67*3.07626617.639030.05*100
1994−449.6321.683*3.80190316.880710.05*100
1995−449.3531.692*3.71712512.592670.050.16100
1996−418.5361.699*3.61788813.568650.05*100
1997−438.4371.704*3.64006211.119450.05*100
1998−420.6691.762*4.06680810.475020.050.16100
1999−372.6681.808*3.59283411.189990.05*100
2000−386.2481.798*3.15580314.341640.050.24100
2001−361.931.805*3.51199413.987640.050.24100
2002−290.7741.809*3.29201714.935860.050.24100
2003−349.8682.049*3.25563514.539890.050.24100
2004−352.9032.074*2.94545417.057460.050.24100
2005−365.8732.102*2.58477216.621250.050.24100
2006−316.282.102*2.37261617.604970.050.16100
2007−289.4522.102*2.29114915.346970.050.16100
2008−266.0082.1020.0002772.0415916.699910.050.16100
2009−211.6092.1090.0002622.42420517.493020.050.16100
2010−186.512.1090.0016312.27228218.879950.050.16100
2011−232.7372.1070.0019071.86623217.605230.050.16100
2012−211.9562.1070.0082891.86931819.316610.050.16100
2013−219.742.5070.0130631.90328317.995340.050.16100
2014−191.5242.8990.0126452.05448619.468130.050.16100
2015*2.8990.0359192.03497419.57530.05*100
2016*2.9010.0348782.03269419.466680.050.299.9
2017*2.8260.037127*19.126450.05*99.93
2018*2.8350.040355*18.436290.180.36100
2019*2.8350.198166* 0.180.36100
Table 2. States of the key indicators for the period from 1995 to 2019. The asterisks mean missing data.
ImportsStorageElec. Gen. DiversityEnergy IntensityCO2/CapitaAccess to Elec.Elec. PricesGas Prices
1StableDecliningStableDecliningDecliningStableDeclining*
2StableImprovingStableDecliningDecliningStableStable*
3StableImprovingStableDecliningDecliningStableStable*
4StableImprovingStableDecliningDecliningStableStable*
5StableImprovingStableImprovingDecliningStableStable*
6StableImprovingStableImprovingDecliningStableStableDeclining
7StableImprovingStableImprovingDecliningStableStableStable
8StableImprovingStableImprovingDecliningStableStableStable
9StableImprovingStableImprovingDecliningStableStableStable
10StableImprovingStableImprovingDecliningStableStableStable
11StableImprovingStableImprovingDecliningStableStableStable
12StableImprovingStableImprovingDecliningStableStableImproving
13StableImprovingStableImprovingDecliningStableStableStable
14StableImprovingStableImprovingDecliningStableStableStable
15StableImprovingStableImprovingDecliningStableStableStable
16StableStableStableImprovingDecliningStableStableStable
17StableStableStableImprovingDecliningStableStableStable
18StableStableStableImprovingDecliningStableStableStable
19StableImprovingStableImprovingDecliningStableStableStable
20StableImprovingStableImprovingDecliningStableStableStable
21StableImprovingStableDecliningDecliningStableStableStable
22StableImprovingStableDecliningDecliningStableStableDeclining
23StableImprovingStable*DecliningStableStableDeclining
24StableImprovingStable*ImprovingStableDecliningDeclining
25StableStableImproving**StableDecliningDeclining
Table 3. States of the key indicators for the period from 2018 to 2037.
ImportsStorageElec. Gen. DiversityEnergy EfficiencyAccess to Elec.Elec. PricesGas Prices
1StableImprovingImprovingImprovingStableDecliningDeclining
2StableDecliningImprovingImprovingStableDecliningDeclining
3ImprovingImprovingStableImprovingStableDecliningStable
4ImprovingImprovingImprovingImprovingStableDecliningStable
5ImprovingImprovingImprovingImprovingStableDecliningStable
6ImprovingImprovingImprovingImprovingStableDecliningStable
7ImprovingImprovingImprovingImprovingStableDecliningStable
8ImprovingImprovingImprovingImprovingStableDecliningStable
9ImprovingImprovingImprovingImprovingStableStableStable
10ImprovingImprovingImprovingImprovingStableStableStable
11DecliningImprovingImprovingImprovingStableStableStable
12DecliningImprovingImprovingImprovingStableStableStable
13DecliningStableStableImprovingStableStableStable
14DecliningStableStableStableStableStableStable
15DecliningStableStableStableStableStableStable
16DecliningStableStableStableStableImprovingStable
17StableStableStableStableStableImprovingStable
18StableStableStableStableStableImprovingStable
19StableStableStableStableStableImprovingStable
20StableStableStableStableStableImprovingStable
Publisher’s Note: MDPI stays neutral with regard to jurisdictional claims in published maps and institutional affiliations.

