Abstract
Corporate investment efficiency (CIE) is an imperative factor influencing the smooth functioning and financial sustainability of an enterprise. The role of a firm life cycle on risk and performance fundamentals has been extensively explored in the literature. However, it remains unclear as to whether the life cycle stages of a firm have any impact on corporate investment efficiency. This paper investigates the role of firm life cycle stages (FLCS) in determining the investment efficiency of 351 Pakistani non-financial listed firms over the course of 12 years (2005–2016). It used panel data fixed effects and ordinary least squares (OLS) techniques to empirically examine the proposed relationship. By employing Dickinson’s FLCS measure, we found that CIE was lower during the introduction and decline stages and higher at the growth and maturity stages of a firm’s life cycle. Moreover, the results of regression analysis revealed that mature firms enjoyed the highest level of investment efficiency followed by the growth firms. Overall, CIE exhibited an inverted U-shaped trend across FLCS. In addition, the findings corroborated the idea that the sample firms could not sustain their investment efficiency when they moved along different stages of the life cycle. Thus, policymakers are suggested to customize their investment policies for each stage of FLC to attain sustainable financial performance throughout the life of a firm.
1. Introduction
1.1. Corporate Financial Sustainability
After the global financial crises of 2007–2009, corporate financial sustainability (CFS) has become a focal area of research for many academicians and practitioners. CFS is defined as “being able to serve the firm’s beneficiaries in the long term.” It is the opposite of having to cease corporate activities simply because the firm has run out of money. Sustainable corporate finance is a multifaceted approach that is based on profit, people, and planet [1]. It indicates that CFS is not only significant for the firm but also carries some social value. Therefore, any financial trouble in an organization will also have adverse effects on its associated social factors (i.e., people and planet) and sustainability in the long-term [2,3]. In a related vein, corporate investment efficiency is characterized as firms’ ability to generate positive net present value (NPV) for all of its projects [4]. Therefore, it necessitates for an enterprise to boost its investment efficiently to become financially sustainable. Conversely, if a firm is unable to generate positive NPV from its projects, sooner or later, it runs out of cash and is promulgated as financially unsustainable. This financial vulnerability does not merely hurt the firm itself but also has adverse implications for its associated social network, such as laborers, suppliers, financial institutions, and tax collection bodies, among others.
1.2. Corporate Life Cycle and Investment Efficiency
The concept of life cycle management is considered to improve the products and services—a linchpin leading to sustainable performance of the enterprise [5]. Scholars have affirmed that firms experience evolution similar to that of human beings—they initially build up, grow, mature, decline, and at some point in time die [6,7]. Firm life cycle (FLC) comprises stages that are the outcomes of changes in external and internal factors, e.g., competitive environment, financial resources, managerial ability, and strategies, among others [8]. Moreover, the contemporary literature demonstrates that FLC stages have direct effects on corporate financial reporting, working capital management, corporate governance policies, bankruptcy risk, and other aspects of decision-making [9,10,11,12,13].
On the other hand, investments in capital projects serve a fertile opportunity for managers to maximize profits and accrue value to the firm. However, the scarcity of resources makes it difficult to allocate substantial resources to a single project for reaping maximum gains. In competing projects, managers have a voluntary power to assign funds. Hence, if corporate managers efficiently allocate funds, it will improve the firm’s investment efficiency, which will be reflected by the sustainable financial performance and enhanced firm value. Although, it is incumbent on financial managers to critically evaluate and invest in prolific projects, scholars confirm that managers rarely distribute the resources efficiently [14,15]. They tend to over-invest or at some time under-invest the funds, which eventually decreases a firm’s investment efficiency [16,17]. A camp of studies has attempted to underpin the reasons behind this inefficient investment behavior of the managers and observed that factors, such as the higher level of free cash flows [17], information asymmetry [18], financial reporting quality [19], diversification [20], and governance structure [17] play an integral role in determining a firm’s investment efficiency. Notwithstanding these significant articulations of asymmetric investment behavior, prior literature has analyzed the corporate investment efficiency (CIE) from a static perspective. Responding to this limitation, the motivation of the current study was to assess the behavior of CIE from the dynamic perspective by incorporating the concept of FLC stages. Therefore, to supplement the extant literature in this domain, we argue that external financial constraints [21] and debt over-hanging [22] have varying effect on a firm’s investment efficiency [23] across the life cycle stages. Therefore, it is reasonable to posit that firm’s investment efficiency may also respond differently to varying stages of FLC. Thus, the current study incorporated the FLC stages to analyze corporate investment efficiency of Pakistani non-financial listed firms for a period of 12 years, spanning 2005 to 2016.
This study found that, compared to the shake-out phase of life cycle, corporate investment efficiency of sampled firms was lower during the introduction and decline stages and higher at the growth and maturity stages of their life cycle. Moreover, the results of a panel data fixed-effects model revealed that mature firms enjoyed the highest level of investment efficiency followed by the growth firms. Overall, CIE exhibited an inverted U-shaped trend across the FLC stages.
The present research enriches the existing strand of literature in multiple ways. First, this study is the first of its kind to provide an insight into the relationship between CIE and FLC. It confirms that corporate investment efficiency is a dynamic indicator of a firm’s performance that tends to change vis-à-vis a firm’s life cycle stages. Second, by using the findings of this study, corporate policymakers can devise an optimal investment policy for each stage of their firm life cycle to improve the investment efficiency. Third, this study also has useful implications for the investors, as by following the results of the present research they can optimize their portfolio by investing only in those firms (i.e., growth and mature) with higher investment efficiency and financial sustainability.
The rest of the article is organized as follows. Section 2 entails a critical review of the literature and frames the research hypotheses; Section 3 presents the data, variables, empirical models, and analysis tools; Section 4 comprises empirical results and discussions; and finally, implications are found in in Section 5.
1.3. Why Pakistan?
We selected Pakistani non-financial listed firms due to the following reasons. First, Pakistan is a cash strap economy with private sector credit to GDP ratio of 17.0% as compared to higher ratios in neighboring countries such as India of 48.8%, and Bangladesh of 47.6%. Second, Pakistani listed firms face several impediments in obtaining loans and, therefore, seek venture capital and raise equity as alternatives [21]. Third, Pakistan has high interest cost of approximately 10.75% in comparison to its regional competitors India (6%) and Bangladesh (7.74%) [24]. Lasty, credit to the private sector consistently declined in Pakistan from the year 2008 to the year 2015 [25], which made it difficult for firms to finance new projects through external borrowings. All these impediments (i.e., low credit to GDP ratio, high interest rate, and limited access to credit) call for the more efficient management of investments for Pakistani listed firms.
2. Literature Review and Hypothesis Development
Investment efficiency is elaborated as “...a function of the risk, return, and total cost of an investment management structure, subject to the fiduciary and other constraints within which the investors must operate” [26]. Although, a range of corporate finance studies determine firm investment efficiency, prior work considers the firm as a static object ignoring the inevitable role of FLC stages to influence corporate investment efficiency.
Corporate life cycle theory posits that firms pass through a predictable order of development stages [27], while investment, financing, and cash policies of the firm fluctuate significantly in accordance with its corresponding development phase [28]. Spence [29] found that firms confront severe resource paucity during the initial phase of the life cycle, which badly affects their ability to compete in a given industry. The authors of [30] underscore that during the introduction stage of the corporate life cycle, firms face scarcity of human capital and financial resources. This state is further aggravated by the information asymmetry surrounding new firms and uncertain future cash flows [31]. Introductory firms generally borrow external funds at higher interest rates [32]. Moreover, higher idiosyncratic volatility, excessive financial costs, escalated bankruptcy risk, high cash holdings, less efficient production processes, and negative returns on the invested capital are deemed some of the characteristics impeding the early staged firms [10,11,16,33,34,35,36].
The second stage of FLC is known as the growth stage. During this phase, firms start to expand their production and sales, thus increasing their inflows. Habib [37] observed that firms begin to generate positive returns at the growth stage of FLC. During this phase, firms enjoy higher profitability and face lower uncertainty about operating cash-flows [8]. Moreover, this stage receives greater analyst coverage, which in turn reduces the information asymmetry [38,39]. Growth staged firms (vs. introductory staged firms) are considered to be more structured in their operations, and have decentralized decision-making. At the growth stage, sales volume and market share surges substantially [40,41], and debt ratio starts declining [32]. Although these firms possess lower level of fixed assets, incremental investments result in growing sales, profits [42], and reasonable market value [43].
The third stage of FLC is known as the mature phase. At this stage, firms are usually large and face lower cash-flow risk, mainly due to diversification and a substantial consumer-base [10]. Mature firms also face less financial vulnerability because of ample availability of resources [44,45]. DeAngelo and Stulz [44] assert that firms at the maturity stage (vs. introductory staged firms) experience higher earnings and returns on assets. Nevertheless, the maturity stage enjoys less uncertainty regarding internal and external operations of the firm; more assets and stable investments create steady profits and cash flows [45]. Furthermore, investors and analysts closely follow these firms, which lowers investors’ uncertainty [38].
The fourth stage, referred to as shakeout stage of FLC, identifies mixed views in prior literature. Some scholars consider this stage as highly exciting, owing to the fact that significant product innovations accrue from it [27,46]. A firm undergoes phenomenal growth and size at this stage as compared to its preceding stages. Contrarily, eminent scholars Gort and Klepper [47] and Wernerfelt [48] claim that at this very point, many products experience decline, while decrease in growth rates leads to declining prices. Dickinson [8] also presented a similar viewpoint. Therefore, by following the work of [13,49,50], we took this stage as the basis for comparing the outcomes of the other stages of the FLC.
The final stage of FLC is known as the decline phase. It is characterized by falling revenues and profit margins. This phenomenon is attributed to an increase in the number of production units working below their stated capacity [47]. Moreover, deteriorating performance and inability to attract new customers are the hallmarks of the decline stage. Liabilities of declining firms usually tend to pile up, which forces a shutdown in the absence of corrective measures [47,51]. This stage continues until the eventual shrinkage of the firm operations induced by the obsolescence of the products and services, or until fundamental changes in the existing technology and product innovation actuate a new firm life cycle [47]. Habib and Hasan [45] assert that investment risk also escalates at the decline stage of the life cycle. Moreover, decline stage firms face a multitude of internal and external challenges and managers are inclined to invest in risky negative NPV ventures in order to appease the investors and portray the idea that investment prospects are still there [52]. Thus, excessive risk-taking at the decline stage normally yields negative returns [49].
On the basis of the aforementioned discussion, we propose the following research hypothesis:
Hypothesis 1 (H1).
Compared to the shakeout stage of the firm life cycle, corporate investment efficiency will be higher during growth and mature stages while lower in the introduction and decline stages of the life cycle.
3. Research Design
3.1. Measurement of Variables
3.1.1. Dependent Variable
The firm’s investment efficiency is the dependent variable of the current study. The simplest definition of investment efficiency is the firm’s ability to achieve positive NPV for all of its projects. In the extant literature, researchers have suggested a vast list of measures to proxy corporate investment efficiency. Keeping this in view, we believe that the use of a single measure of CIE could lead to biased results. Therefore, we employed the following 3 different measures of CIE on the basis of financial ratios of a firm:
- Investment Efficiency (INE1) =
- Investment Efficiency (INE2) =
- Investment Efficiency (INE3) =
In the above-mentioned ratios, the first two were employed to measure the return on investment (ROI) that is commonly used to evaluate the efficiency of an investment. A higher value of ROI denotes higher gains/investment efficiency compared to its cost and vice versa [53]. The third ratio was used to measure the return on assets (ROA) of the sample firms. ROA measures the efficiency of the firm in generating profit by utilizing its asset base [54]. A higher value of ROA signifies the higher benefits earned through capital investments, which indicate the investment efficiency of a firm [55,56].
3.1.2. Explanatory Variable
We used the Dickinson [8] model to categorize the sample firms into different stages of their life cycle. Dickinson (2011) extracted data from the cash flow statement of a firm and introduced a dynamic measure of firm life cycle stages. She argued that firm’s cash flow statement depicts the differences in firm growth, profitability, and risk. Therefore, one can segregate the firms into introduction, growth, maturity, shakeout, and decline stages on the basis of life cycle by using cash flows from operating, investing, and financing activities. We classified all the sample firms into different life cycle stages on the basis of the following cash flow pattern:
- Introduction: if OPCF < 0, INCF < 0 and FCF > 0;
- Growth: if OPCF > 0, INCF < 0 and FCF > 0;
- Mature: if OPCF > 0, INCF < 0 and FCF < 0;
- Decline: if OPCF < 0, INCF > 0 and FCF _ or _ 0; and
- Shakeout: the remaining firms are considered to be in the shakeout stage,
where
- OPCF = cash flow from operations;
- INCF = cash flow from investment;
- FCF = financing cash flows.
3.1.3. Measurements of Control Variables
The regression analysis also controlled for other firm-specific variables (Tobin’s Q, firm size, cash flows, and leverage) that past literature believed to affect the investment efficiency of a firm. These variables were calculated by using the following formulas:
Firm size = Natural log of total asset at year t.
Tobin’s Q is employed as a proxy for the firms’ investment opportunities [57] and was expected to have positive association with CIE. Firm size is a commonly used and important variable in the literature on corporate finance. However, past studies have suggested a large number of measures of firm size, making it difficult to choose the most appropriate variable for a particular study. Therefore, by considering the purpose of current study and following [58], we used natural log of assets as a measure of firm size that anticipated positive effects on firms’ investment efficiency. Similarly, positive cash flows from operations earned higher level of efficiency. On the contrary, leverage was expected to have a negative influence on CIE.
3.2. Why a Cash Flow-Based Measure of the Life Cycle?
Dickinson [8] argued that the cash flow-based measure of firm life cycle stages enable us to understand the non-sequential transition of firms that cannot be captured by using prior sequential proxies. She asserted that a firm has the tendency to revert to a previous stage of the life cycle or jump to a subsequent stage of FLC by skipping one or more stages. However, most of the prior measures of FLCS are non-cyclical as they used static measures such as firm age, sales growth, and size to segregate firms on the basis of different stages of the life cycle. As compared to the conventional life cycle models, the cash flow-based model has two key benefits. First, it reflects the entirety of financial information of the firm rather than being a single measure of firm-related attributes (e.g., firm sales growth, age, size, flexibility, and strategies). Second, it is cyclical in nature and specifies the true state of the business cycle. For that reason, cash flow patterns proxy is a better measure of corporate life cycle stages.
3.3. Data and Sample Selection
The sample of the present study consists of non-financial listed firms on the Pakistan Stock Exchange (PSE) over the time span of 12 years from 2005 to 2016. Initially, we collected data of 369 non-financial listed firms. However, we only considered the firms as part of our sample if they had at least 5 consecutive years data available to calculate dependent and independent variables. This practice yielded a final unbalanced panel of 351 non-financial firms from 14 different industries listed on the PSE. The detailed list of selected sectors are presenting in Table 1. The data to calculate investment efficiency and other control variables (Tobin’s’ Q size, cash flows, and leverage) were extracted from the balance sheet analysis published by the State Bank of Pakistan (SBP). Likewise, the cash flow data to compute firm life cycle stages were obtained from the OSIRIS database. Moreover, annual reports of those firms were also checked to counterpoise the missing values of cash flow data.

Table 1.
Industry-wise distribution of sample firms.
3.4. Econometric Approach
Himmelberg et al. [58] contend that corporations are heterogeneous in nature and there are usually certain aspects that are not easy to capture and not reflected in the model; albeit, these aspects may affect the performance of the firm. The advantage of applying panel data fixed effects models lies with its ability to control the unobserved heterogeneity (i.e., a kind of endogeneity) and mitigate the omitted variable bias [58]. Moreover, in his seminal study, Li [59] provided a list of methods useful to control the endogeneity issues and suggested fixed effects models as remedial. Therefore, to obtain unbiased results, we applied basic panel data techniques—fixed-effects and random-effects. We further used Hausman post estimation test to ascertain which method offered better and more consistent outcomes. A significant p-value (p < 0.05) indicates that the fixed-effects methodology is more suitable for empirical testing of sample firms.
3.5. Empirical Model
To test the proposed relationship, we proposed the following regression model. The model is mathematically expressed as follows:
where is the investment efficiency of the firm; is a vector of dummy variables that represent life cycle stages (introduction, growth, maturity, and decline); is the value of Tobin’s Q; represents the firm size, which is calculated by taking the logarithm of total assets; indicates the firm leverage ratio; and denotes the cash flow of the firm.
4. Results and Discussion
4.1. Descriptive Analysis
Table 2 reports the descriptive statistics of dependent, independent, and control variables. The values of INE1 (investment efficiency 1) for growth (0.0397) and maturity (0.086) stages were higher than introduction (−0.0939) and decline (−0.3232) stages. Similarly, the values of INE2 (investment efficiency 2) and INE3 (investment efficiency 3) for growth (0.2336 and 0.0326) and maturity (0.2847 and 0.0616) stages were higher than introduction (0.0845 and −0.0292) and decline (−0.0846 and −0.0589) stages, respectively. These values support the notion that firms have lower investment efficiency during the introduction and decline stages while higher investment efficiency in the growth and maturity phase of FLC. Regarding control variables, sampled firms were found to be the largest during the growth stage yet the smallest in the decline phase. Likewise, firm cash flow and TQ were also lowest in the introduction and decline phases of the life cycle.
Table 2.
Descriptive statistics.
Figure 1 shows the investment efficiency of sampled firms during different stages of FLC. Consistent with our notion, CIE was lower at the introduction stage, and tended to improve as a firm transitioned from introduction to growth stage and reached its peak in the mature phase of the life cycle. However, afterward, it again started to deteriorate and reached its minimum level during the decline stage. Interestingly, introductory-staged firms reaped negative returns, as demonstrated in Figure 1. However, if they continued their operations, returns would become positive in the later part of their introduction stage. Overall, CIE resembled an inverted U-shaped trend over FLC stages.
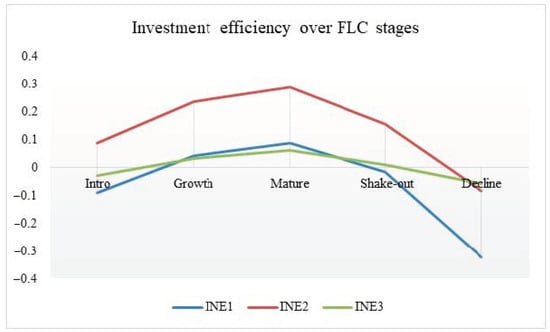
Figure 1.
Corporate investment efficiency over different stages of firm life cycle (FLC).
4.2. Correlation Analysis
Table 3 presents the correlation between dependent, independent, and control variables. The results regarding INE1 and independent variables suggest that firms with large size had higher investment efficiency. On the other hand, an increase in cash flows was also shown to increase the investment efficiency and growth of the company. The next correlation was between INE2 (investment efficiency 2) and control variables such as size, cash flow, and Tobin’s Q. This finding shows that with the increase in size, cash flow, and growth of a company, the investment efficiency increased. Only leverage had a negative correlation with investment efficiency measures INE1 and INE2, suggesting that a higher level of leverage decreased the investment efficiency of the sampled firms. Moreover, the correlation coefficients describe that the issue of multicolinearity was not present in the data as none of the variables had a pairwise correlation above 0.5.
Table 3.
Correlation analysis.
4.3. Regression Result
Table 4 reports the results of the panel data fixed-effects model, where three different proxies of investment efficiency (INE1, INE2, and INE3) were separately regressed on FLC stages and the control variable. The results demonstrated that firms were unable to sustain their investment efficiency across the FLC stages, as in all the three models the introduction and decline firms had negative/lower investment efficiency. These findings support the hypothesis H1. This illuminated the fact that firms face higher financial costs, higher bankruptcy risk [11], less efficient production process, negative returns, higher earning management [60], and inability to attract new customers during their early and later stage of the life cycle. Thus, any investment during these life cycle stages will cultivate lower efficiency. Moreover, compared to the shakeout stage of FLC, sampled firms had higher investment efficiency during growth and maturity stages across the three models. These pieces of evidence align with our HI, as growing and mature firms generate positive returns, enjoy higher profitability level, have lower uncertainty about cash flows, and have lower information asymmetric. The investments during these stages result in growing sales and eventually increase the efficiency of utilized resources. Further, findings indicate that across three measures, the investment efficiency was highest at maturity stage (coefficient values 0.042, 0.043, and 0.031 for INE1, INE2, and INE3, respectively) followed by growth phase (coefficient value 0.016, 0.039, and 0.023 for INE1, INE2, and INE3, respectively) of life cycle. Therefore, we postulate that as firms transit from the growth to maturity phase, their investment efficiency tends to increase.
Table 4.
Panel fixed-effects results for investment efficiency and FLC stages.
Regarding control variables, we found that the firm size, cash flows, and Tobin’s Q had positive and significant associations with corporate investment efficiency. This implies that large firms with better cash flows and higher TQ ratios exhibit higher investment efficiency.
4.4. Robustness Check
To make the current findings more robust, we also applied the ordinary least squares (OLS) technique on our data set. The results in Table 5 support the H1. It reveals that CIE was positive and statistically significant during the growth and maturity stages of the firm life cycle. On the contrary, introductory, and decline firms exhibited a significantly negative association with the investment efficiency of our sampled firms. Once again, across the three models, the coefficient of mature firms (0.086, 0.092, and 0.042 for INE1, INE2, and INE3, respectively) was larger than that of the growth firms (00.056, 0.079, and 0.030 for INE1, INE2, and INE3, respectively), indicating that mature firms enjoy highest investment efficiency. Likewise, firm size, Tobin’s Q, and cash flows also had a positive and statistically significant relationship with the CIE of the sample firms.
Table 5.
Ordinary least squares (OLS) results for investment efficiency and FLC stages.
5. Conclusions
Exploring the impact of firm life cycle stages on various performance indicators has always been a key interest for researchers. We embarked on an effort to examine how the investment efficiency of firms keeps on changing across different life cycle stages. We collected data of non-financial listed firms of Pakistan over the period of 12 years from 2005 to 2016 to unveil the nexus between FLC and CIE.
The results of panel data fixed effects and OLS techniques suggest that compared to the shakeout stage of the firm life cycle, corporate investment efficiency is lower at the introduction stage. Although, it begins to climb up as the firm transit towards the growth stage and attain its highest level at the maturity stage, it starts to deteriorate during the decline stage of the firm life cycle. Overall, these findings strengthen the proposition that corporate life cycle stages play an integral role in the sustainable working of an enterprise. Thus, the concept of life cycle management should be given due consideration in the process of investment planning of an enterprise.
We also presented some policy implications of our research, which can be equally beneficial for managers, policymakers, and investors. Corporate managers should frame their investment management policies according to the respective firm life cycle stage, as at every stage of the FLC, conditions and priorities of investment are different. This implies that policymakers can make more efficient and reliable investment management decisions consistent with the respective stage of their firm life cycle. Keeping in view that investment efficiency tends to be low at certain stages, investors should prepare themselves proactively and make better decisions to enhance the efficiency of their investment portfolio.
The current study identified some interesting areas that FLC scholars can explore in the future research. First, most of the research on FLC is skewed on its implications; therefore, scholars should incorporate firm-specific characteristics that influence a firm transition between different stages of life cycle. Second future research opportunity lies in examining the effect of FLC stages on its performance in the stock market, which is how investors value a firm in a particular stage of its life cycle. Moreover, current literature on FLC focuses on its consequences on a micro level (vs. macro level). Therefore, an opportunity exists to explore the effects of industrial life cycle on the economic indicators of the country. Finally, some researchers, such as Hair et al. [61], Akbar et al. [62], Wang et al. [63], and Ali et al. [64] suggested an emerging statistical technique, partial least squares structural equation modelling (PLS-SEM) to be applied on different types of datasets in order to obtain interesting findings. Thus, it would be fascinating to apply PLS-SEM in the literature on FLC to bring about some new insights.
The present research also bears some limitations. First, the study was conducted on the non-financial sector of a developing economy for a time span ranging from 2005 to 2016, restricting its generalization for other economies, especially at a different stage of their development. Second, we reported the accumulated results of 14 diverse sectors listed on the PSE. It was not possible to provide sector-wise results. A reduced number of firms characterized most of the sectors; therefore, application of statistical models that require a large number of observations will provide biased estimations.
Author Contributions
Formal analysis, M.A. and T.S.; funding acquisition, A.A.; methodology, M.A.; project administration, M.A.; supervision, S.A. and X.H.; writing—original draft, T.S.; writing—review and editing, B.A., A.A. and A.H. All authors have read and agreed to the published version of the manuscript.
Funding
This research received no external funding.
Institutional Review Board Statement
Not applicable.
Informed Consent Statement
Not applicable.
Data Availability Statement
Publicly available datasets were analyzed in this study. This data can be found at the websites of Pakistan Stock exchange, State Bank of Pakistan, and OSIRIS database.
Acknowledgments
We acknowledge the support of “Excellent PhD Research Porgram no. YB18001” of Guangzhou College of South China University of Technology.
Conflicts of Interest
The authors declare no conflict of interest.
References
- Soppe, A. Sustainable corporate finance. J. Bus. Ethic 2004, 53, 213–224. [Google Scholar] [CrossRef]
- Iotti, M.; Bonazzi, G. Analysis of the risk of bankruptcy of tomato processing companies operating in the inter-regional interprofessional organization “OI Pomodoro da Industria Nord Italia”. Sustainability 2018, 10, 947. [Google Scholar] [CrossRef]
- Peteraf, M.A. The cornerstones of competitive advantage: A resource-based view. Strateg. Manag. J. 1993, 14, 179–191. [Google Scholar] [CrossRef]
- Gomariz, M.F.C.; Ballesta, J.P.S. Financial reporting quality, debt maturity and investment efficiency. J. Bank. Financ. 2014, 40, 494–506. [Google Scholar] [CrossRef]
- Sonnemann, G.; Gemechu, E.D.; Remmen, A.; Frydendal, J.; Jensen, A.A. Life cycle management: Implementing sustainability in business practice. In Life Cycle Management; Springer: Dordrecht, The Netherlands, 2015; pp. 7–21. [Google Scholar]
- Lynall, M.D.; Golden, B.R.; Hillman, A.J. Board composition from adolescence to maturity: A multitheoretic view. Acad. Manag. Rev. 2003, 28, 416–431. [Google Scholar] [CrossRef]
- Mueller, D.C. A life cycle theory of the firm. J. Ind. Econ. 1972, 20, 199–219. [Google Scholar] [CrossRef]
- Dickinson, V. Cash flow patterns as a proxy for firm life cycle. Account. Rev. 2011, 86, 1969–1994. [Google Scholar] [CrossRef]
- Charitou, A.; Clubb, C.; Andreou, A. The effect of earnings permanence, growth, and firm size on the usefulness of cash flows and earnings in explaining security returns: Empirical evidence for the UK. J. Bus. Financ. Account. 2001, 28, 563–594. [Google Scholar] [CrossRef]
- Habib, A.; Hasan, M.M. Corporate life cycle research in accounting, finance and corporate governance: A survey, and directions for future research. Int. Rev. Financ. Anal. 2019, 61, 188–201. [Google Scholar] [CrossRef]
- Akbar, A.; Akbar, M.; Tang, W.; Qureshi, M.A. Is Bankruptcy Risk Tied to Corporate Life-Cycle? Evidence from Pakistan. Sustainability 2019, 11, 678. [Google Scholar] [CrossRef]
- Naeem, K.; Li, M.C. Corporate investment efficiency: The role of financial development in firms with financing constraints and agency issues in OECD non-financial firms. Int. Rev. Financ. Anal. 2019, 62, 53–68. [Google Scholar] [CrossRef]
- Wang, Z.; Akbar, M.; Akbar, A. The Interplay between Working Capital Management and a Firm’s Financial Performance across the Corporate Life Cycle. Sustainability 2020, 12, 1661. [Google Scholar] [CrossRef]
- Cheng, M.; Dhaliwal, D.; Zhang, Y. Economics, Does investment efficiency improve after the disclosure of material weaknesses in internal control over financial reporting? J. Account. Econ. 2013, 56, 1–18. [Google Scholar] [CrossRef]
- Jensen, M.C. Agency costs of free cash flow, corporate finance, and takeovers. Am. Econ. Rev. 1986, 76, 323–329. [Google Scholar]
- Biddle, G.C.; Hilary, G.; Verdi, R. Economics, How does financial reporting quality relate to investment efficiency? J. Account. Econ. 2009, 48, 112–131. [Google Scholar] [CrossRef]
- Richardson, S. Over-investment of free cash flow. Rev. Account. Stud. 2006, 11, 159–189. [Google Scholar] [CrossRef]
- Biddle, G.C.; Hilary, G. Accounting quality and firm-level capital investment. Account. Rev. 2006, 81, 963–982. [Google Scholar] [CrossRef]
- McNichols, M.F.; Stubben, S. Does earnings management affect firms’ investment decisions? Account. Rev. 2008, 83, 1571–1603. [Google Scholar] [CrossRef]
- Villalonga, B. Diversification discount or premium? New evidence from the business information trac king series. J. Financ. 2004, 59, 479–506. [Google Scholar] [CrossRef]
- Wang, Y.Y. Corporate Diversification, Investment Efficiency and Business Cycles. University of Melbourne, Melbourne, Australia, August 2018. Available online: https://fbe.unimelb.edu.au/__data/assets/pdf_file/0004/2883235/YulongYolandaWang_JMP.pdf (accessed on 1 November 2020).
- Barbiero, F.; Popov, A.A.; Wolski, M. Debt Overhang and Investment Efficiency. 2018. Available online: https://ssrn.com/abstract=3299969 (accessed on 1 November 2020).
- Berger, A.N.; Udell, G.F. The economics of small business finance: The roles of private equity and debt markets in the financial growth cycle. J. Bank. Financ. 1998, 22, 613–673. [Google Scholar] [CrossRef]
- Penrose, E. The Theory of the Growth of the Firm; Oxford University Press: New York, NY, USA, 1959; pp. 1–304. [Google Scholar]
- Spence, A.M. Investment strategy and growth in a new market. J. Repr. Antitrust L. Econ. 1979, 10, 345. [Google Scholar] [CrossRef]
- Hodgson, T.M.; Breban, S.; Ford, C.L.; Streatfield, M.P.; Urwin, R.C. The concept of investment efficiency and its application to investment management structures. Br. Actuar. J. 2000, 6, 451–545. [Google Scholar] [CrossRef]
- Miller, D.; Friesen, P.H. A longitudinal study of the corporate life cycle. Manag. Sci. 1984, 30, 1161–1183. [Google Scholar] [CrossRef]
- Faff, R.; Kwok, W.C.; Podolski, E.J.; Wong, G. Do corporate policies follow a life-cycle? J. Bank. Financ. 2016, 69, 95–107. [Google Scholar] [CrossRef]
- Spence, A.M. The learning curve and competition. Bell J. Econ. 1981, 12, 49–70. [Google Scholar] [CrossRef]
- Helfat, C.E.; Peteraf, M.A. The dynamic resource-based view: Capability lifecycles. Strateg. Manag. J. 2003, 24, 997–1010. [Google Scholar] [CrossRef]
- Pástor, Ľ.; Pietro, V. Stock valuation and learning about profitability. J. Financ. 2003, 58, 1749–1789. [Google Scholar] [CrossRef]
- Bulan, L.; Zhipeng, Y. The Pecking Order of Financing in the Firm’s Life Cycle, 2007. Bank. Financ. Lett. 2012, 1, 129–140. [Google Scholar]
- Hasan, M.M.; Habib, A. Firm life cycle and idiosyncratic volatility. Int. Rev. Financ. Anal. 2017, 50, 164–175. [Google Scholar] [CrossRef]
- Jenkins, D.S.; Kane, G.D.; Velury, U. The impact of the corporate life-cycle on the value-relevance of disaggregated earnings components. Rev. Account. Financ. 2004, 3, 5–20. [Google Scholar] [CrossRef]
- Liao, Y. The effect of fit between organizational life cycle and human resource management control on firm performance. J. Am. Acad. Bus. 2006, 8, 192–196. [Google Scholar]
- Habib, A. Value relevance of alternative accounting performance measures: Australian evidence. Account. Res. J. 2010, 23, 190–212. [Google Scholar] [CrossRef]
- Barth, M.E.; Kasznik, R.; McNichols, M.F. Analyst coverage and intangible assets. J. Account. Res. 2001, 39, 1–34. [Google Scholar] [CrossRef]
- Lehavy, R.; Li, F.; Merkley, K. The effect of annual report readability on analyst following and the properties of their earnings forecasts. Account. Rev. 2011, 86, 1087–1115. [Google Scholar] [CrossRef]
- Ding, F.; Zhang, L. Notice of Retraction Corporate Life-Cycle, Corporate Governance and Investment Efficiency. In Proceedings of the 2013 International Conference on Quality, Reliability, Risk, Maintenance, and Safety Engineering (QR2MSE), Chengdu, China, 15–18 July 2013; pp. 1980–1985. [Google Scholar]
- Khadafi, M.; Heikal, M.; Ummah, A. Influence analysis of return on assets (ROA), return on equity (ROE), net profit margin (NPM), debt to equity ratio (DER), and current ratio (CR), against corporate profit growth in automotive in Indonesia Stock Exchange. Int. J. Acad. Res. Bus. Soc. Sci. 2014, 4. [Google Scholar] [CrossRef]
- Drobetz, W.; Halling, M.; Schröder, H. Corporate life-cycle dynamics of cash holdings. SSRN Electron. J. 2015. [Google Scholar] [CrossRef]
- Lester, D.L.; Parnell, J.A.; Carraher, S. Organizational life cycle: A five-stage empirical scale. Int. J. Organ. Anal. 2003, 11, 339–354. [Google Scholar] [CrossRef]
- Jovanovic, B. Selection and the Evolution of Industry. Economics 1982, 50, 649–670. [Google Scholar] [CrossRef]
- DeAngelo, H.; DeAngelo, L.; Stulz, R.M. Seasoned equity offerings, market timing, and the corporate lifecycle. J. Financ. Econ. 2010, 95, 275–295. [Google Scholar] [CrossRef]
- Habib, A.; Hasan, M.M. Managerial ability, investment efficiency and stock price crash risk. Res. Int. Bus. Financ. 2017, 42, 262–274. [Google Scholar] [CrossRef]
- Gardner, J.W. How to prevent organizational dry rot. Rice Thresh. 1965, 53, 34–53. [Google Scholar]
- Wernerfelt, B. A resource-based view of the firm. Strateg. Manag. J. 1984, 5, 171–180. [Google Scholar] [CrossRef]
- Akbar, M.; Akbar, A.; Maresova, P.; Yang, M.; Arshad, H.M. Unraveling the Bankruptcy Risk‒Return Paradox across the Corporate Life Cycle. Sustainability 2020, 12, 3547. [Google Scholar] [CrossRef]
- Hasan, M.M.; Hossain, M.; Habib, A. Corporate life cycle and cost of equity capital. J. Contemp. Account. Econ. 2015, 11, 46–60. [Google Scholar] [CrossRef]
- Caves, R.E. Industrial organization and new findings on the turnover and mobility of firms. J. Econ. Lit. 1998, 36, 1947–1982. [Google Scholar]
- Benmelech, E.; Kandel, E.; Veronesi, P. Stock-based compensation and CEO (dis) incentives. Q. J. Econ. 2010, 125, 1769–1820. [Google Scholar] [CrossRef]
- Habib, A.; Hasan, M.M. Firm life cycle, corporate risk-taking and investor sentiment. Account. Financ. 2017, 57, 465–497. [Google Scholar] [CrossRef]
- Jiang, X.; Akbar, A. Does Increased Representation of Female Executives Improve Corporate Environmental Investment? Evidence from China. Sustainability. 2018, 10, 4750. [Google Scholar] [CrossRef]
- Akbar, A. Corporate governance and firm performance: Evidence from textile sector of Pakistan. J. Asian Bus. Strateg. 2014, 4, 200–207. [Google Scholar]
- Akbar, A. Working capital management and corporate performance: Evidences from textile sector of China. Eur. Acad. Res. 2014, 9, 11440–11456. [Google Scholar]
- Chen, J.; Dong, W.; Tong, J.Y.; Zhang, F.F. Corporate philanthropy and investment efficiency: Empirical evidence from China. Pac. Basin Financ. J. 2018, 51, 392–409. [Google Scholar] [CrossRef]
- Dang, C.; Li, Z.F.; Yang, C. Measuring firm size in empirical corporate finance. J. Bank. Financ. 2018, 86, 159–176. [Google Scholar] [CrossRef]
- Himmelberg, C.P.; Hubbard, R.G.; Palia, D. Understanding the determinants of managerial ownership and the link between ownership and performance. J. Financ. Econ. 1999, 53, 353–384. [Google Scholar] [CrossRef]
- Li, F. Endogeneity in CEO power: A survey and experiment. Invest. Anal. J. 2016, 45, 149–162. [Google Scholar] [CrossRef]
- Hussain, A.; Akbar, M.; Kaleem Khan, M.; Akbar, A.; Panait, M.; Catalin Voica, M. When Does Earnings Management Matter? Evidence across the Corporate Life Cycle for Non-Financial Chinese Listed Companies. J. Risk Financ. Manag. 2020, 13, 313. [Google Scholar] [CrossRef]
- Hair, J.F.; Risher, J.J.; Sarstedt, M.; Ringle, C.M. When to use and how to report the results of PLS-SEM. Eur. Bus. Rev. 2019, 31, 2–24. [Google Scholar] [CrossRef]
- Akbar, A.; Ali, S.; Ahmad, M.A.; Akbar, M.; Danish, M. Understanding the Antecedents of Organic Food Consumption in Pakistan: Moderating Role of Food Neophobia. Int. J. Environ. Res. Public Health. 2019, 16, 4043. [Google Scholar] [CrossRef] [PubMed]
- Wang, Z.; Ali, S.; Akbar, A.; Rasool, F. Determining the Influencing Factors of Biogas Technology Adoption Intention in Pakistan: The Moderating Role of Social Media. Int. J. Environ. Res. Public Health. 2020, 17, 2311. [Google Scholar] [CrossRef]
- Ali, S.; Poulova, P.; Akbar, A.; Javed, H.M.U.; Danish, M. Determining the Influencing Factors in the Adoption of Solar Photovoltaic Technology in Pakistan: A Decomposed Technology Acceptance Model Approach. Economies 2020, 8, 108. [Google Scholar] [CrossRef]
Publisher’s Note: MDPI stays neutral with regard to jurisdictional claims in published maps and institutional affiliations. |
© 2020 by the authors. Licensee MDPI, Basel, Switzerland. This article is an open access article distributed under the terms and conditions of the Creative Commons Attribution (CC BY) license (http://creativecommons.org/licenses/by/4.0/).