Article

Governmental Intervention and Its Impact on Growth, Economic Development, and Technology in OECD Countries

1
HIT, Holon Institute of Technology, Faculty of Technology Management, Holon 5810201, Israel
2
Faculty of Economic Sciences, Informatics and Engineering, Vasile Goldiş Western University of Arad, 310025 Arad, Romania
3
Department of Management and Economic Engineering, Technical University of Cluj Napoca, 28 Memorandumului St., 400114 Cluj-Napoca, Romania
4
Department of Engineering, Faculty of Food Science and Technology, University of Agricultural Sciences and Veterinary Medicine Cluj-Napoca, 400372 Cluj-Napoca, Romania
*
Author to whom correspondence should be addressed.
Sustainability 2021, 13(1), 166; https://doi.org/10.3390/su13010166
Submission received: 13 November 2020 / Revised: 21 December 2020 / Accepted: 22 December 2020 / Published: 26 December 2020
(This article belongs to the Section Economic and Business Aspects of Sustainability)

Abstract

:
The governments’ intervention in the economy impacts technological performance and sustainability. This role has become even more critical due to the COVID-19 situation and in the context of the continuous increase in resource consumption, which requires finding alternative solutions. We provide a comprehensive literature review about the state’s economic functions, redistribution of resources in society, and the role of state intervention in sustainability-related issues, giving a full description of the opinions and concepts primarily of economists. We propose to study governments’ interventions in their economy using budgetary resources on public expenditure, highlighting the leading factors in government policies using a suggested intervention index. The state’s intervention policy’s stability is measured via the intervention index’s partial autocorrelation function over the years. We collected data from OECD data sets and conducted a descriptive statistical analysis followed by panel data analysis. Subsequently, two questions are explored about the state’s intervention and its technical performance and technology-related sustainability issues. Results show that economic strength positively affects the intervention. Expenditures on education may lead to better technological outcomes, unlike expenses on health. The tax burden inhibits innovation and technological progress, but total governmental revenues positively affect technological performance.

1. Introduction

Important representatives in economic thinking have tried to determine the role of the state in the economy, the functions it should have, and its degree of intervention in economic and social life. Does the intervention level have a role in the relative strength of a nation? Karagianni et al. [1] investigated in the USA what the factors are that affect the level of interventionism and whether they were positive or negative. This role has been widely investigated and reported in the literature and expands in our literature review.
The present paper is structured into 6 sections. Section 2 presents a comprehensive literature review about state intervention in the economy, focusing on the revenue and expenditure of the general government from OECD (Organisation for Economic Co-operation and Development) countries, since widespread state intervention is associated with technological success and outcomes. Our study will also analyze the allocation of resources mobilized to the budget through taxes and contributions. Therefore, we aim to identify the priorities in the distribution of budgetary resources, that is, to identify which of the different types of expenditures have higher levels in the analyzed countries’ budgets. How public money is spent reflects the level of a country’s development, the importance given to its citizens’ needs, and their degree of satisfaction. Therefore, we are looking at the link between taxes collected from taxpayers and how resources are allocated to fulfill their needs. It is well known that a significant level of public spending requires increased resources mobilized through taxes. Of course, these differences are due to different choices regarding social policies and the development degree of each country. Countries with significant public spending also present an excellent satisfaction of social needs. In this context, it is not surprising that the main factor that has led to rising public expenditure in many countries was the expansion of social programs. This paper tries to narrow the literature gap about state intervention according to states’ revenues, fiscal pressures, economic strength, and technological performance, revealing the level of interventionism among states. In Section 3, we describe the methodology and data used. Section 4 presents the results, followed by Section 5, with discussion and limitations. The paper ends with conclusions in Section 6.

2. Literature Review

The survey of the literature spans the role of the state and its functions in the economy, and the redistribution of resources by governments. We highlight some aspects of sustainable development.

2.1. Opinions Regarding the Role of the State and Its Functions in the Economy

During the classicism period, the liberal doctrine of Adam Smith (the famous laissez-faire) was implemented in countries of Europe and the USA, where state intervention in the economy was minimal and even considered dangerous since it could limit private initiative. Their emphasis was on budgetary balance and reduced the state’s role in certain necessary activities. Thus, it was considered that the state should ensure citizens’ safety and economic security and have a monopoly on coercive measures and implementing established laws [2].
Due to the Great Depression of the 1930s, when it was found that the market could not adjust itself, the vision of the state’s role in the economy changed. Since then, direct state intervention in the economy began to manifest. Among the reasons behind the state’s increased role, we mention the Second World War and the need to create the welfare state to ensure a decent living standard for all its citizens. This occurred in Europe’s developed countries and the USA, Australia, Canada (around 20 states).
A welfare state aims to ensure its citizens have basic economic security to protect them from various risks associated with old age, unemployment, accidents, and disease. The term “welfare state” first appeared in Britain during World War II. Since then, it has been used more widely to characterize social protection systems developed since the 19th century [3].
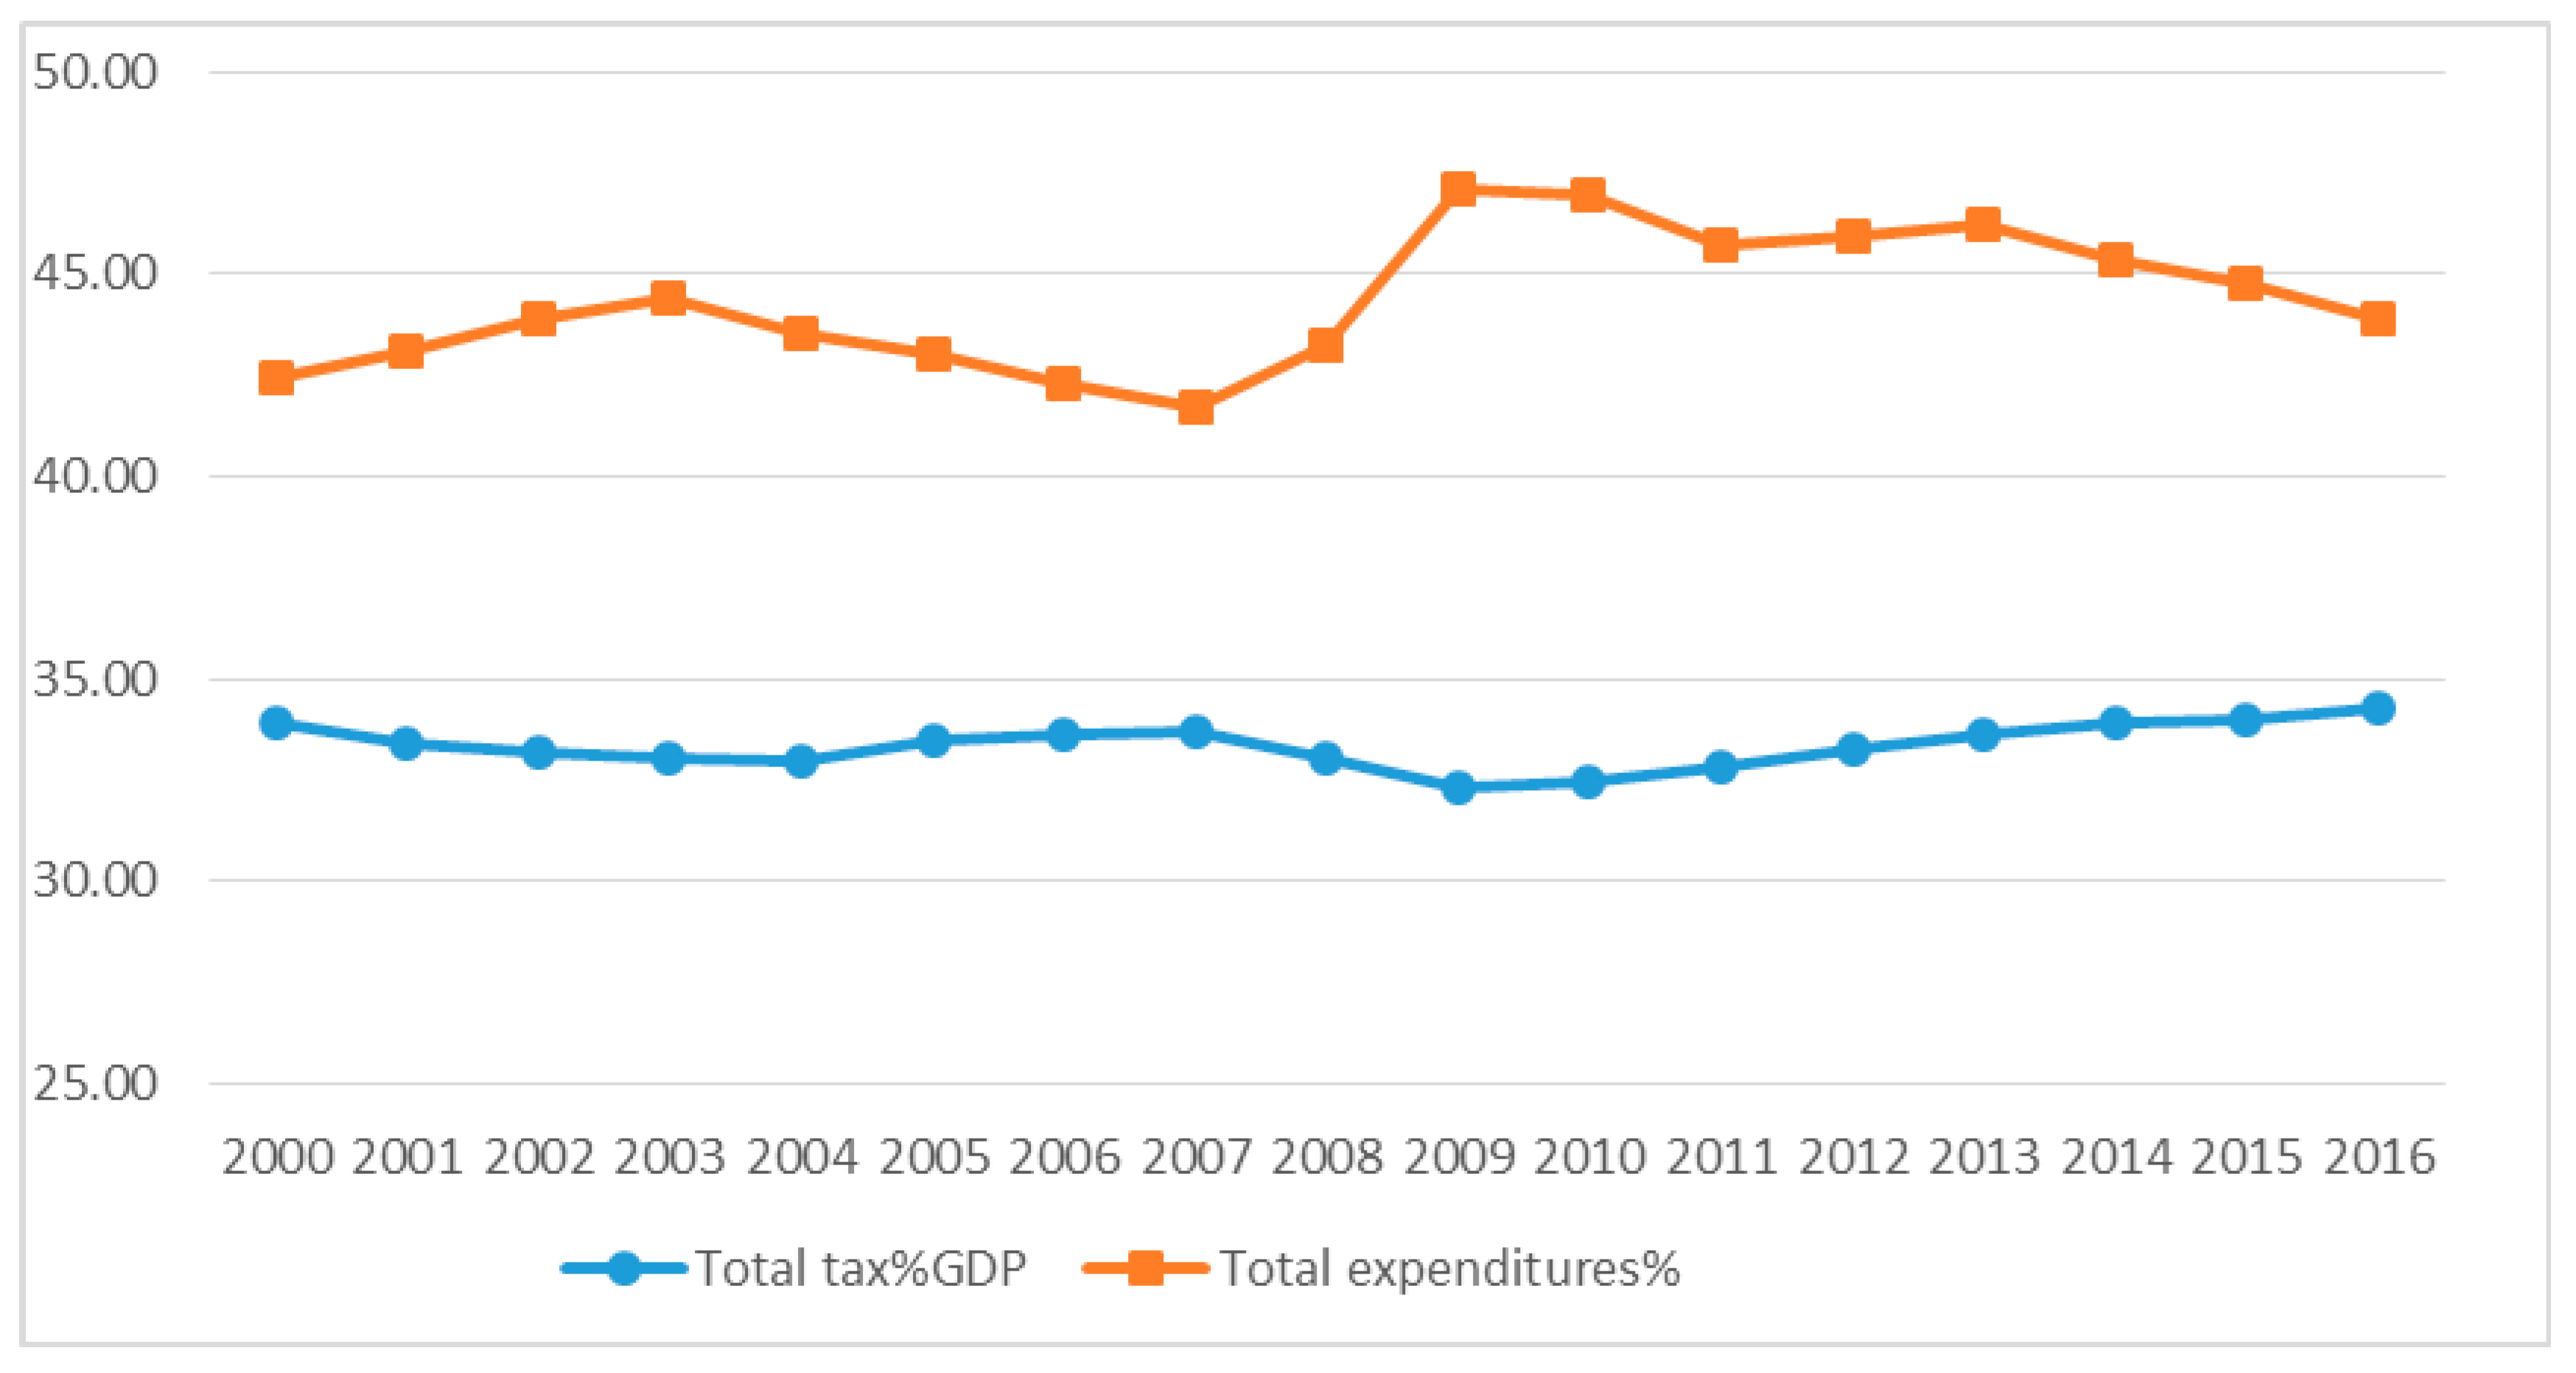
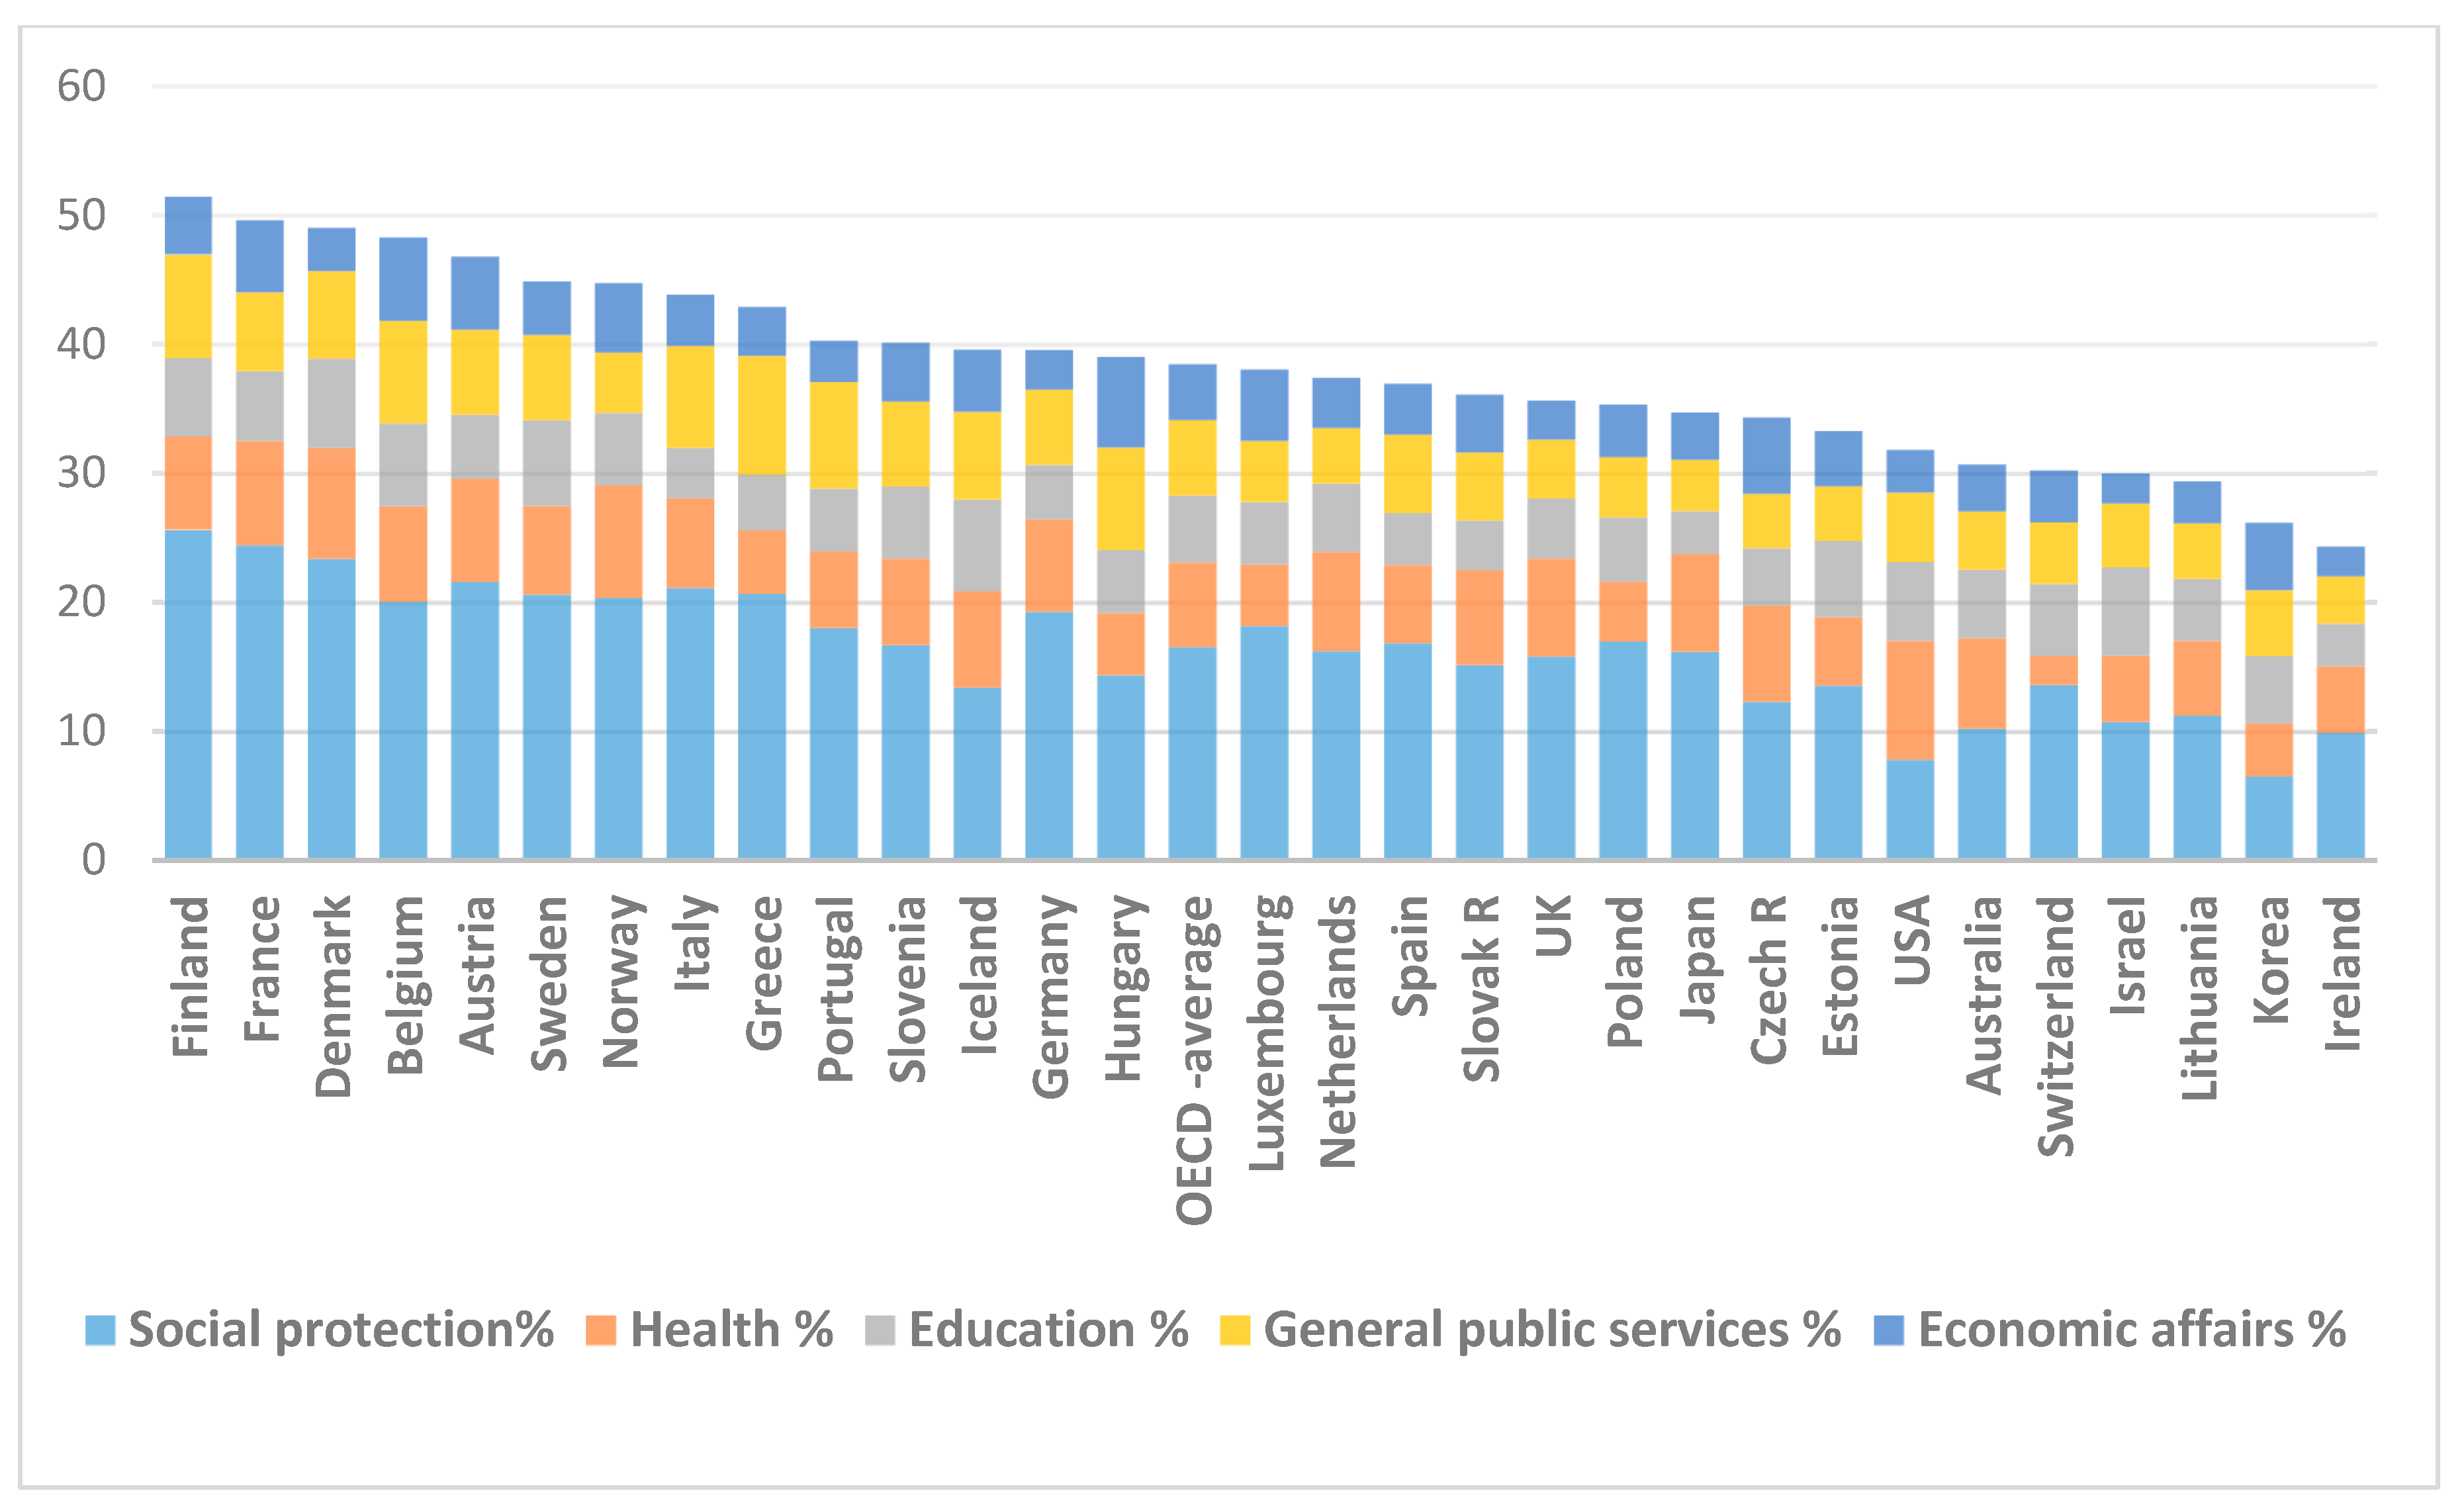
At the beginning of the 20th century, the share of public spending in GDP in the developed countries was usually below 10%. However, as a consequence of the expansion of social protection systems, there was a substantial increase in public spending. The public’s share exceeded 40% of GDP in many OECD countries (actually in 22 countries). Specifically, there were 16 OECD countries where the total expenditure level was between 40 and 50% of GDP, and there were six other countries in the maximum range (over 50% of GDP).
Emerging political-economic thought argued that laissez-faire was not only unjust, it was also inefficient and unstable. It was condemned for distributing resources unequally, inherent economic crises, and the inability to supply essential public goods [4].
Then, in the late 1980s, a predominant neoliberal trend arose, which promoted limited interventionism. However, in the last decade, the necessity of state intervention in the economy became prevalent again.
In the following, we will present some aspects of central planning in Eastern European countries that took place after World War II.
Five years after World War II, Eastern Europe was facing the fastest changes in its economic form. This occurred because Eastern European countries had moved from capitalism to the communist economy [5]. Therefore, they had to adopt a centrally planned economy system, which had only been applied in the Soviet Union. As in the Soviet Union, a lack of system coordination of smaller socialist countries reflects adverse developments and imbalances [6].
The inevitable consequence of state intervention’s economic pressure in countries that had been corrupted, damaged, or destroyed by the Nazis was the conversion of private enterprise and capitalistic forms. This intervention occurred in the Eastern European countries, where there was a total nationalization of the state’s fundamental productive property and the severe reduction of all property rights [5].
The socialist countries’ central economic leadership aimed to obtain high productivity rates but failed to develop a useful planning target for their enterprises. For this reason, these targets proved to be too low, and many enterprises were encouraged to obtain their production with less work [6].
However, the socialist countries’ main problem was that a few people had all the power and privileges of society. That is, a kind of dictatorship arose, which eventually generated social protests. The centralized economy also led to economic stagnation and inefficiency [7].
To maintain the party’s monopoly of power, the socialist countries and their people paid a high price: production remained less efficient than in the West, labor productivity grew more slowly than was technologically possible, and above all, the needs of consumers could not be adequately satisfied in terms either of volume or quality [6].
We believe that it is vital to highlight the four types of state models, whose characteristics were pointed out by Gadomski et al. [2]. The first is the Anglo-Saxon model (free-market model), where state interference is minimal. The second, the German model (model of the social market economy), is concerned with creating growth and competition conditions. The third is the Scandinavian model (welfare state model), with the state’s active role that offers an adequate standard of living and social benefits to all citizens. The last is the Japanese model (model of a healthy state). This model’s characteristic is an entanglement of state administration with associations of companies of a given industry. It maintains the free market competition principles and affects private companies’ activities to implement national objectives.
Bresser-Pereira [8] identifies three models of capitalist society in modern developed countries: (i) the liberal democratic model, (ii) the social model or welfare model, and (iii) the endogenous social integration model or Japanese model. He also discusses the developmental model and the liberal dependent model that appear in developing countries.
In many developed countries, government involvement has created public monopolies that have eliminated the possibility of developing private alternatives in areas such as energy, communications, postal services, transport, pensions, health, and education. This involvement has created a conviction for many individuals that the public sector should remain engaged in these areas to protect citizens’ welfare [9] for countries in general.
At the same time, there is a belief that individuals’ needs may also be satisfied with a lower level of public spending. Still, to do so, the state should use its revenues more efficiently, avoiding the waste of public money. However, the state is judged in recent years to have done more, but worse, a qualitative deterioration in the essential services provided has appeared.
This situation is specific mainly to the developing countries, and failing states are former colonies. The lack of state capacity has generated failure. Security and accountability, as public goods, are considered to be very important in terms of a state’s development, and in countries where they have not been sufficiently provided, the state has failed from the perspective of citizen’s wellbeing. Indeed, as some authors have argued, the state’s core role is to ensure its citizens’ security and justice in return for taxes paid by them. However, in a political system with a high regime instability level, it is not easy to build the required power for the state. If a state’s institutions are not built, policy choices concerning tax rates and private economic activity regulation are constrained [10].
The state intervenes mainly in order to assure the population’s overall economic safety, but due to its intervention, significant income redistributions have emerged from downwards on the social ladder for the purpose of reducing income inequality (primarily through taxes). The state needs to optimize the redistribution policies.
According to Keynes, the market had no mechanisms for self-regulation, so state intervention was needed to manage business cycles. Through his theory, he revolutionized economic thinking. Keynesian economists have supported government intervention in the economy through public policies, which are necessary to ensure full employment and price stability. Keynes was of the opinion that the state should solve the problems in the short term and not wait for the solution to come from the markets. Keynesian theory was dominant after World War II until the 1970s. Then, its popularity declined as many countries began to face inflation and a slowdown in economic growth. Keynesian theory could not provide responses to stagflation [11].
At that time, monetarist economists considered that monetary policy has the ability to avoid the crisis by controlling the money supply in the economy [11].
Monetarism has a clear anti-Keynesian intent. Friedman’s quantitative theory is based on monetary policy and comes in response to Keynesian fiscal policies. Monetarism believes that the monetary policy objectives should target the growth rate of the money supply, and money supply is seen as a major macroeconomic variable. Thus, the aim is to control the money supply in the economy, which is achieved by increasing or decreasing the interest rate [12].
According to Andrada [13], Robert Lucas could not provide an alternative to the Keynesian macroeconomic models, but he drew a lot of attention with his criticism. Lucas’s critique showed that the econometric models used at that time could not estimate the behavior of the economy as a result of intervention policies. He developed the theory of rational expectations, and his work stands at the basis of current macroeconomic models.
The state’s influence on the economy has represented a significant topic for theoretical debate and empirical inquiry since the beginning of capitalism and the market society. States are facing unprecedented challenges that might reduce their role in the economy [14].
According to some opinions, the state must engage in several policies that ensure economic progress, fair opportunities, and social welfare [2]. Additionally, the economic theory that supports the state’s active intervention argues that markets are imperfect and that the state should remedy these deficiencies. On the other hand, state intervention may produce other imperfections, which in many cases, have higher economic and social costs than the imperfections of the market. Still, the state can have an important mission in the political, economic, and social environments to become the most important investor in the future of people and society. Therefore, the main state investment should be in human capital, making it profitable only in the long run; this requires a long-term strategy. Investment actions include education, training and re-qualification, research and development, and health, which should be the main areas of state interest [2].
Stiglitz [15] talks about some alternative visions of the state’s economic role in this century, taking into consideration its commitment to social justice and democracy. Therefore, he promotes the third way, which, in his opinion, lies between socialism and laissez-faire. That is, in the context where the free-market approach does not work, socialism, with the government’s domination of the economy, does not work either.
Regarding the third way, we would like to present in the following the opinions of other famous economists, such as Walter Eucken, Alfred Müller-Armack, and Ludwig Erhard.
Walter Eucken is considered the father of Ordoliberalism, which was based on developing the concept of the social market economy. Ordoliberalism is seen as a third way between the centrally planned economy of socialism and laissez-faire liberalism. Ordoliberalism was developed by Eucken and other economists in the 1930s and 1940s, and after World War II, it had a significant impact on German economic policy. The triad of Ordoliberalism is a competitive order, economic constitution, and “Ordnungspolitik” (regulatory policy). For Eucken, the transaction economy’s competitive order is the key to a prosperous and humane society. Competition is essential to achieve sustained economic development. As a result, the predominant market form in the competitive order is the market form of complete competition: monopolies and oligopolies are exceptions. Ordoliberalism’s political and economic dimension has the primary goals of preserving economic freedom and full competition [16].
At the same time, the state should limit itself to the formation of regulations or frameworks. The state’s intervention in the economy must be based on market conformity, but it should not affect market and price mechanisms. The Euckenite competitive system is seen as a system that promotes prosperity, and at the same time, it promotes liberty and society. It is also worth mentioning Eucken’s criticism regarding the interventionist state [17].
Alfred Müller-Armack’s conception of Social Market Economics is in many points similar to the Freiburg School (or Ordoliberalism) ideas and Erhard’s vision. His fundamental concepts consist of the following: a market economy ruled by principles, the rejection of mixed systems of economic policy, compliance with consumers’ desires as the goal of the market game, and the precautionary measures against any form of market power. These important ideas are also found in Erhard’s concept and Eucken’s Ordoliberalism, and they represent the main principles of all thinkers who were based on the Social Market Economy. Müller-Armack emphasized that additional and subsequent social security measurements must balance the free market system, and here we find his idea of “social compensation.” Furthermore, the whole economic system should be incorporated into a comprehensive social order theory [18].
For Müller-Armack, the meaning of a social market economy consists of uniting the principle of market freedom with social compromise. However, he set himself apart from Ordoliberals through the more significant role he gives to social policies and by showing less confidence in the virtues of a competitive economy alone, which he still defends. Regarding economics, he maintained a more interventionist approach than that of the Ordoliberals or Erhard. He focused on nearly full employment and on adopting countercyclical measures [19].
The Ordoliberals highlighted the role of social policy in increasing market efficiency. In their view, growth, a modest income, and wealth distribution are necessary and are especially achieved by competition efficiency. With his ideas, Alfred Müller-Armack aimed to go further than most Ordoliberals [18].
Therefore, Müller-Armack’s idea of the social market economy is regarded as a holistic concept and talks about “social irenics,” meaning moderation and conciliation to solve society’s differences. His idea about the social market economy discusses returning to the market and competition, together with an active economic policy and a welfare system. It also emphasizes the problem of economic growth reconciliation with social security and freedom [20].
Perhaps more than Eucken, Ludwig Erhard conceived the economic policy of competition to achieve social objectives [19]. Erhard’s vision for a market economy has three aspects: (1) the restriction of arbitrary political power, (2) the limitation of any monopolistic structure, and (3) the uninterrupted preference for freedom and competition [18].
According to the Social Market Economy, governmental intervention should be passive or indirect. It also provides regulative and reliable general conditions. Among them are private property, liability regulations, freedom of contracts, free-market formation, and convertible and stable money. Meanwhile, it is required a conscious and measured state intervention [21].
Bardhan [22] brings into the discussion the “strength” of a state, meaning political centralization and capacity to commit. Unlike the “strong” state, the “soft” state has too little desirable intervention. The distinction between a “strong” state and a “soft” state is not necessarily consistent with the degree of intervention but rather with the quality.
At a general level, several economic policies are suitable for growth: a stable macroeconomic environment, generalized access to the global economy, protection of people’s property rights, and public goods expenditure that offers benefits to everyone. The problem appears when governments do not take these issues into account, and, in many cases, it occurs because of a lack of knowledge [23].
A similar view is found in Reinert [24], who brings into discussion the three main roles of the state: establishing “the rules of the game”, providing income distribution (“sharing the pie”), and promoting economic growth (promoting happiness.)
Orlowski et al. [2] argued that the more society expects from the state, the more resources are necessary for spending on this purpose. Therefore, widening the state’s role leads inevitably to an increase in expenditures, leading to increased taxation to support them. For this reason, the function of the state as a guarantor of security is costly, and the differences in the size of taxation depend mainly on the degree to which a prosperous state is developed. From this perspective, in Scandinavian countries, taxes are almost double those in Switzerland because Scandinavian citizens expect a greater activity and care from the state towards people.
The same perspective is found in Inotai et al. in [2], who claimed that traditional neo-liberal theory, which claims that states are more efficient if they maintain taxation at the lowest level, does not work in practice. The main criterion for the efficiency of budget recentralization is not the level but the structure of public spending. If money serves to maintain uncompetitive sectors artificially, even a low taxation level is a loss-making activity. He insists on the idea that long-term investments in human capital may require higher taxation and fiscal centralization, but they have long-term profitability.
The welfare state’s main aims are full employment, better living conditions, and low inequalities in income distribution. Additionally, the main welfare state instruments are presented as income transfers (or deferred wages), social services (or indirect wages), and fiscal policy, which allows the state to collect the money needed to finance these transfers and services [25].
Concerning the welfare state, we should point out some of Gøsta Esping-Andersen’s ideas that are relevant in this regard. Esping-Andersen highlighted that the welfare state’s risks depended not on expenditure but welfare states’ class character. Middle-class welfare states were social-democratic (as in Scandinavia) or corporatist (as in Germany). In contrast, liberal, residual welfare states in the USA, Canada, and Great Britain depended on the commitments of a usually weak and politically residual social stratum. In this regard, the class coalitions in which the three welfare states were found could explain their evolution in time and their prospects [26].
For two reasons, the welfare state base’s continued viability has been put into question across Europe. In the first place, the status quo can be hard to maintain due to hostile demographic or financial conditions. Secondly, this status quo has become increasingly obsolete and is not suitable for meeting significant future challenges [27].
The Nordic countries were some of the few OECD countries able to support both aged and child poverty at relatively low levels, which means they could better deal with future challenges. The liberal welfare model then faced minimal policy options to manage the pressing social problems to come. Most welfare states of Continental Europe also faced several welfare issues because, in the absence of jobs, it required an additional increase in social contributions [28].
Esping-Andersen also underlined that the biggest priority should be given to social investments in children, representing society’s future productive potential [29]. He sustained the social protection of children, young people, and families or a pro-women policy, as a mixture of consumption and investment. He also talked about the need for rethinking security in old age, moving toward a contribution-defined system [27].
All developed welfare states were essentially subject to the same challenges, but these manifested different problem constellations for other welfare systems [28]. However, it would be a severe mistake to limit the focus only to the governments’ welfare role because the total social assistance package combines the state, markets, and families [29].
Most European countries are struggling to reform their social protection systems, requiring greater coordination and a joint effort to find solutions at the EU level [27].
Therefore, it was necessary to establish new priorities for the allocation of the existing welfare package. Esping-Andersen talked about two alternatives: the first was based on a “Paretian” principle that produces greater efficiency without anyone losing. The second and more ambitious way refers to the “Rawlsian” principle of justice, where the most significant advantage of any efficiency gains should target the poorest and weakest. For the EU, the appropriate one seems much closer to the Rawlsian principle [29].
Another author highlights that the state often has to be a guide, coordinator, and catalyst for stimulating economic activities. However, sometimes, for various reasons, the development process has been limited, and the way forward is overshadowed by all sorts of missing information and incomplete markets [22]. The government should, therefore, have an active role in subsidizing companies and make direct investments.
The experience of late industrialized countries is also quite imposing. Japan, the Soviet Union, and South Korea rushed from the status of less developed countries to high-income industrialized countries through a state-directed strategy of development that infringed on virtually all the precepts of neoliberalism. As some authors argued, there are no examples of major countries making this development transition as fast as possible, based on the neoliberal approach. Despite the widespread influence of neoliberal ideas and policies in recent times, it seems that a state-oriented strategy is the only efficient way to achieve economic development [30].
However, some authors claim that society’s wealth can grow only if the economy becomes more productive. Then, it will be able to support higher wages, higher profits, shorter workweeks, and a better quality of life [31]. Therefore, a challenge for many countries is how to increase productivity, and this issue should be in the middle of any debate concerning state economic development.
The global economy’s current context is challenging governments with budgetary pressures and high debt to find solutions to accomplish public policy goals using limited resources. However, this implies an increased efficiency regarding the activity of the public sector. There also seems to be a convex relationship between public spending and social welfare benefits [32].
Mitchell [33] shows that policymakers are divided on whether government expansion improves or curtails economic growth. The first point of view claims that government programs provide essential “public goods” like education and infrastructure, and rising public expenditure can boost economic growth by increasing people’s income. Those who support smaller governments have the opposite view. In their opinion, the government is too big and uses resources less efficiently, resources that are taken from the productive sector of the economy, and oriented to the public budget. This means that higher spending undermines economic growth because funds are not used efficiently. Therefore, government expenditure can become a burden at some point, either because the government gets too big or because spending is misallocated. In these cases, the government’s cost outweighs the benefit, so we can conclude that it is a matter of efficiency. The challenge is for the state to use public money more efficiently and prevent its waste. Some other authors draw attention to the fact that persistent tax cuts financed by larger deficits will lead to a decrease, not an increase, in the long-term national revenues [34].
As some authors have mentioned, there is a proven relationship between a high tax wedge and a more significant public spending volume on government targets (such as pensions, unemployment benefits, or health care). Even if a low tax wedge could be attractive for some investors, they still have to bear some expenses like vocational training or healthcare services for employees as a kind of payment [35].
State interventionism has experienced different forms of manifestation, among which we find the support of the economy or the redistribution of resources between individuals. However, all these have in common that manifesting interventionism always responds to the political, economic, or social context [36].
In the following, we refer to some aspects regarding the government “capacity constraint” on how much tax revenue it can raise.
Economists generally believe that the state has a high enough institutional capacity to sustain markets and collect taxes. However, Besley and Persson [37] argue that “previous legal and fiscal capacity investments limit policy choices” concerning market regulation and taxation. They demonstrate that legal and fiscal capacity is typically complementary. Besley and Persson [38] then identify a range of policy-making constraints that explain the failure to adopt good policy outcomes, such as policy preferences, technologies used, and policymakers’ commitment capacity.
Recently, there were many discussions about the state’s capacity to raise taxes and collect tax revenue. The ideas presented by Besley [39] differ from the typical starting point regarding economic studies of government policy, assuming that governments have enough power to tax, regulate, and enforce laws. Recently, there has been a growing recognition that the differences in state effectiveness worldwide and over time are strikingly high. On the one hand, the highly functional Scandinavian states, combining functional market economies with social providing of several goods and services. On the other hand, there are the so-called “fragile” states, many of them from Africa and the Middle East, struggling to maintain law and order and to provide even the most basic services to their citizens.
However, there are some constraints regarding how much tax revenue the state can raise. Here, we should consider morality or tax morale because it influences the state’s ability to collect taxes. Besley [39] shows that tax compliance is affected by citizens’ civic-mindedness and government expenditure composition.
In the literature regarding compliance, it is widely accepted that tax compliance can be higher if the government is considered to be fair. Bisin [40] identifies the complementarity between culture and adequate public goods provision. He argues that the higher the civic capital, the lower the need for institutions with similar effects. Robust institutional mechanisms are expected to control tax evasion and avoidance in states with low civic capital to compensate for voluntary non-compliance. We might also think of such robust tools in states with high civic wealth, but only if the economy can sustain high tax rates.
According to Besley [39], there is a complementarity between institutions’ strength and voluntary tax compliance. This illustrates the complementary aspects between institutions and civic culture. He talks about the “multiplier” of institutional reform upon tax capacity because of the civic culture dynamic.
Previous studies predicted that better detection and monitoring, together with higher fines, are the critical elements for developing fiscal capacity. It is widely accepted that this point of view is incomplete, and many studies invoke the term “tax morale” to highlight several reasons for paying taxes. The results obtained by Besley [39] show that civic-minded citizens increase or decrease tax compliance according to the mix of public expenditure.
Countries like Denmark and Sweden’s achievements offer little direct insight into how policy could help design a path to create a state that effectively sustains economic development and improves its citizens’ well-being [41].
Papaioannou [42] focused on the role of state legitimacy and capacity, revealing that low-income countries are trapped in some fragility issues. For example, in Africa, state capacity is low: income taxation is almost missing, public goods provision is significantly reduced, and many governments have difficulties handling violence. That is, African states have failed to deliver public goods to their citizens.
Bowles [43] argues that tax compliance is a feature that is distributed by copying and paying taxes contributing to public good provision. Therefore, a group with high tax compliance might gain economic, military, or other competition compared to other groups, which it then absorbs.
We consider the state’s ability to make strategic plans to be essential, seeing that culture might be affected by today’s policy and institutional choices. There is also a need to focus on those policies whose primary goal is to change citizens’ values [41].
Regarding common goods and state involvement in providing them, it is important to mention Wronowska’s opinion [44], which is that if there was no state action in these areas, then their existence would be seriously jeopardized. Without the state, these common goods would be provided in an insufficient amount and would involve high costs.
We join this view, believing that some major projects can only be done by the state or with state support due to material, financial, and labor considerations. Therefore, an optimal form of cooperation between the two sectors, public and private, should be found. For the state to exist, all of us must contribute by paying taxes and social contributions. Then, the state will use the money collected from individuals and companies by allocating them to multiple destinations. However, if there is no state, there is no public education, public order, public justice, etc. [45].
The resulting revenues from taxes levied from the taxpayers serve to finance the various expenditures of the state: social–cultural expenditures, R&D, economic actions, defense, public order, etc. Here appear the two sides of the finance repartition function: first mobilizing the resources and then distributing them to the relevant destinations.
One of the functions of the state in the economy concerns income redistribution, and it is based on income adjustment in society. The purpose is to avoid the polarization of society and social tensions, and in this way, the state makes specific actions to diminish the disparities between different income levels and helping disadvantaged people.
It should be noted that the resources taken from the taxpayers are used in their interest, but the allocation of resources to beneficiaries does not take into account their origin or the size of the contribution of each individual. Thus, we do not have a direct link between the quality of being a taxpayer and that of being a beneficiary of the services offered by the state. For this reason, we consider that the phenomenon of tax reversibility, viewed from the point of view of the return of taxes to taxpayers, is verified only on the whole, at the level of all taxpayers, and not at the level of each individual.
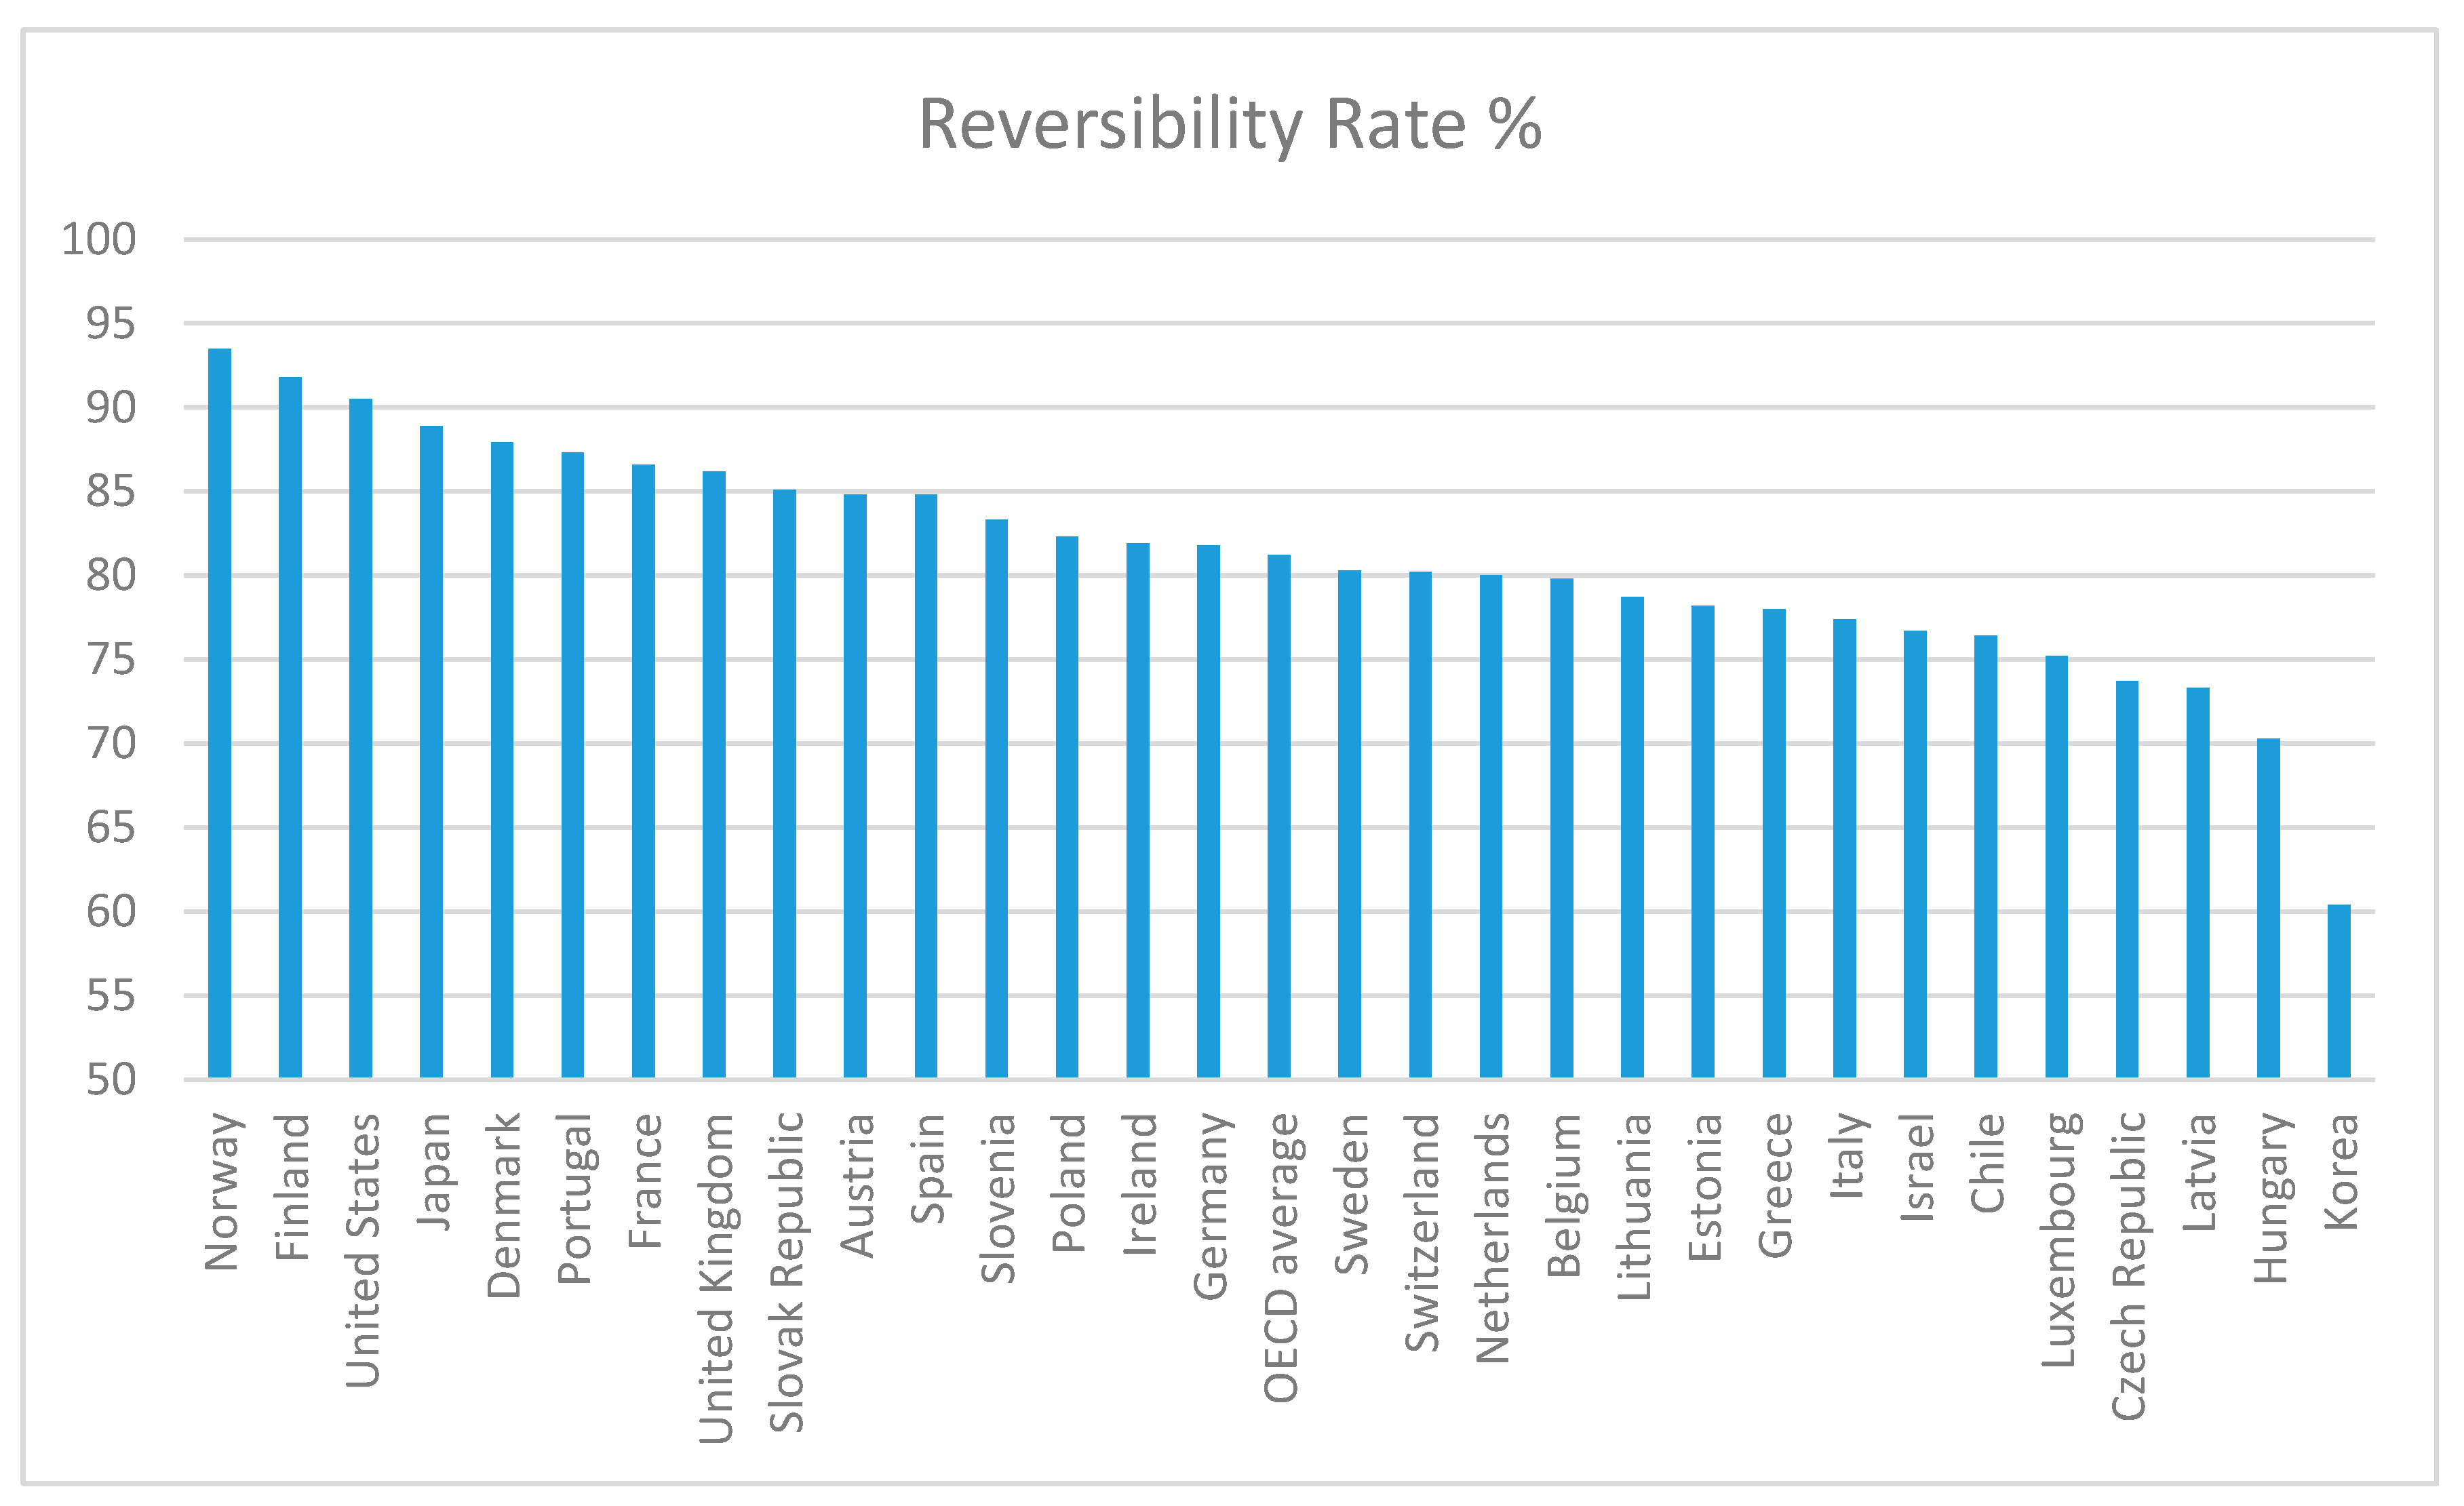
Concerning the positive incentives of people to pay taxes, we should point out that the rate of tax reversibility is quite important and can influence them. This rate shows the redistribution of resources made through the budget and the level of taxes returned to payers. Based on taxes and social contributions, resources are centralized to the budget. They are then used to support the different needs of taxpayers, who are the beneficiaries of the state’s public services. At the same time, this rate is the link between fiscal pressure and redistribution of resources to the benefit of a country’s citizens. This ratio level shows how much taxpayers benefit due to taxes and contributions they have paid—that is, the extent to which they perceive that the state will use the money obtained from taxes in their benefit (health, education, social security, etc.). Therefore, the higher the rate of tax reversibility, the more people as a whole might obtain greater earnings based on payments made towards the state, which means that the state is more involved in fulfilling their needs, redistributing the sums collected to their benefit [46].
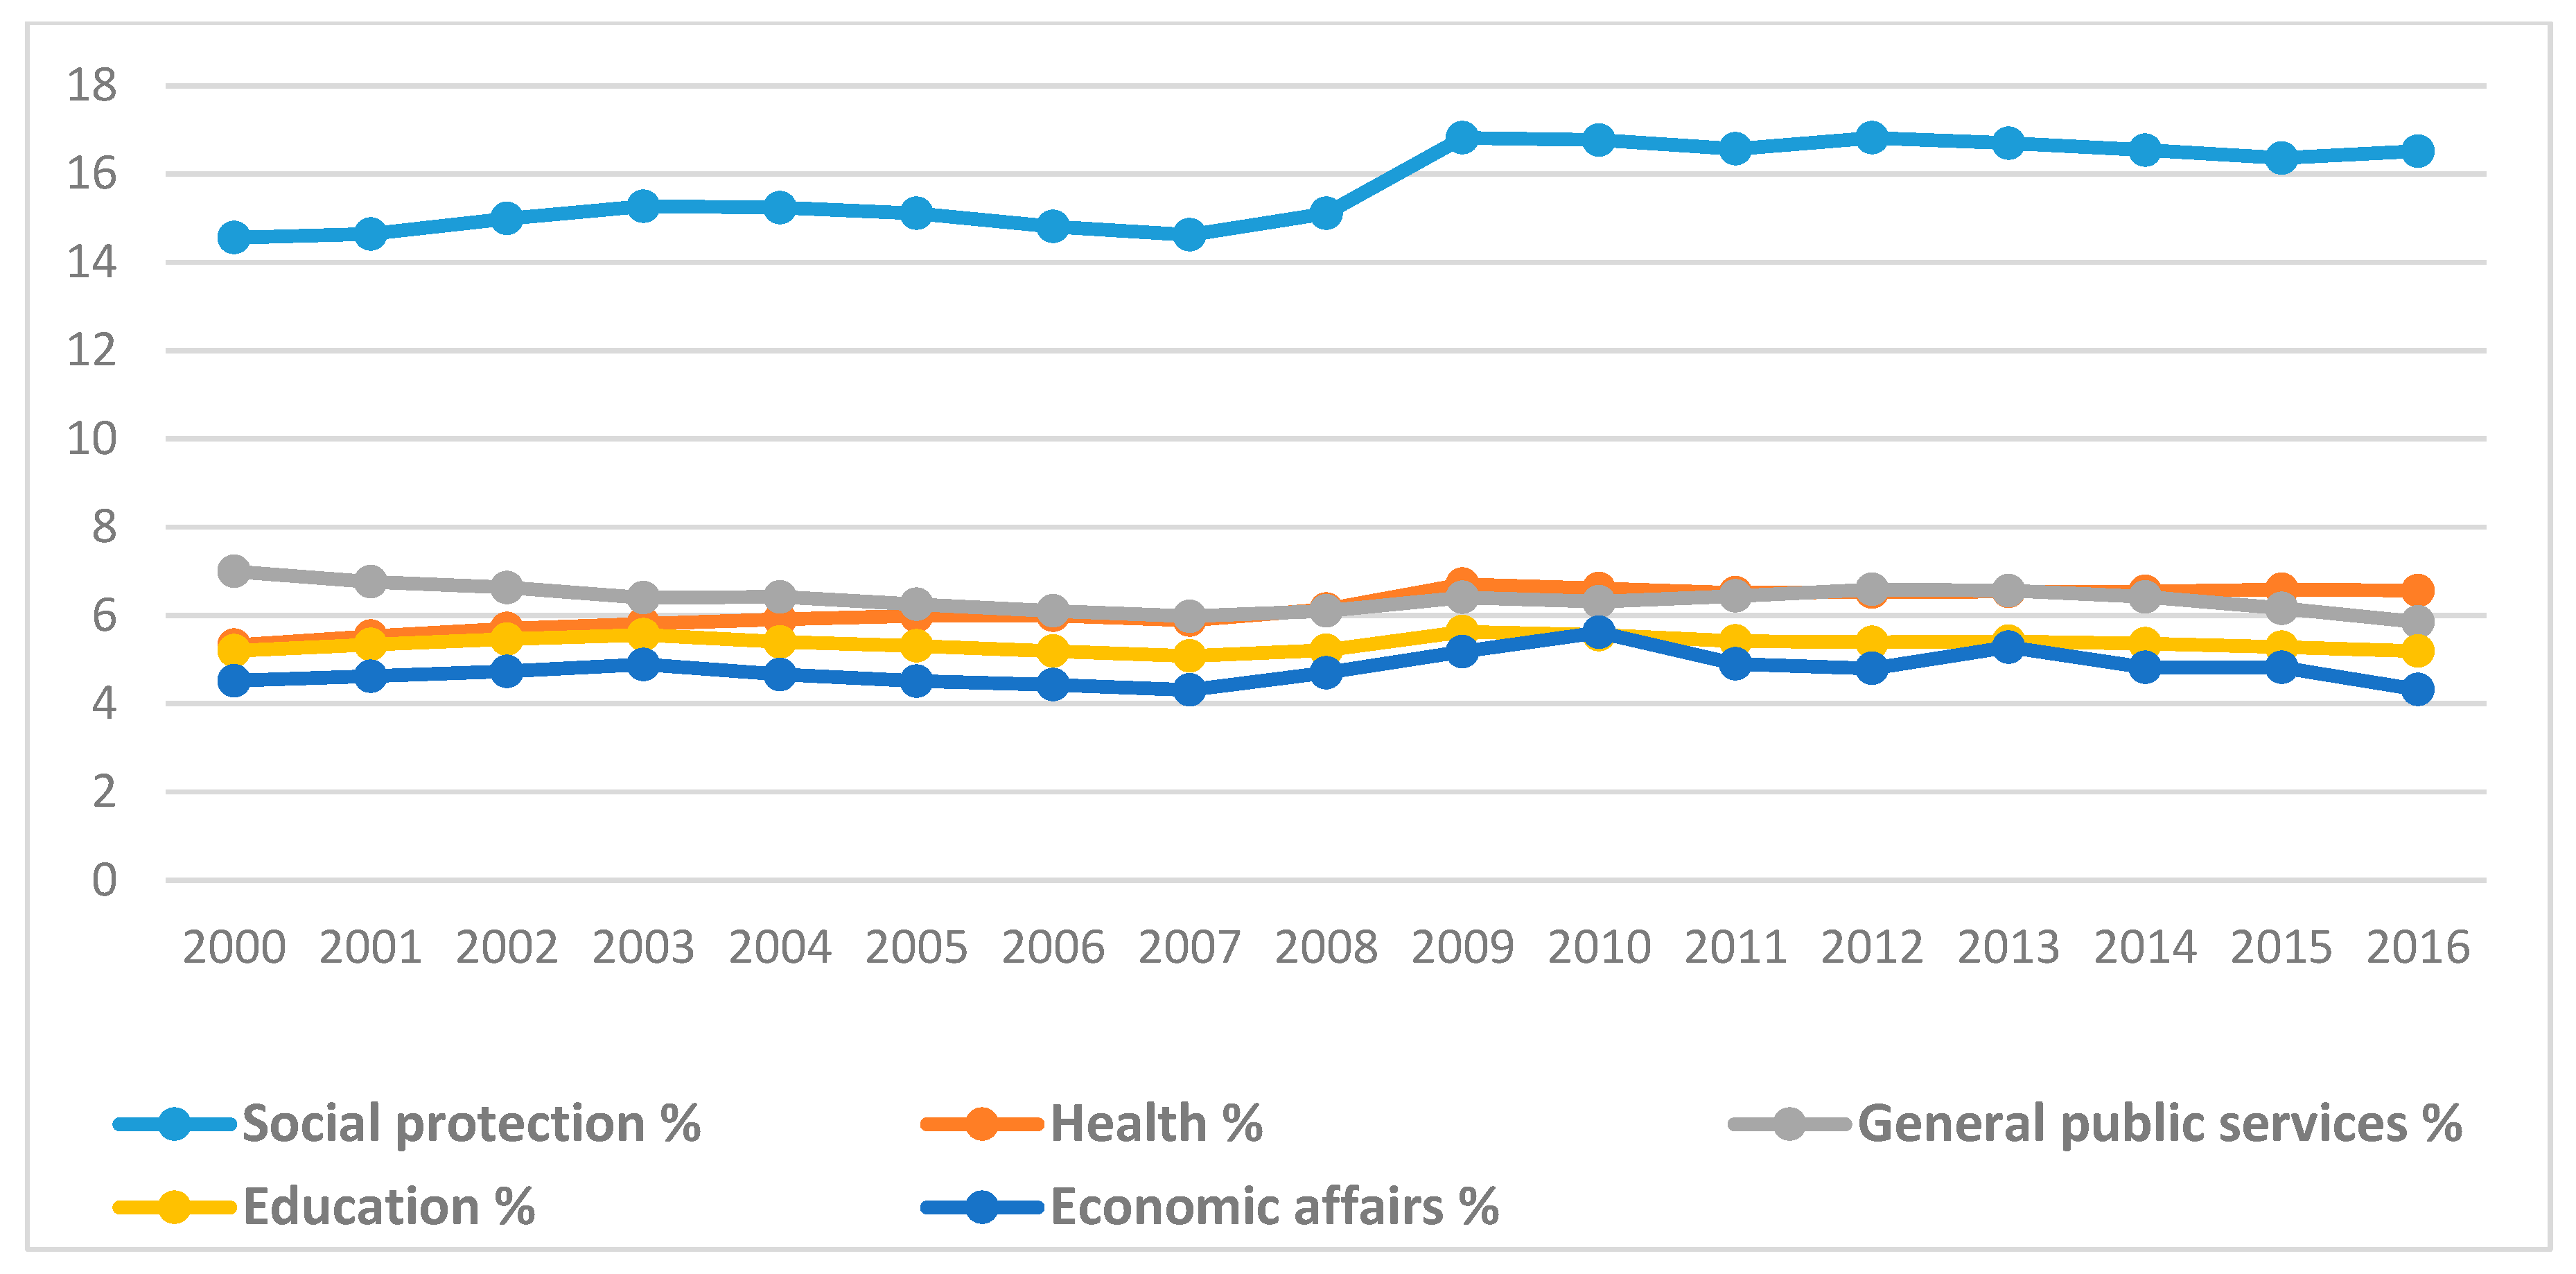
Regarding public spending, it is clear that a high level first means good satisfaction of social needs, particularly those related to social protection, health, and education. However, a significant level of public spending requires increasing tax resources, which are mobilized to the budget through taxes and contributions. Therefore, countries where public spending is significant also show a high level of tax burden, and where the level of public spending is more modest, taxation is more relaxed.
Korpi and Palme [47] talk about the phenomenon called the paradox of redistribution—the more the social benefits are targeted only to the poor, the less poverty and inequality will be reduced. Additionally, the larger the gap between the incomes of the poor and the middle class, the greater the need for redistribution [48].
The effects of redistribution depend primarily on the appropriate shape of the taxes and deductions system and the distribution of income [49]. However, globalization should lead states to transfer public resources from pure redistribution to public goods and the formation of human capital [50]. The state’s role in terms of redistribution is to reduce the differences in living standards of different social groups. The main instruments of a state’s involvement in the economy are the tax system, some types of budget expenditures, and the impact on prices [51]. However, when studying the tax system’s redistributive effect, we should consider the impact of deductions. Tax deductions could severely decrease the redistributive effect of tax due to the fact that lump-sum deductions in a progressive tax system produce higher tax relief for higher-income individuals [52]. Some authors underline that welfare states can increase the redistributive efforts concerning general inequality if they incorporate the wealth perspective when shaping the tax-benefit system [53]. However, average redistribution and the associated decrease of inequality are associated with more significant and more sustainable growth [54].

2.2. Sustainability and Intervention

Sustainability or sustainable development aims at providing the correct management of all resources. The purpose is to solve the problems imposed by the continuous increase in resource consumption and to find alternative solutions. An activity is sustainable when its development does not involve the depletion of available resources or the destruction of the environment.
Sustainability refers mainly to the responsible use of resources and people’s ability to maintain well-being and long-term prosperity without affecting the natural world. Sustainable development seeks to satisfy the present’s needs without compromising the ability of future generations to fulfill their own needs and aspirations [55].
Sustainability also implies healthy economic development in the context of flourishing social welfare achieved in a healthy environment. The concept of sustainable development has reduced human ecological footprint by promoting environmental integrity and equity between nations, individuals, and generations and maintaining economic efficiency as generally accepted goals [56].
From an ecological perspective, sustainability gives great importance to managing physical resources to preserve them over time. The impact of industrialization on biodiversity is taken into account, as is the use of non-renewable resources, many of which are polluting. Concerns are also linked to economic growth, which constitutes a risk that future generations will no longer enjoy the same standard of living as today.
Varadarajan [57] discusses the existence of gaps in the quantity and quality of public goods provided by the state in developing countries. These gaps have certain negative consequences on sustainability because low-income consumers are forced to use private goods, which are more expensive and can affect the ecological environment. Therefore, first of all, it is necessary to redirect consumption from private goods that are more harmful to the environment to ecologically less harmful public goods and thus to reduce the consumption of harmful goods. There is a need to develop these innovations with the potential of reducing the economic and social consequences of gaps in quantity and quality in public goods supplied from less developed countries.
Lim [58] summarizes the idea of mindful consumption, which aims to temper consumption customs, making consumers more responsible. They will then consider social, ethical, and environmental issues when making consumption decisions. They will also become more responsible with the environment. In this way, sustainable consumption practices are possible, and consumers will express their repulsion towards unsustainable consumption practices, avoiding them.
However, Lim [59] draws attention to the fact that technology can contribute to better economic or environmental sustainability, but when used improperly, it can cause a deterioration of sustainability in other areas, causing social or unethical problems. It is also not recommended to limit the focus only to environmental imperatives, but economic, social, and ethical issues should also be considered in order to obtain greater sustainability.
Expenditures for environmental protection refer to economic resources and efforts made to protect, manage, and restore the environment to use it more sustainably. The main purpose of these activities is to reduce and eliminate pollution and to prevent environmental degradation.
These actions include all measures taken to restore the environment after it has been degraded. Presently, environmental protection activities are shifting towards fighting climate change, decreasing air pollution, and preserving biodiversity [60]. Environmental protection includes waste and wastewater management, pollution abatement, protecting biodiversity and landscape, research and development to protect the environment, and other environmental protection activities [61].
However, in OECD countries, environmental spending has the lowest share of public spending. Thus, OECD countries spent on average only 0.7% of GDP in 2016 on environmental protection. The highest ratios were in Greece (1.5%), the Netherlands (1.4%), and Japan (1.2%), where twice the OECD average was spent. United States, Chile, and Finland have dedicated negligible ratios to environmental protection spending, while in the other countries, the ratios were below 1% [62].
There is evidence that rising public environmental protection expenditure brings not only positive results for the environment but has also a positive impact on the economy. According to some studies, the increase in public environmental protection expenditure has a positive effect on economic growth [63].
When referring to environmental protection expenditures, we take into consideration, in particular, the ecological protection of the environment, the development of renewable energy, and energy conservation.
Renewable energy expenditure refers to activities related to producing energy from renewable sources and the amounts allocated for this purpose. Research and development activities on renewable energy are also included here. The most important sources of renewable energy are solar energy, wind energy, hydro energy, ocean energy, geothermal energy, and biomass energy.
Renewable energy technology, such as wind and solar, especially the latter, enables more decentralized production and consumption. As some studies have shown, the market introduction of energy inventions is influenced by the energy technology involved, with solar PV (Photo Voltaic) ving more difficulty in the early years than wind energy and energy-saving [64].
The continuous growth of population and consumption, in parallel with the existence of a limited number of natural resources, presents the urgent need to find alternative solutions and for sustainable and efficient technological innovations. These sustainable technologies can significantly reduce the dependence on non-renewable natural resources, reducing their use. The aim is to create greener production methods so that environmental resources are used more efficiently and with less waste.
Sustainable technology has several advantages, including ensuring an increase in people’s quality of life, protecting the environment against degradation and destruction, improving working conditions, and reducing people’s dependence on non-renewable resources. At the same time, it improves air quality and reduces pollution and waste by recycling.
However, in addition to these benefits, sustainable technologies involve some investments with quite high financial and labor costs. They also involve certain risk factors. However, there is interest among companies in adopting sustainable technologies, given that their customers are increasingly interested in consuming products that are less toxic and more environmentally friendly. Companies are therefore supported and encouraged by the state to adopt new technologies. Responsibility can be discussed in terms of sustainability and in creating an ecological environment for all.
Green innovation includes innovation activities with the purpose of decreasing resource consumption and climate costs in all economic stages, from manufacture and delivery to product use. In this way, pollution is diminished and companies improve their financial performance. There are benefits, especially in manufacturing industries, but also in the transportation and logistics industries.
Green innovations can be used successfully to reduce pollution in the logistics industry. These refer to increasing energy efficiency and the application of green technology. The introduction of electric cars on a large scale in the urban area to reduce pollution should also be noted.
Green innovation adoptions can be understood from three perspectives: technology characteristics, stakeholder pressure (e.g., government and customer pressure), and social influence. In addition, technology characteristics have mediating effects between social influence and green innovation adoption [65].
The government must play an important role in encouraging companies to adopt sustainable technologies and allocate adequate resources in this regard. In the following, we point out some of the tools used by the government. With these tools, the government can subsidize companies for the adoption of new inventions and technologies. At the same time, tariffs on sustainable technology are a way to help companies use this type of technology.
Moreover, it has been observed that tariffs are the most efficient and profitable mechanism for encouraging sustainable technologies, rather than other instruments, like quotas, direct incentives, or voluntary goals [66]. However, government subsidies or incentives do not have to be only financial. Innovative, non-monetary incentives, like providing public recognition or awards, can be as efficient as financial subsidies over the long-term [67]. It is important to mention that government support might have many purposes, including educating organizations about the use of sustainable technology, changing companies’ behavior towards sustainability, and establishing a more environmentally friendly relationship [66].
Small and medium-sized companies can make awareness campaigns concerning sustainable technology that is pleasant, easy to use, and triggers employee interest. Supporting sustainable technology in a form that enhances responsibility concerning the environment could produce a higher acceptance of sustainable technology [66].
Some studies have found a significant favorable influence of sustainability on financial performance [68]. Developing sustainable technologies could be a necessary concern for companies and research institutes to maintain their technological competitiveness [69].
To maximize social welfare, the government can use taxes or subsidies. The government should use tax policy if the ecological cost is high or the negative impact of carbon emissions is high and should use the subsidy otherwise [70].
Only governments that have an informed public at their side can set standards related to the use of common property resources, which include air, water, fauna and flora, and soils, and can adopt standards that will lead us to a regenerative material policy [56].

2.3. Aspects Related to Economic Growth, Technological Progress, and Optimal Climate Policy

In the following, we present some aspects regarding the link between technological progress and economic growth. We also take into consideration that there are institutional differences across countries about their capacity to absorb shocks.
The empirical evidence has shown that a higher level of technical progress is coupled with a lower level of growth volatility and immense expected economic growth. Previous studies found that higher institutional quality positively affects economic growth, decreases growth volatility, and tempers economic crises [71].
Low institutional quality, such as the ineffective rule of law and little executive power restrictions, is blamed for large macroeconomic volatility. In particular, developing countries have been confronted with considerable growth fluctuations during their development [72].
Chu et al. [73] showed that consolidating patent protection improves the incentives for R&D and technical progress, reducing the volatility of economic growth. However, there is still an ongoing debate about the main channel through which technological progress might decrease volatility.
Some authors have found that technological change is a vital stabilizing force of macroeconomic volatility. Results showed that if a technological change increased by one percentage point, the volatility of growth would decrease by one-half to three percentage points [72].
According to Leung et al. [71], a higher level of technical progress reduces growth volatility, and such a decrease represents a good thing for society. Therefore, technological progress leads to “output stabilization”.
Tang et al. [72] summarized some arguments on the link between technical change and macroeconomic volatility, showing a different capacity for countries to absorb shocks. If there is a positive demand shock for a country’s product, that country’s economy will have a higher growth rate than more diversified countries’ economies. In contrast, when an external shock occurs, like a deterioration in trade, countries with low technological knowledge will experience a more severe recession.
Besley and Persson [38] pointed out some aspects related to environmental policy. First, environmentalism is conceived as a fundamental value with consequences for consumer behavior, valuing a different lifestyle that limits pollution. The value of commitment to environmental policy can increase if pollution problems become more severe than previously thought. Then, a future-oriented policymaker, anticipating a change in values, might want to engage in a more draconian policy than would be justified by current preferences.
Next, we will refer to the optimal climate policy and the damage caused by global warming, as highlighted in some studies. Integrated assessment models have to combine dynamic models of the climate system with the dynamic economic ones, as they will help observe their interactions and formulate solutions to decrease greenhouse gas emissions [74].
It is well known that climate change could pose severe risks to current and future generations. Some authors show that carbon taxation, coupled with an appropriate intergenerational redistribution, can improve the well-being of future generations. Thus, Kotlikoff et al. [75] discuss two alternative ways to distribute efficiency gains from controlling CO2 emissions. The first distributes these efficiency gains uniformly to current generations, while the second provides the gains uniformly to future generations.
Nowadays, we can see a rapid expansion in the use of renewable energy technologies. Reducing costs has played a vital role in evolving such technologies in recent years [76]. However, impact studies show very heterogeneous damage in different regions of the world. From failures to agree on a global plan to combat climate change, it seems that climate change views differ significantly between regions [77].
According to Golosov et al. [78], total damages of global warming will increase to a maximum of almost 7% of GDP 100 years from now; the optimal results generate at most a loss of 2.5% of GDP.
According to some other authors, if no climate tax is imposed, OECD countries will suffer considerably and increase climate damages, which will rise to 15% of domestic GDP in the next 200 years. However, the damage would be dramatically more significant in non-OECD countries, exceeding 30% of GDP in 2200, in the laissez-faire allocation. A carbon tax will considerably reduce this damage to less than 10% of GDP for the next 200 years [79].
Hassler and Krusell [77] address the issue of carbon leakage. When one country taxes its gas emission, other countries do not do the same: in this case, at least part of the emissions reduction will “leak out” and lead to an increase in other countries. Therefore, an oil-consuming region will expect other regions to increase taxes on oil consumption. This requires some coordination between oil consumers for them to become better off.
Hillebrand and Hillebrand [79] show that an optimal climate policy can be implemented either through a uniform global CO2 tax or through an emissions trading system that is globally organized. Therefore, there is a choice to be made about the transfer payments between countries because they share the climate change burden. However, this choice depends on the interests of various countries and is highly determined by heterogeneities between them.
Regarding carbon tax, Kotlikoff et al. [75] reveal two ways to limit fossil fuel burning. The first is to make the net-of-tax value of burning coal, oil, and gas low enough to extract costs. The second way refers to providing dirty energy producers an incentive to decrease fossil fuel burning.
Results confirm that a climate tax might lead to a considerable decrease in fossil emissions that considerably diminish climate damage as a percentage of world GDP. The optimal policy gain is already visible in the short run: over 50 years, the global damage is 7.3% of GDP in the laissez-faire scenario, rather than 3.2% under optimal taxation. The gap becomes even more comprehensive in later periods. At the end of the simulation period (the year 2215), damages in the laissez-faire regime exceed 20% of world GDP compared to 6.1% in the optimal case. With laissez-faire, countries do not take any action against climate change, and it is also a threat point [79].
Golosov et al. [78] show that the per-unit extraction tax related to the optimal allocation is nearly equal to the marginal externality cost of emissions: the Pigou tax. A constant value-added tax does not affect the company’s intertemporal decisions and does not affect allocations, no matter how high its level is.
Baldwin et al. [76] give a formula about how the optimal subsidy to the deployment of a “clean” sector is linked to its rate of learning-by-doing and its socially optimal growth. This is the acceleration effect for technology policy.
Since there are significant externalities related to R&D, it might be reasonable that technology accumulation, which generally exists for green technology, be mainly subsidized. However, this increases the favorable treatment of environmental R&D when dealing with an optimal carbon tax [78].
The decentralized equilibrium with the optimal carbon tax, coupled with the optimal subsidy for the externality of learning through achievement in the renewable sector, implements the optimal allocation achieved in the social planner’s problem (the first best) [76].
On the other hand, Baldwin et al. talk about the second-best setting, where political economy issues restrict carbon pricing action. Thus, subsidies will contribute to overcoming short-term political constraints, achieving the climate target, and improving the renewable sector’s ability to play its role in the long-term economy. In a second-best scenario, the authors also differentiate the political instruments used according to how stringent climate policy objectives are.
Hassler and Krusell [77] discussed taxing oil producers as well as oil consumers. Surprisingly, they show that only oil producers’ taxes might improve the climate: taxes on oil consumers do not affect them. In other words, taxation of fossil fuels used in oil-importing countries could be an utterly toothless weapon against the threat of climate change unless the tax receipts are transferred to oil-producing states. The calibrated model shows high differences in views regarding climate policy across regions. However, to make progress in this direction, it is vital to understand the distributional consequences of climate change and policies aimed at limiting the problem. Due to the emission of greenhouse gases, a global externality occurs and therefore requires a global approach. However, the theory indicates that “backward” economies need to grow faster than the leaders because they have already done the “hard lifting” [80].
Hassler and Krusell [77] also reveal some characteristics of ad valorem taxes on oil producers, so total oil production can be affected as long as oil tax rates change over time, but a constant oil tax does not affect the balance. On the other hand, taxes used in oil-consuming regions can redistribute resources without affecting total energy consumption. Therefore, the effects upon the climate are null.
Results confirm that it might be possible to have both a subsidy and a carbon tax, but it is not politically feasible to establish the tax as high as its optimal level [76]. The optimal policy can bring higher taxes on energy if a high cost is perceived [78].

3. Methodology and Data

3.1. Theory Development

Based on the thorough literature review [32,36,45], we want to show the relevance of a governmental intervention index. We argue that such an index is about the redistribution of sources [46,47] and should include aspects of wealth [39], elements of tax-burden, fiscal pressure [32], and sustainability-related issues [63]. Therefore, we define our first research hypothesis: governmental intervention, expressed through the intervention index, is affected by frequent and relevant factors such as education, health, and social protection, the relative wealth of a state, and the role of sustainability within it. Government intervention outcomes may have many consequences that may vary over place and time, for example, due to economic cycles [36].
Highlighting the index of state intervention and measuring the level of this intervention in the economy in different countries is important from an economic and political point of view. Thus, the increase of the share of budget revenues in GDP shows a higher redistribution of resources as a result of increasing state intervention in the economy. In this way, the growth in state expenditures can be supported in order to improve the well-being of the population.
On the other hand, it is necessary to evaluate the macroeconomic and social consequences of state intervention in order to conclude whether state intervention should be increased or decreased. Then, on the basis of the state intervention index, optimal limits can be established within which its intervention could vary over a period of time, that is, limits that would allow a rapid and sustained economic development.
We take the findings from the literature review [65,66] to define our second research hypothesis: government intervention types impact differently in terms of technological achievements. For example, health expenditures are not the same as expenditures on education; moreover, they may have opposite effects. The hypothesis establishes the values of governmental intervention on two dimensions: technological performances and sustainability issues.
Our third research hypothesis was that the more sustainability-oriented the state is, the higher the share of the development of environment-related technologies concerning all other technologies. For that purpose, we assess the literature data from [67,68,69,70] and determine whether the economic strength and expenditure on environment-related aspects may lead to a better technological performance in sustainability-related issues

3.2. Data

Based on the literature, we collected data from the OECD data set on the country level over 17 years from 2000 to 2016. The variables of interest were the GDP, population, tax burden, total governmental revenues, and expenditures on health, education, social protection program, general public services, and economic affairs. These variables reflect budgetary and revenue aspects concerning governmental intervention. We also defined the number of applications for technological patents with Patent Cooperation Treaty (PCT) as a proxy for a state’s technological performance.
In the first phase of the study, we conducted a quantitative analysis based on descriptive statistics of variables of interest. Then, we conducted a statistical analysis to define an intervention index for the various countries over time. The analysis was based on panel data regression analysis. We also investigated the suggested intervention index’s reliability by the partial autocorrelation function (PAC) of each country over time. The relevant variables of the intervention study were used to define their impact on technological performance.

4. Analysis and Findings

This chapter contains three subsections: (i) descriptive statistical analysis, (ii) inference based on panel data of time and country, and (iii) technological performance and intervention variables.

4.1. Expository Analysis

As mentioned before, we aimed to highlight the interference of the state in the economic environment. We initially analyzed the evolution of total tax revenue and total national disbursements in OECD countries.
Figure 1 shows the evolution of tax burden and government expenditure as a percentage of GDP in the 30 countries concerned, over the period between 2000 and 2016. Note that the chart refers to OECD averages.
We notice that the average OECD tax burden slightly dropped between 2000 and 2004, then rose until 2007 and fell back until 2009. However, from 2009 to 2016, it grew again slightly. The OECD average of the quota of total GDP expenses followed somewhat the reverse of the trend of the average tax burden (it actually mirrors the trend when tax% GDP rises expenditure goes down with more pronounced values). It increased between 2000 and 2003, then declined up to 2007. It grew again until 2009 (when it had the highest value, of 47%), but after that, it slightly decreased up to 2016.
Overall, we observe that both the tax burden and total expenditures evolved in a mirrored S shape. The income-based index (taxes and contributions) gradually adapted to the rhythm imposed by the spending policy, but also to the economic developments and cycles [36].
Regarding the evolution of fiscal revenues, we noticed some fiscal relaxation in the early 2000s, aiming to stimulate the economy. Similarly, during 2007–2009, there was a certain relaxation of taxation, occurring with a pronounced increase of expenditures due to the economic crisis, which required an increase in public expenditure to support the economic and social environment. However, after 2009, tax revenues increased to cover budget deficits, attracting more money to the budget through taxes and contributions.
Another aspect that we analyzed was the types of budget expenditures the state places more emphasis on. It is well known that, generally, in developed countries, social protection, health, and education expenses are most prominent, while other types of expenditure predominate in less developed countries.
In other previous studies [46] we identified the priorities in the allocation of budgetary resources, that is, which of the different types of expenditures have higher levels in the budgets of different countries. As a result, we noticed that the social protection expenditures predominate in developed countries. In general, health and general public services expenditures are placed in second place, followed by the expenses with education and economic affairs. Unlike developed countries, developing countries give priority to other types of expenses. Here, generally, the state allocates a significant volume of budgetary resources for expenditures in economic affairs, defense, or general public services.
Expenditures in social protection and those in economic affairs make the difference between more and less interventionist states. Where the state has a significant overall interference, social protection is also favored. On the other hand, in less interventionist states, economic affairs are those that are financially supported more than in other states [36].
We chose to show the main public expenditures over countries in one year, as an overview illustration, rather than for all 17 years. Figure 2 presents the share of the main expenditure types in GDP from 30 OECD countries in 2016.
In OECD countries’ budgets, we noticed that expenditure with social protection, education, health, general public services, and economic affairs are predominant. As we can see from the chart, expenditures with social protection are in the first place in the OECD countries’ budget expenditures, with their share in GDP being clearly greater than other types of expenditure. The highest values are found in Finland (25.63%) and France (24.41%), and the smallest in the US (7.78%) and Korea (6.5%). The OECD average was 16.52% of GDP.
In the second place, we find health expenditures, with the highest values in the USA (9.23%) and Norway (8.71%) and the smallest in Switzerland (2.23%—quite surprising). The OECD average was 6.56%. Health expenditures, in more than half of the studied countries, are followed by expenditures in general public services, with an OECD average of 5.85%. Minimum values fall below 4% of GDP (in Japan), the maximum being over 9% (Greece). In the next place, we find education expenditures, the OECD average (5.19%) being close to that of general public services. In this case, the minimum values are below 4% (Ireland), and the maximum are above 7% (Iceland). In last place are expenditures with economic affairs, with an OECD average of 4.32%. They present a maximum of 7% (in Hungary) and a minimum of 2% (Ireland and Israel).
From Figure 2, it is clear that strong interventionist countries, like France, Denmark, Norway, Sweden, and Finland, have high spending with social protection, well above the OECD average. However, there are also fewer interventionist countries, such as Hungary, Slovakia, Iceland, Czech Republic, Korea, Luxembourg, Estonia, and Slovenia, which sustain economic affairs with public money much more than the average.
Next, in Figure 3 we will present and analyze the evolution of the OECD average for the main public expenditure, (as a percentage of GDP), between 2000 and 2016.
We can observe from Figure 3 that the OECD average of the main types of public spending had small variations over time between 2000 and 2016. The OECD average for social protection expenditures is by far in the first place for the entire analyzed period. It had a minimum value (14.62%) in 2007 and a maximum (16.82%) in 2009. General public service expenditures evolved almost in parallel with health expenditures and had a fairly constant evolution over time of 6–7%. Health expenditures showed the maximum value (6.71%) in 2009 and the minimum (5.33%) in 2000. Education expenditures also had a constant evolution of 5–6%. Finally, economic affairs expenditures had the maximum value (5.62%) in 2010 and the minimum (4.31%) in 2007.
We can conclude that, on average, OECD countries spend around four times less money on economic affairs than on social protection. In some OECD countries, such as Germany, Denmark, Italy, Finland, Greece, France, Sweden, Portugal, the UK, and Israel, this threshold is surpassed. As we can see, many of them are highly interventionist countries. These countries are targeted towards a very active social involvement to the detriment of the economic environment.
Next, we proposed analyzing the rate of tax reversibility for OECD countries. We can calculate the degree of return of taxes to payers (or the reversibility rate) as a percentage ratio between the amount of government expenditure in the public interest and the amount of taxes and social contributions taken from taxpayers.
The phenomenon of tax reversibility (which we mentioned earlier) is in a way the theoretical support of the equivalence theory, which presents the tax compensation as payment due to the state in exchange for benefits or public services that taxpayers benefit from the state. This phenomenon is verified globally, at the level of the total mass of taxpayers. It is worth mentioning the degree of return of taxes to payers (or the reversibility rate), established as a percentage ratio between the volume of public expenditures made by the state in the interest of citizens and the volume of taxes taken by it from taxpayers [81]. Recognizing reversibility as a real phenomenon, we also cannot ignore the existence of negative income tax. It is a means of redistributing income to the poorest, designed to ensure a minimum guaranteed income for the disadvantaged, enabling them to survive. This means that the phenomenon of reversibility is accompanied by the redistributive role of taxes, which can be accepted as one of their defining features [81].
In order to calculate the rate of tax reversibility, we include the costs of social protection, health, education, and culture [46]. In fact, this rate shows the share of social–cultural expenditures in the tax revenues of the analyzed countries, which usually are on the first place in the total expenditures of the developed countries.
From the beginning, we mentioned that among public expenditures, those that directly affect taxpayers are spending on social protection, health, education, and culture (and they are included when calculating the rate of tax reversibility). Several public expenditures indirectly target taxpayers, such as spending on economic activities, environmental protection, research, defense, general public services, security, and public order. Taxpayers benefit from them in their entirety. These are expenditures that satisfy public needs with indivisible character, being supported by the whole society.
Figure 4 shows the rate of tax reversibility in 31 OECD countries. We show numbers of only 2016 for the sake of illustration. From Figure 4, we observe that the reversibility rate is highest in Norway (93.5%) and Finland (91.8%) and the lowest in Korea (60.4%). In 12 countries, this rate is between 70 and 80%, and in 15 countries it is between 80 and 90%. The OECD average was 81.2%, a quite high value. The figures show that the degree of return of taxes to payers is high, with the state offering substantial benefits to taxpayers (pensions, allowances, subsidies, social assistance, medical services, education, etc.). Therefore, the state is concerned with ensuring the well-being of its citizens, effectively spending in their benefit a large part of the resources collected in the budget through taxes and contributions. Thus, we can conclude that in the assessed countries, there are important redistributions of income to population members in the form of different social benefits.
Therefore, we observe that in many of the analyzed countries, there is a great emphasis on social expenditure; in 27 countries, this rate is between 70 and 90% and in 13 countries it is between 80 and90%. This is to the advantage of the citizens of those countries who benefit from the services offered by the state.

4.2. Statistical Analysis

We used the panel data of 30 OECD countries over 17 years to define an intervention index as a function of relative GDP and other variables described below. Therefore, we compute an intervention index based on the estimated parameters of the panel data regression model. This is not a new concept because it is based on our previous research. The intervention index reflects the state intervention, and the level of the intervention index is the predicted value from the panel data regression analysis. Then, we investigate the policy of intervention of states over time using PAC (partial autocorrelation function).
The shape of the model and the variables’ description are consistent with Maşca et al. [36]. Due to missing data points, we used the procedure suggested by Bilitzki and Sadeh [82] to select 30 countries for this study.
The model was run using STATA statistical software. The linear panel data regression models were run and tested for panel data of time and country. The Hausman test was run for random effects and fixed effects. The Chi square was 120.35, with 7 df and p = 0.000. The specification of the model is therefore accepted. Table 1 gives the estimates of the cross-section time series analysis of the following model:
IDit = c0 + c1 × GDPit + c2 × FPit + c3 × EAit + c4 × SPit + c5 × EDit + c6 × HEit + c 7 × GPit + c 8 × EPit +eit,
where ID—interventionism degree, GDP—gross domestic product, FP—fiscal pressure (tax burden), EA—economic affairs, SP—social protection, ED—education, HE—health, GP—general public services, and EP—environment protection.
Description of variables:
ID represents the interventionism degree in country i (i = 1, …, 30) at year t (t = 2000, …, 2016). It is calculated as a percentage ratio between the total government revenue and GDP (budget revenues are that of the consolidated general budget).
GDP is the gross domestic product in country i at year t. It represents a percentage of the total GDP of OECD countries. We have expressed the state intervention by a relative measure that uses GDP, and this requires expressing the exogenous variable associated with GDP in a relative form. We have introduced this determinant to superimpose the effect of the level of a country development (expressed in relative terms) on the state intervention degree.
The following variables constitute a proxy for the structure of public spending, such as expenditure with education, economic affairs, social protection, general public services, health, and environmental protection. They are the most important types of expenditures in the OECD countries’ budgets.
EA means the share of public expenditure in economic affairs of the GDP of country i at year t.
SP means the share of social protection expenditure of the GDP of country i at year t.
ED represents the share of public expenditure in education of the GDP of country i at year t.
HE represents the share of public health expenditure of the GDP of country i at year t.
GP means the share of general public services expenditure in GDP in country i at year t.
EP is the share of environmental protection expenditure of the GDP of country i at year t.
To these exogenous variables, a set of dummy variables was added in order to emphasize the particular features associated with each country in the sample, which may somehow influence the level of state intervention (for example, public policy or liberal orientations of the state).
The dependent variable is lagged by one, which captures the impact of this short time-series data. The goodness of fit of the suggested model is R2 = 0.612, and the standardized residuals are normally distributed.
The impact of the difference among countries is considered via the relative GDP concerning the OECD’s other country members.
All estimated coefficients are significant, except for environment protection expenditures, which were excluded from the panel data regression model. Its estimated value was small negative −0.03 with p = 0.917.
All determined coefficients are considered relevant, with the exception of the environment protection expenditures element, which was excluded from the panel data regression design due to its small assessed value of −0.03 with p = 0.917.
The influence of education (0.650), social protection (0.647), and public services (0.352) are positive, while health (−0.435) is negative. These are the most significant elements in governments’ policies. The proportional GDP negatively affects (−0.188) the interventionism degree, as, in general, a high GDP generates a low interventionism degree. The revenues of states above taxes have a positive impact. The more revenue not available from taxes, the higher the motivation of a country to intervene via public expenditures.
The impact of environmental protection is significant and negative. It is surprising that expenditures on environmental protection are negatively related to the intervention. This intervention index can be judged by its stability and consistency of the policy and strategic aspects regarding intervention over the years per country.
We used the partial autocorrelation (PAC) function of the intervention index per country. When the function decreases after one lag and stays in low values, it can be interpreted that the intervention index is stable over the years and reflects a consistent policy of a given state concerning its intervention. Among the OECD countries in the study, we present graphs of several conditions that can illustrate. Figure 5 shows some examples of the PAC function for these selected countries.
We can see that the intervention index of Norway reflects a firm policy of interventionism over the years. The same can be seen for Germany’s index, with lower confidence. The PAC of Luxembourg reflects an unstable policy of intervention over the years. The same can be said about Poland. However, the reasons could be slightly different.
We can infer the validity of the intervention index from these findings. Norway is well known for its governmental intervention stability, and this is revealed by the PAC of the suggested intervention index. Countries with fluctuation in their governmental intervention will result in a PAC function like the Poland PAC.

4.3. Intervention and Technology Performance

We use the number of applications for technological patent registration as a proxy for the technological performance of a country. The patents are under the Patent Cooperation Treaty (PCT) and are registered in each country but according to the same rules internationally. This measure reflects the number of applications for patents submitted and approved. Note that the patents themselves are not necessarily approved yet.
The data about patents were taken from the OECD data set and proportioned per capita in each country. We clustered the variables using a two-stage cluster analysis. There are three categories of countries: (i) countries with a high ratio of patents per capita, (ii) countries with average rate ratio, and (iii) countries with a low rate of patients per capita.
We used the ordinal regression under cross-section and time-series to define a country’s chances to be in a higher ratio of patents per capita (Table 2). The ordinal dependent variable has three levels (1) low, (2) medium, and (3) high. The independent explanatory variable list includes Health, Education, General Public Services, Economic Affairs, Financial Burden-OECD, Government Revenues (lagged), and GDP per capita as an explanatory variable that reflects the economic strength of a country.
We aim to emphasize the role of education against health or social protection. The magnitude of the strength of an economy, and its wealth has a positive impact on the chances to be in the highest category.
The chances for a country to be in the third and highest category of technological performance, as the PCT reveals, increase with the increase in its GDP per capita. Economic strength is an important factor in pushing a state ahead.
Public expenditures on health as a share of GDP have a negative impact on the chances to be in a better technological performance category. This is the same with social protection, general public services, and expenditure on economic affairs. However, public expenditures on education may lead to better technological performance for a state, which is a meaningful finding that may show how expenditures on education contribute to the performance of countries. One may say that these are an investment in education.
The role of a tax burden on technological performance is negative (−0.792)—the more taxes, the fewer chances to be in a high category of technology performance. The tax burden is taken as the average tax burden of the OECD countries.
The revenue that a state has over its tax revenues may also lead to better technological performance. It seems that rich countries can do better. Tax burden may lead to lower technological performance. It should be pointed out that these are not the reasons for better technological performance but somewhat more correlative factors.
We analyzed the R&D funding from public resources. We used the OECD data (GABM) about governmental expenditures on R&D of the countries in our study. There is no correlation between the governmental expenditure on R&D and tax burden (r = 0.07, p = 0.898). When we compared the governmental expenditure on R&D and the technological performance as measured in this study, we found a small correlation, r = 0.094 with p = 0.063. We tested for differences in means of governmental expenditure on R&D by the three levels of technological performance (see Table 2). We found no significant difference with p = 0.752.

4.4. Intervention and Technology Issues of Sustainability

The share of the development of environment-related technologies with respect to all other technologies was analyzed using the panel data about OECD countries. The Hausman Chi Square statistics between random effects and fixed effects is 160.9 with 8 df and p = 0.00. The goodness of fit is R2 = 0.766.
It was found that in the OECD countries, the more expenses are on health (0.086) and economic affairs (0.122), the higher the share of environment-related technologies out of technology development (Table 3). The same can be said about the GDP per capita. Richer countries gain more developed environmental-related technologies than poorer countries. The impacts of other explanatory variables were derived in a straightforward manner from the government expenses on R&D for renewable energy concerning other R&D expenses (0.077), expenditures on R&D for energy (0.159), and environment-related expenses (0.067). The most important explanatory variable is the relative advantage of a country concerning environment-related technology (0.796).
Table 4 illustrates findings from the three analyses. The intervention index for each country for 2016 is presented along with its explanatory variables. The dependent variables of the other two analyses are given for 2016 by country.

5. Discussion

We showed that the social protection programs of many countries are the leading public expenditure factor. This represents about 25% of the GDP in Finland out of 52% of total governmental expenditures. In Korea, the expenditures on social protection are about 8% of the Korean GDP. The entire governmental expenditures were, on average, 26% of the Korean GDP. Countries with a high level of intervention spend more on social protection.
According to Mașca et al. [36], the EU’s social protection gathered, on average, 18% of GDP in 2007. The minimum values fell below 10%, and the maximum ones were beyond 22% (most of UE countries being also OECD countries). Here, the authors are especially interested in the social protection expenditure, which is added to the public costs of sustaining economic affairs. These two types of spending differentiate between the more or fewer interventionist states. On average, EU states invest four to five times more money on social welfare than on economic affairs.
While the level of intervention differs among the countries, it was expressed in this study that states with relatively better economic strength tend to intervene less in their economics via taxes and expenditures. This also can be compared to results given by [52] for five countries. The relative GDP has a significant negative impact on state intervention.
The suggested governmental intervention that considers budget sides and governmental revenues seems to be a reliable index. We used the PAC function to examine the proposed index for each country over the years. It appears that there are no cyclical patterns as were investigated by Bresser-Pereira [8]. Countries with a consistent policy of interventions, like Norway and Austria, have stable low PAC functions. However, countries like Luxemburg and Poland have no stable PAC functions.
As suggested in this study, the role of governmental expenditures on technological performance has an interesting pattern. Spending on education is positively correlated with better technological performance in contrast to the other governmental expenses like health, social protection, and general public services.
Like the GDP per capita, the size and strength of a country affect the technological performance positively. This finding may not be surprising since better economies attract technological projects and are more capable of keeping ongoing research and development efforts.
Governmental intervention via tax burden has a negative impact on technological performance, which could be interpreted as showing that the more taxes a government collects, the less the motivation to proceed with innovations and technological performance. This also agrees with the findings of Qi et al. [83], in which certain taxes cause a significant decrease in the number of patents.
However, the higher government revenues are, the more technological performance could result from the innovative atmosphere. The non-taxed revenues of a government lead to better performance in the area of technological innovations. This can be compared with the negative correlation between technological performance and deviation in per capita GDP as shown by Tang [72].
The technological performance of OECD countries in environment-related technologies is significantly positively related to the rate of expenditure on health and economic affairs and the richness of a country as measured by its GDP per capita. Similar findings were also found in a study conducted in ECOWAS countries by Alimi et al. [84].

6. Conclusions

In the OECD countries’ budgets, we noticed that expenditure with social protection, education, health, general public services, and economic affairs are predominant. Expenditures with social protection are in the first place, their share in GDP being superior to other types of expenditure. The OECD average was 16.52% of GDP.
In the second place, we find health expenditure, with an average of 6.56%. In more than half of the studied countries, health expenditures are followed by expenditure on general public services, with an OECD average of 5.85%. In the next place, we find education expenditure, the average (5.19%) being close to general public services. In the fifth position are expenditures with economic affairs, with an average of 4.32%. In other previous studies [46], we identified the priorities in allocating budgetary resources, that is, which of the different types of expenditures have higher levels in different countries’ budgets. As a result, we noted that the social protection expenditures were predominant in the developed countries, with an average of 12.2%. Then, in general, education (with an average of 5%) and health expenditures (an average of 4.8%) were placed in the second place, followed by the expenses with economic affairs (4.3%).
Another study [85] showed that the state is mainly interested in certain types of spending, such as social protection, education, healthcare, and general public services.
Like France, Denmark, Norway, Sweden, or Finland, influential interventionist countries have high spending on social protection, significantly higher than the OECD average. However, there are also fewer interventionist countries, such as Hungary, Slovakia, Iceland, Czech Republic, Korea, Luxembourg, Estonia, and Slovenia, which sustain economic affairs with public money much more than the average.
On average, we observe that OECD countries allocate a budget about four times higher for social protection than for economic affairs. In some OECD countries, such as Germany, Denmark, Italy, Finland, Greece, France, Sweden, Portugal, the UK, and Israel, this threshold is surpassed. As we can see, many of them are highly interventionist countries. These countries are targeted towards a very active social involvement to the detriment of the economic environment.
We also observed a great emphasis on social expenditure: the rate of reversibility has high values, and in some countries, even higher values. A high rate of reversibility is advantageous to the citizens of those countries that benefit from their state’s services. In many OECD countries, there is significant redistribution of income to individuals in terms of different social benefits.
This study’s aim was to reveal the impact of governmental intervention on technological performance and sustainability issues. We present an intervention measure based on the panel data regression model, referring to it as the intervention index.
The empirical analysis aims to establish the relevance of the main determinants of state intervention through budget revenues in OECD countries. If the budget funding focuses on those expenditures that allow a good reversibility (social protection, education, health, culture), then the taxpayers will more easily consent to increasing the tax burden, generating resources for the state to expand the level of interventionism. Therefore, in our study, we define the most important expenditures that consist of the level of intervention. The wealth of states leads to less intervention. Surprisingly, the expenditure on environmental protection is negatively associated with an intervention.
An intervention index of a state over time reflects the stability of government policies over time. We used the partial autocorrelation function to express the stability of the intervention policy of a given country. The methodology used in observing the PAC of a state’s intervention index may serve as a small contribution to the literature.
We conclude from this finding that sustainability-related issues are relatively more considerable in states with less intervention.
The technological performance of states is an essential issue in states’ economic aspects because it may lead to economic growth. The study reveals the correlation between technological performance and certain governmental expenditures. The research shows the positive relationship between expenditure on education and better technological performance.
Furthermore, the study reveals that the development of environment-related technologies correlates with distinct factors such as budget allocation to R&D of renewable energy, the state’s economic strength (GDP), and health expenditures.
There are some limitations to this study.
One limitation is closely related to the total governmental revenues. The research took into account actual tax revenues reported in the literature but did not take into account the percentage of GDP that was not collected from the annualized GDP estimate. Nevertheless, the state is obliged to be as efficient as possible in increasing its tax revenues and reducing the budget deficit, so we consider that the percentage of taxes collected improves over time as the country matures economically and does not significantly influence the tax rate of the population. The GDP measurement also suffers from a number of biases and blind spots (e.g., the measurement of unpaid household or informal services and activities that are not part of the legalized economy) [86], and while GDP can provide an overview of the economy’s performance over time, it does not show the whole story.
Due to missing data points for some countries, there is a lack of reports on certain public spending, and it would be useful to supplement the data. In order to have a better and more realistic econometric model, we could expand it to include more variables, e.g., by adding other public spending. This might be the subject of another study, presenting the other public expenditures of the state. We consider a future extension of the period under analysis, also highlighting more aspects related to sustainability and the carbon policy.
We consider that many issues are still open that could generate future studies on the role of specific policies and interventions, e.g., the role of educational system practices or by different cultural norms and institutions in the efficiency of government reforms and targeted interventions.
We expect that future research will expand our analysis concerning RD&D, renewable energy budget, and environmentally related government R&D budget.
Future analysis should also focus on how civic culture affects state capacity and public good provision. These would provide additional and improved insights.

Author Contributions

Conceptualization, A.S. and C.F.R.; methodology, A.S. and C.F.R.; software, A.S.; C.F.R. and A.B.; validation, C.F.R.; C.F. and A.B.; formal analysis, A.S. and C.F.R; investigation, A.S.; resources, A.B.; data curation, C.F.R.; A.B. and C.F.; writing—original draft preparation, A.S. and C.F.R.; writing—review and editing, A.S.; C.F.R. and A.B.; visualization, C.F.R. and A.B.; supervision, A.S.; project administration, C.F.; funding acquisition, A.B. and C.F. All authors have read and agreed to the published version of the manuscript.

Funding

This research received no external funding.

Institutional Review Board Statement

Not applicable.

Informed Consent Statement

Not applicable.

Data Availability Statement

No new data were created or analyzed in this study. Data sharing is not applicable to this article.

Acknowledgments

Thanks to the participants of the faculty seminar of HIT’s Technology Management for their comments on early drafts of this article.

Conflicts of Interest

The authors declare no conflict of interest.

References

  1. Karagianni, S.; Pempetzoglou, M.; Saraidaris, S. Tax burden distribution and GDP growth: Non-linear causality considerations in the USA. Int. Rev. Econ. Financ. 2012, 21, 186–194. [Google Scholar] [CrossRef]
  2. Gadomski, W.; Inotai, A.; Krupa, K.; Krupa, J.; Köhler, H.; Orlowski, W. How Much State in Economy—A Selection of Essays; CEED Institute: Warsaw, Poland, 2015. [Google Scholar]
  3. Weir, M. International Encyclopedia of the Social and Behavioral Sciences. 2001, pp. 16432–16435. Available online: https://www.sciencedirect.com/science/article/pii/B0080430767010949 (accessed on 30 September 2020).
  4. Boettke, P.J.; Leeson, P.T. Introduction: The Economic Role of the State. 2015. Available online: https://papers.ssrn.com/sol3/papers.cfm?abstract_id=2664244 (accessed on 20 August 2019).
  5. Herman, S. War Damage and Nationalization in Eastern Europe. Law Contemp. Probl. 1951, 16, 498–518. [Google Scholar] [CrossRef] [Green Version]
  6. Hamburg Institute of International Economics (HWWA). The economic systems of the East European countries at the start of the nineties. Intereconomics 1990, 25, 97–106. [Google Scholar] [CrossRef] [Green Version]
  7. Gonzalez, D. Economic development after World War II. 2018. Available online: https://www.researchgate.net/publication/326033183 (accessed on 30 September 2020).
  8. Bresser-Pereira, L.C. Five models of capitalism. Rev. Econ. Polit. 2012, 32, 21–32. [Google Scholar] [CrossRef] [Green Version]
  9. Tanzi, V. The Role of the State and Public Finance in the Next Generation. OECD J. Budg. 2008, 8, 1–27. [Google Scholar] [CrossRef] [Green Version]
  10. Collier, P. The Political Economy of State Failure. Oxf. Rev. Econ. Policy 2009, 25, 219–240. [Google Scholar] [CrossRef] [Green Version]
  11. Jahan, S.; Mahmud, A.S.; Papageorgiou, C. What Is Keynesian Economics? Financ. Dev. 2014, 51, 53–54. [Google Scholar]
  12. Vaggi, G.; Groenewegen, P. Milton Friedman (1912–): Monetarism and its Critics. A Concise History of Economic Thought. 2003, pp. 319–324. Available online: https://link.springer.com/chapter/10.1057/9780230505803_34 (accessed on 30 November 2020).
  13. Andrada, A.F.S. Understanding Robert Lucas (1967–1981): His influence and influences. EconomiA 2017, 18, 212–228. [Google Scholar] [CrossRef] [Green Version]
  14. Weiss, L. The State in the Economy: Neoliberal or Neoactivist? In Oxford Handbook of Comparative Institutional Analysis; University Press: Oxford, UK, 2010. [Google Scholar]
  15. Stiglitz, J. Globalization and the economic role of the state in the new millennium. Industr. Corp. Chang. 2003, 12, 3–26. [Google Scholar] [CrossRef] [Green Version]
  16. Ahlborn, C.; Grave, C. Walter Eucken and Ordoliberalism: An Introduction from a Consumer Welfare Perspective. Compet. Policy Int. 2006, 2, 197–217. [Google Scholar]
  17. Wörsdörfer, M. On the Economic Ethics of Walter Eucken. In Book: 60 Years of Social Market Economy. Formation, Development and Perspectives of a Peacemaking Formula; Konrad Adenauer Stiftung: Berlin, Germany, 2010; pp. 20–41. [Google Scholar]
  18. Goldschmidt, N. Alfred Müller-Armack and Ludwig Erhard: Social Market Liberalism. Freiburg Discussion Papers on Constitutional Economics 04/12; Walter Eucken Institut e.V.: Breisgau, Germany, 2004; pp. 1–23. [Google Scholar]
  19. Audier, S. A German Approach to Liberalism? Ordoliberalism, Sociological Liberalism, and Social Market Economy. L’Économie Polit. 2013, 60, 48–76. [Google Scholar] [CrossRef]
  20. Janiszewska, D. The Social Market Economy Concept According to Alfred Müller-Armack. Pol. J. Econ. 2015, 277, 107–132. [Google Scholar] [CrossRef]
  21. Glossner, C.L.; Gregosz, D. The Formation and Implementation of the Social Market Economy by Alfred Müller-Armack and Ludwig Erhard: Incipiency and Actuality; Konrad-Adenauer-Stiftung e.V.: Sankt Augustin/Berlin, Germany, 2011. [Google Scholar]
  22. Bardhan, P. State and development: The need for a reappraisal of the current literature. J. Econ. Lit. 2016, 54, 862–892. [Google Scholar] [CrossRef] [Green Version]
  23. Tabellini, G. The role of the state in economic development. Kyklos 2005, 58, 283–303. [Google Scholar] [CrossRef]
  24. Reinert, E.S. The role of the state in economic growth. J. Econ. Stud. 1999, 26, 268–326. [Google Scholar] [CrossRef] [Green Version]
  25. Buendía, L.; Palazuelos, E. Economic growth and welfare state: A case study of Sweden. Camb. J. Econ. 2014, 38, 761–777. [Google Scholar] [CrossRef]
  26. Esping-Andersen, G. The three political economies of the welfare state. Can. Rev. Sociol. 1989, 26, 10–36. [Google Scholar] [CrossRef] [Green Version]
  27. Esping-Andersen, G.; Gallie, D.; Hemerijck, A.; Myles, J. Why We Need a New Welfare State; Oxford University Press Inc.: New York, NY, USA, 2002. [Google Scholar]
  28. Esping-Andersen, G.; Gallie, D.; Hemerijck, A.; Myles, J. A New Welfare Architecture for Europe. Report Submitted to the Belgian Presidency of the European Union. 2001. Available online: https://www.researchgate.net/publication/238758771_A_NEW_WELFARE_ARCHITECTURE_FOR_EUROPE_Report_submitted_to_the_Belgian_Presidency_of_the_European_Union (accessed on 14 August 2020).
  29. Esping-Andersen, G. A Welfare State for the 21st Century. Glob. Third Way Debate 2001, 134, 156. [Google Scholar]
  30. Kotz, D.M. The Role of the State in Economic Transformation. 2005. Available online: https://www.umass.edu/economics/publications/2005-04.pdf (accessed on 4 September 2019).
  31. Berger, N.; Fisher, P. A Well-Educated Workforce is Key to State Prosperity. EARN 2013. Available online: https://www.epi.org/files/2013/A%20well-educated%20workforce%20is%20key%20to%20state%20prosperity.pdf (accessed on 20 August 2019).
  32. Maşca, S.G. Efficiency of public expenditure: Review and preliminary results for Romania. Internat. J. Acad. Res. Bus. Social Sci. 2014, 4, 326–347. [Google Scholar]
  33. Mitchell, D.J. The Impact of Government Spending on Economic Growth. Backgrounder 2005, 1831, 1–18. [Google Scholar]
  34. Gale, W.G.; Samwick, A.A. Effects of Income Tax Changes on Economic Growth, The Brookings Institution 2014. Available online: https://www.brookings.edu/wp-content/uploads/2016/06/09_Effects_Income_Tax_Changes_Economic_Growth_Gale_Samwick.pdf (accessed on 27 August 2019).
  35. Giday, A.; Mádi, L. Tax burden on labor income in the visegrád region. Public Financ. Q. 2018, 3, 376–401. [Google Scholar]
  36. Maşca, S.G.; Văidean, V.L.; Golguţ, A. The state and the economy—Theoretical aspects and empirical evidence for the EU. Theoret. Appl. Econ. 2011, XVIII, 17–44. [Google Scholar]
  37. Besley, T.; Persson, T. The Origins of State Capacity: Property Rights, Taxation, and Politics. Am. Econ. Rev. Am. Econ. Assoc. 2009, 99, 1218–1244. [Google Scholar] [CrossRef] [Green Version]
  38. Besley, T.; Persson, T. JEEA-FBBVA LECTURE 2017: The Dynamics of Environmental Politics and Values. J. Eur. Econ. Assoc. 2019, 17, 993–1024. [Google Scholar] [CrossRef]
  39. Besley, T. State Capacity, Reciprocity, and the Social Contract. Econom. Econom. Soc. 2020, 88, 1307–1335. [Google Scholar] [CrossRef]
  40. Bisin, A. A comment on State Capacity, Reciprocity, and the Social Contract. Econom. Econom. Soc. 2020, 88, 1345–1349. [Google Scholar] [CrossRef]
  41. Besley, T. Reply to: Comments on “State Capacity, Reciprocity, and the Social Contract”. Econom. Econom. Soc. 2020, 88, 1359–1362. [Google Scholar] [CrossRef]
  42. Papaioannou, E. A comment on State Capacity, Reciprocity, and the Social Contract. Econom. Econom. Soc. 2020, 88, 1351–1358. [Google Scholar] [CrossRef]
  43. Bowles, S. A comment on State Capacity, Reciprocity, and the Social Contract. Econom. Econom. Soc. 2020, 88, 1337–1343. [Google Scholar] [CrossRef]
  44. Wronowska, G. The role of the state in economy—Theoretical depiction. 2005. Available online: http://mikroekonomia.net/system/publication_files/925/original/17.pdf?1315224523 (accessed on 20 August 2019).
  45. Radu, C.F. The importance of State’s involvement in economy. Sci. J. Humanist. Stud. 2013, 8, 223–227. [Google Scholar]
  46. Radu, C.F. Reversibilitatea Impozitelor; Mega Publishing House: Cluj-Napoca, Romania, 2009. [Google Scholar]
  47. Korpi, W.; Palme, J. The paradox of redistribution and strategies of equality: Welfare state institutions, inequality and poverty in the western countries. Amer. Sociol. Rev. 1998, 63, 661–687. [Google Scholar] [CrossRef] [Green Version]
  48. Schwabish, J.A.; Smeeding, T.M.; Osberg, L.S. Income Distribution and Social Expenditures: A Cross-National Perspective. Luxembourg Income Study Working Paper No. 350. 2003. Available online: http://dx.doi.org/10.2139/ssrn.434605 (accessed on 20 August 2019).
  49. Hümbelin, O.; Farys, R. Redistribution through taxes and deductions. A Decomposition Analysis with Administrative Tax Data from Switzerland, University of Bern Social Sciences Working Paper No. 26. 2017. Available online: http://repec.sowi.unibe.ch/files/wp26/Huembelin-Farys-2017-Redistribution.pdf (accessed on 4 September 2019).
  50. Boix, C. Redistribution Policies in a Globalized World, Chapter 8, Making Globalization Socially Sustainable. 2011. Available online: https://www.wto.org/english/res_e/booksp_e/glob_soc_sus_e_chap8_e.pdf (accessed on 27 August 2019).
  51. Tomaszewicz, Ł.; Trębska, J. The role of general government in the income redistribution in the Polish economy. J. Internat. Stud. 2015, 8, 83–100. [Google Scholar] [CrossRef] [PubMed]
  52. Hümbelin, O.; Farys, R. Income redistribution through taxation—How deductions undermine the effect of taxes. J. Income Distrib. 2017, 25, 1–35. [Google Scholar]
  53. Kuypers, S.; Figari, F.; Verbist, G. Redistribution in a Joint Income-Wealth Perspective: A Cross-Country Comparison, CSB Working Paper No. 18/05. 2018. Available online: https://www.econstor.eu/bitstream/10419/197570/1/1025283287.pdf (accessed on 4 September 2019).
  54. Ostry, J.D.; Berg, A.; Tsangarides, C.G. Redistribution, Inequality, and Growth, IMF 2014. Available online: https://www.imf.org/external/pubs/ft/sdn/2014/sdn1402.pdf (accessed on 20 August 2019).
  55. Boncu, Ș.; Holman, A. Traffic and urban environment sustainability. Social Psych. 2010, 25, 87–101. [Google Scholar]
  56. Deneș, C.; Radu, S. Resource Management and Sustainability. 2011. Available online: http://old.uefiscdi.ro/Upload/3b4536fb-56c5-46fd-b5a5-776c8e5f71f8.pdf (accessed on 10 May 2020).
  57. Varadarajan, R. Toward sustainability: Public policy, global social innovations for base-of-the-pyramid markets, and demarketing for a better world. J. Int. Mark. 2014, 22, 1–20. [Google Scholar] [CrossRef]
  58. Lim, W.M. Inside the sustainable consumption theoretical toolbox: Critical concepts for sustainability, consumption, and marketing. J. Bus. Res. 2017, 78, 69–80. [Google Scholar] [CrossRef]
  59. Lim, W.M. A blueprint for sustainability marketing: Defining its conceptual boundaries for progress. Mark. Theory 2016, 16, 232–249. [Google Scholar] [CrossRef]
  60. Eurostat. Environmental Protection Expenditure Accounts Handbook. 2017. Available online: http://ec.europa.eu/eurostat (accessed on 10 May 2020).
  61. OECD. Government expenditures by function (COFOG). In Government at a Glance 2019; OECD Publishing: Paris, France, 2019. [Google Scholar]
  62. OECD. National Accounts and Government at a Glanc—Yearly Updates. Available online: https://stats.oecd.org (accessed on 20 August 2019).
  63. Krajewski, P. The impact of public environmental protection expenditure on economic growth. Probl. Sustain. Devel. 2016, 11, 99–104. [Google Scholar]
  64. Nejabat, R.; Van Geenhuizen, M. Entrepreneurial risk-taking in sustainable energy: University spin-off firms and market introduction in northwest Europe. Sustainability 2019, 11, 6952. [Google Scholar] [CrossRef] [Green Version]
  65. Zhang, H.; He, J.; Shi, X.; Hong, Q.; Bao, J.; Xue, S. Technology characteristics, stakeholder pressure, social influence, and green innovation: Empirical evidence from Chinese express companies. Sustainability 2020, 12, 2891. [Google Scholar] [CrossRef] [Green Version]
  66. Bakar, F.A.; Talukder, M.; Quazi, A.; Khan, I. Adoption of sustainable technology in the Malaysian SMEs sector: Does the role of government matter? Information 2020, 11, 215. [Google Scholar] [CrossRef] [Green Version]
  67. Sumaila, U.; Khan, A.; Teh, L.; Watson, R.; Tyedmers, P.; Pauly, D. Subsidies to high seas bottom trawl fleets and the sustainability of deep-sea demersal fish stocks. Mar. Policy 2010, 34, 495–497. [Google Scholar] [CrossRef]
  68. Zhang, Y.; Khan, U.; Lee, S.; Salik, M. The influence of management innovation and technological innovation on organization performance. A mediating role of sustainability. Sustainability 2019, 11, 495. [Google Scholar] [CrossRef] [Green Version]
  69. Jun, S. Bayesian count data modeling for finding technological sustainability. Sustainability 2018, 10, 3220. [Google Scholar] [CrossRef] [Green Version]
  70. Yin, X.; Chen, X.; Xu, X.; Zhang, L. Tax or subsidy? Optimal carbon emission policy: A supply chain perspective. Sustainability 2020, 12, 1548. [Google Scholar] [CrossRef] [Green Version]
  71. Leung, C.; Tang, S.; Groenewold, N. Growth Volatility and Technical Progress: A Simple Rent-seeking Model. J. Econ. 2006, 88, 159–178. [Google Scholar] [CrossRef]
  72. Tang, S.H.K.; Groenewold, N.; Leung, C.K.Y. The link between institutions, technical change and macroeconomic volatility. J. Macroecon. 2008, 30, 1520–1549. [Google Scholar] [CrossRef]
  73. Chu, A.C.; Leung, C.K.Y.; Tang, E. Intellectual property rights, technical progress and the volatility of economic growth. J. Macroecon. 2012, 34, 749–756. [Google Scholar] [CrossRef] [Green Version]
  74. Miftakhova, A.; Judd, K.L.; Lontzek, T.S.; Schmedders, K. Statistical approximation of high-dimensional climate models. J. Macroecon. 2020, 214, 67–80. [Google Scholar] [CrossRef]
  75. Kotlikoff, L.J.; Kubler, F.; Polbin, A.; Sachs, J.D.; Scheidegger, S. Making Carbon Taxation a Generational Win Win. NBER Working Papers No. 25760. 2019. National Bureau of Economic Research, Inc. Available online: https://www.nber.org/system/files/working_papers/w25760/w25760.pdf (accessed on 30 September 2020).
  76. Baldwin, E.; Cai, Y.; Kuralbayeva, K. To build or not to build? Capital stocks and climate policy. J. Environ. Econ. Manag. 2020, 100, 1–24. [Google Scholar] [CrossRef] [Green Version]
  77. Hassler, J.; Krusell, P. Economics and Climate Change: Integrated Assessment in a Multi-Region World. J. Eur. Econ. Assoc. 2012, 10, 974–1000. [Google Scholar] [CrossRef]
  78. Golosov, M.; Hassler, J.; Krusell, P.; Tsyvinski, A. Optimal Taxes on Fossil Fuel in General Equilibrium. Econom. Econom. Soc. 2014, 82, 41–88. [Google Scholar]
  79. Hillebrand, E.; Hillebrand, M. Optimal climate policies in a dynamic multi-country equilibrium model. J. Econ. Theory 2019, 179, 200–239. [Google Scholar] [CrossRef] [Green Version]
  80. Cai, Y.; Brock, W.; Xepapadeas, A.; Judd, K. Climate Policy under Cooperation and Competition between Regions with Spatial Heat Transport. NBER Working Papers 24473. 2018. National Bureau of Economic Research, Inc. Available online: http://www.nber.org/papers/w24473 (accessed on 30 September 2020).
  81. Tulai, C.I. Finanțele Publice și Fiscalitatea; Casa Cărții de Știință Publishing House: Cluj-Napoca, Romania, 2003. [Google Scholar]
  82. Bilitzky, A.; Sadeh, A. Efficient Solutions for Special Zero-One Programming Problems. J. Comb. Optim. 2005, 10, 227–238. [Google Scholar] [CrossRef]
  83. Qi, Y.; Peng, W.; Xiong, N. The Effects of Fiscal and Tax Incentives on Regional Innovation Capability: Text Extraction Based on Python. Mathematics 2020, 8, 1193. [Google Scholar] [CrossRef]
  84. Alimi, O.Y.; Ajide, K.B.; Isola, W.A. Environmental quality and health expenditure in ECOWAS. Environ. Dev. Sustain. 2020, 22, 5105–5127. [Google Scholar] [CrossRef]
  85. Mașca, S.G. Is the Budgetary Policy Aggressive? Rev. Econ. Stud. Res. Virgil Madgearu 2008, 2, 97–113. [Google Scholar]
  86. DeRock, D. Hidden in Plain Sight: Unpaid Household Services and the Politics of GDP Measurement. New Politi. Econ. 2019, 1–16. [Google Scholar] [CrossRef]
Figure 1. Total tax and total expenditure as a percent of GDP (OECD averages). Source: authors’ construction.
Sustainability 13 00166 g001
Figure 2. The main public expenditures in 30 OECD countries (% GDP), 2016. Source: authors’ construction.
Sustainability 13 00166 g002
Figure 3. Evolution of the OECD average for the main public expenditure. Source: authors’ construction.
Sustainability 13 00166 g003
Figure 4. Rate of tax reversibility in 30 OECD countries (%), 2016. Source: authors’ construction.
Sustainability 13 00166 g004
Figure 5. Partial autocorrelation function by 16 lags of the intervention index of (a) Luxembourg (b) Norway, (c) Austria, (d) Germany, and (e) Poland.
Sustainability 13 00166 g005aSustainability 13 00166 g005b
Table 1. Estimates of model parameters and their corresponding significance levels.
VariableStandardized CoefficientsStd. Errorp-Value
Health−0.4350.1680.009
Education0.6500.2750.024
GDP % of OECD−0.1880.0980.042
Public Services0.3520.1050.001
Social Protection0.6470.0680.00
Financial Burden-OECD1.1260.1640.00
Table 2. Ordinal Regression with Panel Data for Patent Categories: 1 Low, 2 Medium, and 3 High.
VariableStandardized CoefficientsStd. Errorp-Value
ThresholdCategory 1−18.1347.9530.023
Category 2−15.9527.9390.045
LocationHealth−0.1490.0810.066
Education0.4610.1410.001
General Public Services−0.0950.0540.081
Economic Affairs−0.8870.1160.000
Financial Burden, OECD−0.7920.2370.001
Government Revenues (lagged)0.2270.0390.000
GDP per capita0.0930.0110.00
Table 3. The standardized parameter estimates of the share of the development of environment-related technologies and of all technologies and their corresponding significance levels.
VariableStandardized CoefficientsStd. Errorp-Value
Renewable energy public RD&D budget, % total energy public RD&D0.0770.0080.021
Energy public RD&D budget, % GDP0.1594.1570.000
Development of environment-related technologies, inventions per capita0.1150.0060.001
General government expenditure by function, environment protection, percentage of GDP0.0670.3660.034
Expenditures in health0.0860.0710.005
Expenditures in economic affairs0.1220.0690.000
GDP per Capita0.1390.0070.00
Relative advantage in environment-related technology0.7960.3690.00
Table 4. Values of the intervention index, its explanatory variables, and the dependent variables of the other two analyses are given for 2016 by country.
CountryIntervention IndexSPHEEUGPEAGDP % of OECDGDP per Cap.Patents per CapitaEnvironment-Related Technologies, of All Technologies
Australia46.9710.207.015.294.523.632.1848.960.089.16
Austria46.7921.588.004.956.585.670.8150.660.189.88
Belgium40.7620.037.406.417.966.480.9746.310.129.09
Czech Republic37.0412.307.444.464.195.920.6834.600.0212.25
Denmark37.6123.358.616.926.783.350.5249.170.2322.35
Estonia37.5413.535.315.924.224.280.0729.820.0320.31
Finland37.7125.627.226.058.074.540.4443.320.2511.36
France37.4024.418.095.396.125.605.1142.730.1210.49
Germany34.3019.267.174.215.833.087.4449.200.2311.25
Greece38.3920.664.914.309.223.790.5325.790.0112.63
Hungary34.7314.344.814.897.937.050.4826.870.036.51
Iceland39.0513.397.477.106.784.830.0351.200.0913.31
Ireland38.769.865.193.283.682.300.6371.830.104.89
Israel38.6210.715.136.854.972.330.5938.870.277.40
Italy38.3521.116.953.907.903.964.3039.150.069.11
Japan38.2416.157.563.353.983.669.9142.030.348.20
Korea32.946.504.125.225.095.243.4736.960.2910.67
Latvia39.1911.215.804.784.323.260.0925.440.020.00
Luxembourg44.3318.164.774.824.755.550.11103.500.1710.96
Netherlands31.6616.207.695.294.313.911.5950.670.218.71
Norway32.2120.348.715.634.675.390.5758.580.738.26
OECD Average37.1916.526.565.195.854.322.9344.530.1510.33
Poland32.3516.954.654.984.674.071.9227.200.019.91
Portugal32.3917.995.944.868.263.200.5830.520.0210.61
Slovak Republic32.1615.137.363.845.274.480.3130.390.0114.70
Slovenia40.3516.686.715.576.604.550.1232.520.059.69
Spain32.6816.836.044.026.093.943.1236.410.049.91
Sweden44.7720.606.886.636.604.150.9049.330.3411.62
Switzerland32.8513.602.235.594.754.020.9963.670.316.52
United Kingdom32.5815.807.584.664.573.015.1742.530.0910.72
United States32.887.789.236.105.383.3134.3857.810.179.43
These numbers are for 2016. Numbers in a column are marked by colors: Red means very low and Green means very high. A lighter color means a smaller magnitude.
Publisher’s Note: MDPI stays neutral with regard to jurisdictional claims in published maps and institutional affiliations.

