1. Introduction
Transportation accounts for 29% of greenhouse gas emission and 28% of total energy consumption in the US [
1,
2]. Environmentally sustainable planning strategies lead to the popularity of public transit and bike-share for sustainable cities. Currently, more than 1500 bike-share projects have been carried out and the number continues increasingly rapidly [
3]. The bike-share system was promoted to solve the first/last mile transit trip [
4]. Hoehne and Chester found that multimodal transit trips with automobile use could have higher emissions than automobile trips alone, which was mainly resulted from more fossil fuel energy generation and combustion, lower vehicle occupancies, and longer trip distances. Switching from automobile first/last mile trips to low-carbon modes, such as biking, would greatly decrease greenhouse gas (GHG) emissions and negative environmental effects [
5]. There are four generations of bike-share system: Witte Fietsen (free and could be parked anywhere), coin-deposit, station-based bike share, and dock-less bike-share [
6]. The current dock-less bike-share could stand alone, eliminating the need for specific docks or stations [
7]. Some studies investigated the potential environmental benefits of dock-less bike-share and found that dock-less could improve the resources utilization of urban bicycle system as well as reduce consumptions of different materials [
6]. However, the unsustainability of dock-less bike share was observed for its skyrocketing market share and short lifetime in China, and the substitution ratio of bike-share for other transportation mode need be studied [
8].
From the perspective of transportation planning, by solving the first/last mile problem of public transit, bike-share was expected to raise the competitiveness of public transit against other travel modes, especially automobile [
4]. However, convenient and efficient first/last mile connection to transit stations remains challenging for many communities in urban areas [
9,
10]. In a recent study, some cyclists preferred to bike for the whole trip rather than for the first/last mile of the public transit trip [
11]. Zhu et al. investigated competitiveness of different transportation modes in Shanghai and found that within the distance of 10 minutes’ walk (about 0.52 mile), biking was less competitive than walking. Only between the distance of 8 to 20 minutes’ walk was biking more competitive than taking public transit or driving [
12]. In addition, existing data and studies reveal that the bike-share system has no obvious effect in attracting people from single occupation vehicle (SOV) trips to low-carbon transportation trips, since most of existing riders of new bike-share systems are from other low-carbon modes, such as private bike, public transit, and even walking [
11,
12,
13]. These trends indicate that bike-share did not have satisfactory substitution for high-carbon modes and support to public transit trip, so it may not have expected environmental benefits, which leads to the desire for a new comparison analysis between two environment-friendly modes: public transit and bike-share.
Life-cycle assessment (LCA) is a powerful tool for evaluating environmental impacts of specific transportation modes to aid in the decision-making processes. It can not only help planners to better understand environmental impacts of transportation systems, but also encourage more creative and efficient designs and planning of sustainable development. Previous LCA studies have investigated the environmental impacts of different transportation modes including different kinds of public transit system (light rail [
14], high speed rail [
15], regular rail and bus system [
16,
17]), bike-share [
18], as well as automobile [
19]). Previous studies found that light-duty vehicles account for over 59% of GHG emission and 58.2% energy consumption among the transportation sector in the US [
20,
21]. Chester et al. evaluated the energy consumption and emission of vehicles in three metro centers in the US (San Francisco, Chicago, and NYC). NYC was found to have the lowest end-use of energy consumption and emission compared to other cities in terms of vehicle-kilometers traveled and personal kilometers traveled because of high usage of public transit [
22]. LCA study of public transit focus on the comparison of different fuel options (natural gas, biodiesel, and diesel-electric hybrid) and other advanced technologies. Previous studies found that the majority of emissions of buses came from the operational stage [
23,
24]. Nanaki and Koroneos found that biodiesel greatly reduced the GHG and methane emission, but increased particulate matter (PM), nitrous oxide, nitrogen oxides, and nutrients emissions when compared to diesel and gasoline for transportation [
25]. Sánchez et al. examined energy requirements, GHG emissions, and other factors of three different after-treatment technologies used in urban buses in Madrid transportation system using different fuels. The data showed that SCR plus Urea technology greatly reduced the environmental impact [
26]. Mckenzie and Durango-Cohen found that the use of alternative fuel decreased operating costs and emissions but increased life-cycle costs. Overall efficiency calculation still needed to consider other factors such as passenger demand [
27].
LCA analysis of bike-share become popular in last three years with the popularity of dock-less bike-share. Previous studies evaluated and compared environmental impacts of station-based BBS (bike-share system) to dock-less BBS and found that the GHG (greenhouse gas) emission of the dock-less system was 82% higher than the station-based system. The main source of GHG emission came from bike rebalancing work. However, BSS can bring environmental benefits through substituting different transportation modes, especially car trips [
28]. Christopher compared environmental impact of electric bikes in China with competing modes and found that electric two-wheelers emit lower pollution per kilometer than motorcycle and bus, while had the comparable and higher emission rate to buses and bike, respectively [
29].
Currently, very limited studies focus on the comparison analysis and cooperation between two environment-friendly modes: public transit and dock-less bike-share, which is important for further transportation planning and sustainable development [
30,
31,
32]. Besides this, scholars in urban/transportation planning and civil engineering tend to make analyses mainly based on their own scopes previously. Planners focus more on travel behavior of people as well as transportation planning [
30,
31,
32], while civil engineers think highly of quantitative analysis of the environmental impact based on LCA with limited discussion about real planning application or project [
25,
26]. Thus, more interdisciplinary analysis is needed to support planning project with life-cycle assessment. This study is focused to quantify and compare environmental impacts between bus and dock-less bike-share systems. The impact assessment results were used to evaluate the effect of potential policy or strategy changes for reducing environmental impacts of the current system. The study has three major contributions: (1) comparing the environmental impacts of bike-share and campus bus; (2) putting forward a hybrid transit system on campus and evaluating its potential environmental impacts; and (3) offering planning strategies based on the results and analysis for further improvement.
2. Objective and Scope
This study aims to conduct life-cycle assessment (LCA) and compare CO2 emission and energy consumption of two transportation systems, bike-share and bus transit systems, in the environment of university campus. The process-based LCA method was used in this study and the life-cycle of two systems were disaggregated into four stages, namely, raw material acquisition and manufacture, transportation, operation and maintenance, as well as end-of-life. Three uncertain factors—the fossil fuel used, the number of bikes deployed, and the bus ridership—were set as variables for sensitivity analysis. The results can be used as a reference for transportation planners for potential policy changes or promotion of the low-carbon campus transportation system.
The paper is structured as four parts. (1) The Introduction offers background information and literature review of relevant researches. (2) The Objective puts forward the main goal of the LCA analysis. (3) Research Methodology introduces goal and scope of LCA, the research objects, the methods of data collection and calculation of each life-cycle stage, and uncertainty factors. (4) Results and Discussion puts forward the life-cycle assessment result as well as the analysis about three factors (fuel type, the total number of bikes provided, and bus ridership) that may affect results. Besides this, an alternative hybrid transportation system is put forward for future improvement of local transportation system.
3. Research Methodology
3.1. Goal and Scope of LCA
The study follows the basic steps of life-cycle assessment, which include goal definition and scope, inventory analysis, impact assessment, and interpretation as defined by International Organization for Standardization (ISO) [
33]. The goal of the study is to quantify energy consumption, CO
2 emission and environmental impacts of dock-less bike-share system and transit bus systems. The impact assessment of two transportation systems was used as the basis for policy-making process. The functional units of the study are the amount of energy (kJ) consumed and the amount of CO
2 emission (kg) released per passenger-mile. Passenger-mile is a statistical unit denoting one mile traveled by one passenger, which is used by public transportation agencies for measuring the volume of passenger traffic. Passenger-mile can be used to evaluate service provided by different transportation systems [
34]. The energy consumption and CO
2 emission per passenger-mile can be used to evaluate the environmental impacts of different transportation systems providing the same service to the passengers.
The system boundary of LCA covers material acquisition, manufacturing operation, maintenance and end-of-life stages of both systems, as shown in
Figure 1. The study scope of the dock-less bike-share system also includes the construction of 5-foot-wide bike lanes, which are consisted of 1 inch of asphalt surface and 4 inches of base layer, since the current road network in the campus does not have bike lanes.
The inventory analysis is limited to energy consumption and CO2 emission. Their corresponding impact categories are fossil fuel depletion and potential climate change. Internal normalization and external normalization of impact assessment results are applied by integrating with average energy emission and CO2 consumption per person per minute in the US. The unit inventory data for material-related energy consumption and CO2 emission are extracted from previous research papers and reports. Other real case-based data comes from local transportation departments.
3.2. Campus Bus and Bike-Sharing Systems
The study region is Rutgers University at the city of New Brunswick, which includes four campuses: College Avenue, Cook/Douglass, Livingston, and Busch. Currently, the campus bus system is the main transportation mode for students traveling within the New Brunswick campus. According to the information provided by the Department of Transportation Service of Rutgers, the campus bus system is composed of fifty 40-foot Eldorado buses and ten 60-foot articulated buses, and both are powered by biodiesel B-20. These buses provide service of 85,000 passenger trips per day. The average traveling mileage for each campus bus is around 30,000–50,000 miles per year, with a $1.5 million fuel cost in total. Based on the calendar of Rutgers University, there are 240 working days per year. Analysis period spans 12 years, which is the common lifetime for campus bus. Therefore, the total passenger mileages offered by the whole campus bus system in New Brunswick in 12 years would be 856,800,000 passenger-miles, which will be the service requirement for the potential bike-share system.
Campus bus was the major transit mode in the New Brunswick campus to satisfy the travel needs of students. Biking is another popular travel mode for college students who are physically active [
35]. Previous studies indicated that cycling could help to moving people across campus efficiently by alleviating parking and transportation problems in large universities [
36,
37,
38]. Besides this, bike use could improve public health and reduce pollution [
39]. Dock-less bike-share, more flexible for usage, showed high potential for increasing active transport on a college campus [
39]. Currently, bike-share has not been deployed in the city of New Brunswick campus, since a large proportion of overall bike-share members are substituting bike-share for bus trip [
40]. A large proportion of riders of potential bike-share in New Brunswick might also switch from campus bus. In that case, a perfect dock-less bike-share system with good biking environment (good bike lane and docks, etc.) might replace the current campus bus system to satisfy the travel needs of students and offer a more walkable and favorable environment on campus. However, the real environmental impact of such vision remains unknown. Thus, an assumption is to build a dock-less bike-share system to totally replace the Rutgers campus bus by offering 856,800,000 passenger miles in 12 years in the New Brunswick campus. Based on an online survey (lifetime miles of bikes reported by cyclists) from Bike Forums website, the average mileage of a bike during its life time is 28,838.50 miles [
41]. The damage rate of bikes in this study refers to the ratio of the number of bikes damaged to the total number of bikes manufactured. In this case, the number of bikes required for the bike-share system in New Brunswick campus is 35,652, with 16.67% damage rate. The user experience of the bike-share system in China indicates that many bike users do not handle public bikes gently, which leads to high damage rate and short life mileage of bikes. Based on the Chinese news, the damage rate of Mobike is 10%. However, the analysts believe that damage rate should be higher than that in the official report (
https://www.jianshu.com/p/1ffe6acddc56). Financial Times reported that the damage rate of Mobike in Manchester, United Kingdom, is 10%. In this study, the damage rate is estimated to be 16.67%, which is slightly higher than the previous reported rate. Currently, there is no data about the life mileage of public bikes. Thus, we use the life mileage of private bike as that of the public bike.
3.3. Life-Cycle Stage of Bus
The summary of life-cycle inventory data for the bus system is listed in the
Supplementary Materials (
Table S1). The life-cycle inventory data for 40-foot Eldorado buses is from Simonsen’s study [
41]. The amount of materials for one bus and the corresponding CO
2 emission and energy consumption are listed in the
Supplementary Materials (
Table S2). For a 60-foot articulated bus, it is assumed that the bus is manufactured using the same materials but the amount of materials is 1.5 times of that for manufacturing a 40-foot bus. During the manufacturing process, all buses were calculated with the same outputs based on data from the study conducted by Spielmann et al., as shown in the
Supplementary Materials (
Table S3) [
42].
During the operation and maintenance stage, the fuel consumption of campus buses can be estimated by the annual fuel cost and unit price of fuel. Carbon dioxide emission in fuel production and fuel consumption phases is also taken into consideration in this stage. Rutgers campus buses are powered by biodiesel B20 (20% of petroleum diesel is replaced by biodiesel). Therefore, the production process of B20 should cover the production of both petroleum diesel and pure biodiesel. Sheehan et al. (1998) introduced the processes for producing petroleum diesel and biodiesel, with corresponding energy consumption in each process. For example, in their study the production process of biodiesel was divided into five steps, from the soybean agriculture, soy oil conversion, to the final biodiesel transportation [
17]. Similarly, the production of petroleum diesel was also divided into several steps, from crude production, oil refining, to the final diesel fuel transportation. The study calculated the total required energy for generating one MJ energy from target fuel (petroleum diesel or biodiesel) in each step. Based on the above data, the total CO
2 emission and energy consumption for 60 campus buses operating 12 years can be derived.
The maintenance of campus bus includes replacement of hardware and daily maintenance. Sheehan et al. listed the maintenance components for difference vehicles [
17]. To simplify the calculation, a conservative assumption, in which 20% of the bus weight would be replaced during its lifetime, is made. Thus, the CO
2 emission and energy consumption for maintenance can be estimated as 20% of that during the raw material acquisition stage. The daily maintenance includes fueling, cleaning, oil changes, with CO
2 emission and energy consumption data collected from the research by Cooney and Sheehan et al. [
17,
43].
The calculation of end-of-life stage is based on the study by Sánchez et al. The data is shown in the
Supplementary Materials (
Table S4). The total energy consumption and CO
2 emission of the bus (EURO IV) are 1.21 × 10
5 KJ and 7.49 × 10
6 kg separately [
26]. The energy consumption and CO
2 emission of the end-of-life stage in this study are calculated based on ratio of bus weights.
3.4. Life-Cycle Stage of the Bike System
The raw materials for making a bike include aluminum alloyed, stainless steel, steel alloyed, rubber, and plastic. The raw materials’ data comes from the study of Life Cycle Assessment of Two Wheel Vehicles. More detailed data and resources are listed in the
Supplementary Materials (
Table S5) [
39]. The data of CO
2 emission and energy consumption of raw material acquisition process is calculated based on an existing study [
44,
45,
46,
47,
48]. More detailed information is shown in the
Supplementary Materials (
Table S6).
Energy consumption and CO
2 emission of bikes’ manufacture stage and end-of-life stage are calculated based on that of bus. The weight of one bus is 10,583 kg, while the weight of one bike is 17 kg. It is assumed that the consumption and outputs are proportional to the weight. Bike’s transportation stage refers to transporting new bikes from plant to site (New Brunswick). In order to simplify the calculation, the nearest plant in New Jersey, which is 40 miles away from New Brunswick, is selected in this study. Heavy-duty vehicles (level 8) with a payload capacity between 33,001 lbs and 60,000 lbs are used for transporting the bikes. Based on the database of NREL LCI (
http://www.nrel.gov/lci/), it will generate 0.333kg CO
2 emission to transport one ton of goods per kilometer, while energy consumption of truck is 16.1 MJ per mile [
49,
50].
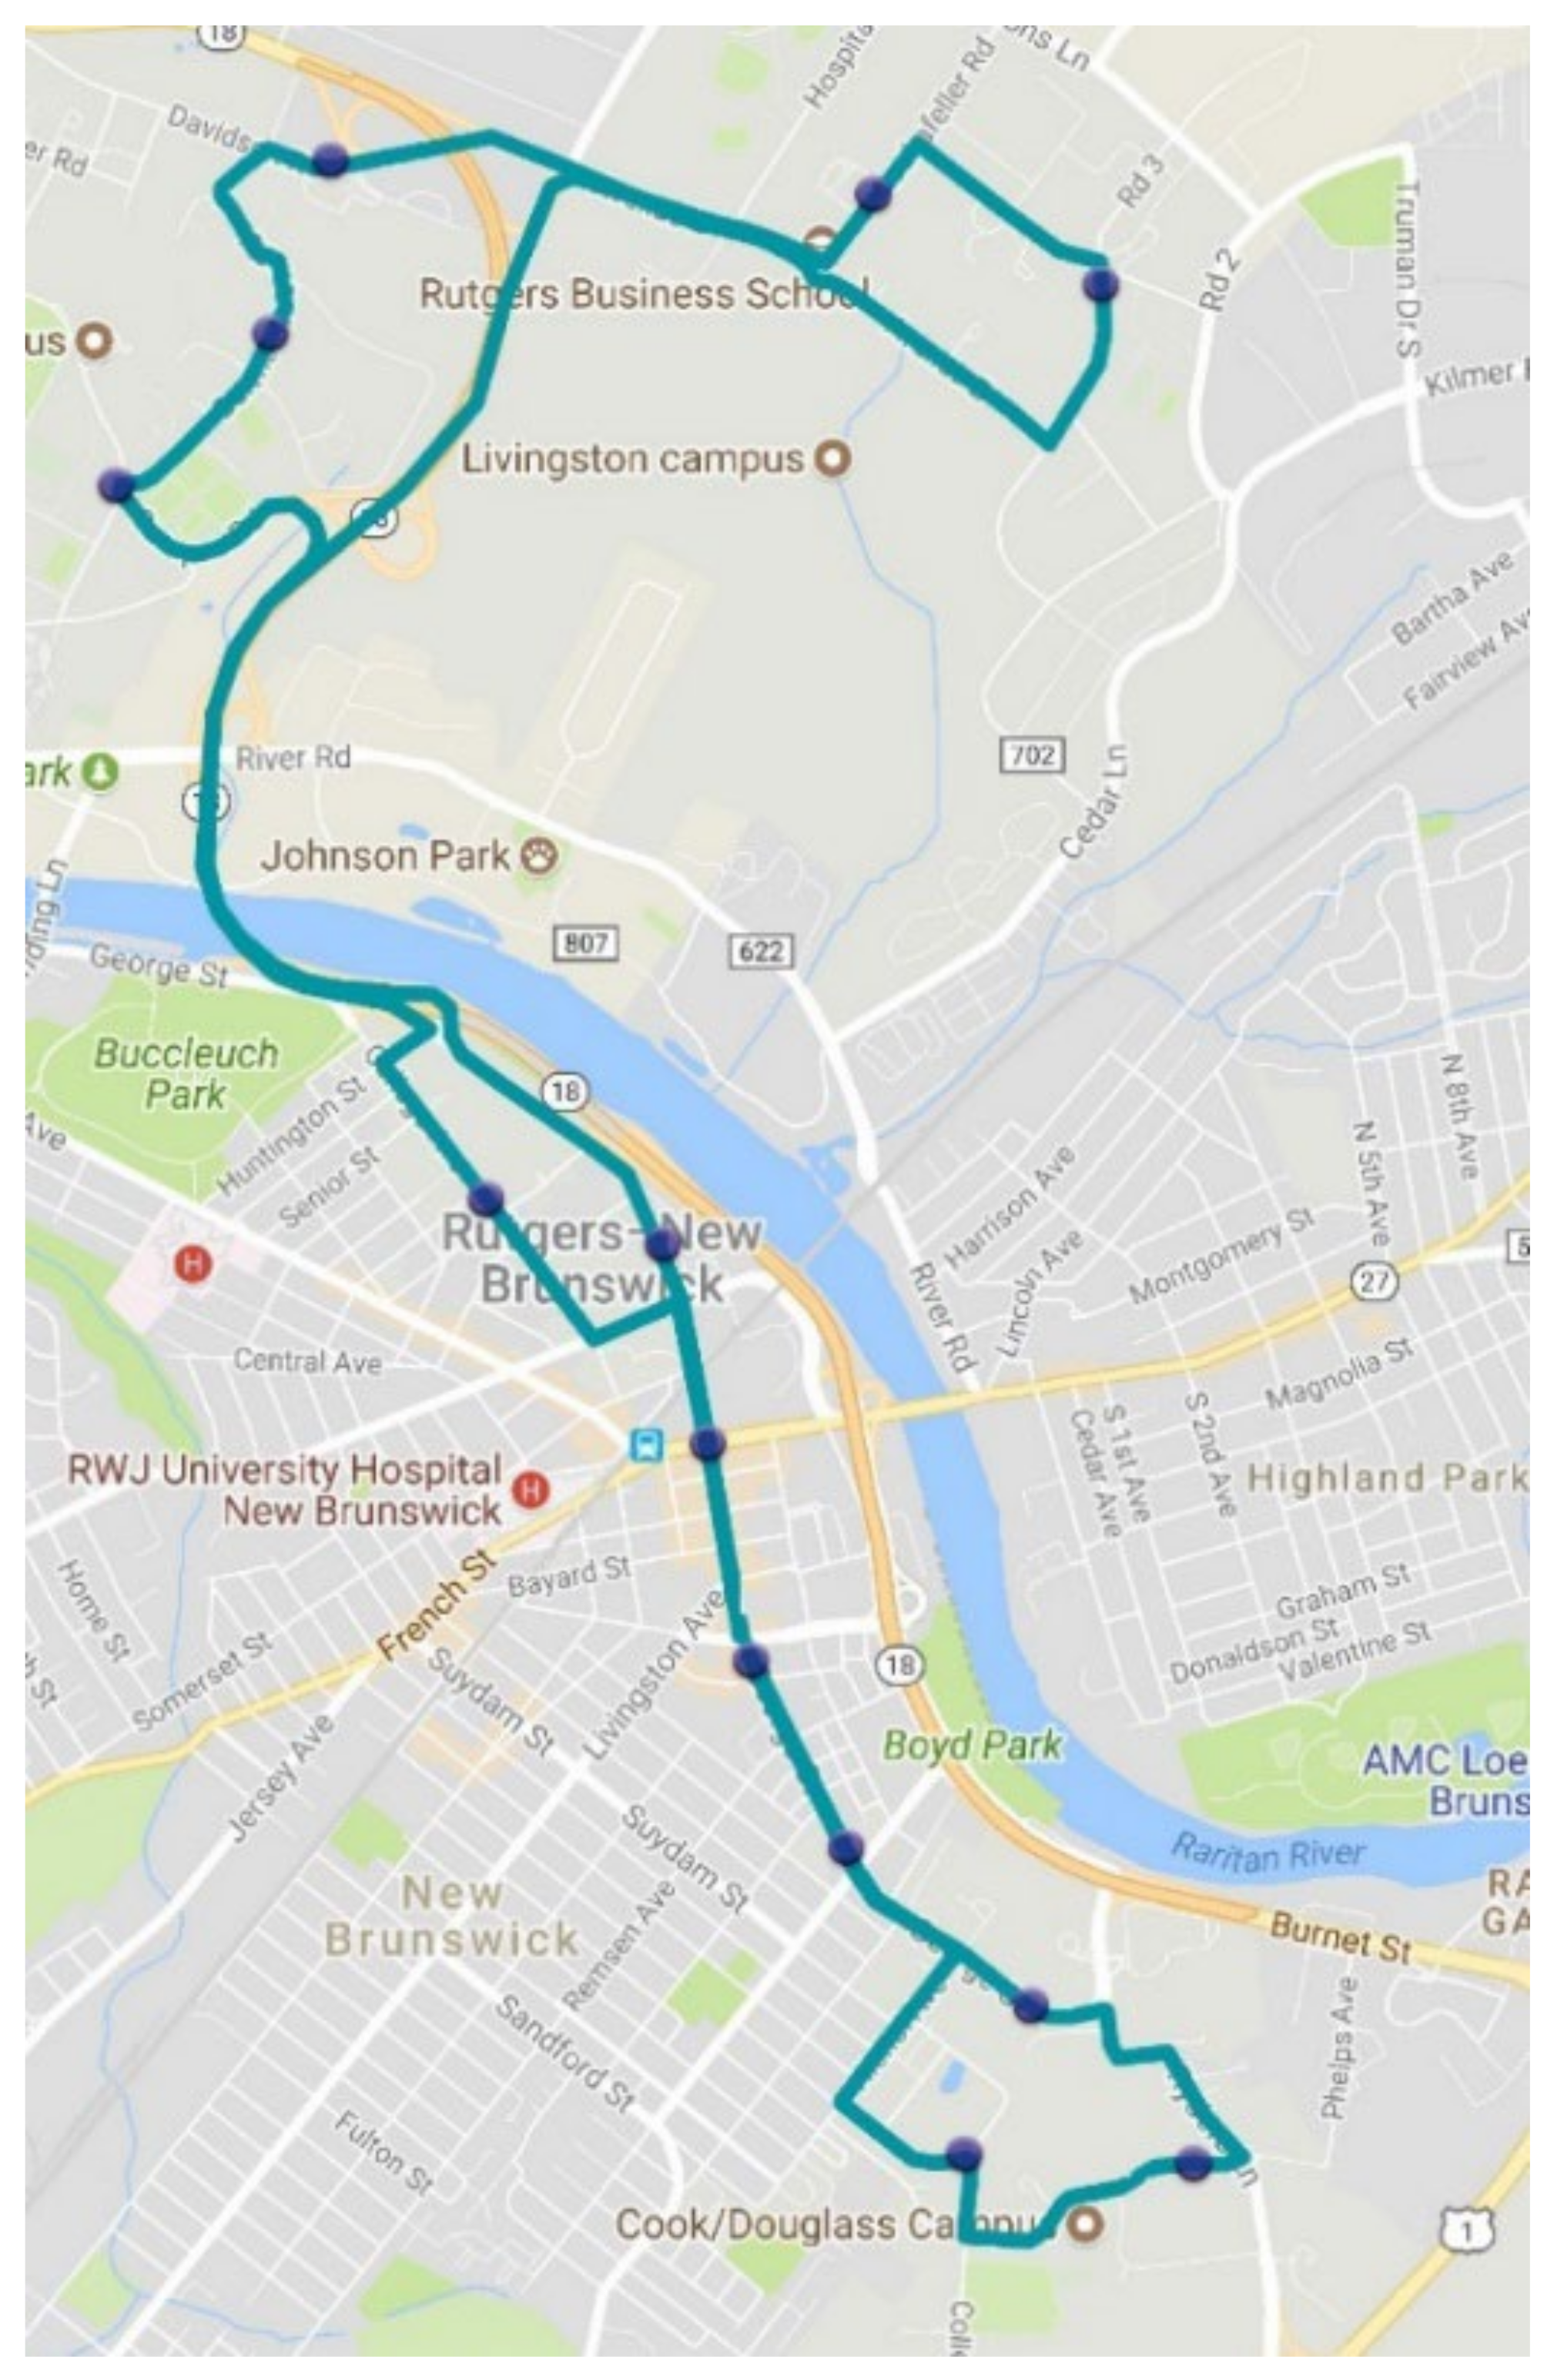
It is also assumed that the operation process of a bike-share system does not have CO
2 emission and energy consumption. In the maintenance process, besides damage repair, the bikes need be reallocated every day, since a previous study has discerned that riders may magically transport bikes to some certain locations [
51]. During this stage, the same data of CO
2 emission and energy consumption of level 8 truck was referenced. The route for reallocation trucks is designed and shown in
Figure 2a, which covers the locations of four campuses in New Brunswick.
Even though New Brunswick does not have a bike-share system, it does have some bike lanes in local streets and dedicated bike lanes on College Ave to encourage biking. Given that existing bike lanes cannot provide enough space for cyclists, a new bike lane construction project is proposed.
Figure 2b illustrates the plan of this new bike lane with 5 feet width and 21.67 miles of total length. Due to negligible loads of bikes, 1 inch of hot-mix asphalt and 4 inches of base are planned for construction. Meanwhile, road maintenance will not be taken into consideration. The construction work of the new bike lane is also included in the maintenance period. Previous studies have investigated the life-cycle energy and environmental impact of asphalt pavement [
52,
53]. Thus, CO
2 emission and energy consumption for operation and maintenance stage of the bike-share system can be summarized in the
Supplementary Materials (
Table S7).
The calculation for end-of-life stage is the same as that of the bus system, which is based on the study of Sánchez et al. [
26]. The CO
2 emission and energy consumption are deducted based on the weights of bus and bike.
3.5. Uncertainty Factors
During the calculation and normalization, three uncertain factors are identified to analyze their effects on the environmental impact of the two transportation systems. These factors are the number of bikes required for total passenger miles, the ridership or total passenger miles of the campus bus system, and the fuel type of the campus bus system, which includes biodiesel B-20 (currently in use) and biodiesel B-100.
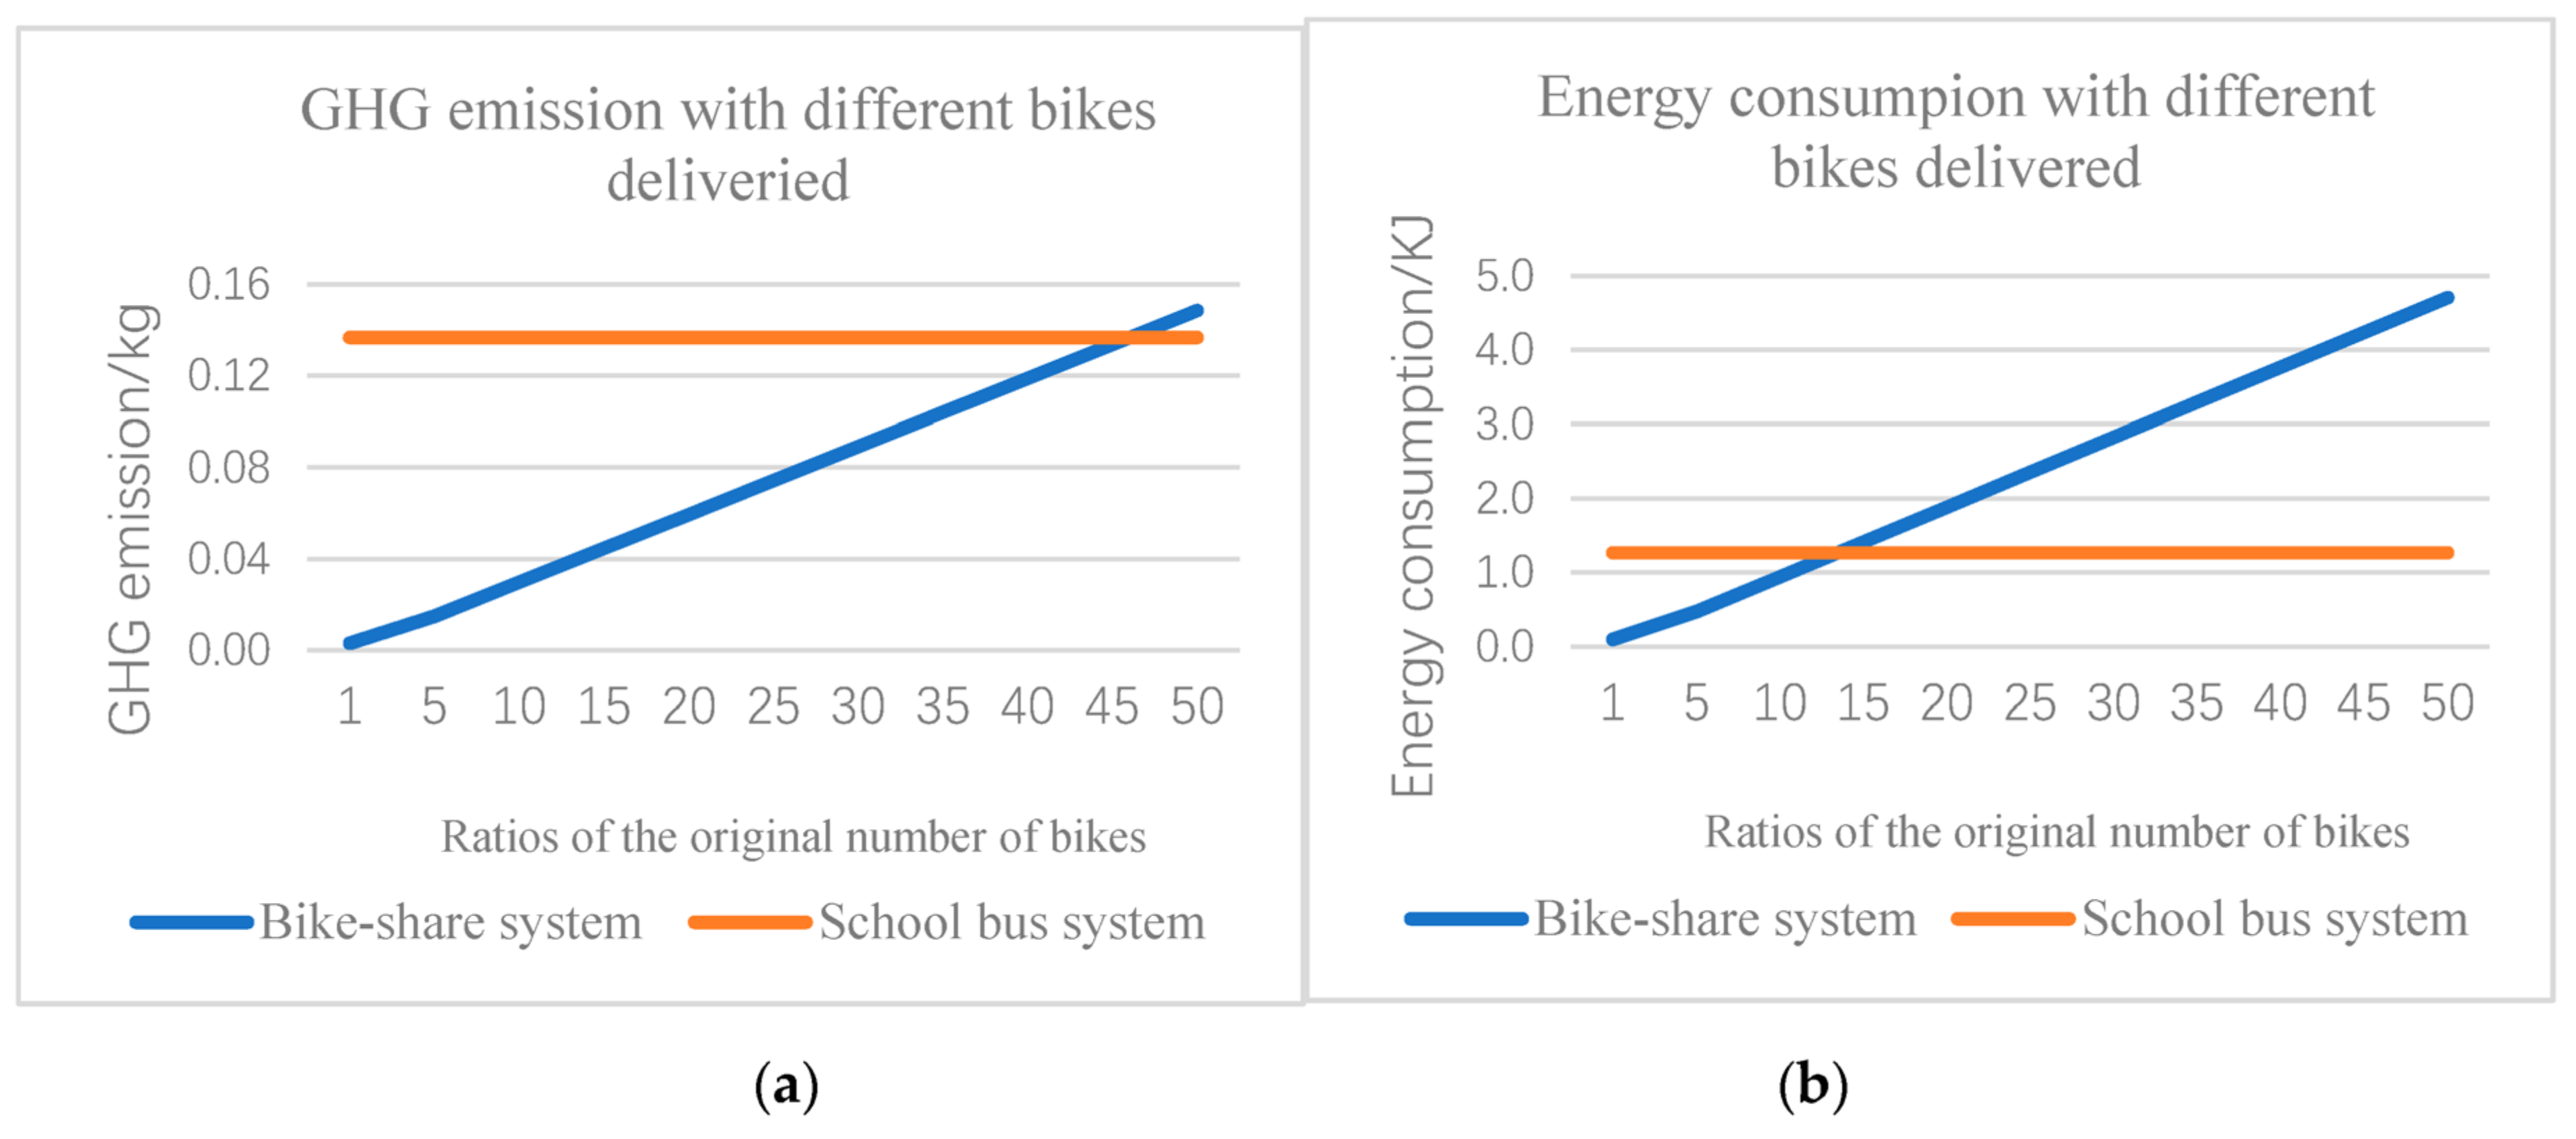
Currently, there is no reference for calculating the total number of bikes provided in a certain region. This study uses both the total travel miles of a bike’s lifetime and 16.67% damage rate, which is a rough estimate of the overall situation in the United States.
The ridership of the campus bus system will greatly affect energy consumption and CO2 emission per passenger-mile as well as the number of bikes required in the bike-share system. Currently, the ridership of campus buses in New Brunswick is calculated based on the daily ridership, as mentioned above.
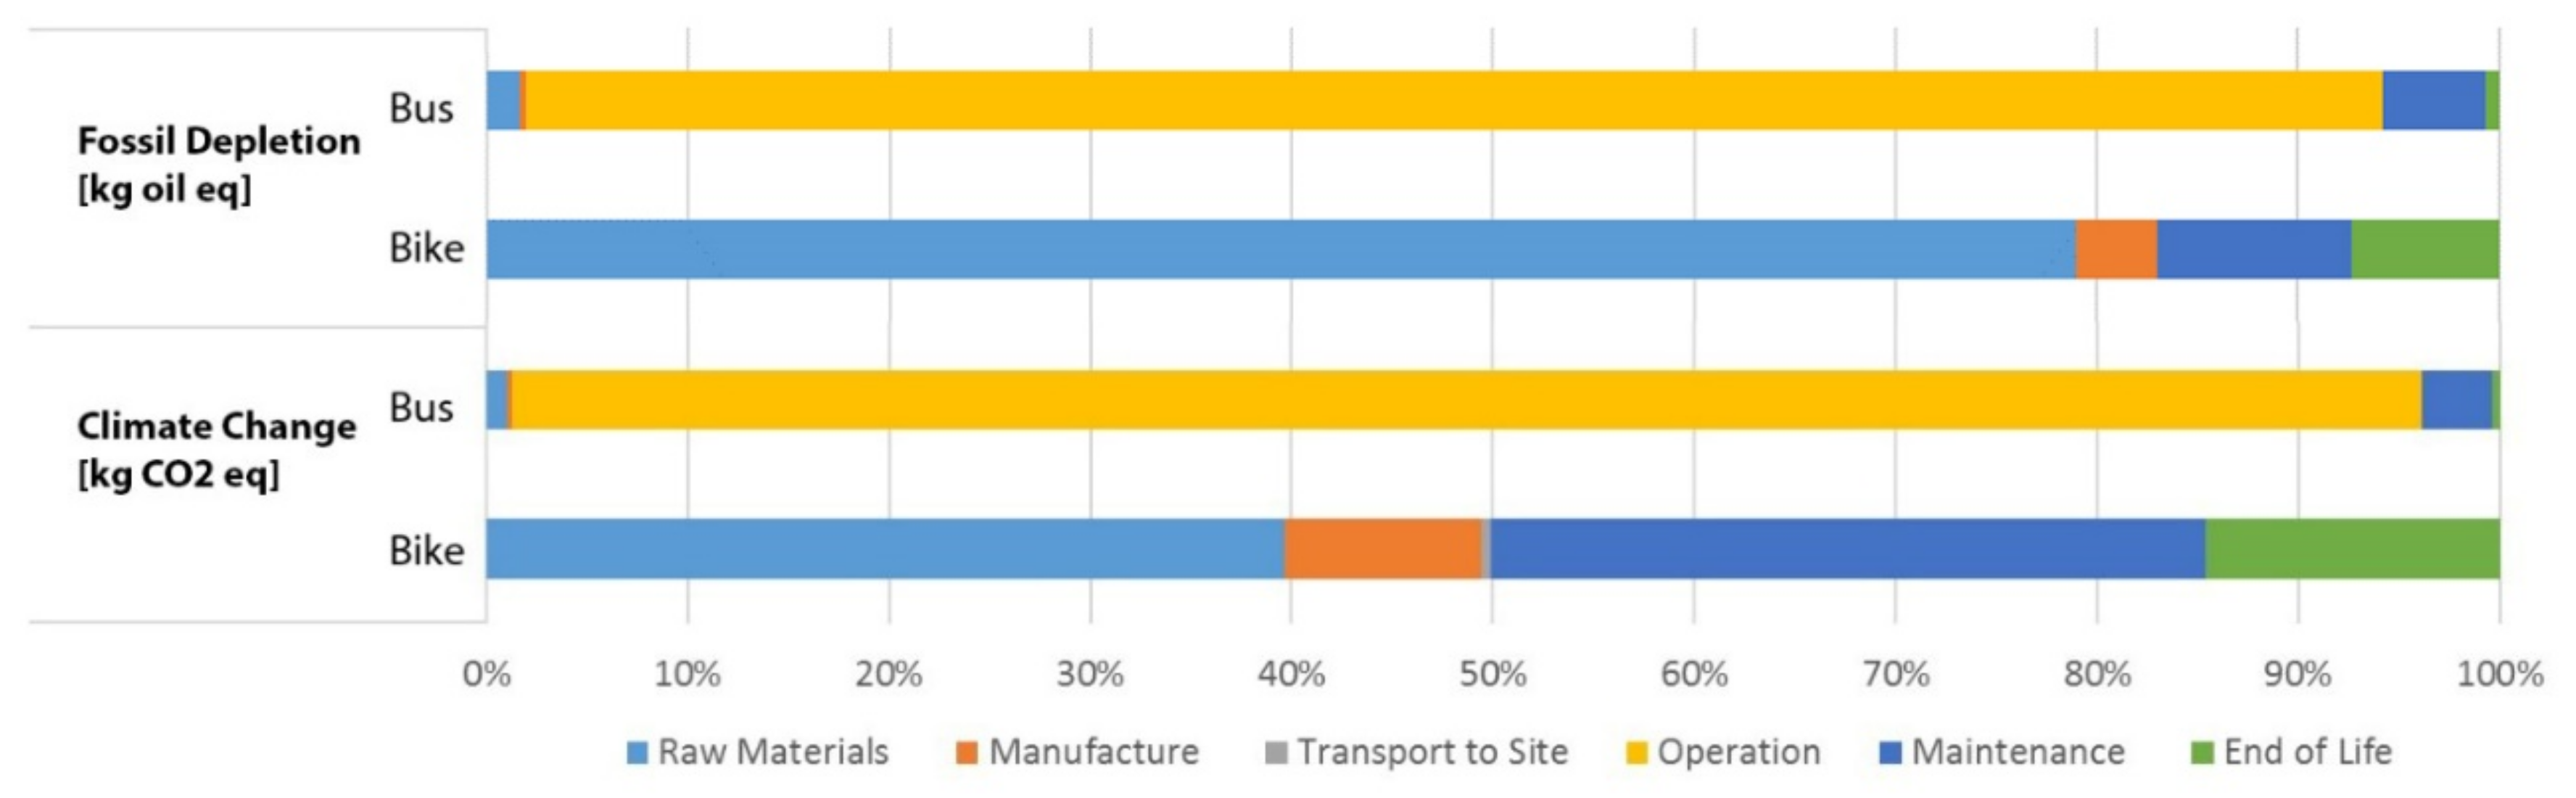
5. Conclusions and Recommendation
The potential bike-share system seems to have great advantage on environmental impacts with much lower energy consumption and CO
2 emissions per passenger mile when compared to that of the campus bus system. Similar to previous studies, the operation stage of the campus bus system has the largest portion of CO
2 emissions and energy consumption of the whole system. The majority outputs and consumption of the bike-share system come from raw material stage and maintenance stage. The number of bikes in the bike-share system needs further investigation based on the most updated research that analyzes the OFO in the context of China. Bike oversupply and low utilization as well as frequent overbalancing tasks may have significant effect on the comparison result, whereas the increase on ridership will greatly reduce the environmental impact of the campus bus system [
28,
55].
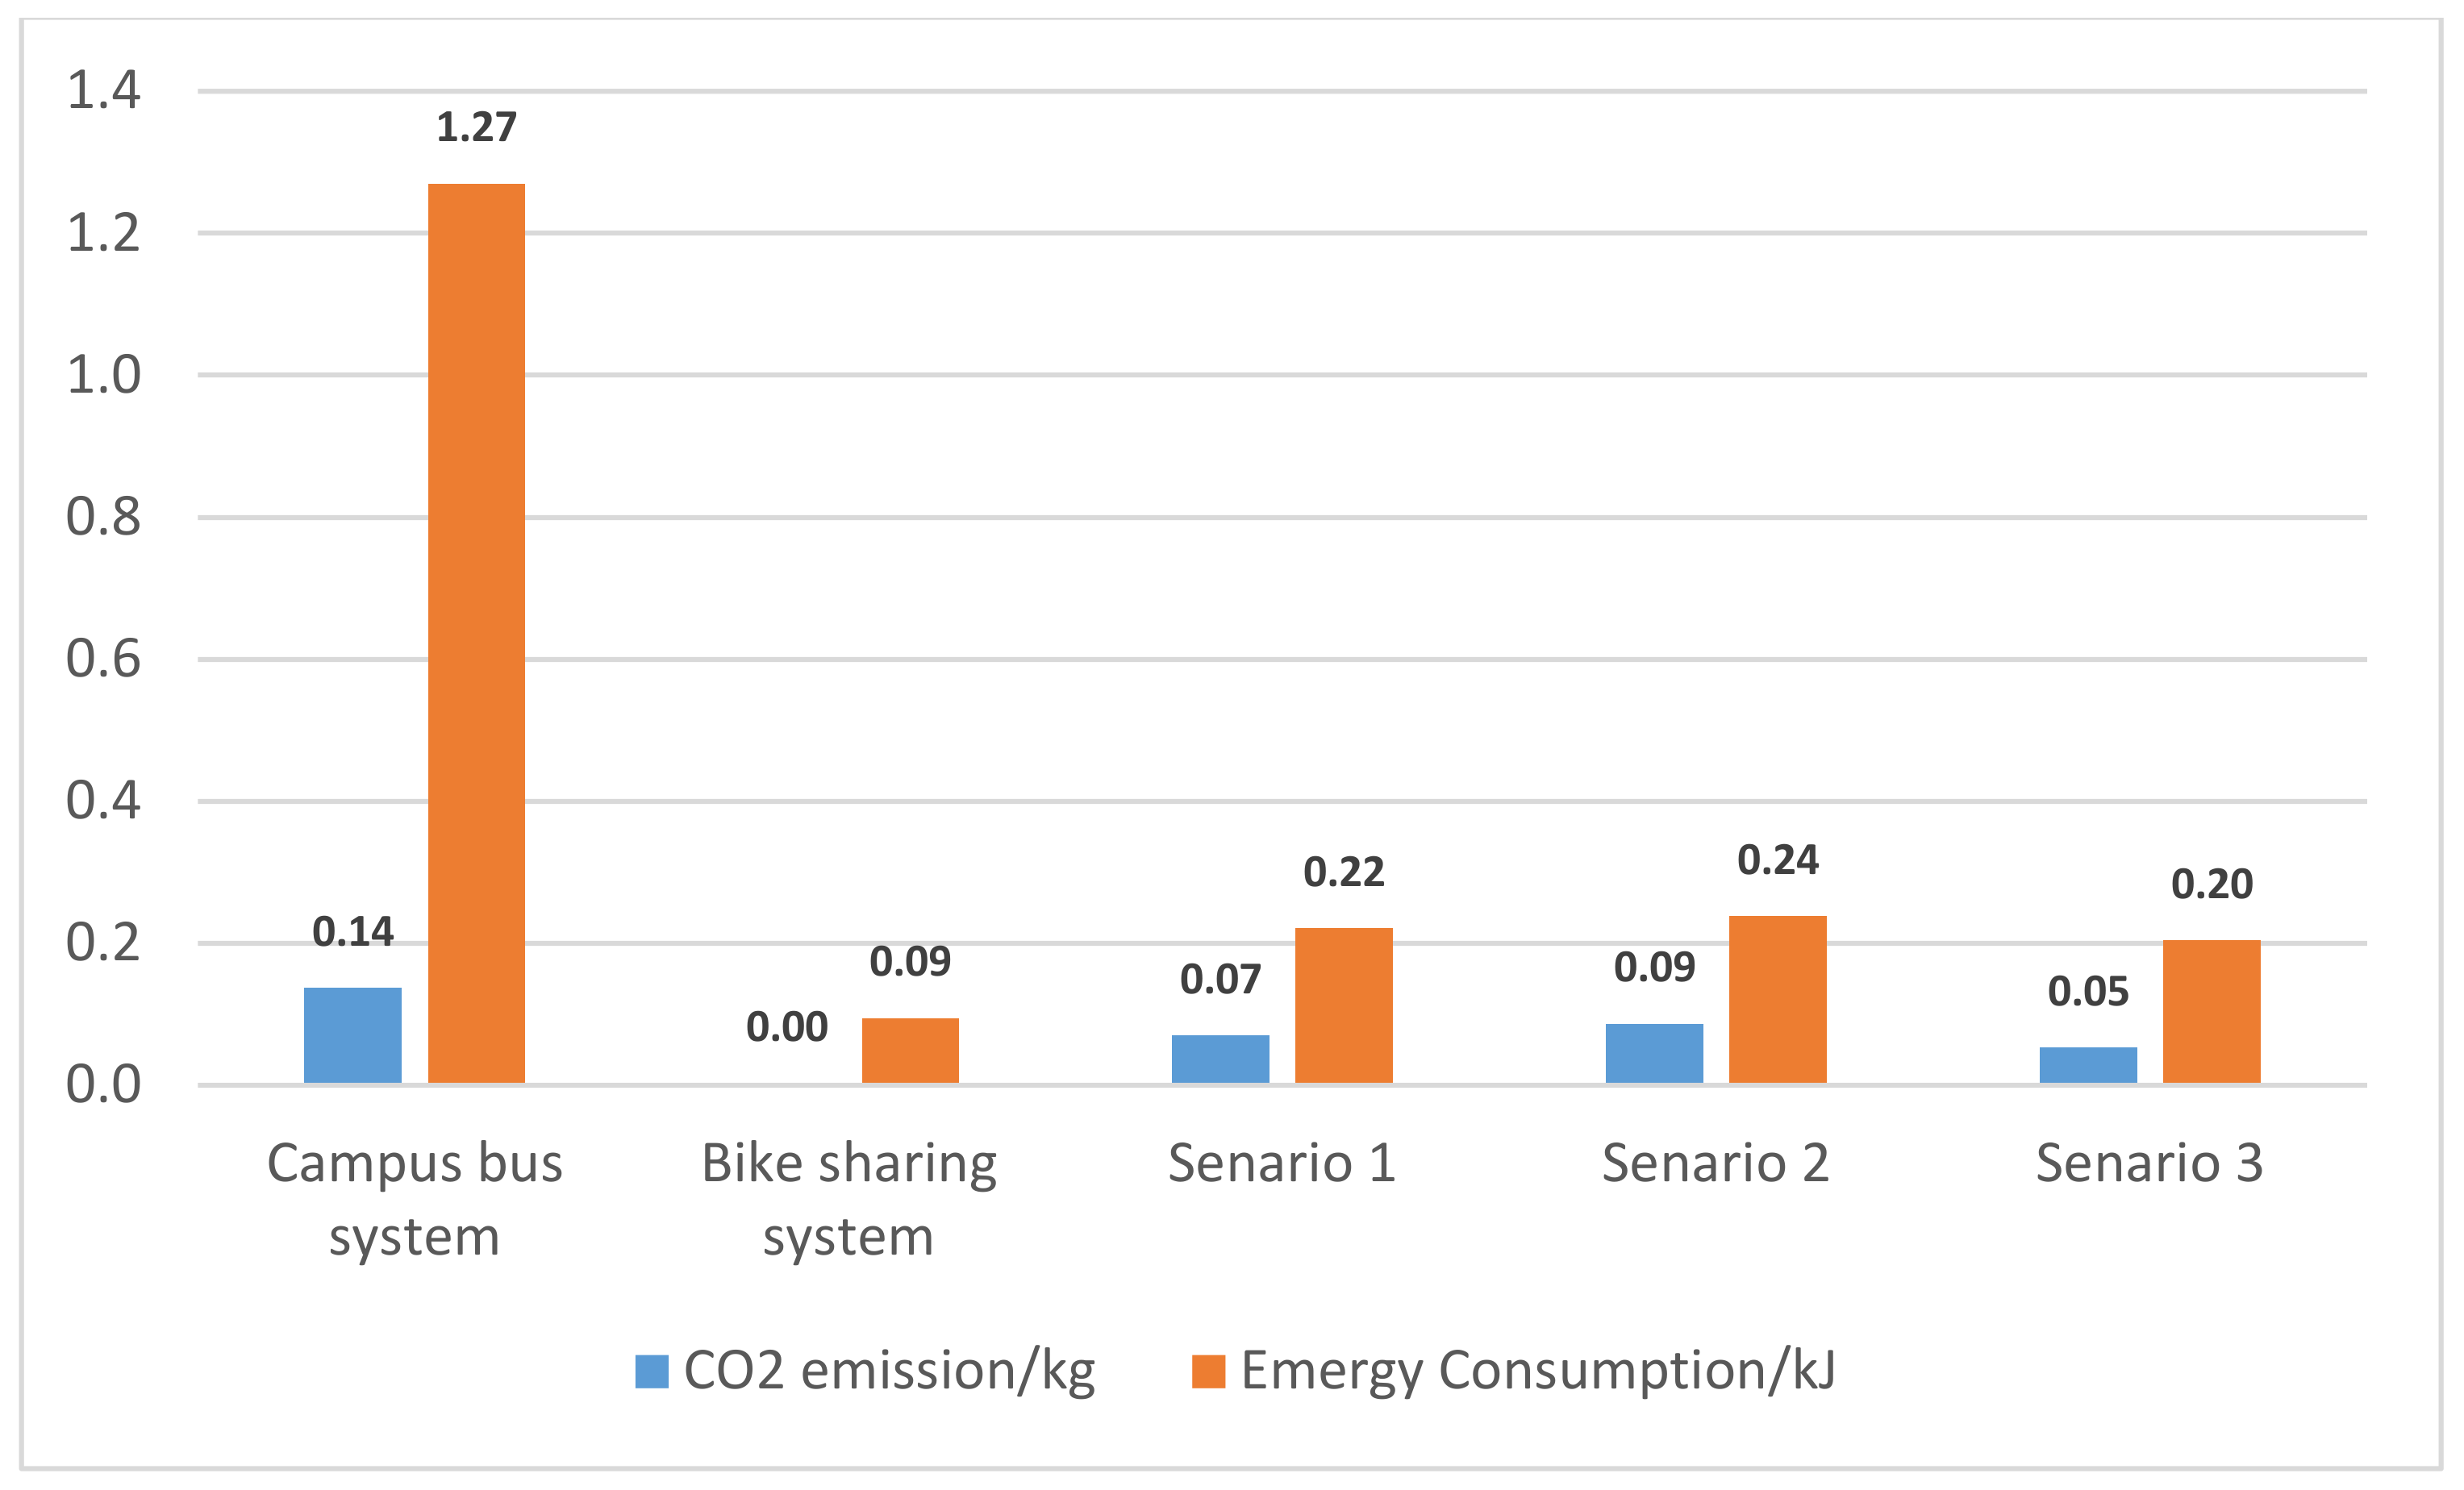
Currently, the biking behaviors that are impacted by the dock-less bike-share are still not clear, as they may vary a lot in different places or different types of communities. Bike-share may have less environmental impact than the campus bus system in the most ideal situation, while such advantage remains unclear in reality. The analysis findings indicate that the efficiency of the public transit system is the dominant factor of their environmental impacts. Thus, for further improvement, strategies should be put forward to attract more usage of bus and bike. In reality, the combination of the two systems maybe more realistic and helpful for increasing low-carbon mode trips.
It was suggested that the hybrid system could alleviate GHG emission and energy consumption when compared with current campus bus system. Since safety and cost were revealed as the greater concern about the usage of bike-sharing [
39], further planning strategies could focus on the improvement of biking environment, such as building a separated bike lane and other biking facilities. As for the New Brunswick campus, the highway between College Avenue/Cook and Livingston/Busch is not safe for biking, and thus requires campus bus to connect, while the biking environment is suitable in each small campus. In addition, since previous findings have indicated that the bike-share system does not significantly convert passengers from private vehicle to the public transit system [
11,
12,
13], some other strategies, such as increasing parking fees, can also be implemented to reduce automobile usage.
Some limitations of this study are specified for future improvement. The analysis assumes that the bike-share system can totally replace the campus bus system by offering the same passenger miles in the same time period (12 years). However, the emergence of a new system may change the travel behavior of the public. It is likely that, with better biking infrastructure and environment, more bicycling trips will take place and overall ridership will therefore increase. In addition, it is difficult to evaluate the overall impact of the bike-share system for trips of different distances, which could be another uncertainty factor that affects people’s traveling behaviors. Thirdly, the very recent research about dock-less bike-share indicate that oversupply, low utilization, as well as frequent overbalancing tasks is common in the Chinese market [
53]. These factors may also affect the bike-share system in the US and lead to negative effects despite its environmental impact. Thus, further investigation is necessary to consider the uncertainty of the bike-share system in LCA.


