How Blue Carbon Ecosystems Are Perceived by Local Communities in the Coral Triangle: Comparative and Empirical Examinations in the Philippines and Indonesia


Abstract
:1. Introduction
2. Research Methods
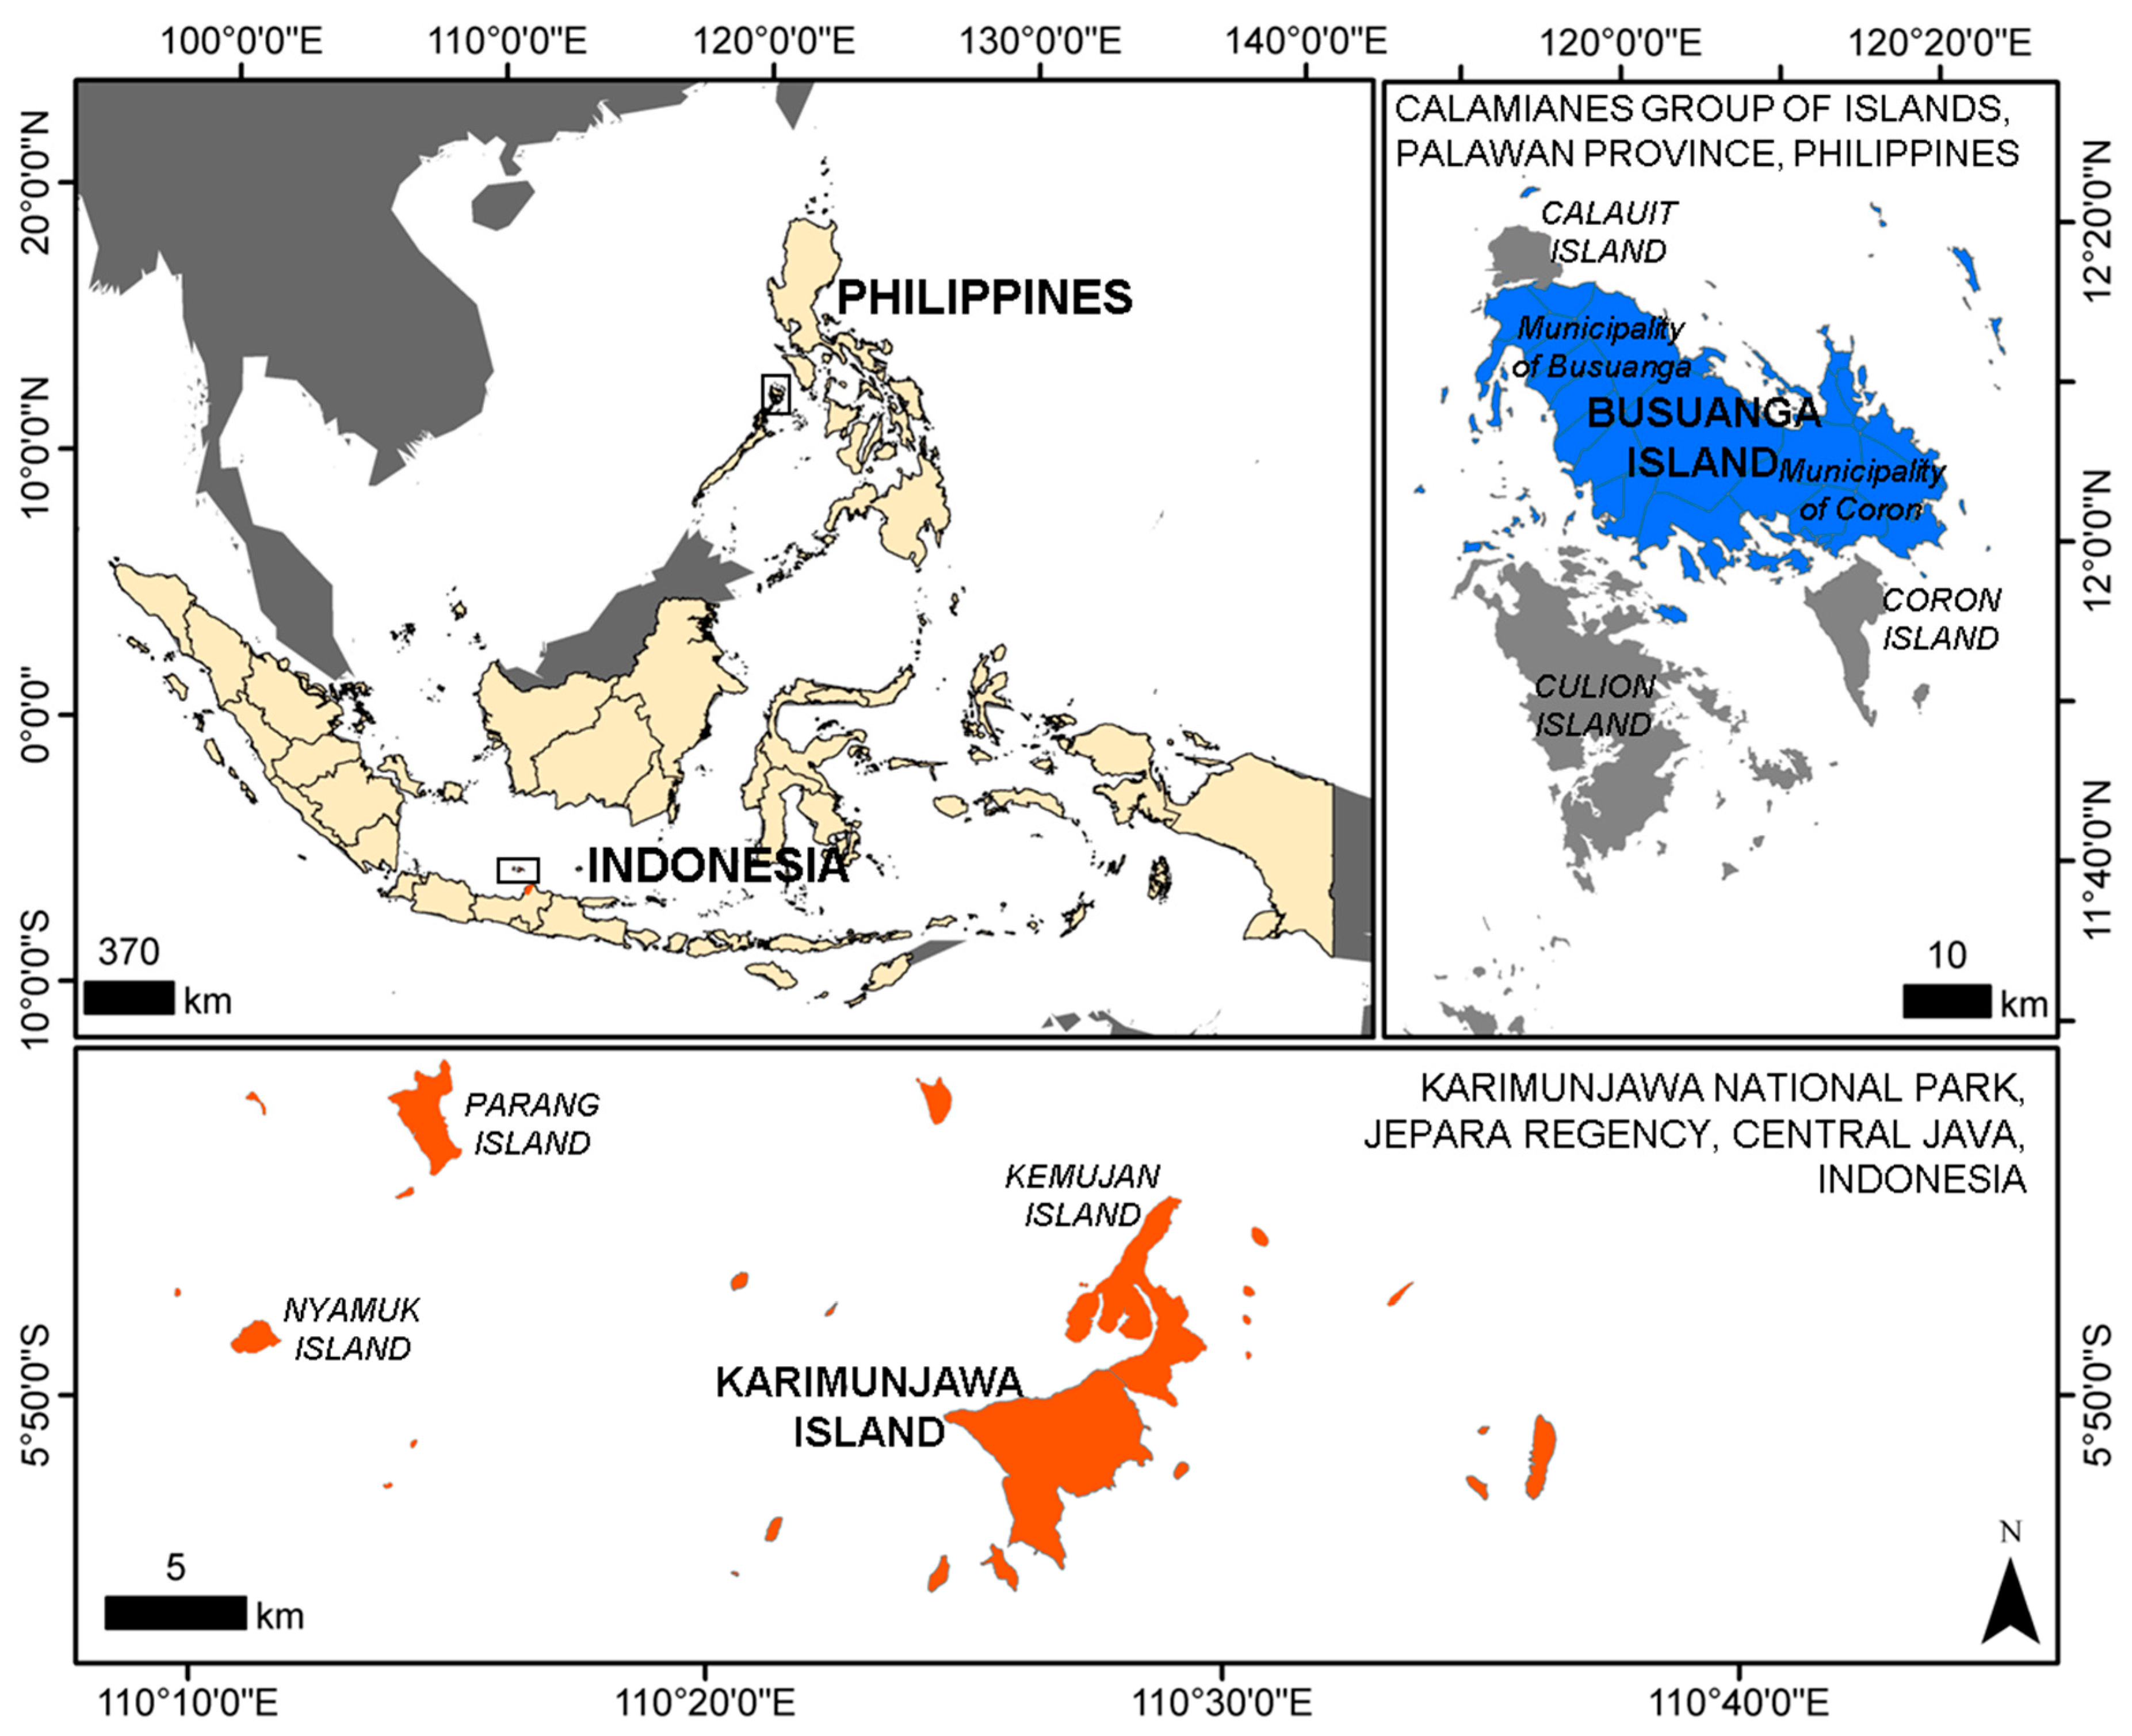
2.1. Study Sites
2.2. Sampling and Survey Procedures
2.3. Survey Questionnaire
2.4. Data Analysis
3. Results
3.1. Socio-Demographic Profile of the Respondents
3.2. Respondents’ Awareness of Blue Carbon Ecosystem Services
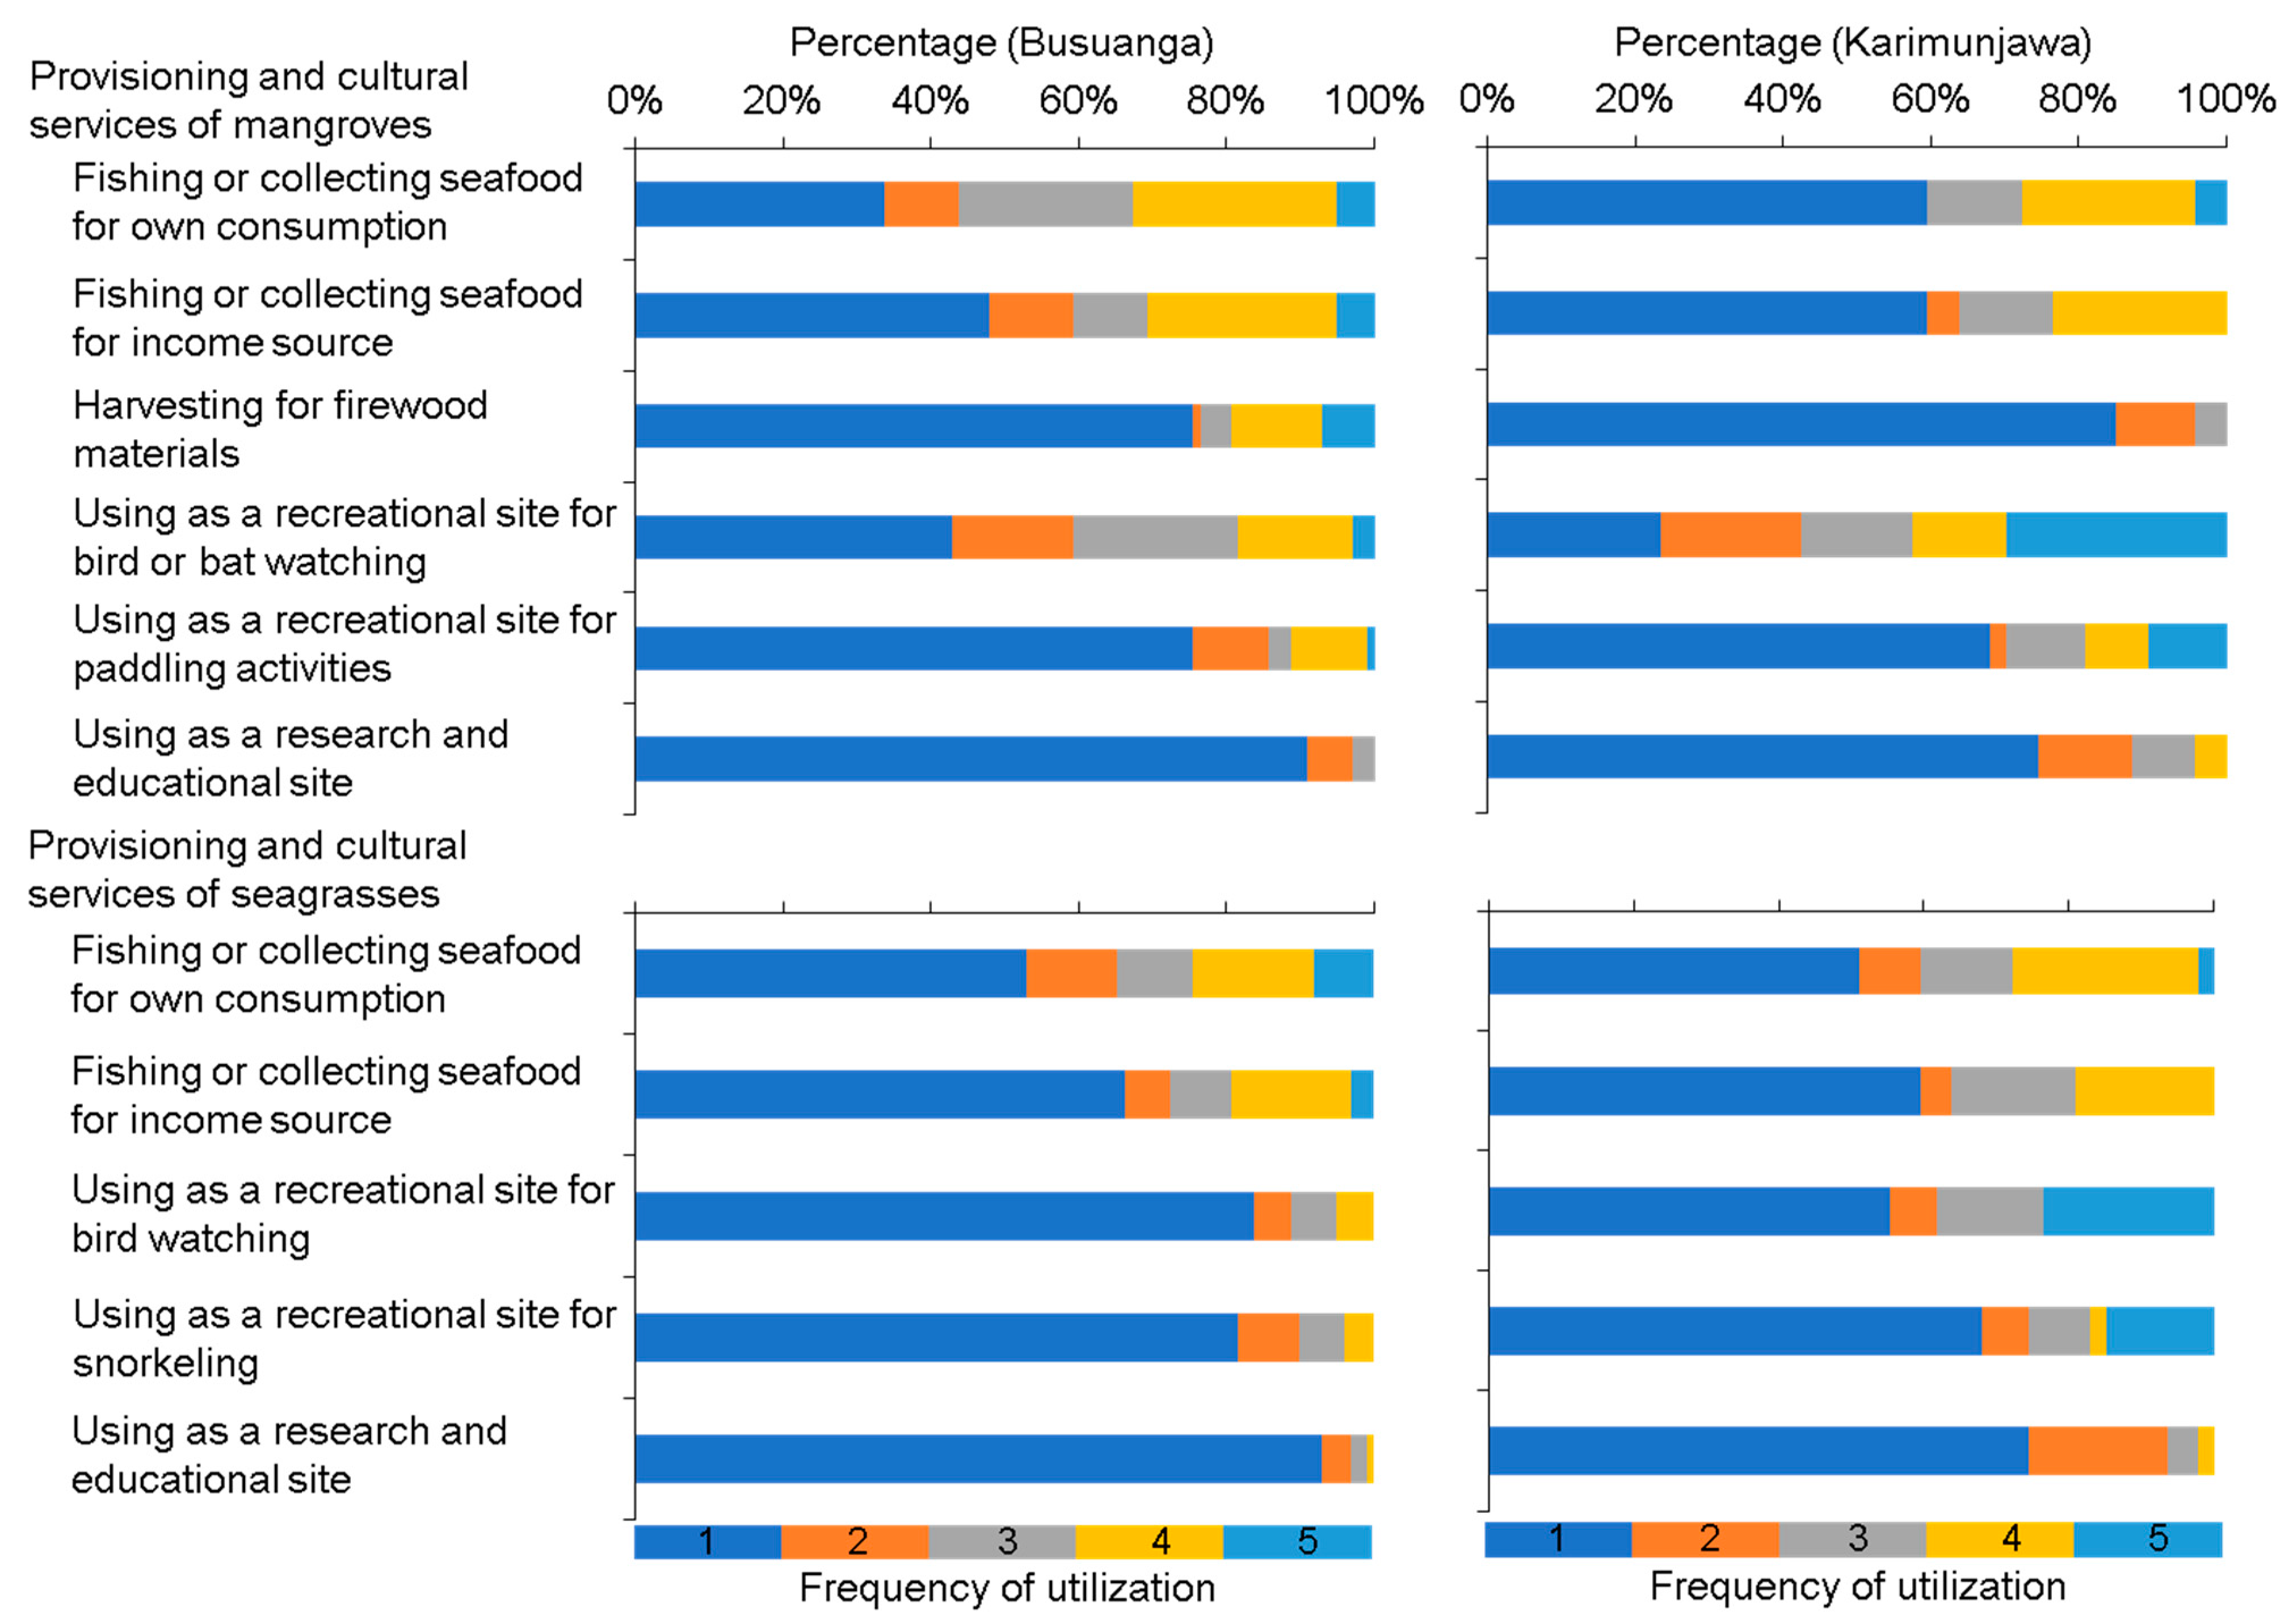
3.3. Respondents’ Utilization of Blue Carbon Ecosystem Services
3.4. Perceived Threats to Blue Carbon Ecosystems
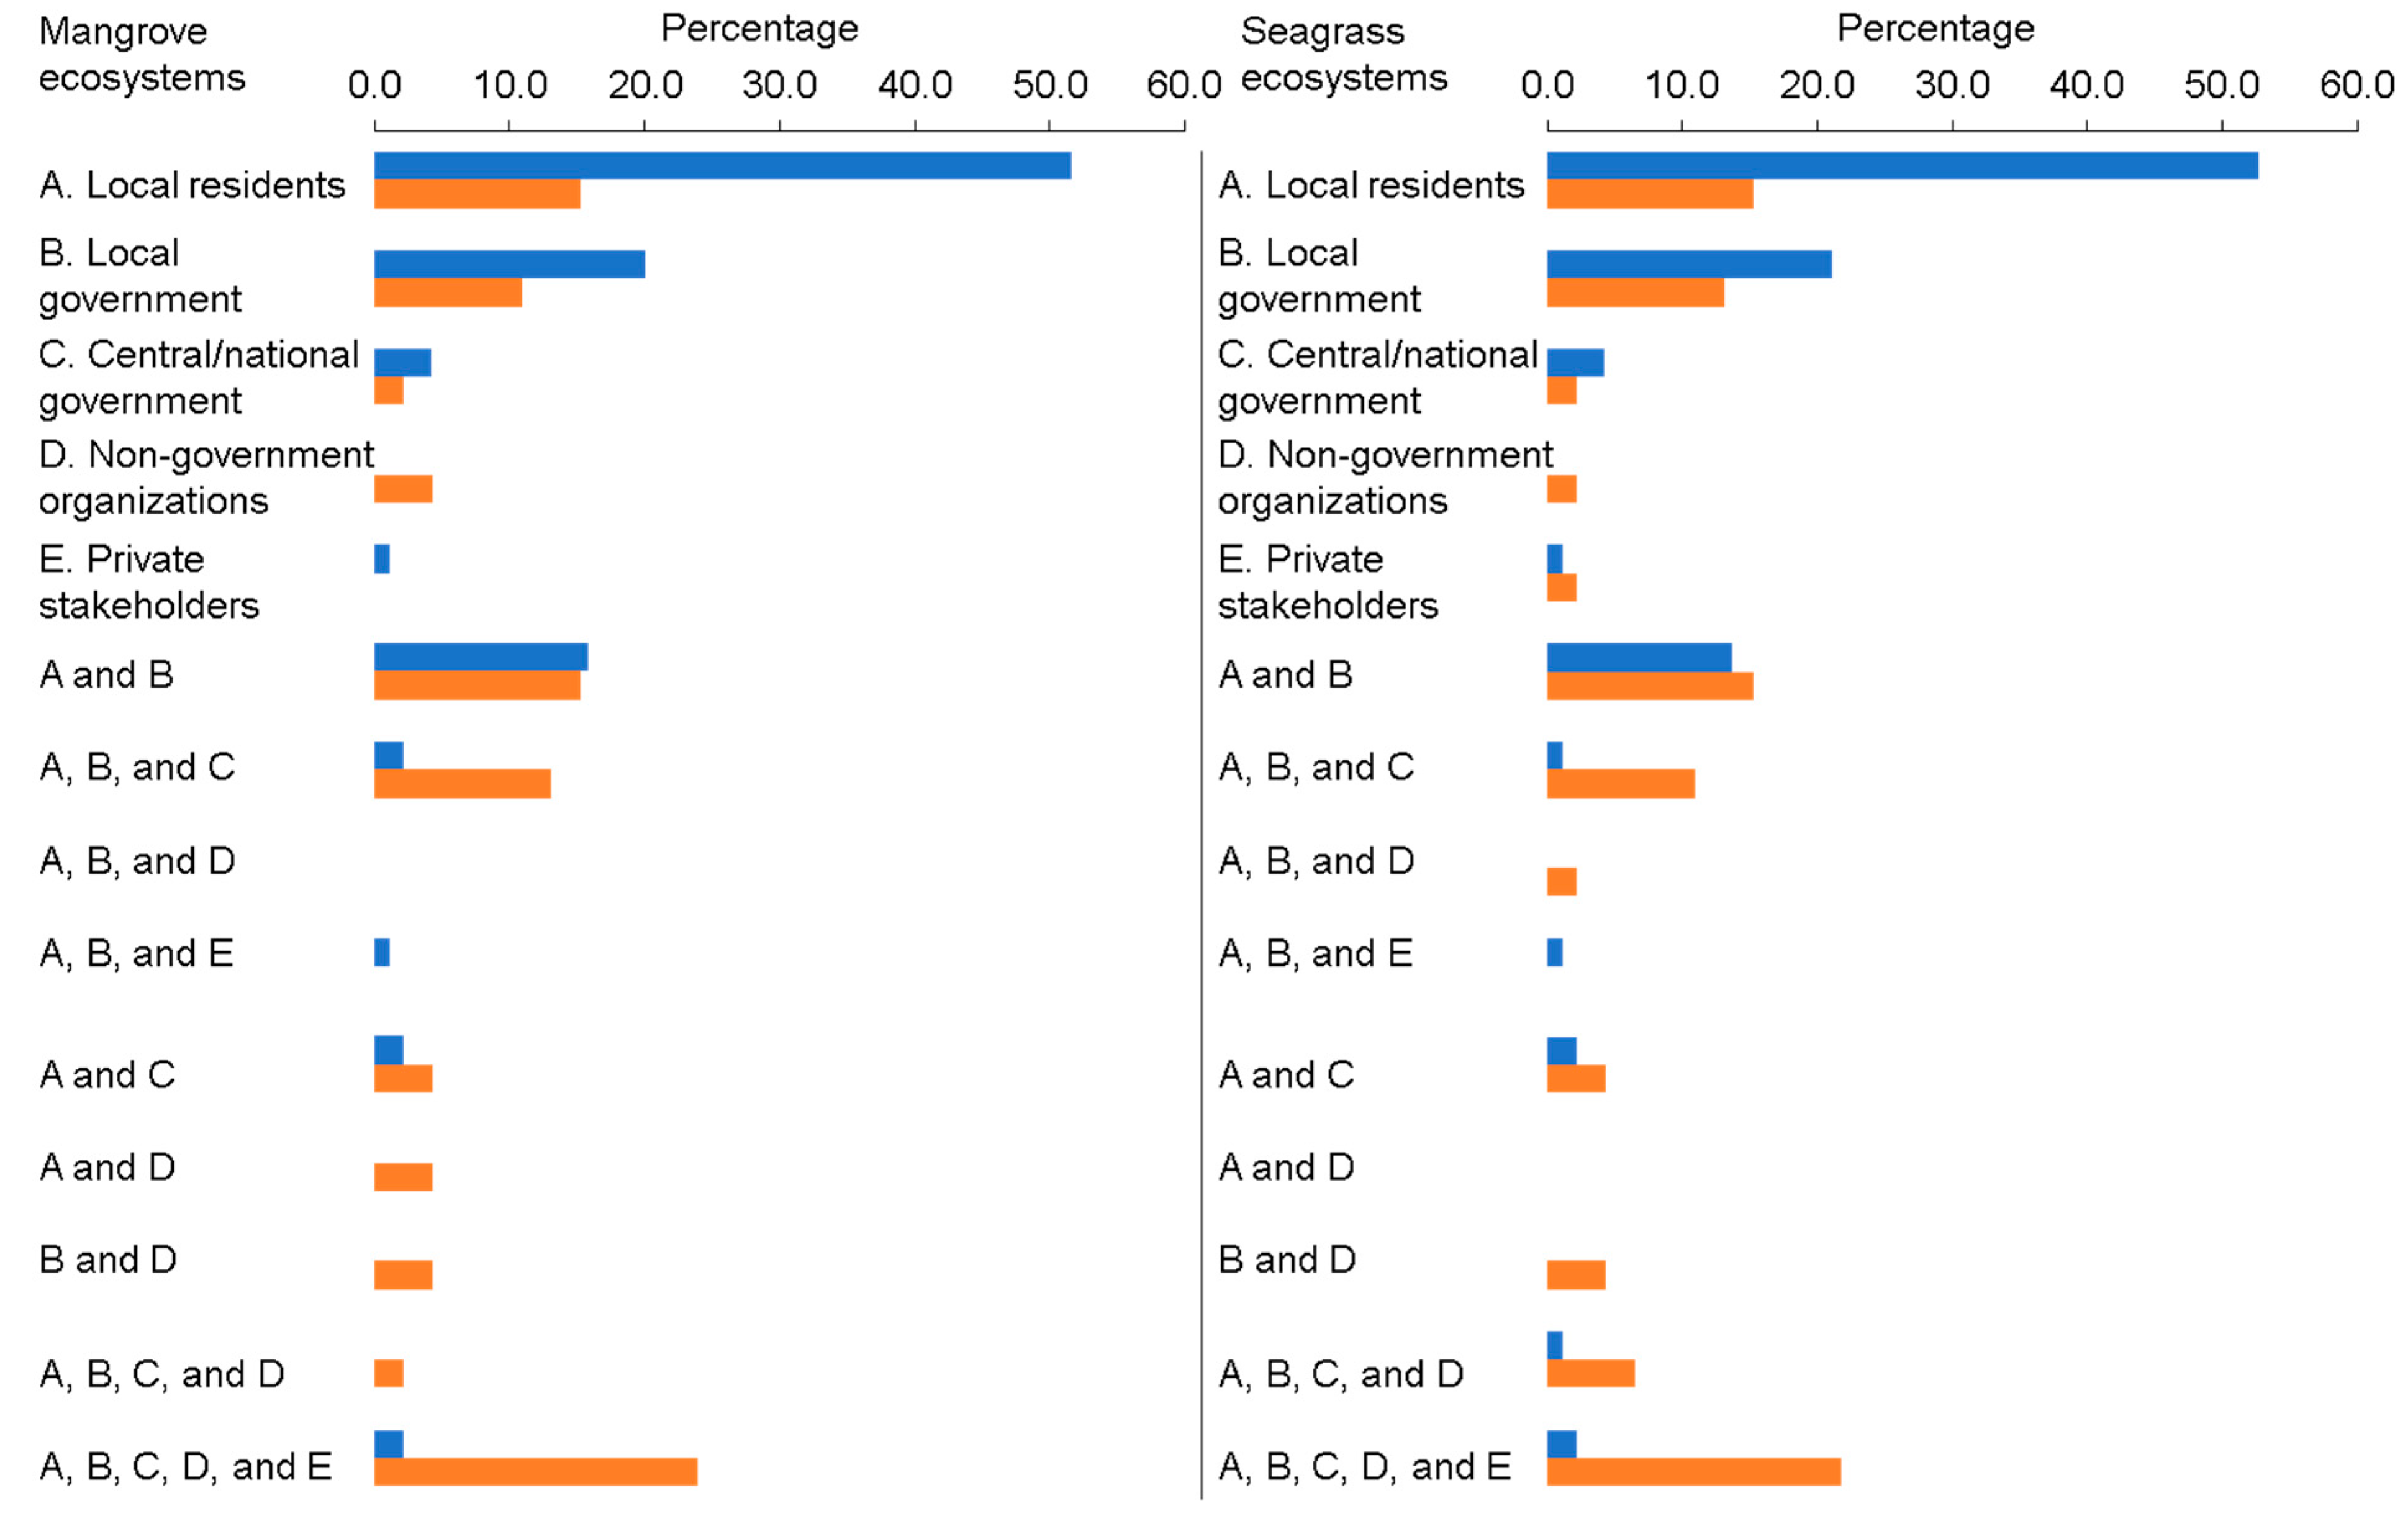
3.5. Perceived Management Strategies to Blue Carbon Ecosystems
4. Discussions
4.1. Awareness and Utilization of Blue Carbon Ecosystems
4.2. Threats to Blue Carbon Ecosystems
4.3. Management Strategies of Blue Carbon Ecosystems
5. Implications to Management of Blue Carbon Ecosystems in the Coral Triangle Region
Supplementary Materials
Author Contributions
Funding
Informed Consent Statement
Data Availability Statement
Acknowledgments
Conflicts of Interest
References
- Primavera, J.H. Development and Conservation of Philippine Mangroves: Institutional Issues. Ecol. Econ. 2008, 35, 91–106. [Google Scholar] [CrossRef]
- Alongi, D.M. Mangrove forests: Resilience, protection from tsunamis, and responses to global climate change. Estuar. Coast. Shelf Sci. 2008, 76, 1–13. [Google Scholar] [CrossRef]
- Mukherjee, N.; Sutherland, W.J.; Dicks, L.; Hugé, J.; Koedam, N.; Dahdouh-Guebas, F. Ecosystem Service Valuations of Mangrove Ecosystems to Inform Decision Making and Future Valuation Exercises. PLoS ONE 2014, 9, e111386. [Google Scholar] [CrossRef] [PubMed] [Green Version]
- Dasgupta, S.; Islam, S.; Huq, M.; Khan, Z.H.; Hasib, R. Quantifying the protective capacity of mangroves from storm surges in coastal Bangladesh. PLoS ONE 2019, 14, e0214079. [Google Scholar] [CrossRef] [PubMed]
- Uddin, S.; de Ruyter van Steveninck, E.; Stuip, M.; Shah, M.A.R. Economic valuation of provisioning and cultural services of a protected mangrove ecosystem: A case study on Sundarbans Reserve Forest, Bangladesh. Ecosyst. Serv. 2013, 5, 88–93. [Google Scholar] [CrossRef]
- Crooks, S.; von Unger, M.; Schile, L.; Allen, C.; Whisnant, R. Understanding Strategic Blue Carbon Opportunities in the Seas of East Asia; Report by Silvestrum Climate Associates for Partnerships in Environmental Management for the Seas of East Asia (PEMSEA), Conservation International and The Nature Conservancy, with support from the Global Environment Facility and United Nations Development Program; Partnerships in Environmental Management for the Seas of East Asia (PEMSEA): Quezon City, Philippines, 2017. [Google Scholar]
- Howard, J.; Sutton-Grier, A.; Herr, D.; Kleypas, J.; Landis, E.; McLeod, E.; Pidgeon, E.; Simpson, S. Clarifying the role of coastal and marine systems in climate mitigation. Front. Ecol. Environ. 2017, 15, 42–50. [Google Scholar] [CrossRef]
- Pidgeon, E. Carbon sequestration by coastal marine habitats: Important missing sinks. In The Management of Natural Coastal Carbon Sinks; Laffoley, D., Grimsditch, G., Eds.; IUCN: Gland, Switzerland, 2009; p. 53. [Google Scholar]
- McLeod, E.; Chmura, G.L.; Bouillon, S.; Salm, R.; Björk, M.; Duarte, C.M.; Lovelock, C.E.; Schlesinger, W.H.; Silliman, B.R. A blueprint for blue carbon: Toward an improved understanding of the role of vegetated coastal habitats in sequestering CO2. Front. Ecol. Environ. 2011, 9, 552–560. [Google Scholar] [CrossRef] [Green Version]
- Nellemann, C.; Corcoran, E.; Duarte, C.M.; Valdrés, L.; Young, C.D.; Fonseca, L.; Grimsditch, G. Blue Carbon—The Role of Healthy Oceans in Binding Carbon; UN Environment, GRID-Arendal: Arendal, Norway, 2009. [Google Scholar]
- Beaumont, N.; Jones, L.; Garbutt, A.; Hansom, J.; Toberman, M. The value of carbon sequestration and storage in coastal habitats. Estuar. Coast. Shelf Sci. 2014, 137, 32–40. [Google Scholar] [CrossRef] [Green Version]
- Asaad, I.; Lundquist, C.; Erdmann, M.V.; Costello, M.J. Delineating priority areas for marine biodiversity conservation in the Coral Triangle. Biol. Conserv. 2018, 222, 198–211. [Google Scholar] [CrossRef] [Green Version]
- Giri, C.; Ochieng, E.; Tieszen, L.L.; Zhu, Z.; Singh, A.K.; Loveland, T.R.; Masek, J.G.; Duke, N.C. Status and distribution of mangrove forests of the world using earth observation satellite data. Glob. Ecol. Biogeogr. 2010, 20, 154–159. [Google Scholar] [CrossRef]
- Alongi, D.M.; Murdiyarso, D.; Fourqurean, J.W.; Kauffman, J.B.; Hutahaean, A.; Crooks, S.; Lovelock, C.E.; Howard, J.B.; Herr, D.; Fortes, M.D.; et al. Indonesia’s blue carbon: A globally significant and vulnerable sink for seagrass and mangrove carbon. Wetl. Ecol. Manag. 2015, 24, 3–13. [Google Scholar] [CrossRef]
- Long, J.B.; Giri, C. Mapping the Philippines’ Mangrove Forests Using Landsat Imagery. Sensors 2011, 11, 2972–2981. [Google Scholar] [CrossRef] [PubMed] [Green Version]
- UNEP. National Reports on Seagrass in the South China Sea; UNEP/GEF/SCS Technical Publication No. 12; United Nations Environment Programme: Bangkok, Thailand, 2008. [Google Scholar]
- Greenberg, R.; Maldonado, J.E.; Droege, S.; McDonald, M.V. Tidal Marshes: A Global Perspective on the Evolution and Conservation of Their Terrestrial Vertebrates. BioScience 2006, 56, 675. [Google Scholar] [CrossRef] [Green Version]
- Chmura, G.L.; Anisfeld, S.C.; Cahoon, D.R.; Lynch, J.C. Global carbon sequestration in tidal, saline wetland soils. Glob. Biogeochem. Cycles 2003, 17, 1111. [Google Scholar] [CrossRef]
- Munang, R.; Thiaw, I.; Rivington, M. Ecosystem Management: Tomorrow’s Approach to Enhancing Food Security under a Changing Climate. Sustainability 2011, 3, 937–954. [Google Scholar] [CrossRef] [Green Version]
- Costanza, R.; de Groot, R.; Sutton, P.; van der Ploeg, S.; Anderson, S.J.; Kubiszewski, I.; Farber, S.; Turner, R.K. Changes in the global value of ecosystem services. Glob. Environ. Chang. 2014, 26, 152–158. [Google Scholar] [CrossRef]
- Spalding, M.; Parrett, C.L. Global patterns in mangrove recreation and tourism. Mar. Policy 2019, 110, 103540. [Google Scholar] [CrossRef]
- Crooks, S.; Herr, D.; Tamelander, J.; Laffoley, D.; Vandever, J. Mitigating climate change through restoration and management of coastal wetlands and near-shore marine ecosystems: Challenges and opportunities. In Environment Department Papers, No. 121. Marine Ecosystem Series; World Bank: Washington, DC, USA, 2011. [Google Scholar]
- Fourqurean, J.W.; Duarte, C.M.; Kennedy, H.; Marbà, N.; Holmer, M.; Mateo, M.A.; Apostolaki, E.T.; Kendrick, G.A.; Krause-Jensen, D.; McGlathery, K.J.; et al. Seagrass ecosystems as a globally significant carbon stock. Nat. Geosci. 2012, 5, 505–509. [Google Scholar] [CrossRef]
- Duarte, C.M.; Losada, I.J.; Hendriks, I.E.; Mazarrasa, I.; Marbà, N. The role of coastal plant communities for climate change mitigation and adaptation. Nat. Clim. Chang. 2013, 3, 961–968. [Google Scholar] [CrossRef] [Green Version]
- Murdiyarso, D.; Purbopuspito, J.; Kauffman, J.B.; Warren, M.W.; Sasmito, S.D.; Donato, D.C.; Manuri, S.; Krisnawati, H.; Taberima, S.; Kurnianto, S. The potential of Indonesian mangrove forests for global climate change mitigation. Nat. Clim. Chang. 2015, 5, 1089–1092. [Google Scholar] [CrossRef]
- Gevaña, D.T.; Pulhin, J.M.; Tapia, M.A. Chapter 13—Fostering climate change mitigation through a community-based approach: Carbon stock potential of community-managed mangroves in the Philippines. In Coastal Management; Krishnamurthy, R.R., Jonathan, M.P., Srinivasalu, S., Glaeser, B., Eds.; Academic Press: London, UK, 2019; pp. 271–282. [Google Scholar]
- Wahyudi, A.J.; Rahmawati, S.; Irawan, A.; Hadiyanto, H.; Prayudha, B.; Hafizt, M.; Afdal, A.; Adi, N.S.; Rustam, A.; Hernawan, U.E.; et al. Assessing Carbon Stock and Sequestration of the Tropical Seagrass Meadows in Indonesia. Ocean Sci. J. 2020, 55, 85–97. [Google Scholar] [CrossRef]
- Thompson, B.S.; Primavera, J.H.; Friess, D.A. Governance and implementation challengs for mangrove forest Payments for Ecosystem Services (PES): Empirical evidence from the Philippines. Ecosyst. Serv. 2017, 23, 146–155. [Google Scholar] [CrossRef]
- Murdiyarso, D.; Sukara, E.; Suprianta, J.; Koropitan, A.; Juliandi, B.; Jompa, J. Creating Blue Carbon Opportunities in the Maritime Archipelago Indonesia; CIFOR Policy Brief No. 3; CIFOR: Bogor, Indonesia, 2018. [Google Scholar] [CrossRef]
- Lukman, K.M.; Quevedo, J.M.D.; Kakinuma, K.; Uchiyama, Y.; Kohsaka, R. Indonesia Provincial Spatial Plans on mangroves in era of decentralization: Application of content analysis to 27 provinces and “blue carbon” as overlooked components. J. For. Res. 2019, 24, 341–348. [Google Scholar] [CrossRef]
- Herr, D.; Blum, J.; Himes-Cornell, A.; Sutton-Grier, A.E. An analysis of the potential positive and negative livelihood impacts of coastal carbon offset projects. J. Environ. Manag. 2019, 235, 463–479. [Google Scholar] [CrossRef] [PubMed]
- Lukman, K.M.; Uchiyama, Y.; Quevedo, J.M.D.; Kohsaka, R. Local awareness as an instrument for management and conservation of seagrass ecosystem: Case of Berau Regency, Indonesia. Ocean Coast. Manag. 2020, 105451. [Google Scholar] [CrossRef]
- Quevedo, J.M.D.; Uchiyama, Y.; Kohsaka, R. Perceptions of local communities on mangrove forests, their services and management: Implications for Eco-DRR and blue carbon management for Eastern Samar, Philippines. J. For. Res. 2019, 25, 1–11. [Google Scholar] [CrossRef]
- Quevedo, J.M.D.; Uchiyama, Y.; Kohsaka, R. Perceptions of the seagrass ecosystems for the local communities of Eastern Samar, Philippines: Preliminary results and prospects of blue carbon services. Ocean Coast. Manag. 2020, 191, 105181. [Google Scholar] [CrossRef]
- Coral Triangle Initiative Climate Change Adaptation Working Group. Regional Workshop on Blue Carbon. Workshop Proceedings Report. 2017. Available online: http://www.coraltriangleinitiative.org/sites/default/files/resources/Regional_CTI_BC_Workshop_Report.pdf (accessed on 19 July 2020).
- International Partnership for Blue Carbon (IPBC). Draft Strategic Plan. 2016. Available online: https://bluecarbonpartnership.org/wp-content/uploads/2016/11/IPBC-Strategic-Plan-October-2016.pdf (accessed on 19 July 2020).
- Quintas-Soriano, C.; Brandt, J.S.; Running, K.; Baxter, C.V.; Gibson, D.M.; Narducci, J.; Castro, A.J. Social-ecological systems influence ecosystem service perception: A Programme on Ecosystem Change and Society (PECS) analysis. Ecol. Soc. 2017, 23. [Google Scholar] [CrossRef] [Green Version]
- Millennium Ecosystem Assessment. Ecosystems and Human Well-Being (MEA); Island Press: Washington, DC, USA, 2005; pp. 25–36. [Google Scholar]
- Díaz, S.; Demissew, S.; Carabias, J.; Joly, C.A.; Lonsdale, M.; Ash, N.; Larigauderie, A.; Adhikari, J.R.; Arico, S.; Báldi, A.; et al. The IPBES Conceptual Framework—Connecting nature and people. Curr. Opin. Environ. Sustain. 2015, 14, 1–16. [Google Scholar] [CrossRef] [Green Version]
- Kovács, B.; Uchiyama, Y.; Miyake, Y.; Penker, M.; Kohsaka, R. An explorative analysis of landscape value perceptions of naturally dead and cut wood: A case study of visitors to Kaisho Forest, Aichi, Japan. J. For. Res. 2020, 25, 291–298. [Google Scholar] [CrossRef]
- Uchiyama, Y.; Kohsaka, R. Cognitive value of tourism resources and their relationship with accessibility: A case of Noto region, Japan. Tour. Manag. Perspect. 2016, 19, 61–68. [Google Scholar] [CrossRef] [Green Version]
- Kohsaka, R. Developing biodiversity indicators for cities: Applying the DPSIR model to Nagoya and integrating social and ecological aspects. Ecol. Res. 2010, 25, 925–936. [Google Scholar] [CrossRef]
- Ehara, M.; Hyakumura, K.; Sato, R.; Kurosawa, K.; Araya, K.; Sokh, H.; Kohsaka, R. Addressing Maladaptive Coping Strategies of Local Communities to Changes in Ecosystem Service Provisions Using the DPSIR Framework. Ecol. Econ. 2018, 149, 226–238. [Google Scholar] [CrossRef]
- Bautista, M.A.; Malolos, G.A.; Magyaya, A.; Palevino, M.L.; Suarez, M.A. Municipality of Busuanga ECAN Resource Management Plan 2017–2022. In Partnership with Municipal Government of Busuanga, Municipal ECAN Board, Palawan Council for Sustainable Development. Available online: https://pcsd.gov.ph/2020/12/11/07-busuanga-ecan-resource-management-plan/ (accessed on 24 December 2020).
- Hafsaridewi, R.; Fahrudin, A.; Sutrisno, D.; Koeshendrajana, S. Resource management in the Karimunjawa Islands, Central Jawa of Indonesia, through DPSIR approach. Adv. Environ. Sci. 2018, 10, 7–22. [Google Scholar]
- Prasetya, J.D.; Ambariyanto, A.; Supriharyono; Purwanti, F. Mangrove Health Index as Part of Sustainable Management in Mangrove Ecosystem at Karimunjawa National Marine Park Indonesia. Adv. Sci. Lett. 2017, 23, 3277–3282. [Google Scholar] [CrossRef]
- Ambal, R.G.R.; Duya, M.V.; Cruz, M.A.; Coroza, O.G.; Vergara, S.G.; de Silva, N.; Molinyawe, N.; Tabaranza, B. Key biodiversity areas in the Philippines: Priorities for conservation. J. Threat. Taxa 2012, 4, 2788–2796. [Google Scholar] [CrossRef] [Green Version]
- Campbell, S.J.; Kartawijaya, T.; Yulianto, I.; Prasetia, R.; Clifton, J. Co-management approaches and incentives improve management effectiveness in the Karimunjawa National Park, Indonesia. Mar. Policy 2013, 41, 72–79. [Google Scholar] [CrossRef]
- Magbanua, F.; D’agnes, L.; Castro, J. Integrated Coastal Management Makes a Difference to Human and Ecosystem Health: Evidence from Philippines; IPOPCORM Monograph Series No. 4; PATH Foundation Philippines Inc: Makati City, Philippines, 2007. [Google Scholar]
- Purwanti, F.; Alikodra, H.S.; Basuni, S.; Soedharma, D. Pengembangan Co-Management Taman Nasional Karimunjawa [Co-Management Improvement Karimunjawa National Park]. Ilmu Kelautan 2008, 13, 159–166. [Google Scholar]
- Sarmah, H.K.; Hazarika, B.B. Importance of the size of sample and its determination in the context of data related to the schools of greater Guwahati. Bull. Gauhati Univ. Math. Assoc. 2012, 12, 55–76. [Google Scholar]
- Sarmah, H.K.; Hazarika, B.B.; Choudhury, G. An investigation on effect of bias on determination of sample size on the basis of data related to the students of schools of Guwahati. Int. J. Appl. Math. Stat. Sci. 2013, 2, 33–48. [Google Scholar]
- Bartlett, J.E., II.; Kotrlik, J.W.; Higgins, C.C. Organizational research: Determining appropriate sample size in survey research. Inf. Technol. Learn. Perform. J. 2001, 19, 43–50. [Google Scholar]
- Philippine Statistics Authority. 2015 Census of Population, Report No. 2—Demographic and Socioeconomic Characteristics Palawan. 2017. Available online: https://psa.gov.ph/sites/default/files/17_Palawan.pdf (accessed on 13 December 2020).
- Fortes, M.D. A review: Biodiversity, distribution and conservation of Philippine seagrasses. Philipp. J. Sci. 2013, 142, 95–111. [Google Scholar]
- McGehee, N.; Andereck, K.L. Factors predicting rural residents’ support of tourism. J. Travel Res. 2004, 43, 131–140. [Google Scholar] [CrossRef]
- Garces, L.; Pido, M.D.; Tupper, M.H.; Silvestre, G. Evaluating the management effectiveness of three marine protected areas in the Calamianes Islands, Palawan Province, Philippines: Process, selected results and their implications for planning and management. Ocean Coast. Manag. 2013, 81, 49–57. [Google Scholar] [CrossRef]
- Nurdin, N.; Riani, E.; Djuwita, I.; Budiharsono, S.; Purbayanto, A.; Asmus, H. Challenging for seagrass management in Indonesia. J. Coast. Dev. 2012, 15, 234–242. [Google Scholar]
- Puryono, S.; Suryanti, S. Degradation of mangrove ecosystem in Karimunjawa Island based on public perception and management. In Proceedings of the IOP Conference Series: Earth and Environmental Science, Semarang, Indonesia, 30–31 October 2018; Volume 246, p. 012080. [Google Scholar] [CrossRef]
- Nehren, U.; Wicaksono, P. Mapping soil carbon stocks in an oceanic mangrove ecosystem in Karimunjawa Islands, Indonesia. Estuar. Coast. Shelf Sci. 2018, 214, 185–193. [Google Scholar] [CrossRef]
- Alura, D.P.; Alura, N.C.; Alura, R.P.C. Mangrove forest and seagrass bed of Eastern Samar, Philippines: Extent of damage by typhoon Yolanda. IJNRLS 2015, 2, 30–35. [Google Scholar]
- Villamayor, B.M.R.; Rollon, R.N.; Samson, M.S.; Albano, G.M.G.; Primavera, J.H. Impact of Haiyan on Philippine mangroves: Implications to the fate of the widespread monospecific Rhizophora plantations against strong typhoons. Ocean Coast. Manag. 2016, 132, 1–14. [Google Scholar] [CrossRef]
- Nordlund, L.M.; Gullström, M. Biodiversity loss in seagrass meadows due to local invertebrate fisheries and harbor activities. Estuar. Coast. Shelf Sci. 2013, 135, 231–240. [Google Scholar] [CrossRef]
- Mulyana, E.; Prayoga, M.B.R.; Yananto, A.; Wirahma, S.; Aldrian, E.; Harsoyo, B.; Seto, T.H.; Sunarya, Y. Tropical cyclones characteristics in Southern Indonesia and the impact of extremes rainfall event. In Proceedings of the MATEC Web of Conferences ICDM, Andalas University, Padang, Indonesia, 2–4 May 2018; Volume 229, pp. 1–79. [Google Scholar] [CrossRef]
- Kamal, M.; Harjo, H.; Wicaksono, P.; Adi, N.S.; Arjasakusuma, S. Assessment of mangrove forest degradation through canopy fractional cover in Karimunjawa Island, Central Java, Indonesa. Geoplanning J. Geomat. Plan. 2016, 3, 107–116. [Google Scholar] [CrossRef] [Green Version]
- Ariyani, N.A.E. Implementation of conservation policy through the protection of life support system in the Karimunjawa National Park. In Proceedings of the E3S Web of Conferences, Semarang, Indonesia, 15–16 August 2018; Volume 31. [Google Scholar] [CrossRef]
- Kotijah, S.; Ventyrina, I. Preventive regulations to remove environmental damage to mangrove ecosystem in East Kalimantan, Indonesia. Int. J. Res. Law Econ. Soc. Sci. 2019, 1, 9–19. [Google Scholar] [CrossRef]
- Margono, B.A.; Potapov, P.V.; Turubanova, S.; Stolle, F.; Hansen, M.C. Primary forest cover loss in Indonesia over 2000–2012. Nat. Clim. Chang. 2014, 4, 730–735. [Google Scholar] [CrossRef]
- Armitage, D. Socio-institutional dynamics and the political ecology of mangrove forest conservation in Central Sulawesi, Indonesia. Glob. Environ. Chang. 2002, 12, 203–217. [Google Scholar] [CrossRef]
- UNEP. Importance of Mangroves to People: A Call to Action; van Bochove, J., Sullivan, E., Nakamura, T., Eds.; United Nations Environment Programme World Conservation Monitoring Centre: Cambridge, UK, 2014; 128p. [Google Scholar]
- Amri, L.; Setiadi, D.; Qayim, I.; Djokosetiyanto, D. Nutrient content of seagrass Enhalus acoroides leaves in Barranglompo and Bonebatang Islands: Implication to increased anthropogenic pressure. Indones. J. Mar. Sci. 2011, 16, 181–186. [Google Scholar] [CrossRef]
- Unsworth, R.K.F.; Ambo-Rappe, R.; Jones, B.L.; La Nafie, Y.A.; Irawan, A.; Hernawan, U.E.; Moore, A.M.; Cullen-Unsworth, L.C. Indonesia’s globally significant seagrass meadows are under widespread threat. Sci. Total. Environ. 2018, 634, 279–286. [Google Scholar] [CrossRef]
- Austin, R.L.; Eder, J.F. Environmentalism, Development, and Participation on Palawan Island, Philippines. Soc. Nat. Resour. 2007, 20, 363–371. [Google Scholar] [CrossRef]
- D’Agnes, L.; D’Agnes, H.E.; Schwartz, J.B.; Amarillo, M.L.; Castro, J. Integrated management of coastal resources and human health yields added value: A comparative study in Palawan. Environ. Conserv. 2010, 37, 398–409. [Google Scholar] [CrossRef] [Green Version]
- Abdullah, K.; Said, A.M.; Omar, D. Community-based Conservation in Managing Mangrove Rehabilitation in Perak and Selangor. Procedia Soc. Behav. Sci. 2014, 153, 121–131. [Google Scholar] [CrossRef] [Green Version]
- Glaser, M.; Baitoningsih, W.; Ferse, S.C.; Neil, M.; Deswandi, R. Whose sustainability? Top–down participation and emergent rules in marine protected area management in Indonesia. Mar. Policy 2010, 34, 1215–1225. [Google Scholar] [CrossRef]
- Kohsaka, R.; Matsuoka, H. Analysis of Japanese municipalities with Geopark, MAB, and GIAHS certification: Quantitative approach to official records with text-mining methods. SAGE Open 2015, 5, 1–10. [Google Scholar] [CrossRef] [Green Version]
- Kohsaka, R.; Matsuoka, H.; Uchiyama, Y.; Rogel, M. Regional management and biodiversity conservation in GIAHS: Text analysis of municipal strategy and tourism management. Ecosyst. Health Sustain. 2019, 5, 124–132. [Google Scholar] [CrossRef]


| Socio-Demographic Profile | Busuanga (n = 98) | Karimunjawa (n = 47) | ||
|---|---|---|---|---|
| Frequency | Percentage | Frequency | Percentage | |
| Gender | ||||
| Male | 50 | 51.0 | 41 | 87.2 |
| Female | 48 | 49.0 | 6 | 12.8 |
| Age | ||||
| 20–30 | 20 | 20.4 | 6 | 12.8 |
| 31–40 | 22 | 22.4 | 14 | 29.8 |
| 41–50 | 23 | 23.5 | 24 | 51.1 |
| 51–60 | 19 | 19.4 | 3 | 6.4 |
| 61 and above | 14 | 14.3 | 0 | 0.0 |
| average age | 44 | 40 | ||
| Residency | ||||
| Less than 5 years | 0 | 0.0 | 2 | 4.3 |
| 5–10 years | 11 | 11.2 | 3 | 6.4 |
| 11–15 years | 8 | 8.2 | 4 | 8.5 |
| 16–20 years | 5 | 5.1 | 11 | 23.4 |
| 21 years or more | 74 | 75.5 | 27 | 57.4 |
| Education | ||||
| No formal education | 11 | 11.2 | 0 | 0.0 |
| Primary school | 50 | 51.0 | 11 | 23.4 |
| Secondary school | 30 | 30.6 | 31 | 66.0 |
| Certificate/Diploma | 2 | 2.0 | 0 | 0.0 |
| Degree holder | 5 | 5.1 | 5 | 10.6 |
| Occupation | ||||
| Fisherman | 23 | 23.5 | 10 | 21.3 |
| Farmer | 5 | 5.1 | 0 | 0.0 |
| Salaried individual | 40 | 40.8 | 16 | 34.0 |
| Unemployed | 30 | 30.6 | 3 | 6.4 |
| Did not answer | 18 | 38.3 | ||
| Ecosystem Services | Busuanga (n = 98) | Karimunjawa (n = 47) | |||
|---|---|---|---|---|---|
| Weighted Mean a | Description | Weighted Mean a | Description | ||
| Mangrove ecosystems | Serves as a nursery, feeding, and breeding area of organisms | 2.9 * | moderately aware | 3.7 * | very aware |
| Provides habitat for many fauna and flora | 3.4 | moderately aware | 3.7 | very aware | |
| Source of food | 3.4 * | moderately aware | 2.6 * | slightly aware | |
| Protect coastal areas from storm surges, strong waves | 3.3 * | moderately aware | 4.0 * | very aware | |
| Act as a natural buffer to coastal erosion | 2.9 * | moderately aware | 4.0 * | very aware | |
| Establish good water quality of the sea | 3.4 | moderately aware | 3.3 | moderately aware | |
| Carbon sequestration | 3.3 | moderately aware | 2.9 | moderately aware | |
| Recreational and educational services | 3.2 * | moderately aware | 3.8 * | very aware | |
| Seagrass ecosystems | Serves as a nursery, feeding, and breeding area of organisms | 2.5 * | slightly aware | 3.7 * | very aware |
| Provides habitat for many fauna and flora | 3.0 * | moderately aware | 3.7 * | very aware | |
| Source of food | 2.9 ** | moderately aware | 2.5 ** | slightly aware | |
| Protect coastal areas from storm surges, strong waves | 2.4 * | slightly aware | 3.4 * | moderately aware | |
| Act as a natural buffer to coastal erosion | 2.4 * | slightly aware | 3.5 * | very aware | |
| Establish good water quality of the sea | 3.0 | moderately aware | 3.3 | moderately aware | |
| Carbon sequestration | 2.7 | moderately aware | 2.7 | moderately aware | |
| Recreational and educational services | 3.0 | moderately aware | 3.6 | very aware | |
| Provisioning and Cultural Services | Busuanga (n = 98) | Karimunjawa (n = 47) | |||
|---|---|---|---|---|---|
| Weighted Mean a | Description | Weighted Mean a | Description | ||
| Mangrove ecosystems | Fishing for own consumption | 2.6 * | once a year | 2.1 * | once a year |
| Fishing for income source | 2.3 | once a year | 2.0 | once a year | |
| Harvesting for firewood materials | 1.7 ** | never use | 1.2 ** | never use | |
| Using as a recreational site (bird or bat watching) | 2.2 | once a year | 3.1 | once a month | |
| Using as a recreational site (paddling) | 1.5 | never use | 1.9 | once a year | |
| Used as a research or educational site | 1.1 | never use | 1.4 | never use | |
| Seagrass ecosystems | Fishing for own consumption | 2.1 | once a year | 2.2 | once a year |
| Fishing for income source | 1.8 | once a year | 2.0 | once a year | |
| Using as a recreational site (bird watching) | 1.3 * | never use | 2.3 * | once a year | |
| Using as a recreational site (snorkeling) | 1.3 * | never use | 1.9 * | once a year | |
| Used as a research or educational site | 1.1 * | never use | 1.3 * | never use | |
| Perceived Threats | Busuanga | Karimunjawa | ||||
|---|---|---|---|---|---|---|
| Mangrove Ecosystems | Mode ab | Percentage | Weighted Mean b | Mode ab | Percentage | Weighted Mean b |
| Natural disasters | 1 | 48.5 | 3.2 * | 10 | 28.3 | 6.6 * |
| Pollution (domestic wastes) | 2 | 34.7 | 2.8 | 2 | 23.9 | 3.7 |
| Informal settlers | 6 | 21.4 | 5.1 | 6 | 20.0 | 4.9 |
| Increasing population | 5 | 30.6 | 5.7 * | 9 | 28.3 | 6.9 * |
| Charcoal making | 4 | 34.7 | 3.6 * | 3 | 21.7 | 5.5 * |
| Conversion to nipa and coconut/palm tree plantation | 8 | 35.7 | 7.2 * | 8 | 21.7 | 5.4 * |
| Mangrove cutting | 2 | 18.6 | 3.9 | 1 | 26.1 | 4.7 |
| Building infrastructures in coastal areas | 7 | 26.8 | 6.5 * | 3 | 17.4 | 5.5 * |
| Conversion to residential areas | 9 | 50.5 | 7.7 * | 6 | 23.9 | 5.6 * |
| Conversion to fishponds | 10 | 64.9 | 8.9 * | 5 | 19.6 | 5.1 * |
| Seagrass ecosystems | ||||||
| Natural disasters | 1 | 39.8 | 3.3 * | 10 | 28.3 | 5.9 * |
| Pollution (domestic wastes) | 1 | 43.9 | 2.1 * | 1 | 28.3 | 4.1 * |
| Increasing population | 3 | 22.4 | 5.5 * | 6 | 21.7 | 6.7 * |
| Building infrastructures in coastal areas | 4 | 17.3 | 5.7 | 6 | 21.7 | 5.0 |
| Mangrove planting on seagrass beds | 4 | 18.4 | 5.4 | 8 | 17.4 | 5.8 |
| Sand mining | 6 | 16.3 | 5.4 | 5 | 23.9 | 5.2 |
| Unregulated gleaning | 6 | 21.4 | 6.6 * | 2 | 19.6 | 5.3 * |
| Siltation | 6 | 17.3 | 5.5 | 2 | 17.4 | 5.2 |
| Beach reclamation | 9 | 33.7 | 7.4 * | 4 | 19.6 | 4.6 * |
| Increasing sea surface temperature | 10 | 52.0 | 8.4 * | 10 | 23.9 | 6.0 * |
| Perceived Management Strategies | Busuanga | Karimunjawa | ||||
|---|---|---|---|---|---|---|
| Mode ab | Percentage | Weighted Mean b | Mode ab | Percentage | Weighted Mean b | |
| Organization strengthening and capacity development | 1 | 30.9 | 2.8 * | 5 | 23.4 | 4.5 * |
| Coastal and Fisheries Law Enforcement | 1 | 23.4 | 3.3 | 4 | 25.5 | 3.5 |
| Fisheries Management | 4 | 19.1 | 3.5 | 2 | 19.1 | 3.8 |
| Habitat management and marine sanctuaries | 3 | 22.3 | 4.1 * | 1 | 23.4 | 3.5 * |
| Enterprise, livelihood, and tourism development | 5 | 23.2 | 4.3 | 5 | 23.4 | 4.1 |
| Information and educational campaigns | 6 | 29.0 | 4.8 * | 2 | 21.3 | 4.1 * |
| Coastal zoning | 6 | 27.7 | 4.1 | 7 | 21.3 | 4.6 |
Publisher’s Note: MDPI stays neutral with regard to jurisdictional claims in published maps and institutional affiliations. |
© 2020 by the authors. Licensee MDPI, Basel, Switzerland. This article is an open access article distributed under the terms and conditions of the Creative Commons Attribution (CC BY) license (http://creativecommons.org/licenses/by/4.0/).
Share and Cite
Quevedo, J.M.D.; Uchiyama, Y.; Muhamad Lukman, K.; Kohsaka, R. How Blue Carbon Ecosystems Are Perceived by Local Communities in the Coral Triangle: Comparative and Empirical Examinations in the Philippines and Indonesia. Sustainability 2021, 13, 127. https://doi.org/10.3390/su13010127
Quevedo JMD, Uchiyama Y, Muhamad Lukman K, Kohsaka R. How Blue Carbon Ecosystems Are Perceived by Local Communities in the Coral Triangle: Comparative and Empirical Examinations in the Philippines and Indonesia. Sustainability. 2021; 13(1):127. https://doi.org/10.3390/su13010127
Chicago/Turabian StyleQuevedo, Jay Mar D., Yuta Uchiyama, Kevin Muhamad Lukman, and Ryo Kohsaka. 2021. "How Blue Carbon Ecosystems Are Perceived by Local Communities in the Coral Triangle: Comparative and Empirical Examinations in the Philippines and Indonesia" Sustainability 13, no. 1: 127. https://doi.org/10.3390/su13010127