Article

The Impact of the COVID-19 Emergency on Local Vehicular Traffic and Its Consequences for the Environment: The Case of the City of Reggio Emilia (Italy)

by
Samuele Marinello
1,*,
Francesco Lolli
1,2 and
Rita Gamberini
1,2
1
En&Tech Interdepartmental Center, University of Modena and Reggio Emilia, 42124 Reggio Emilia, Italy
2
Department of Sciences and Methods for Engineering, University of Modena and Reggio Emilia, 42122 Reggio Emilia, Italy
*
Author to whom correspondence should be addressed.
Sustainability 2021, 13(1), 118; https://doi.org/10.3390/su13010118
Submission received: 3 December 2020 / Revised: 21 December 2020 / Accepted: 22 December 2020 / Published: 24 December 2020
(This article belongs to the Special Issue 8th World Sustainability Forum—Selected Papers)

Abstract

:
The COVID-19 health emergency has imposed the need to limit and/or stop non-essential economic and commercial activities and movement of people. The objective of this work is to report an assessment of the change in vehicle flows and in air quality of a specific study area in the north of Italy, comparing the periods February–May 2020 and February–May 2019. Circulating vehicles have been measured at nine characteristic points of the local road network of the city of Reggio Emilia (Italy), while atmospheric pollutant concentrations have been analysed using data extracted from the regional air quality monitoring network. The results highlight a rapid decline in the number of vehicles circulating in 2020 (with values of up to −82%). This has contributed to a reduction in air concentrations of pollutants, in particular for NO2 and CO (over 30% and over 22%, respectively). On the other hand, O3 has increased (by about +13%), but this is expected. Finally, the particulate matter grew (about 30%), with a behaviour similar to the whole regional territory. The empirical findings of this study provide some indications and useful information to assist in understanding the effects of traffic blocking in urban areas on air quality.

Graphical Abstract

1. Introduction

This paper deals with the study of some effects that the COVID-19 lockdown has had on road vehicular traffic and on the state of air quality. In particular, this paper describes the trends of vehicular traffic entering and leaving the city of Reggio Emilia (northern Italy) through the data collected continuously at some strategic locations positioned at representative points of the region, as well as the atmospheric conditions and the concentrations of some atmospheric pollutants measured during the same period. In particular, the data referring to the following periods have been compared: 1 February—29 May 2019 and 1 February—29 May 2020.
The health emergency related to the spread of COrona VIrus Disease-19 (COVID-19) was officially identified for the first time in late December 2019 in the city of Wuhan (China), where a group of patients experienced acute respiratory problems, with symptoms such as fever, cough, dyspnoea and myalgia or fatigue [1,2,3]. In the following months, helped by population movements, the virus spread rapidly within the Chinese territory and, subsequently, in other parts of the world, infecting in a first phase especially Europe and North America [4,5]. It appears that air and high-speed train (HST) travel have had a strong influence on the spread of the virus [6,7].
Currently, its spread, albeit with very different levels of contagion, involves practically the whole world. This prompted the World Health Organization (WHO) to declare the spread of COVID-19 a global pandemic on 11 March 2020 [8].
The continuous updating of the data by the WHO indicates that as of 18th December 2020 the confirmed cases in the world are over 72 million, with over 1.6 million deaths [9]. After the initial predominance of European countries in the number of infections and deaths, it is now the Americas that have registered the highest number of cases (over 31 million confirmed cases), followed by Europe (over 22 million), South-East Asia (almost 11 million), the eastern Mediterranean (over 4.5 million), Africa (about 1.6 million) and the western Pacific (almost 0.9 million). Figure 1 shows the global map provided by the WHO.
The rapid spread of COVID-19 determined a strong scientific push towards the investigation of the causes and main drivers of the infection, identifying two main types [10,11,12,13,14]: a direct form through human-to-human transmission and an indirect form through contact with contaminated surfaces and materials [15]. Since COVID-19 is a respiratory syndrome disease, a significant amount of scientific evidence identifies air pollution as a factor capable of increasing the risk of contracting these diseases, including COVID-19 [16,17,18,19,20,21].
To cope with the spread of infections, the choice applied internationally was to introduce a limitation or total block of all non-fundamental economic and social activities, imposing a forced lockdown [22]. The lockdown has generated a sharp reduction in industrial activities, with the closure of many manufacturing plants, shops and catering businesses. Tourist activities have collapsed. The entire transport sector has suffered sharp cuts. The study presented by [23], specifically focused on the impact of the COVID-19 emergency on the energy sector and on CO2 emissions globally, reports a reduction (compared to the previous year) in road transport of 50% and in air transport of 75% (90% in Europe using data released by [24]). The International Civil Aviation Organization [25] also confirms high percentages in the reduction of air traffic (about an 80% decrease). [26] describes a sharp drop in vehicular traffic in the cities of Madrid and Barcelona (Spain): −72.4% for long-distance movements and about −44% for heavy vehicles. Also reported are a drop of more than 80% for entrances to the two urban areas and a reduction in traffic circulating within cities on average by 75%. [27] indicates an average reduction of 50% in Budapest (Hungary). The use of public transport services has dropped considerably: reductions of 80–90% of users of public transport in Wuhan (China) and Delhi (India) and of 93% in Santander (Spain) are described by [28]. In transport, the food retail logistics sector has undergone a growth in demand, linked to the panic of citizenship, the need to purchase goods for reserve purposes and the increase in home consumption. This is the analysis conducted by [29] with reference to the German food retail logistics sector. Finally, analysing the social aspect of mobility for some Indian case studies, [30] report drops of 71%, 46%, 65% and 60% in retail and recreation, grocery and pharmacy, visits to parks, transit stations, and workplace mobility, respectively. In studying the specific situation in the Netherlands, [31] indicate how the amount of travel and the distance travelled decreased by 55% and 68%, respectively. [32] noted that human mobility in the United Kingdom drops by about 80% after the imposition of a blockade.
Vehicle traffic is an important source of air pollutants, particularly in urban areas, as well as one of the main causes of exceeding the regulatory limits of air quality for the health of the population [33,34,35]. This source makes a significant contribution to the concentrations of different pollutants, especially nitrogen oxides (NOx), carbon dioxide (CO2), sulphur dioxides (SO2), carbon monoxide (CO), volatile organic compounds (VOCs) and particulate matter (PM10 and PM2.5). [36] quantify at 50% the contribution of vehicular traffic to total emissions in Delhi (India), with 66–74% of NOx emissions. [37] confirm NOx as the main traffic-related pollutant in analysing the territory of Trabzon (Turkey). Analysing a specific context of China (Shandong Province), [38] show a strong contribution by vehicular traffic to emissions of NOx (69%), while minor contributions are attributed to PM (1%), CO (8%) and VOCs (8%). [39] attributes to traffic an overall contribution of 30% and 14% to the emissions of NOx and CO2 in the Federal District (Brazil). Light-duty vehicles (LDVs) are attributed greater pressure in terms of CO, CO2 and methane, while heavy-duty vehicles (HDVs) are attributed greater pressure in NOx, PM and NMHC emissions. [40], analysing a comprehensive atmospheric emission inventory for air quality in Bogotá (Colombia), indicate a strong impact of traffic on CO2 (80%), CO (99%), VOC (68%), NOx (95%) and SO2 (85%).
At the European level, [41] attribute to traffic (road) a contribution of 39% for NOx emissions and a further 9% for non-road transport and 13% (11% road and 2% non-road transport) for PM2.5. Analysing the data reported by the European Environment Agency [42], transport (road and non-road) is indicated as being responsible for over 50% of NOx emissions, about 20% for CO and PM2.5 and about 10% for other pollutants (non-methane volatile organic compounds—NMVOCs, PM10 and SOx). At the local level, in Italy the Emilia-Romagna region quantified the contribution of vehicular traffic to pollutant emissions as follows [43]: 58% of NOx, 48% of CO, 34% of CO2, 26% of PM, 12% of NMVOCs and 0.5% of SO2.
The pressures on air quality are assessed through the use of emission inventories [44] and through experimental measurements conducted in the laboratory or in real contexts [45]. In considering the direct relationship between polluting emissions and the presence of vehicular traffic, the significant reduction in the number of vehicles circulating during the lockdown period has favoured a consequent reduction in polluting concentrations in the atmosphere and the quality of movement [29,46,47], although with further related problems (increase in speeds, more frequent harsh acceleration and harsh braking events) [48]. As reported by [27], with a case study in Budapest (Hungary), the reduction in transport levels has changed in relation to the type of vehicle used. The results show a greater reduction for public transport (80%), while cycling and bike sharing have the lowest values (23% and 2%, respectively). For road traffic, a reduction of about 34–37% less is reported.
It is important to underline that the pollutant concentrations reported in the study are not only due to the emission contribution of vehicular traffic, but are the joint contribution of the possible polluting sources and photochemical reactions that take place in the atmosphere.
The research questions that it is intended the paper will answer are the following:
-
How much of an impact did the lockdown period in Italy have on the characteristic vehicle flows of the city of Reggio Emilia?
-
Is there a direct relationship between the reduction of circulating traffic and the polluting concentrations measured by the air quality monitoring stations in the area?
-
What are the possible lessons learned from this emergency situation for future choices in land management?

2. Materials and Methods

2.1. Description of Pilot Areas

The selected pilot area is represented by the urban area and the first suburbs of the city of Reggio Emilia. Located in northern Italy, in the Po Valley, the city has a population of about 172,124 inhabitants (according to the 2019 data from the Italian National Institute of Statistics (ISTAT), 2020) and hosts numerous industrial and production activities. According to the data from a recent survey conducted at local level [49], the presence of crafts (about 36% of the companies in the area) is of considerable significance, making this province the largest artisan reality in north-eastern Italy. The sector with the greatest relative weight remains that of the metalworking industry (46.5%), followed by the food sector (13.3%), ceramics (7.8%), clothing (7.6%) and construction (7%). During the COVID-19 emergency, the province of Reggio Emilia was hit hard, like most of northern Italy. While at regional level the number of COVID-19 cases is (updated to 24th November 2020) 111,000 (about 12% nationally), in Reggio Emilia there were 16,077 positive cases [50,51].

2.2. Data

In the present study, different data have been used, coming from free-access local databases. To observe the effect induced by the lockdown, data series covering the period 1 February—29 May have been analysed, considering a few weeks before and a few weeks after the period with the most restrictive impositions of the lockdown, which, in Italy, corresponds to the period 10 March—18 May 2020. The same assessments have also been also conducted for the same period of the year 2019.

2.2.1. Vehicle Traffic Detection

The Emilia-Romagna region, through the Traffic, Logistics and Water Transport Service, has a regional network for detecting traffic flows that covers the entire regional territory through 285 stations installed in the suburban and peri-urban area, on the edge of the roadway. A total of 265 workstations (underground) are equipped with magnetic loops inserted in the road pavement, while 16 workstations (above ground) are equipped with microwave sensors installed on portals or semi-portals. The traffic flows are classified according to the direction, speed and type of vehicle (through subcategories that characterize LDV and HDV). The data are aggregated every 15 min and guarantee coverage for the whole day.
In this study, nine stations have been selected, distributed around the urban area of the city of Reggio Emilia, representative of most of the access/exit routes from the city. Their spatial distribution is shown in Figure 2, while Table 1 describes their main characteristics.

2.2.2. Monitoring of the Main Microclimatic Variables

At regional level, the monitoring of the variables characterizing meteorology, climatology, hydrology, agro-meteorology, radar meteorology and environmental meteorology is entrusted to the Regional Agency for Prevention, Environment and Energy of Emilia-Romagna (Arpae), through the Hydro-Weather-Climate Service (SIMC). The Arpae SIMC uses a dense network of measuring instruments made up of fixed monitoring stations, radars, satellite images and radio soundings. Inside the study area there is an urban station for detecting the main meteorological variables, as shown in Figure 2 and Table 2.

2.2.3. Monitoring to Assess Air Quality

The monitoring and evaluation of air quality in the regional territory is also entrusted to Arpae. Continuous monitoring is carried out through a network of air quality monitoring stations (AQMS) that are distributed throughout the entire regional territory. Each AQMS, classified according to the indications defined by Directive 2008/50/EC and subsequent amendments and additions [52], measures specific atmospheric pollutants. The current regional network consists of 47 AQMSs and five of these are located within the provincial territory of Reggio Emilia. In considering the pilot area described in this study, two AQMSs have been selected because they are located within the investigation area (Figure 2 and Table 3).

3. Results and Discussion

With the aim of contextualizing the situation analysed in this paper and providing an overall assessment of the change in citizens’ movements due to COVID-19, Table 4 reports the results elaborated by Google [53] with reference to the overall national situation, to the Emilia-Romagna region and, finally, to the province of Reggio Emilia. The values refer to the period 1 February—29 May 2020, which represents the study period of this paper.
The results highlight the sharp reduction in citizens’ movements compared to most of the sectors analysed, with particular significance for retail and recreation and transit stations (reduction of between −62% and −66%). Grocery and pharmacy, on the other hand, had fewer reductions (about −34%). Movements in the residential sector increased by around 22%. No significant differences are highlighted between the three different territorial areas reported. Parks in Reggio Emilia had a lower drop compared to the national situation (−45% compared to −51% in Italy).

3.1. Vehicular Traffic Results

The results reported and discussed below provide an assessment of the variation in vehicular traffic at the nine measuring points located at the main entrance to, and exit routes from, the urban area of the city of Reggio Emilia.

3.1.1. Average Annual Values for the Period 2015–2020

The first evaluation described refers to the average daily number of transits near each measuring point. The data, shown in Table 5 and Figure 3, indicate the annual average of daily transits for the period 2015–2020 (for the year 2020 the data for the period January–July have been used).
All the selected measuring stations have a trend that is almost constant during the period 2015–2019. The changes in average daily transits do not show particularly anomalous situations. Stations “139”, “143” and “452” have values increasing over time, with an annual growth in the vehicle flows of about 1.46%, 2.13% and 2.51%, respectively. Station “638” has a continuously decreasing trend (−0.2%). The year 2020, due to the lockdown, shows a significant reduction in the number of vehicles at each measurement station. The percentage differences of the year 2020 compared to previous years have values of between −43% and −54%. The most significant drop was detected in station “140”, which is located along “Road 9—Via Emilia”, an extremely busy artery (24,588 vehicles/day in the period 2015–2019) used as a link between two major cities in the region: Reggio Emilia and Modena.

3.1.2. Average Weekly Values for the Period February–May 2019 and 2020

Figure 4 shows the trend of the average values of vehicle traffic at each station analysed. The daily data reported have been aggregated on a weekly basis, to avoid constant fluctuations in the data trend due to the physiological decline in traffic during public holidays (every Sunday and any other holidays during the period). Overall, the period 1 February—29 May was divided into 17 weeks. The weekly trend at all the stations appears similar. During 2019 the flows are similar and almost constant. The main deviation, with a reduction in traffic flows, is detected during weeks 12 and 13. The reason is attributable to the Easter holidays (week 12) and to 25 April and 1 May (both in week 13), which are national public holidays in Italy. The trend of transits at the measuring points during the year 2020 takes on a further characteristic trend. The first two to three weeks of 2020 have a trend that can be superimposed on the year 2019. From week 4, the progressive decrease in vehicle flows begins, reaching the minimum value at week 7 (first week of lockdown in Italy), up to week 13. Subsequently, the values of 2020 start to grow again, to return to week 17 almost similar with the 2019 period.
The same considerations can also be deduced from the analysis of percentage differences (Table 6). Moderately positive values (which indicates higher average values during 2020 compared to 2019) were recorded in the first three weeks of the observed period (the values never exceed 5%). The largest differences are found between weeks 7 and 13 (reaching the value of −82% at position “452” during week 9, in the middle of the lockdown period). Week 9 is the period that shows the greatest differences for all the surveyed points analysed.

3.2. Meteorological Characteristics

Table 7 shows the minimum, average and maximum values of the meteorological variables measured at the urban station of Reggio Emilia during the study period (February–May 2019 and 2020). Temperatures have similar values in the two years, with negligible variations. The maximum wind speeds were higher during 2019 (with a peak of 3.3 m/s) than observed in 2020. The direction of the winds is similar, with a strong prevalence of winds from the south, south-east and south-west. Direction and speed are represented by the wind roses shown in Figure 5. Finally, the cumulated rainfall records a difference in the maximum values, with more consistent rain events in 2019. Figure 6 highlights this, in particular for the months of April and May 2019.

3.3. Air Quality Results

The air quality results described in this section refer to the analysis of the data collected by the two AQMSs present in the study area. Table 8 shows the annual average values of the main air pollutants detected, as well as the percentage difference of the data referring to the year 2020 compared to the period 2015–2019. From these results it is possible to observe a general reduction in 2020 of NO2 and PM10 at both AQMSs analysed. CO also decreases. However, there are increases for O3 and PM2.5, detected only at the “San Lazzaro” station.
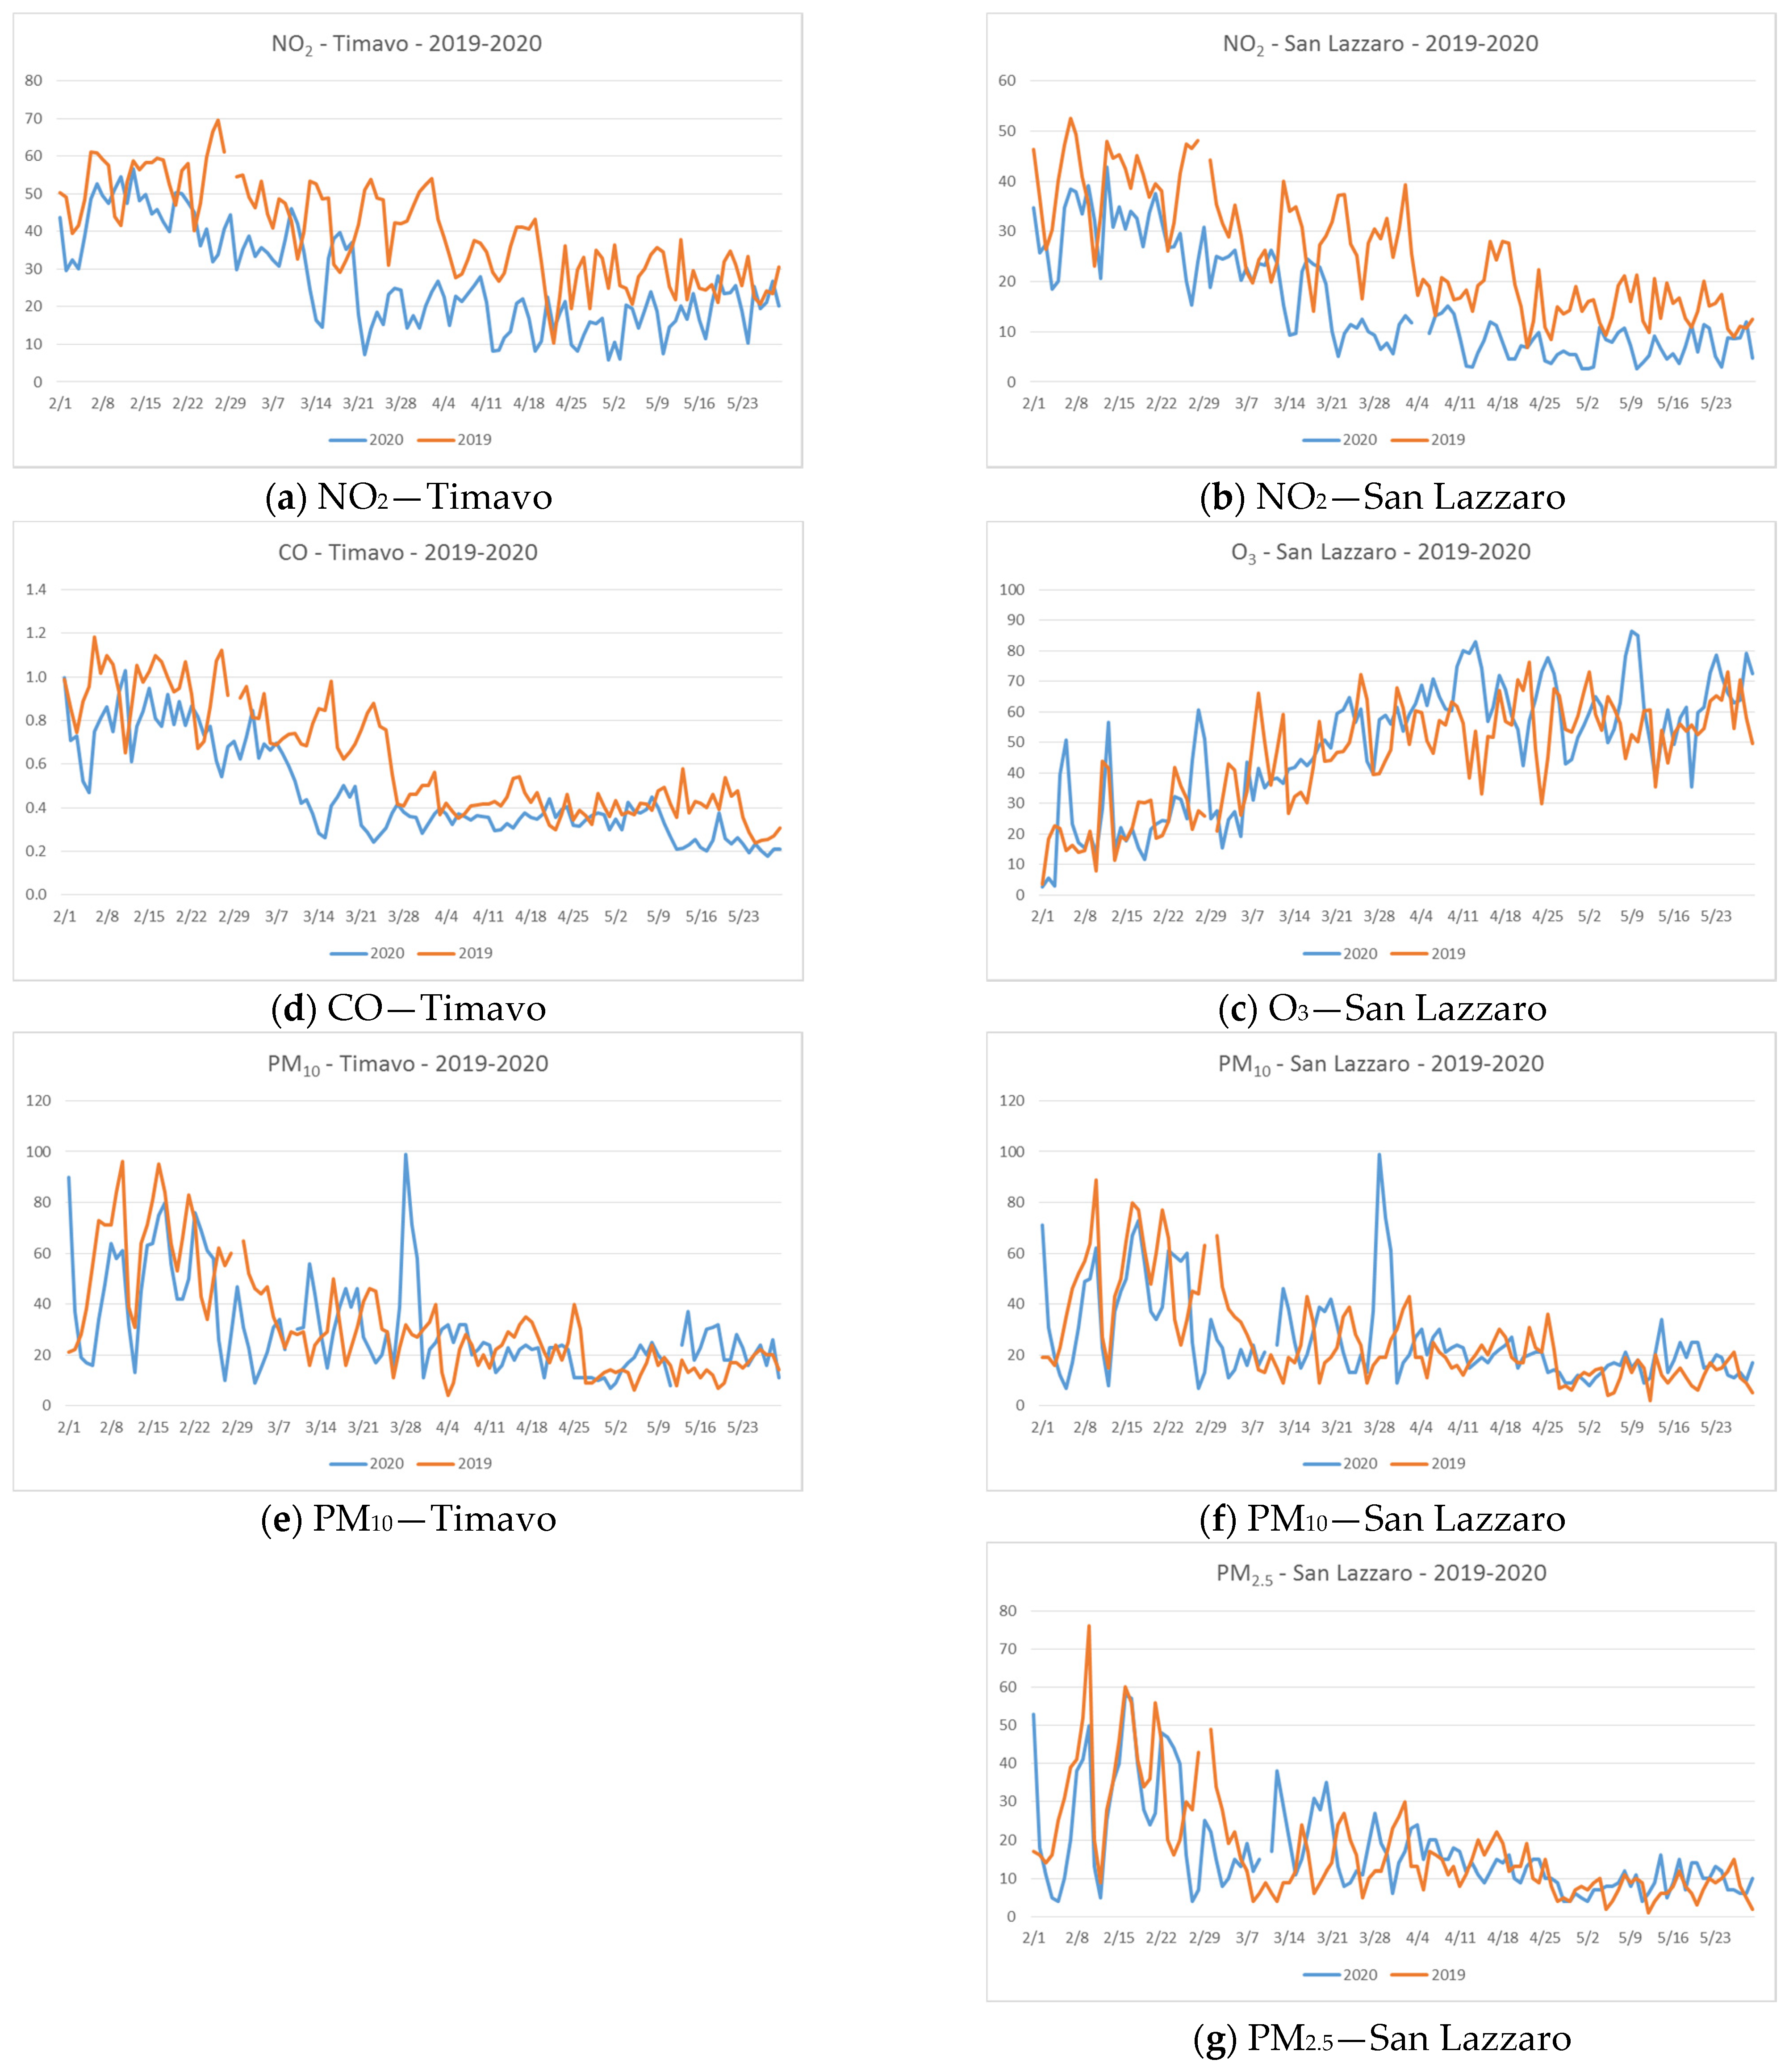
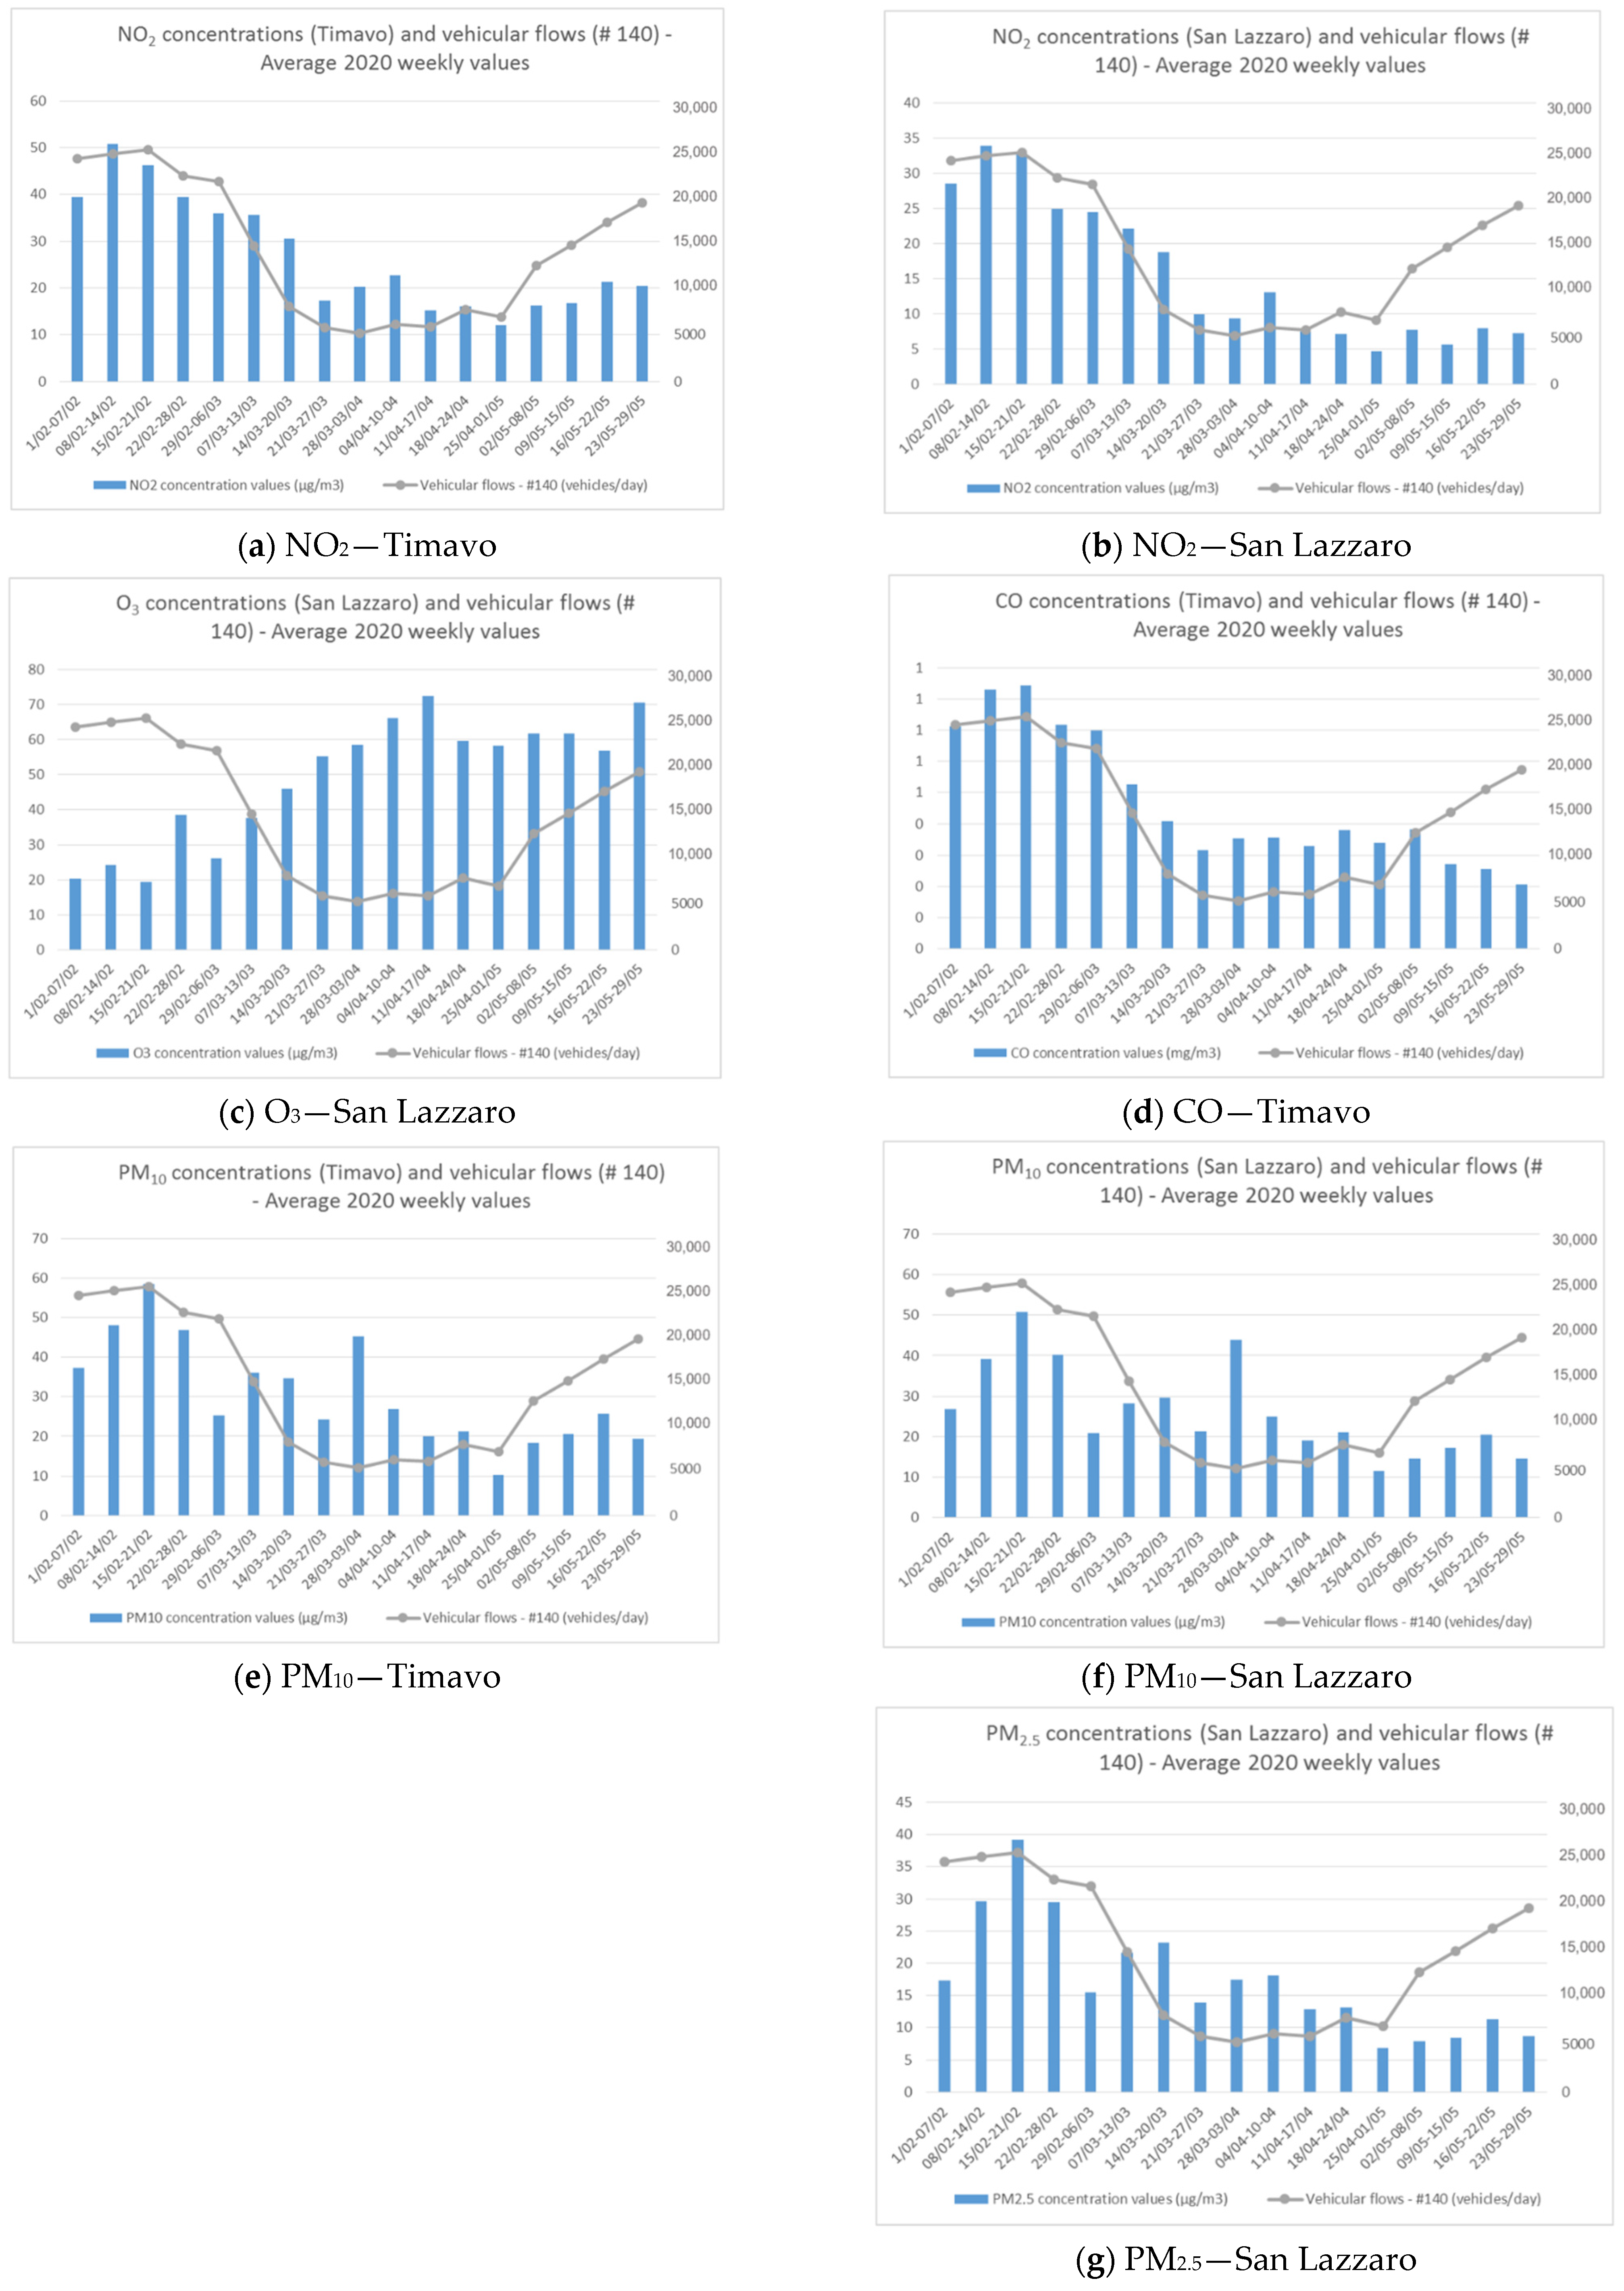
The representation of the daily average values of the concentrations is shown in Figure 7a–g, comparing the years 2019 and 2020, while Table 9 shows the minimum, average and maximum values, the correlations in the data series and the percentage difference between 2019 and 2020. The percentage difference is also reported for the specific duration of the lockdown in Italy (10 March—18 May) in order to highlight the changes in concentrations for that specific period.
NO2 assumed a generally decreasing trend during the period under investigation, going from average values of 50 µg/m3 and 35 µg/m3 (respectively for the “Timavo” and “San Lazzaro” stations) during the first days of February to values of 30 µg/m3 and 18 µg/m3 during the months of April and May. The trends shown in Figure 7a,b show a general trend towards higher values during 2019 than in 2020. This is also confirmed in the average and maximum values shown in Table 9, where the year 2020 has lower values. In the minimum values, 2020 is moderately higher than in 2019. The correlations are close to the optimal values in the comparison of the 2019–2020 data series. The comparison between the stations is less satisfactory.
Analysing the percentage differences, NO2 is the only one of the pollutants analysed that has negative values, identifying a general decline in concentrations during the year 2020 compared to the previous year. Over the entire period analysed, “Timavo” recorded a general decrease of −32% (−41% during the lockdown) and “San Lazzaro” decreased by 41% (−52% during the lockdown). These results are in line with the recent available bibliography. In particular, [54], studying the situation in western Europe, report a reduction in NO2 concentrations of around 30%. Similarly, studies by [26,55,56,57] report reductions of about 50–60%, 36%, 35% and 25% in Spain, Peru, India and the USA, respectively.
O3 is a pollutant detected only at the “San Lazzaro” station. It assumes an increasing trend over time (Figure 7c). Being a pollutant with a strong dependence on the seasons, its values tend to increase going from the cold to the warm period. The daily trend of the concentration values highlights numerous situations with higher values in 2020 than in 2019, a superiority that can be identified in Table 9, where the minimum, average and maximum values are always higher in 2020 than in the previous year. On average, the concentrations in 2020 are 13% higher than those in 2019 (+16% considering only the lockdown period). Other authors also report an increase in O3 concentrations: [58] describe a 17% increase in Europe, [59] one of 30% in Brazil and [60] an increase of 17% in India.
The CO is measured only at the “Timavo” station. Its performance (Figure 7) gradually decreases from February to May, with a general good correlation between the two years (0.76). There is a general superiority of the values for 2019, as confirmed also by Table 9. The percentage difference is −22% during 2020 compared to 2019. This percentage reaches −25% if we consider only the duration of the lockdown. Similar results are described by [61] for Asia (−28%), by [62] for India (−30%) and by [63] for Brazil (−40%).
For PM10, the concentration trends are very similar at the two stations analysed. Both in “Timavo” and in “San Lazzaro”, the minimum, average and maximum concentrations for the period are similar. Even between the years 2019 and 2020 the values are not very different. Only the minimum values change between 2019 (with lower values) and 2020 (with higher values). The correlations in the concentration values detected during the same year between the two stations are very high (0.96 and 0.95 for 2019 and 2020, respectively). The correlations between different years (2019 compared to 2020) are much lower (0.44 and 0.51, respectively).
Despite the general trend towards lower concentrations going from February to May, the percentage differences in concentrations show an overall increase in PM10 concentrations for both stations analysed during 2020, compared to the concentrations measured in 2019. The mean values of percentage differences are 27% and 23% for “San Lazzaro” and “Timavo”, respectively. Comparing only the lockdown period, the percentage difference increases, reaching values of 43% and 37%.
Fine particulate matter (PM2.5) is a pollutant measured only at the “San Lazzaro” station. PM2.5 has very similar daily average trends to PM10 over the entire period, with an equal average value for both years (17 µg/m3). On the other hand, the minimum values (0.6 µg/m3 in 2019 and 4 µg/m3 in 2020) and the maximum values (76 µg/m3 in 2019 and 58 µg/m3 in 2020) change. The correlation is 0.58. Analysing the percentage differences, PM2.5 shows a general increase in values during 2020, with values higher than those recorded for PM10: +31% for the entire period analysed and +46% considering the lockdown period only.
While registering a reduction, the particulate matter remains within the variability of the previous year, with a different trend compared to the trend of gases. It is important to emphasize that the Emilia-Romagna area was strongly affected by the phenomenon of a long-term influx of dust from the Caspian Sea during the final days of March 2020, affecting the concentrations of dust in the whole area.
These results obtained for the particulate matter are in contrast to the indications provided by the international literature. Indeed, many studies have identified a reduction in particulate matter concentrations, both of PM10 and PM2.5 [61,64,65]. To better understand this deviation, scientific studies on the behaviour of particulate matter in northern Italy during the COVID-19 emergency have been selected. Also, in this case, the results obtained are conflicting. Ref. [66] studied the specific situation of the city of Brescia, observing how PM10 concentrations have no significant variations, attributing the cause to a “balance” between the reduction of emissions due to the decrease in vehicular traffic and a consequent more intensive use of home heating. Furthermore, this result is justified by the contribution of the secondary particulate matter (very relevant in the Po Valley) and by the specific meteorological and climatic conditions that characterize this area.
On the other hand, [67] studied the specific situation of the city of Milan, identifying a drop in concentrations of PM10 (about −36%) and PM2.5 (about −40%), attributing the cause to the reduction in vehicular traffic.
Finally, [68] confirm the tendency for particulate matter concentrations to decrease during the lockdown (about −45% and −47% for PM2.5 and PM10, respectively), but without providing a comparison with pre-2020 years.
This situation highlights the characteristic complexity of atmospheric PM, which is strongly influenced by various factors, such as primary emissions, precursor emissions, weather and climate conditions that influence the transport and dispersion of the PM and activate photochemical processes for the formation of secondary particulate matter.
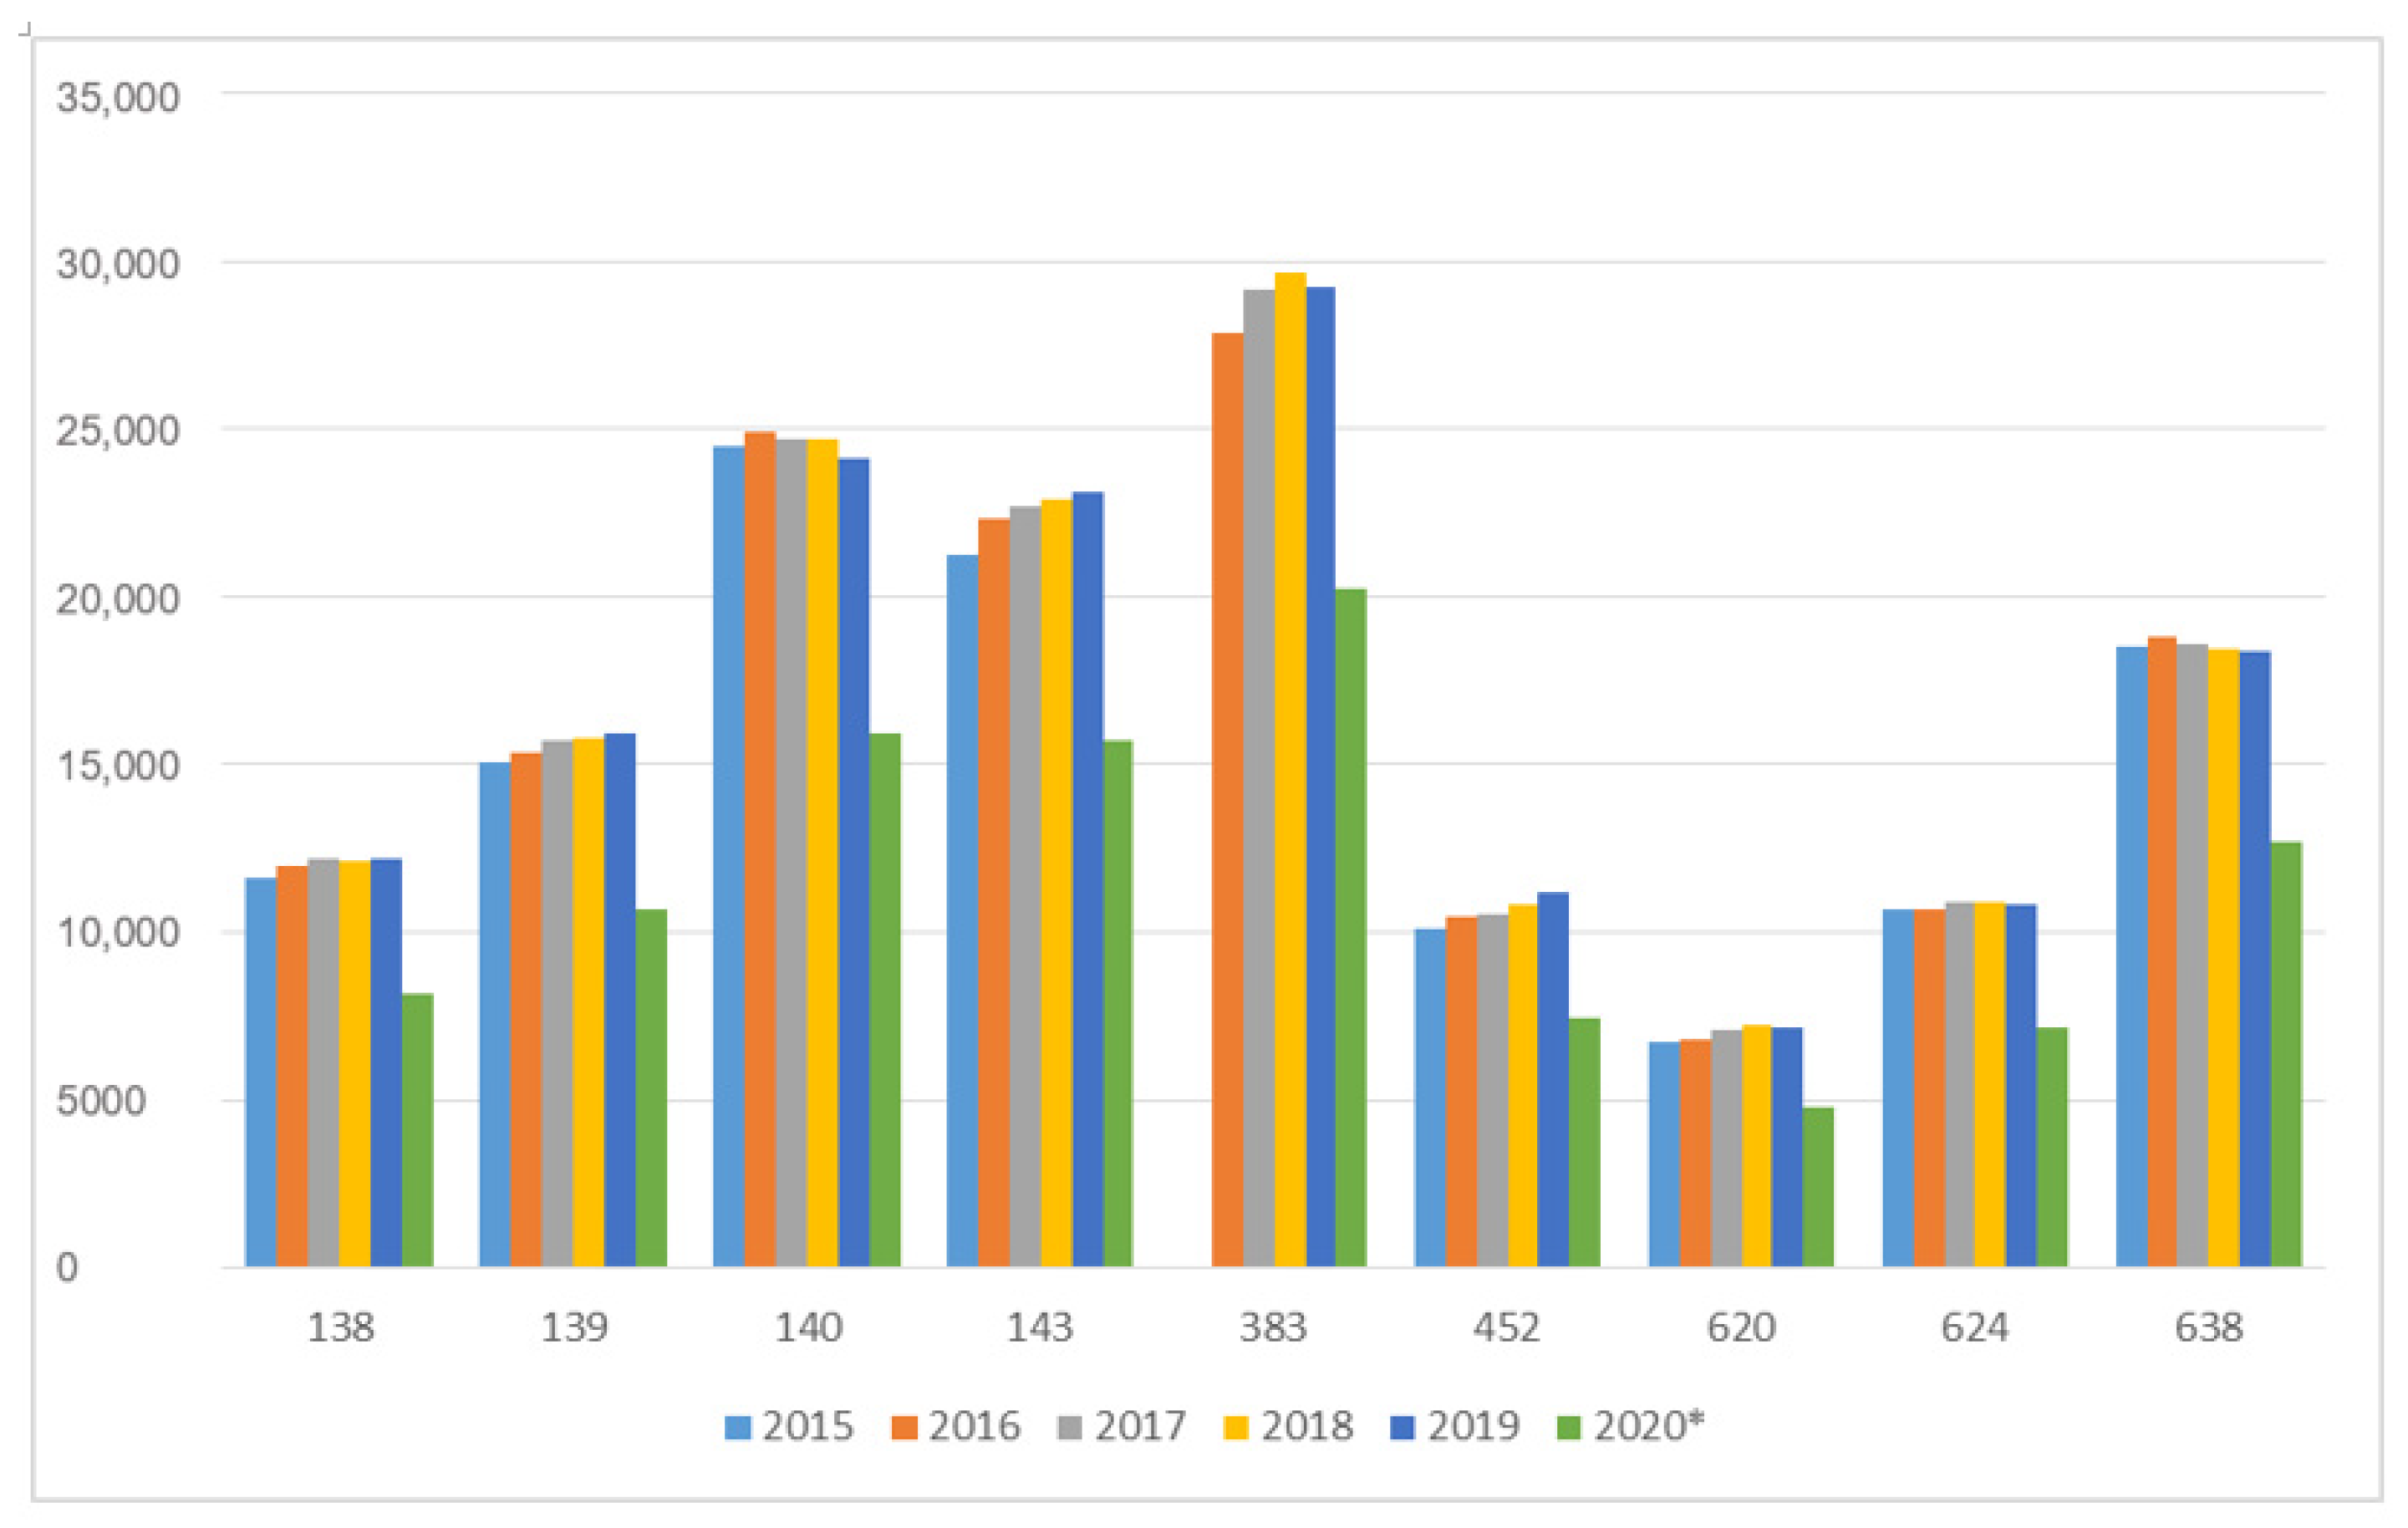
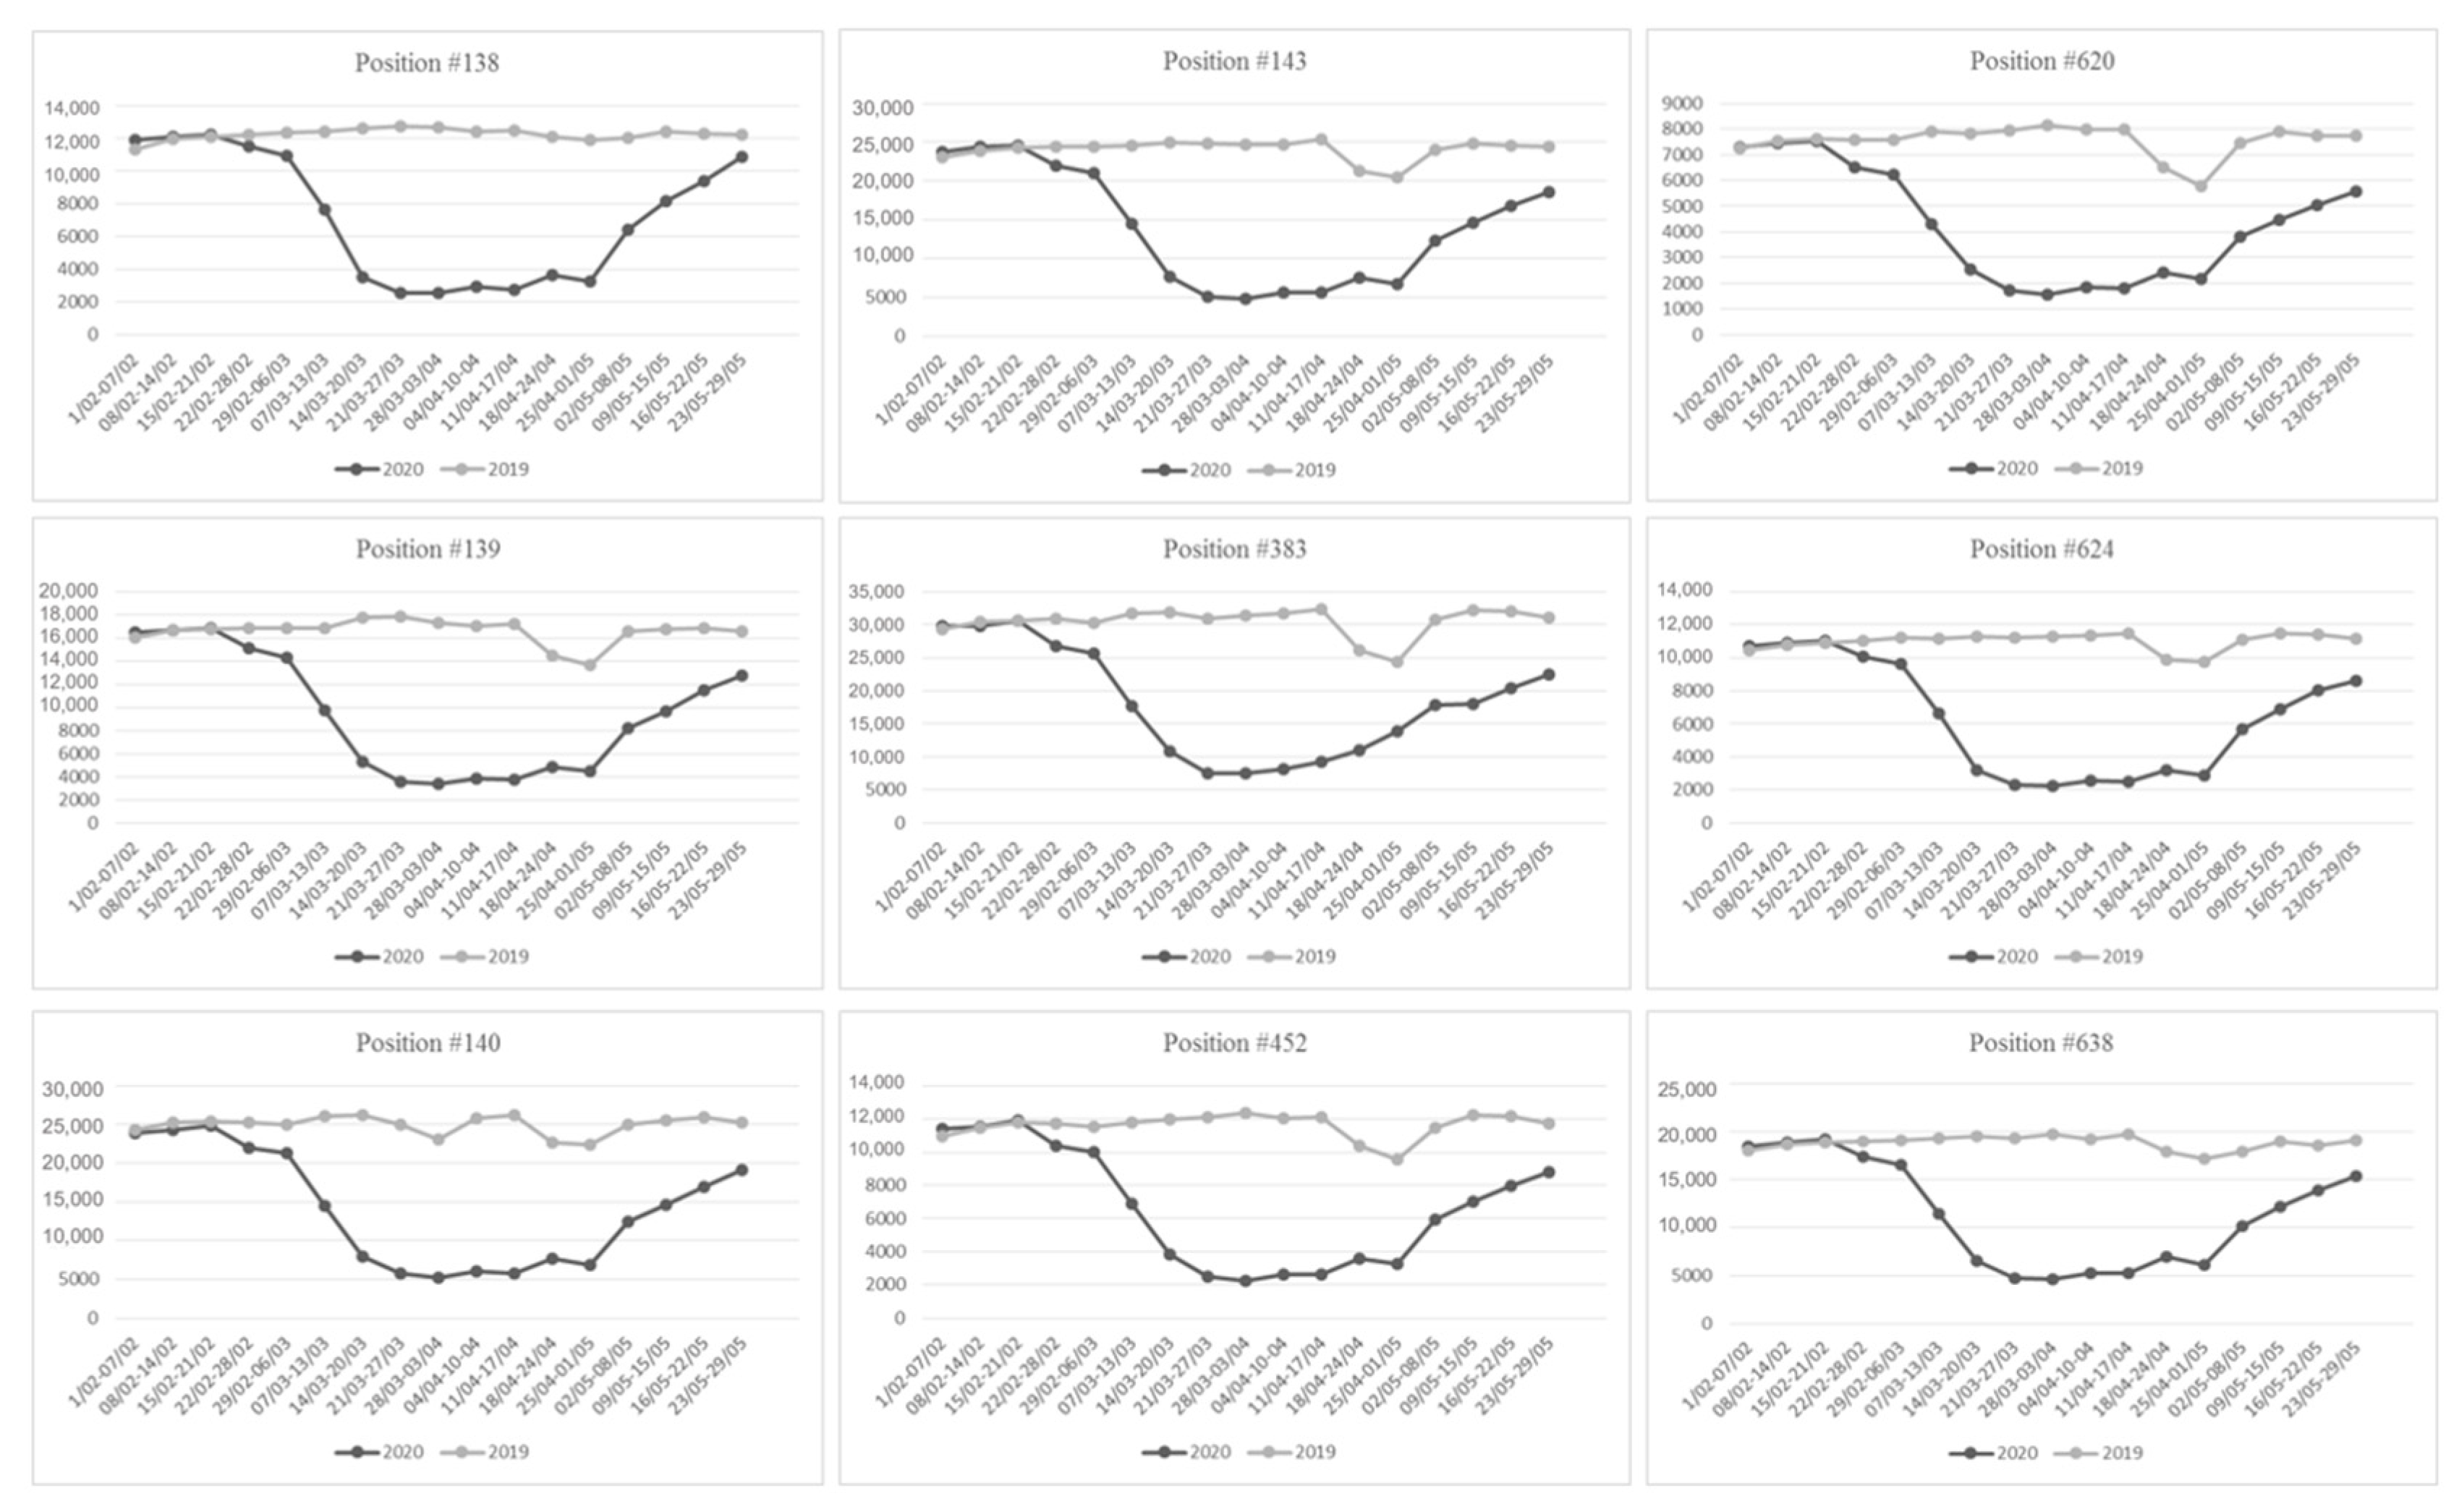
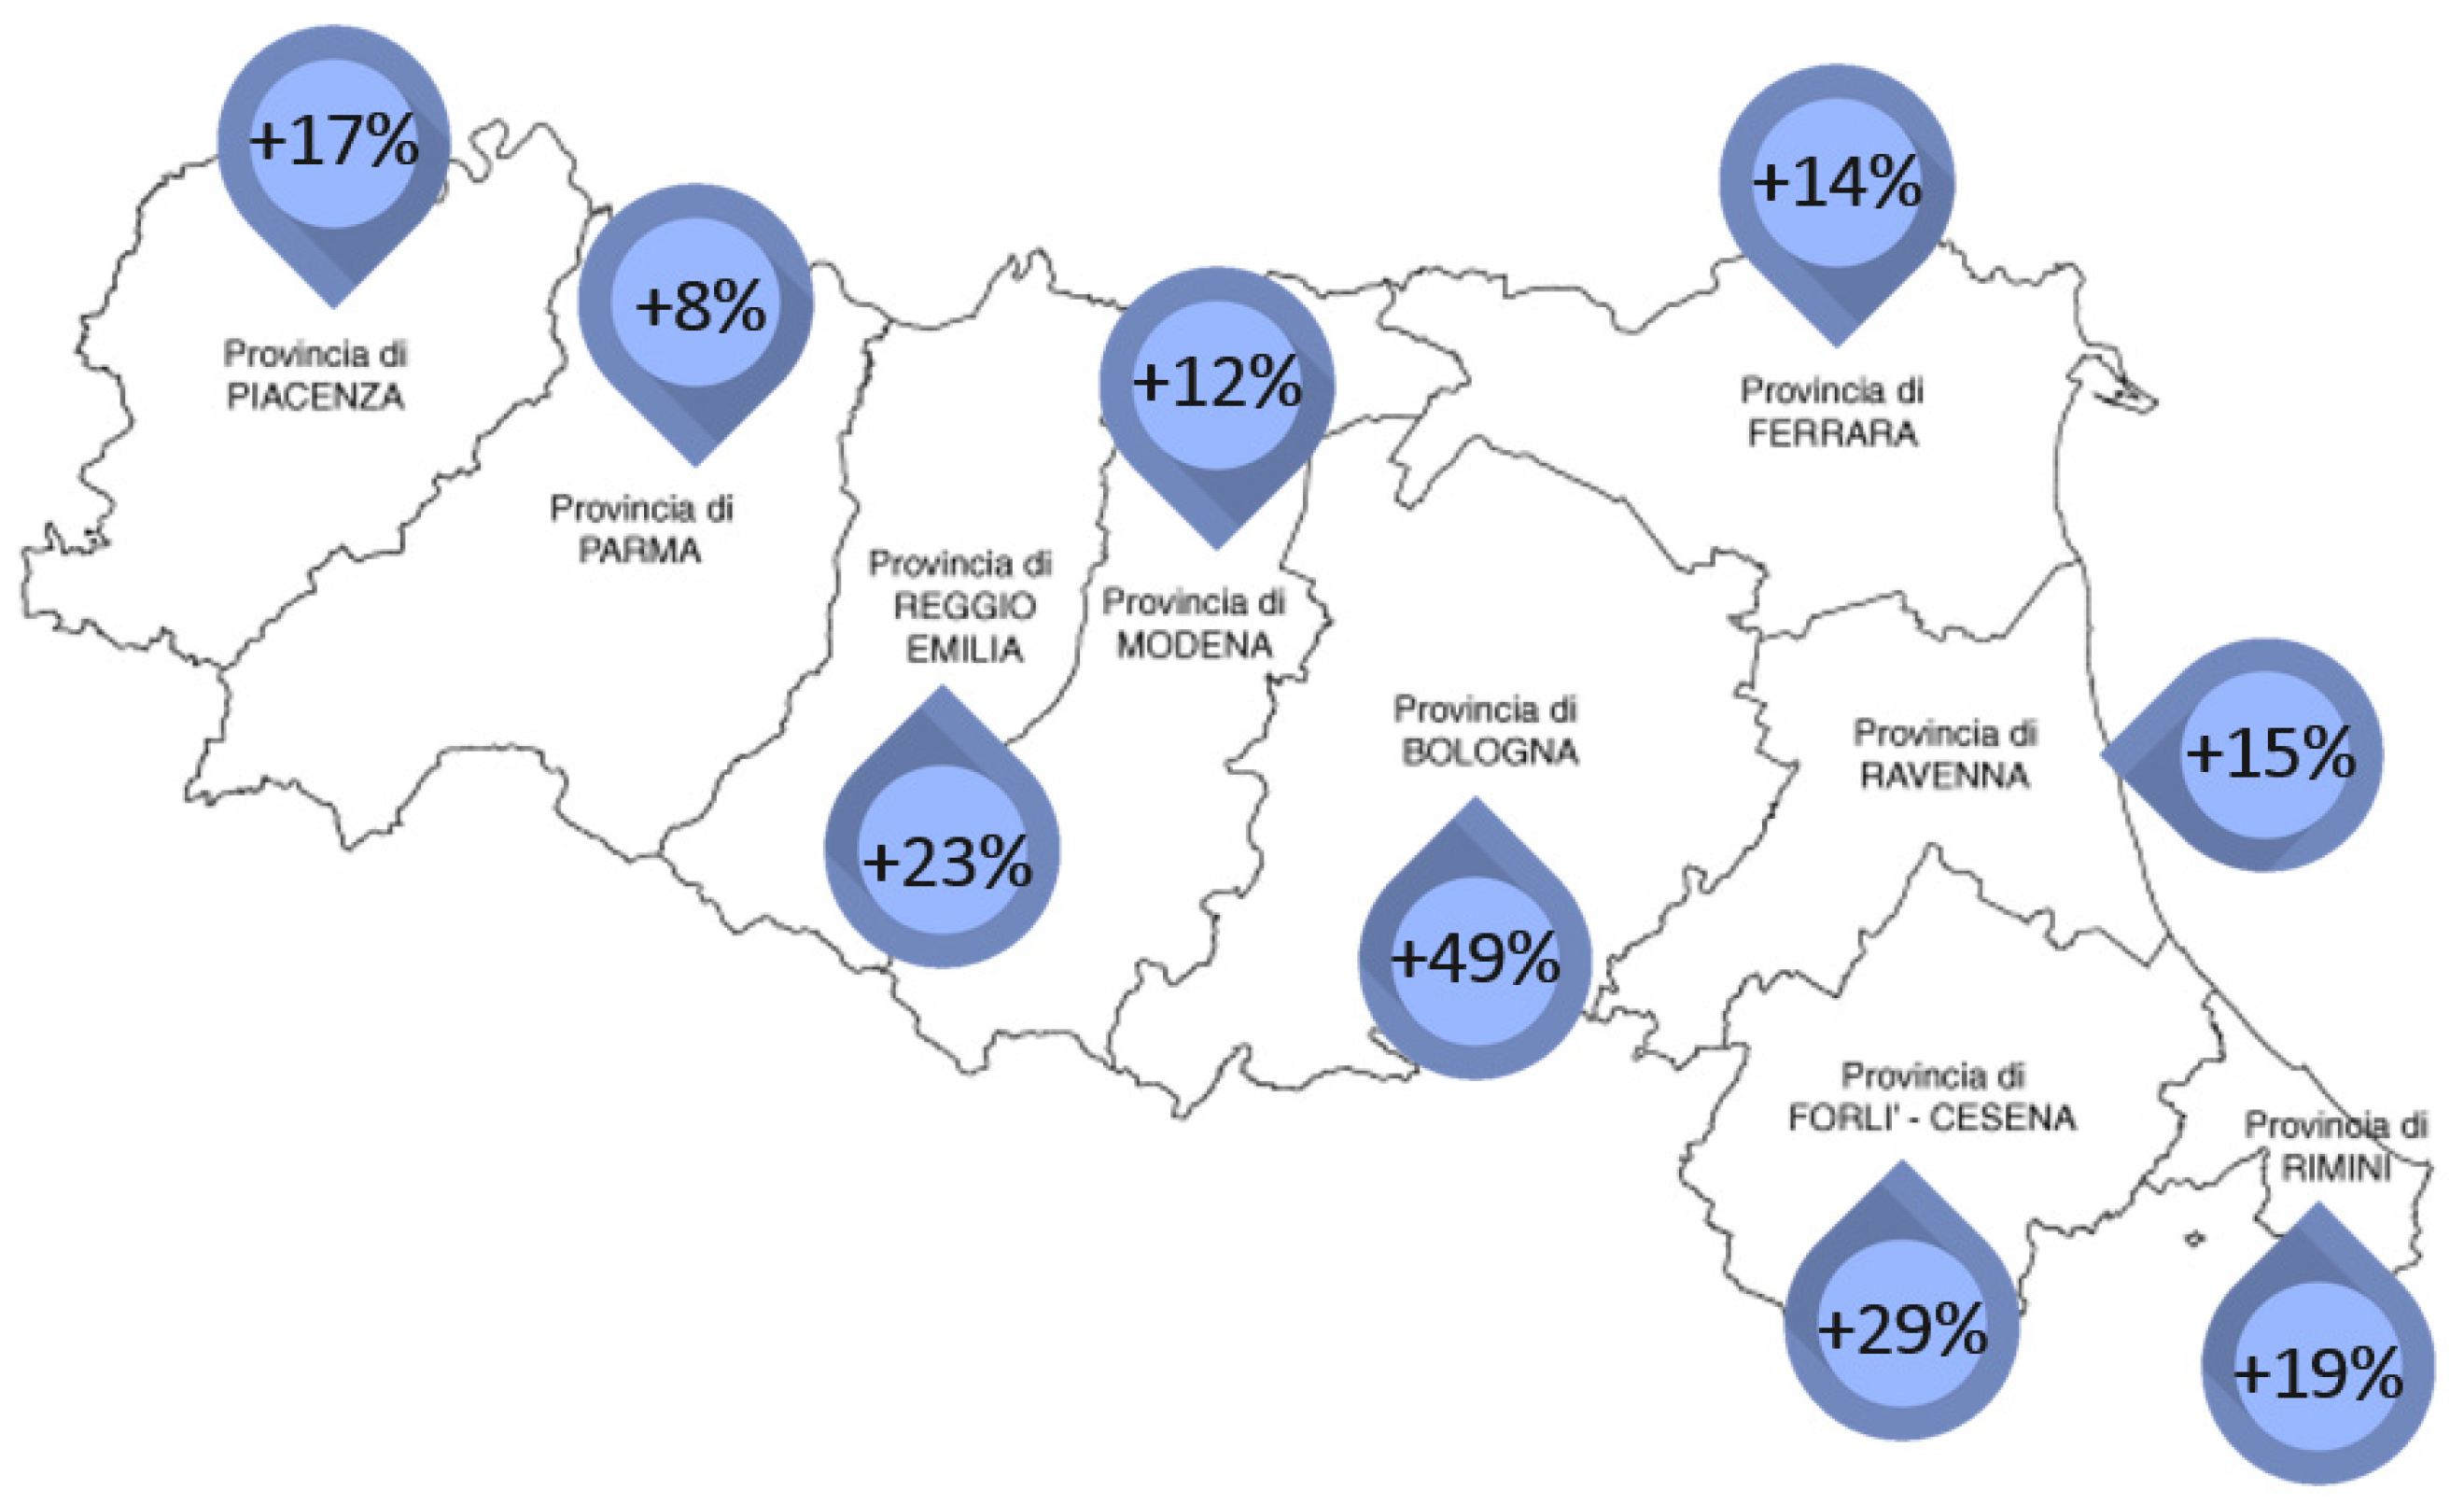
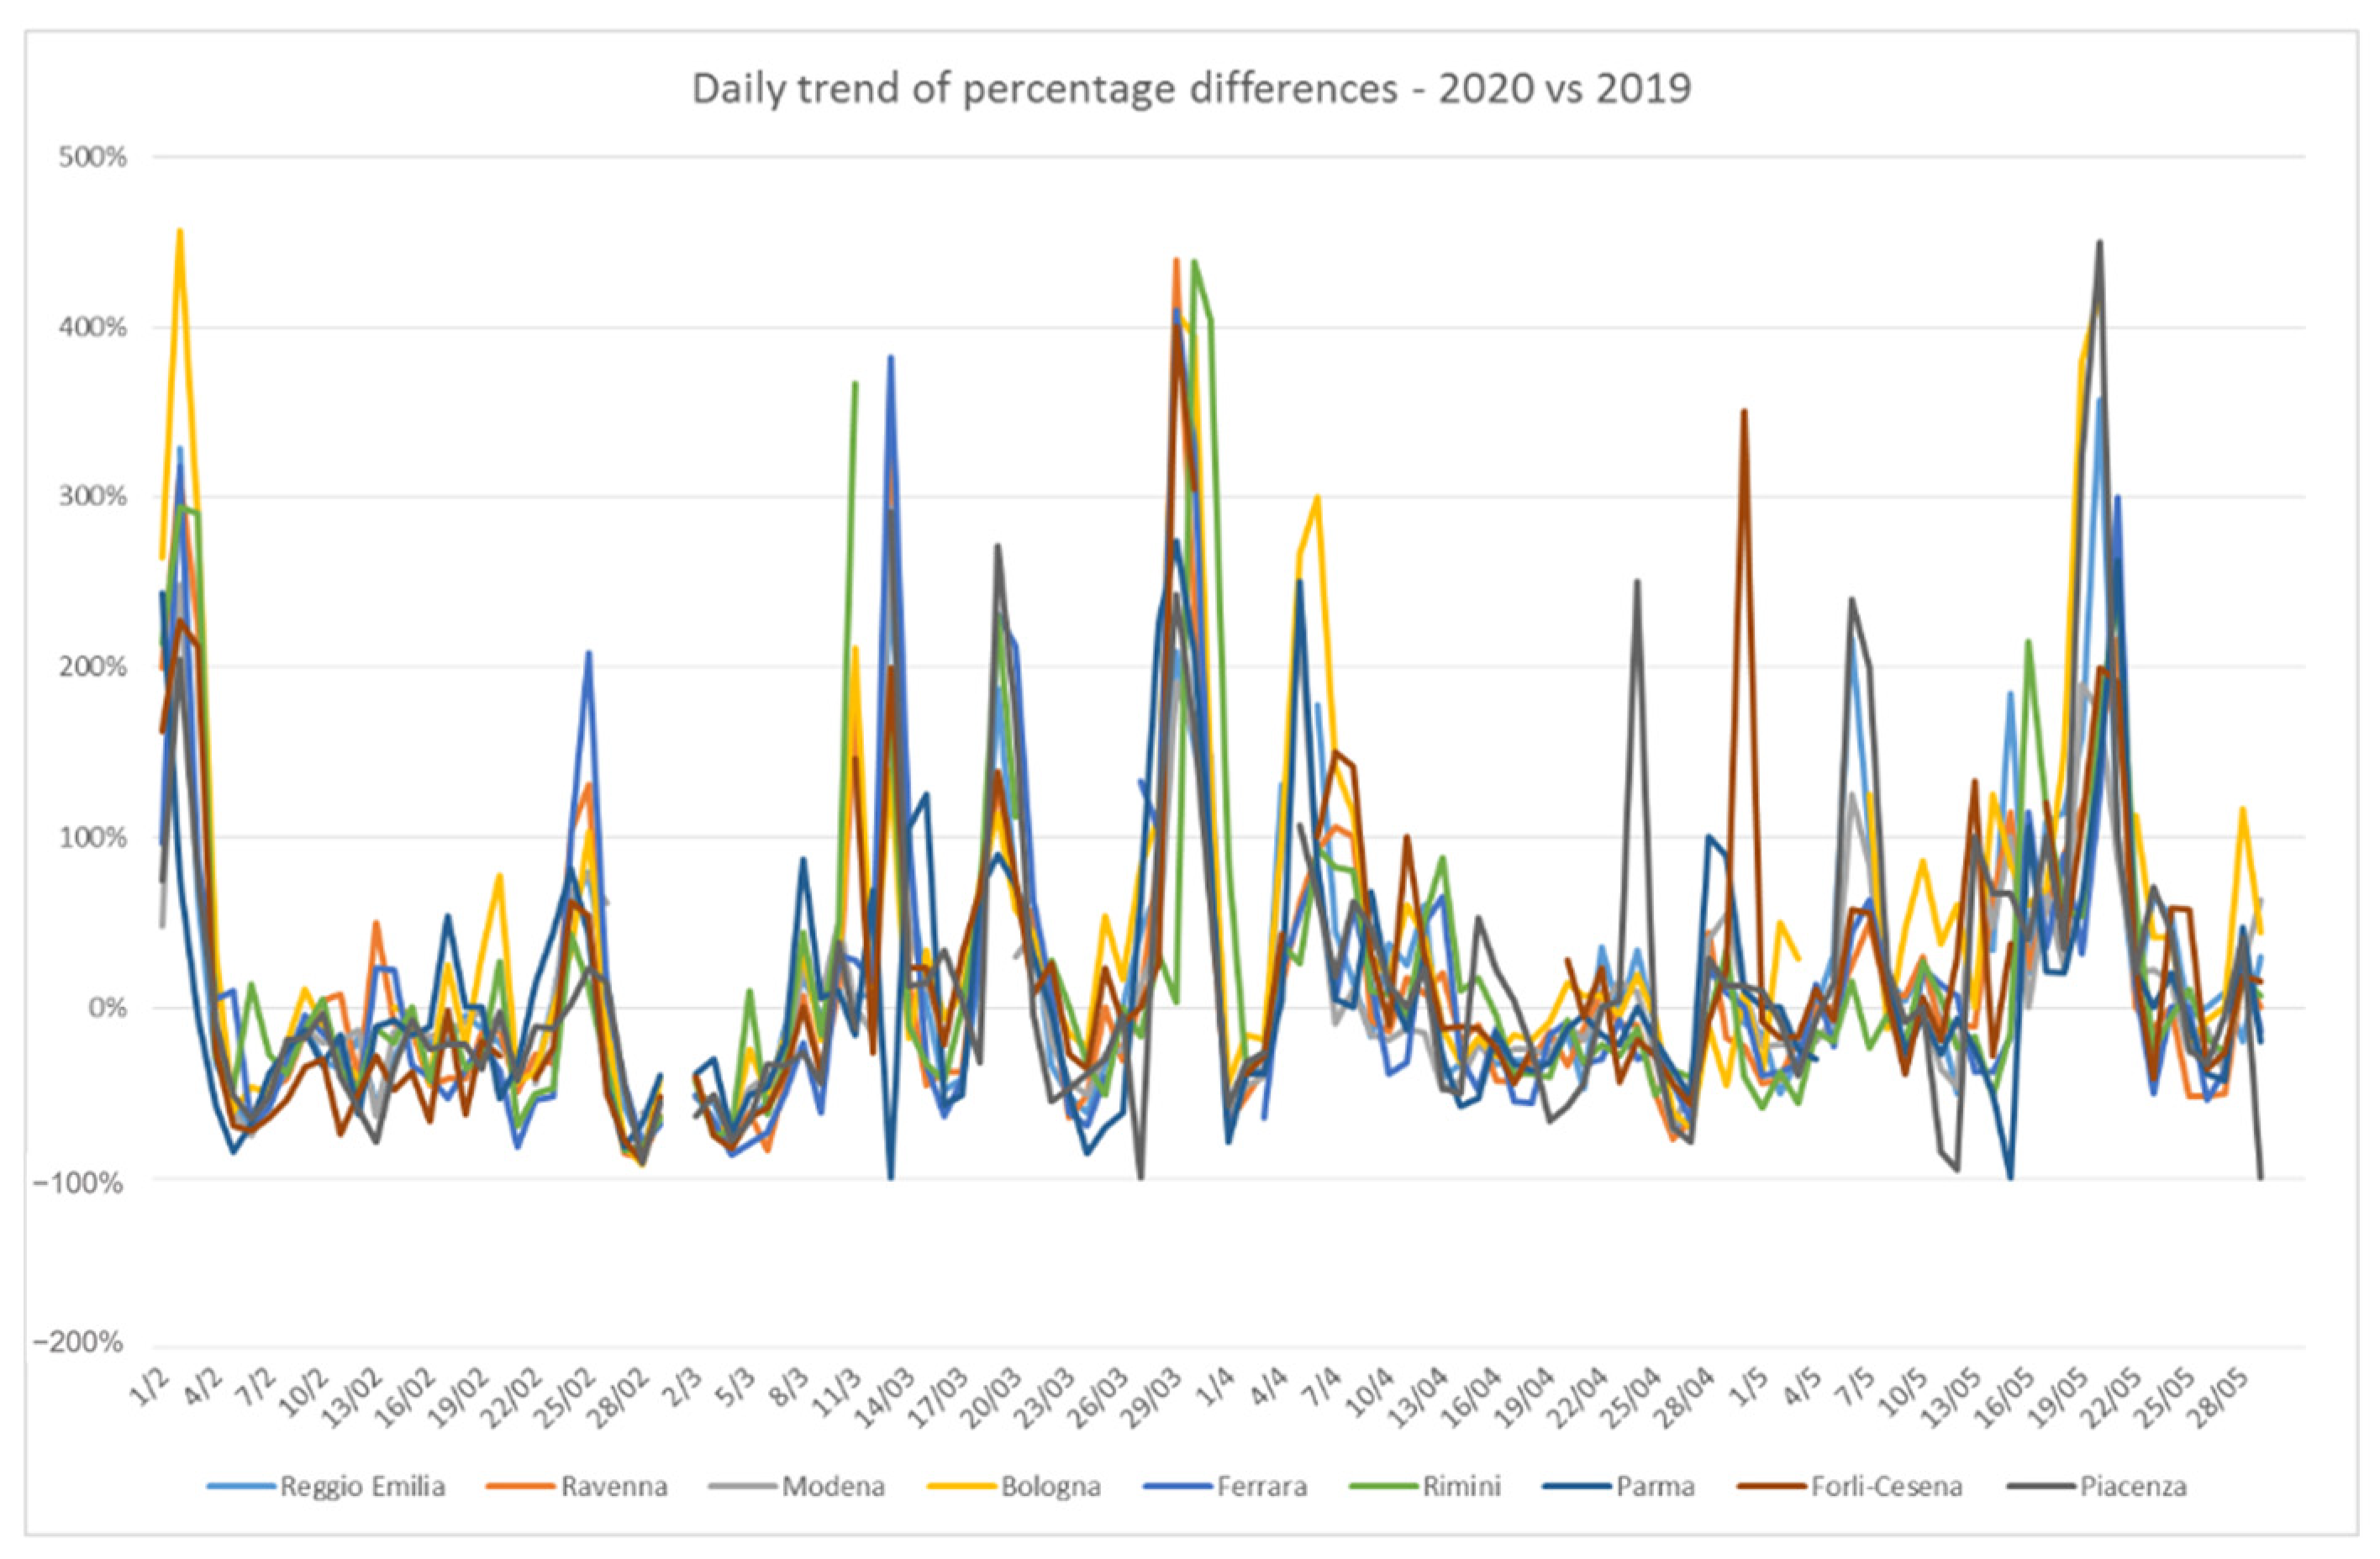
To investigate this uncertainty related to atmospheric particulate responses during the lockdown, additional verification has been conducted in this study. For each provincial area of the Emilia-Romagna region (a total of nine provinces) an AQMS classified as “urban traffic” has been selected and the percentage differences in PM10 concentrations have been analysed during the period 1 February—31 May 2019 and 2020. 
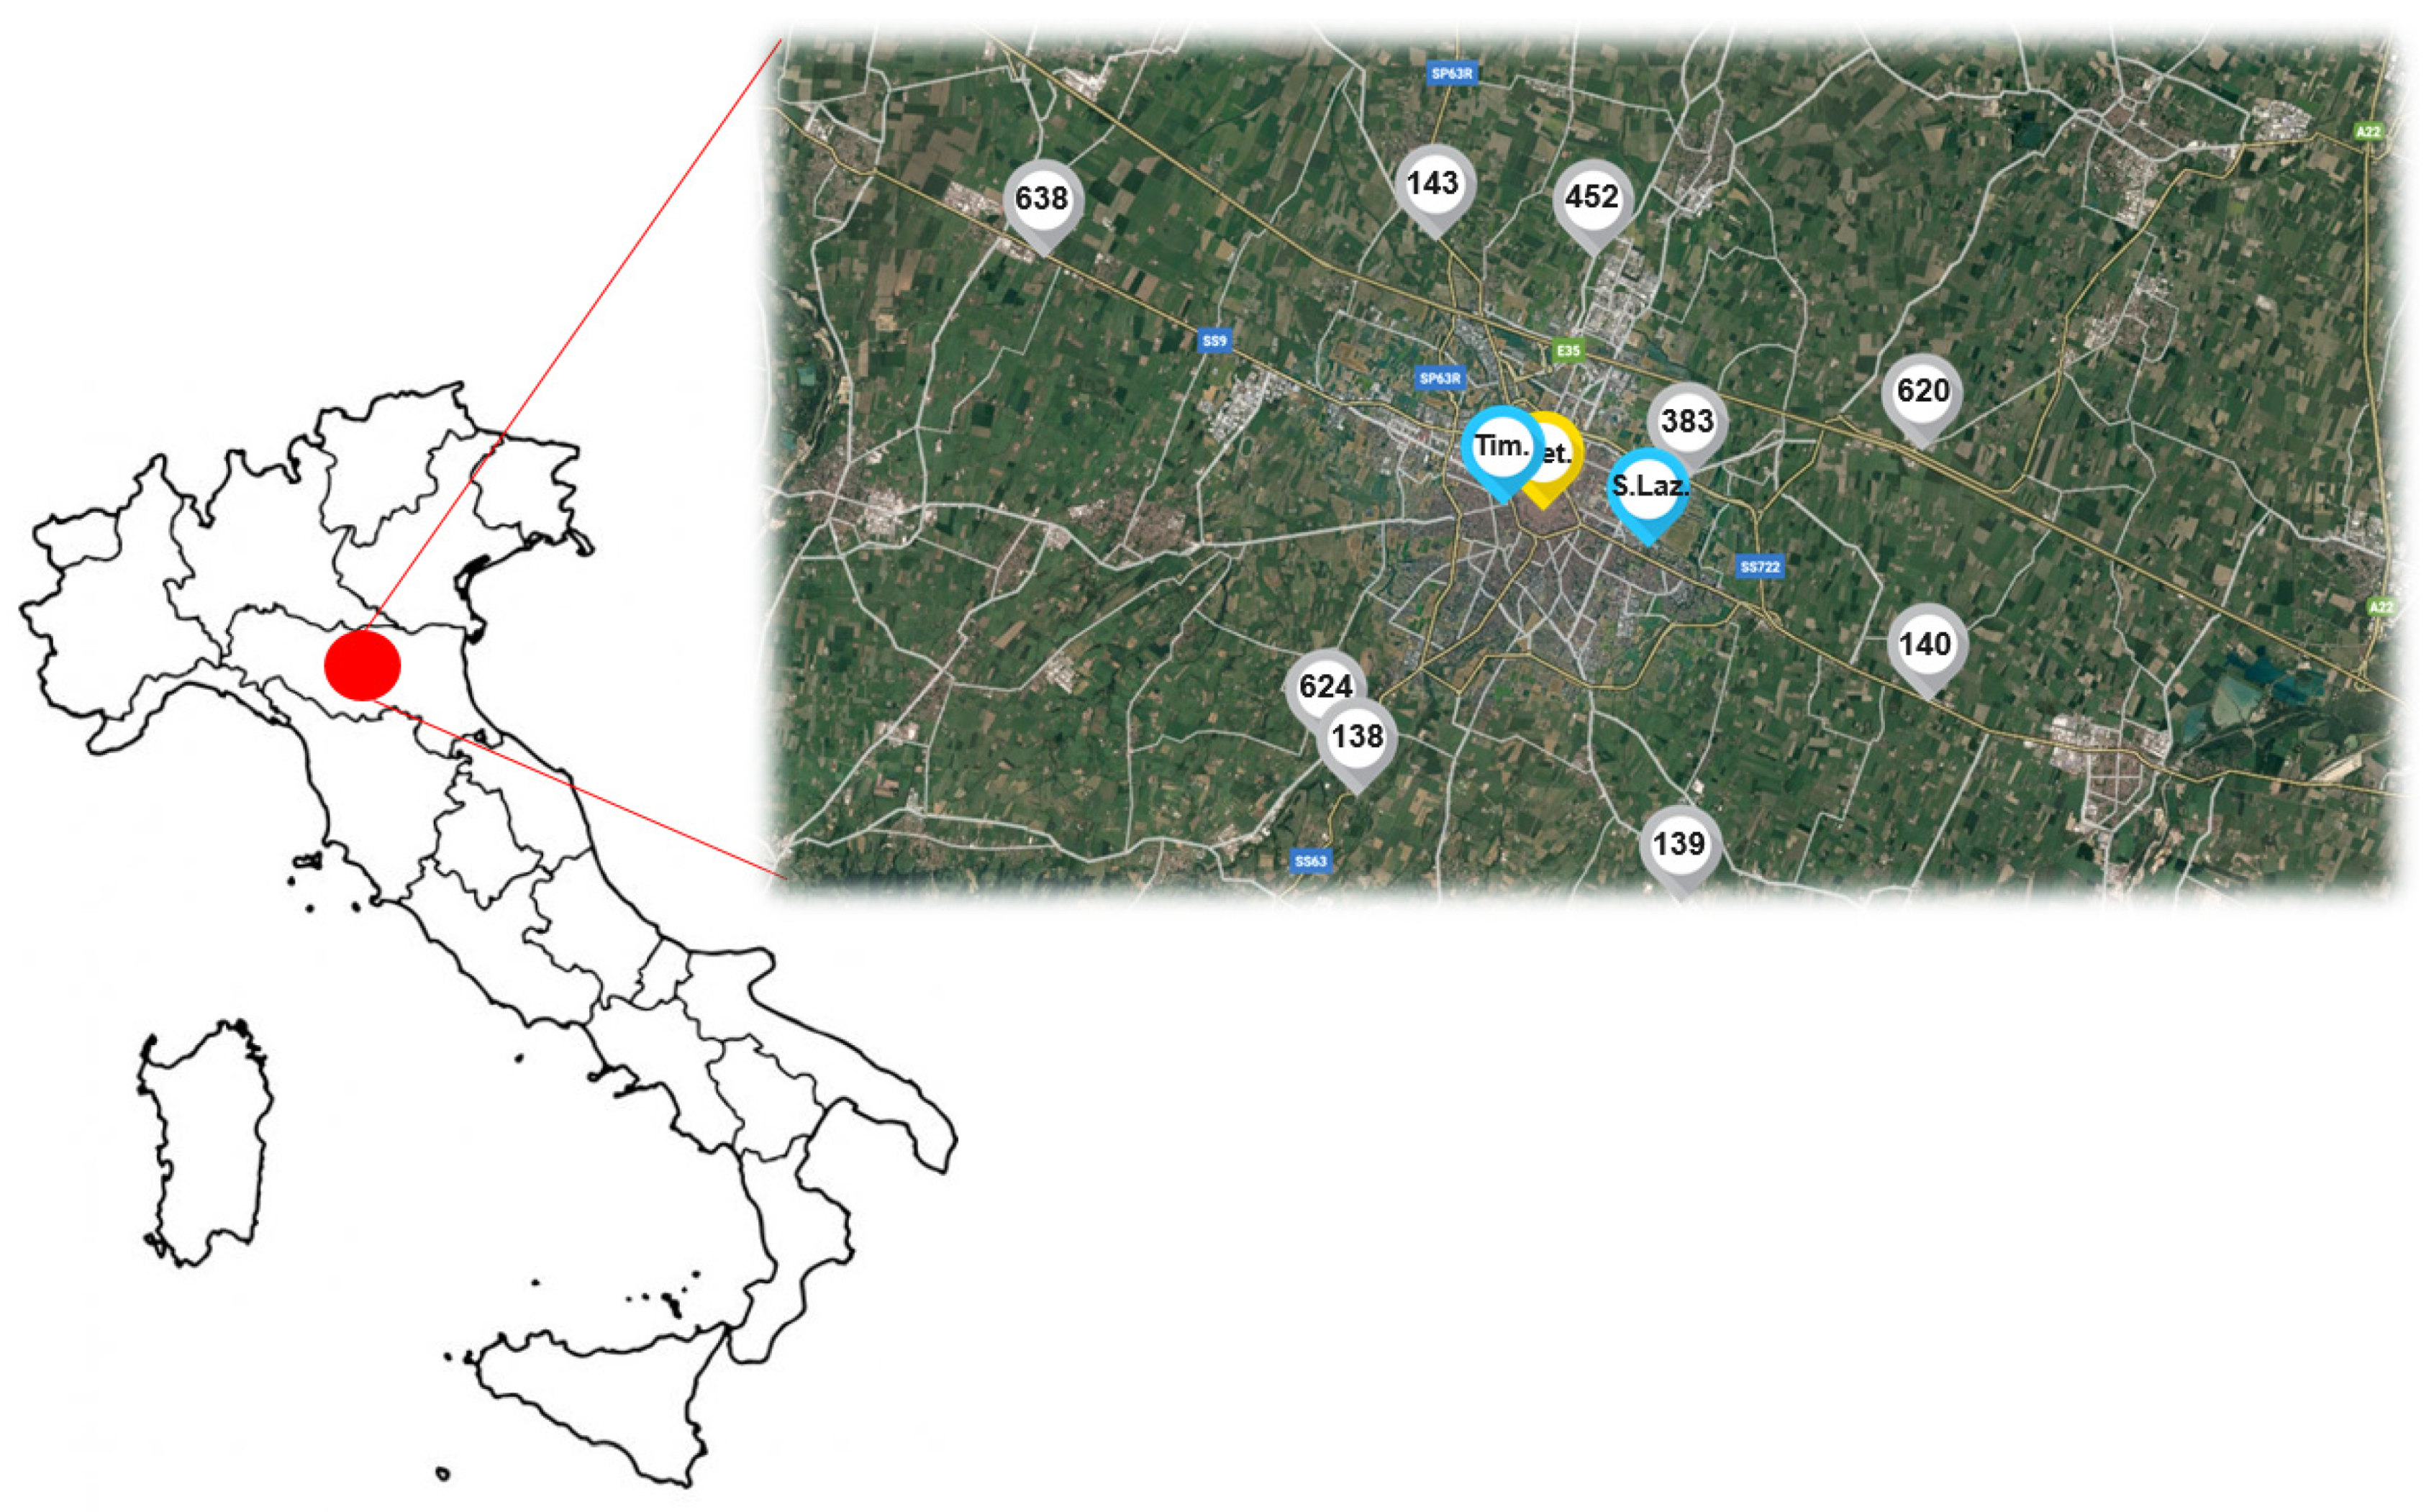
Table 10 shows the stations selected for each province, all in the urban area. Figure 8 shows the average percentage differences for the period. The data have a general and widespread trend of higher PM10 concentrations during the reference period 2020 compared to the same period of the previous year. All the AQMSs analysed have positive percentage differences between the two periods. The average values of the percentage differences vary between +8% for the urban area of Parma and +49% for the urban area of Bologna. Finally, Figure 9 shows the temporal trend of the percentage differences, reporting the value referring to the comparison of the daily average values of PM10. It is interesting to observe how the daily trends assume a similar trend among all the stations investigated.
Similar analyses are available for the main European cities thanks to the portal developed by the European Environment Agency [69].
A study, published in ARPAE’s journal, analysed different air quality scenarios through mathematical models (in particular, the study applied two chemical and transport models: Ninfa-ER and Farm-PI), reconstructing the scenario with and without lockdown using the same input data and applying the specific meteorological conditions for spring 2020. The study confirmed that, with similar conditions, the effect of the lockdown on PM10 concentrations in the Po valley would guarantee a median reduction of 15–30% [70].

3.4. Road Traffic and Air Quality Results

The graphs shown in Figure 10a–g report the average trend of daily vehicle flows (aggregated on a weekly scale) and the relative trend of concentrations of atmospheric pollutants (also reported as the average weekly value). The graphs refer only to the year 2020 and are intended to highlight common trends between the two variables analysed. In particular, for vehicular traffic, the trend of a single detection station among all those described in this study is reported. The “140” position has been chosen because it is characterized by the greatest number of vehicles in circulation. In the results, three specific conditions can be highlighted:
(1)
The reduction of circulating vehicular traffic determines a reduction of polluting concentrations. This is the situation that characterizes NO2 at both the “Timavo” and “San Lazzaro” stations and the CO.
(2)
The reduction in vehicular traffic does not correspond to a similar behaviour in pollution concentrations. This is the condition that characterizes the atmospheric particulate matter reported in the present study. In fact, in the face of the drastic reduction in the number of vehicles in circulation, there is no analogous reduction in concentrations, which seems to occur only during the month of May.
(3)
A reduction in traffic corresponds to an increase in polluting concentrations. This condition is characteristic of O3, which highlights a progressive increase in concentrations moving towards the hot season, but reporting a peak especially during the minimum values of vehicles in circulation. This condition is favoured by the progressive increase in the intensity and duration of the incident solar radiation, as well as by the reduced presence of primary pollutants that are precursors of the formation of O3 (e.g., NO).
Table 11 shows the correlations between the vehicular flows at each measurement point and the pollutant concentrations measured by the Reggio Emilia AQMS. Weekly average values have been applied. The correlation index obtained allows to highlight higher correlation values for NO2 in both AQMS, for CO and, even if it is a negative correlation, for O3. For these pollutants, the correlations are always higher than 0.59 and reach the value of 0.79. Particulate matter, on the other hand, is less related to traffic, especially for PM10.

3.5. Lessons Learned for Future Land Management Practices

Poor air quality is a global problem that affects particularly heavily populated urban areas with a high presence of vehicular traffic, as well as industrial areas [71]. Many policies and strategies are used globally to improve air quality and to reduce the health effects on the population due to exposure to high quantities of air pollutants. Among these, the control and reduction of traffic constitutes one of the most widespread practices and is realized through the updating of vehicle fleets in circulation with less impactful technologies and green fuels and through the solutions to modulate vehicle flows.
This aspect was deepened in the review prepared by [72], which analyses the traffic management effects on emissions due to different strategies adopted in urban areas. The strategies it analyses are classified into operating restrictions and pricing, lane management, speed management, traffic flow control and trip reduction strategies.
The lockdown offered the opportunity to study a unique scenario, drastically reducing the circulating traffic and, in fact, applying several of the strategies above in an extreme and contemporary way. In addition to the transport sector, industrial emissions have also significantly decreased, while the impact associated with domestic heating has increased due to the greater time spent by the population in their homes.
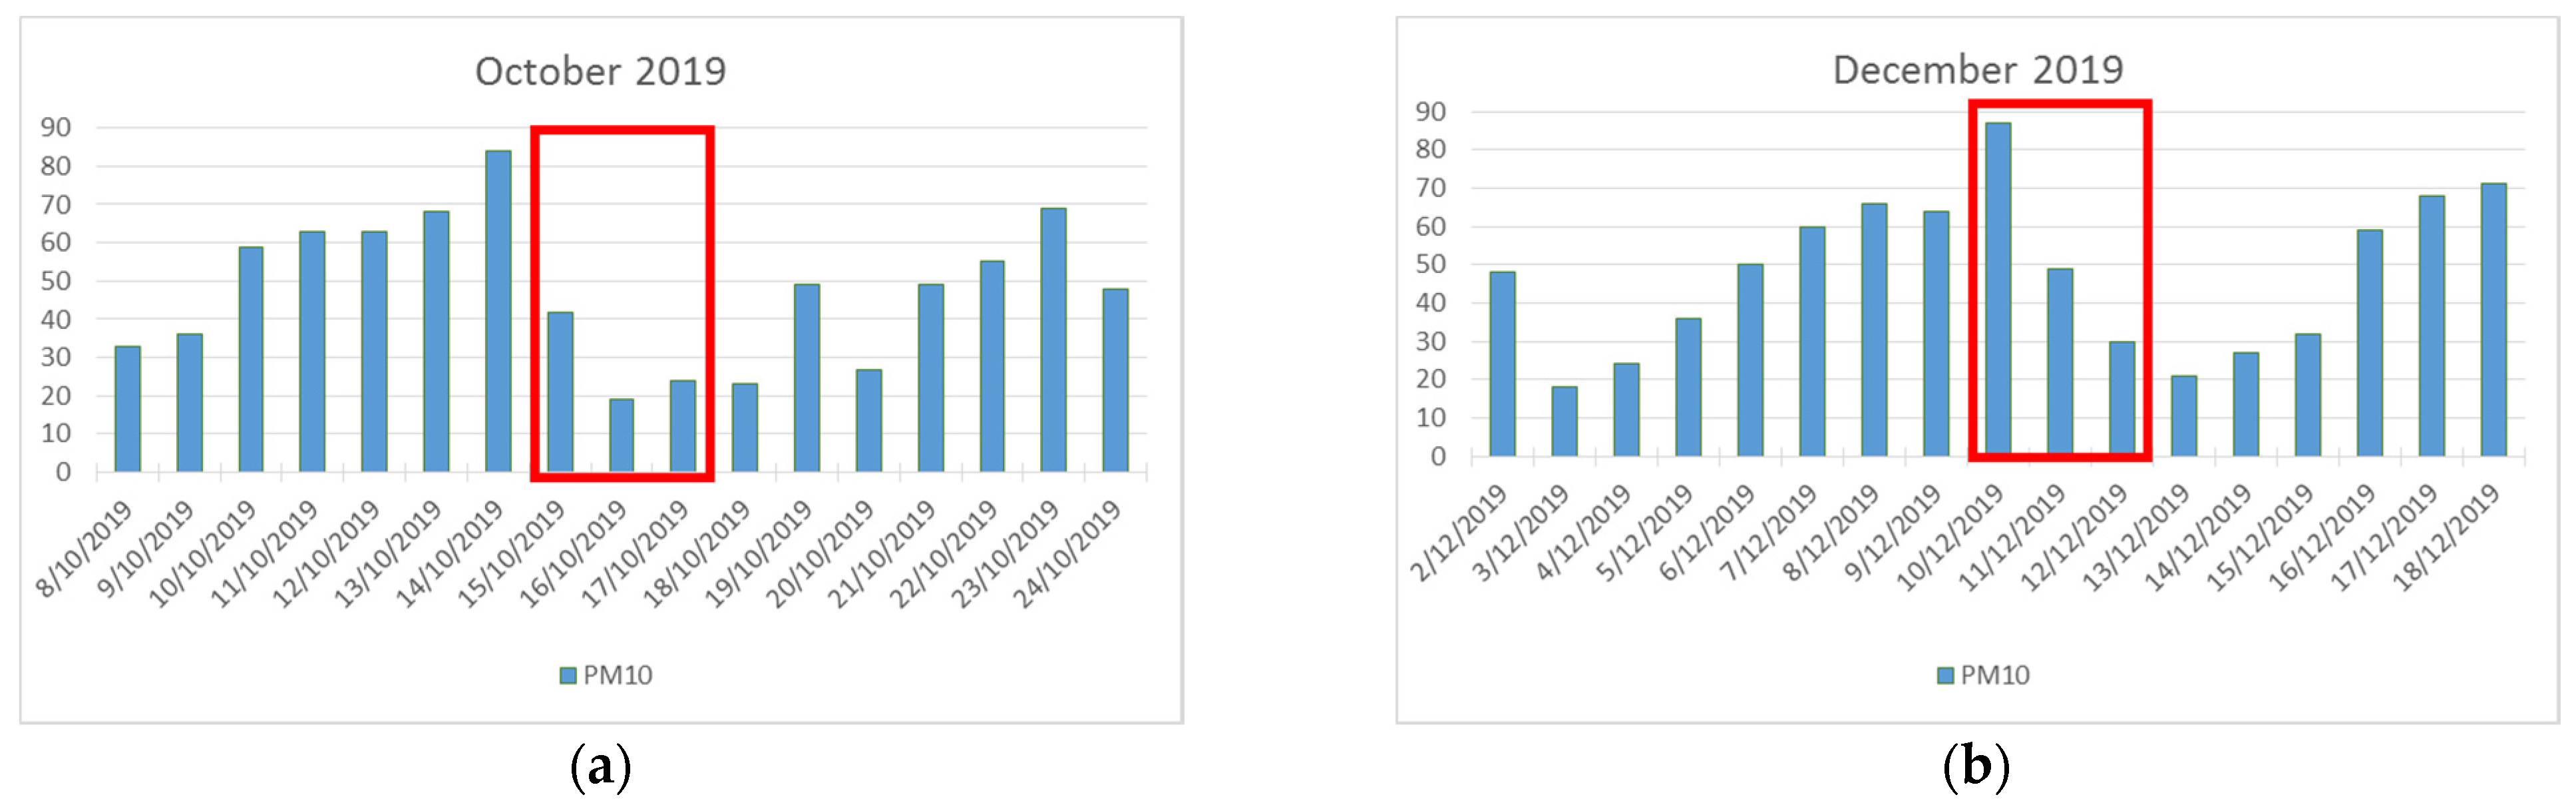
In Italy, a widespread practice to reduce pollution in urban areas is represented by the partial and total temporary blocking of the most impactful circulating vehicles, so as to allow circulation only for greener vehicles (e.g., mono and bifuel methane-petrol vehicles, LPG—petrol, electric and hybrid). In Emilia-Romagna, these measures are adopted annually during the period 1 October—31 March and, at the same time, also involve domestic heating in addition to vehicular traffic. If the pollutant concentrations (PM10 is used as a driver in choosing the activation of these emergency measures) exceed the legal limits for at least three consecutive days, the emergency measures are activated. This reactive approach helps to reduce concentrations of atmospheric pollutants within regulatory limits. Figure 11a,b show the results of the activation of emergency measures in the urban area of Reggio Emilia in two recent periods, immediately preceding the COVID-19 emergency: 15, 16, 17 October and 10, 11, 12 December. The red box indicates the period imposed by the local authority to apply the emergency measures. The results reported for the two periods analysed show an immediate benefit in the reduction of PM10 concentrations, which determines, in a few days, the end of the emergency measures. Concentrations, however, immediately tend to rise.
Therefore, in consideration of the effect observed by the restrictions imposed during the lockdown period and by observing the specific in-depth analyses presented to justify the contradictory result obtained for atmospheric PM, the lessons learned that can represent a contribution for future planning and management of the territory and air quality improvement are described as follows:
PM: Acting significantly on the reduction of circulating traffic and on the industrial sector (both responsible in Emilia-Romagna for emissions of about 37% of PM) may not be sufficient to reduce concentrations without simultaneous interventions in domestic heating and biomass combustion (which accounts for 51% of PM emissions). In addition, the strong dependence of PM on other factors that cannot be modified by man (meteorology and formation of secondary pollutants) makes this pollutant still difficult to manage. With these conditions, the reduction in overall traffic down to −82%, the reduction in industrial emissions and the increase in domestic heating have led to an increase in particulate matter of 27% and 31% (PM10 and PM2.5, respectively). By applying the same conditions to two alternative scenarios (with and without the lockdown effect), a reduction of PM of up to 30% has been estimated.
Intervening simultaneously in traffic and in domestic heating, on the other hand, determines an immediate benefit (albeit temporary for the duration of the restrictive actions), of up to 50%. This is the result observed during the activation of emergency measures.
NOx: The lockdown highlighted how direct action on traffic and industrial emissions (overall they contribute 78% of NOx regional emissions) has an immediate beneficial effect on the concentrations of this pollutant. The observed reduction was 32%. In this case, heating has a less significant effect (contributing to 8% of emissions).
CO: Has a behaviour similar to NOx, even if the lockdown has favoured a lower reduction (−22%) due to the higher incidence of domestic heating (41% of total emissions).
O3: As a secondary photochemical pollutant, the increase in temperatures and solar radiation, and a lower presence of NO in the atmosphere, determine a greater formation.

4. Conclusions

Vehicle traffic is a significant source of air pollutants and therefore affects the air quality of territories. The spread of COVID-19, countered by the choice of governments to implement measures restricting citizens’ mobility through the imposition of a lockdown period, has contributed to reducing the number of vehicles in circulation, promoting a general improvement in air quality.
This study focused on the evaluation of the data available for the city of Reggio Emilia (Italy) to provide an assessment of how and to what extent vehicle flows changed during the period February–May 2020 compared to the same period of the previous year, as well as to evaluate the relative change in the concentrations of some main air pollutants (NO2, CO, O3, PM10 and PM2.5). The results that have been reported and analysed allow the following main conclusions to be drawn:
(1)
The data analysed and distributed by Google showed a significant reduction in urban travel, with a 66% drop towards destinations classified as “retail and recreation” and 47% towards “workplaces”. These values are similar at national, regional and local level.
(2)
The vehicle flows analysed revealed a significant drop in vehicles in circulation during 2020, even reaching −82% during the lockdown period, compared with the same period in 2019. Also, compared to a longer period (2015–2019), in 2020 vehicle flows were always at least 43% lower.
(3)
NO2 is the pollutant that, during the investigation period, had a more significant decline in concentration values compared to the previous year. Overall, the decrease was 32% in correspondence with the AQMS classified as “traffic” and 41% at the “urban background” station. By limiting the valuation to the lockdown period, these values are even more significant: −41% and −52% for the traffic and urban background station, respectively. CO is the second pollutant to show decreasing concentrations (−22%).
(4)
Atmospheric particulate matter (PM10 and PM2.5) shows a contrary behaviour: the concentrations in 2020 increase compared to the 2019 period. PM10 has a 27% increase at the traffic station and a 23% increase at the urban background station, while PM2.5 has a growth of 31% at the urban background station. If we consider only the lockdown period, these values increase further. By expanding the analysis to other provinces of the Emilia-Romagna region, this situation appears to be common to the entire territory, with greater percentage differences in the urban area of Bologna and lower ones in the city of Parma.
(5)
Also, for O3 there are growing values during 2020. The urban background station recorded an increase of 13%.
(6)
NO2 and CO seem to respond suddenly to the reduction of circulating traffic. The reduction of moving vehicles corresponds to a reduction in concentrations. This was not observed in the case of particulates. Finally, O3 has a completely opposite behaviour, responding with an increase in concentrations to the reduction of circulating traffic.
Obviously, the improvement or worsening of polluting concentrations cannot be attributed only to the variation in circulating traffic, which constitutes one of the many factors that contribute to determining air quality. These results related to the collapse of public and private mobility allow to trace some important lessons that may be relevant for planning and managing mobility even in non-emergency conditions. First of all, a reduction in the flow of vehicles allows an immediate benefit from the point of view of air quality due to a lower presence of some pollutants (NO2 in particular), but does not guarantee the same rapid benefit also for other pollutants. This is a significant aspect that must be considered both in the planning phase of the interventions and on the methods of analysis and interpretation of the air quality data. Furthermore, policies aimed at reducing private mobility are necessary, also by considerably incentivising public transport and/or alternative and sustainable forms of mobility. To avoid congestion in the level of private mobility, a strong strengthening of the public sector, shared mobility and all related services (e.g., the digitization of information and procedures for their use) will be needed, including a strong action on citizens to change their propensities and skills in using alternative forms of mobility.
In this study, the representative data of some meteorological variables measured within the urban area of Reggio Emilia have been reported. Certainly, a deepening of the relationship between meteorological conditions and polluting concentrations may suggest further indications that may justify the percentage differences observed in 2020. In particular, rainfall, winds, temperature and solar radiation are certainly factors that significantly influence the development or dispersion of these pollutants.

Author Contributions

Conceptualization, S.M.; methodology, S.M. and F.L.; validation, R.G.; investigation, S.M. and F.L.; data curation, S.M., F.L. and R.G.; writing—original draft preparation, S.M.; writing—review and editing, F.L. and R.G.; supervision, R.G. All authors have read and agreed to the published version of the manuscript.

Funding

This research received no external funding.

Institutional Review Board Statement

Not applicable.

Informed Consent Statement

Not applicable.

Conflicts of Interest

The authors declare no conflict of interest.

References

  1. Sun, L.; Song, F.; Shi, N.; Liu, F.; Li, S.; Li, P.; Zhang, W.; Jiang, X.; Zhang, Y.; Chen, X.; et al. Combination of four clinical indicators predicts the severe/critical symptom of patients infected COVID-19. J. Clin. Virol. 2020, 128, 104431. [Google Scholar] [CrossRef]
  2. Khan, S.; Ali, A.; Shi, H.; Siddique, R.; Nabi, G.; Hu, J.; Wang, T.; Dong, M.; Zaman, W.; Han, G.; et al. COVID-19: Clinical aspects and therapeutics responses. Saudi Pharm. J. 2020, 28, 1004–1008. [Google Scholar] [CrossRef]
  3. Qiu, H.-J.; Yuan, L.-X.; Wu, Q.-W.; Zhou, Y.-Q.; Zheng, R.; Huang, X.-K.; Yang, Q. Using the internet search data to investigate symptom characteristics of COVID-19: A big data study. World J. Otorhinolaryngol. Head Neck Surg. 2020, 1–9. [Google Scholar] [CrossRef]
  4. Wu, J.T.; Leung, K.; Leung, G.M. Nowcasting and forecasting the potential domestic and international spread of the 2019-nCoV outbreak originating in Wuhan, China: A modelling study. Lancet 2020, 395, 689–697. [Google Scholar] [CrossRef] [Green Version]
  5. Kang, D.; Choi, H.; Kim, J.-H.; Choi, J. Spatial epidemic dynamics of the COVID-19 outbreak in China. Int. J. Infect. Dis. 2020, 94, 96–102. [Google Scholar] [CrossRef]
  6. Lau, H.; Khosrawipour, V.; Kocbach, P.; Mikolajczyk, A.; Ichii, H.; Zacharski, M.; Bania, J.; Khosrawipour, T. The association between international and domestic air traffic and the coronavirus (COVID-19) outbreak. J. Microbiol. Immunol. Infect. 2020, 53, 467–472. [Google Scholar] [CrossRef]
  7. Zhang, Y.; Zhang, A.; Wang, J. Exploring the roles of high-speed train, air and coach services in the spread of COVID-19 in China. Transp. Policy 2020, 94, 34–42. [Google Scholar] [CrossRef]
  8. World Health Organization. WHO Director-General’s Opening Remarks at the Media Briefing on COVID-19—11 March 2020. Available online: https://www.who.int/director-general/speeches/detail/who-director-general-s-opening-remarks-at-the-media-briefing-on-covid-19---11-march-2020 (accessed on 23 December 2020).
  9. World Health Organization. WHO Coronavirus Disease (COVID-19) Dashboard. 2020. Available online: https://covid19.who.int/ (accessed on 23 December 2020).
  10. Coccia, M. Factors determining the diffusion of COVID-19 and suggested strategy to prevent future accelerated viral infectivity similar to COVID. Sci. Total Environ. 2020, 729, 138474. [Google Scholar] [CrossRef]
  11. Lotfi, M.; Hamblin, M.R.; Rezaei, N. COVID-19: Transmission, prevention, and potential therapeutic opportunities. Clin. Chim. Acta 2020, 508, 254–266. [Google Scholar] [CrossRef]
  12. Lal, P.; Bhattacharya, B.K.; Kumar, S.; Kumari, S.; Saikia, P.; Dayanandan, A.; Adhikari, D.; Khan, M. The dark cloud with a silver lining: Assessing the impact of the SARS COVID-19 pandemic on the global environment. Sci. Total Environ. 2020, 732, 139297. [Google Scholar] [CrossRef] [PubMed]
  13. Shereen, M.A.; Khan, S.; Kazmi, A.; Bashir, N.; Siddique, R. COVID-19 infection: Origin, transmission, and characteristics of human coronaviruses. J. Adv. Res. 2020, 24, 91–98. [Google Scholar] [CrossRef] [PubMed]
  14. Wu, D.; Wu, T.; Liu, Q.; Yang, Z. The SARS-CoV-2 outbreak: What we know. Int. J. Infect. Dis. 2020, 94, 44–48. [Google Scholar] [CrossRef] [PubMed]
  15. Bontempi, N. First data analysis about possible COVID-19 virus airborne diffusion due to air particulate matter (PM): The case of Lombardy (Italy). Environ. Res. 2020, 186, 109639. [Google Scholar] [CrossRef]
  16. Bontempi, E.; Vergalli, S.; Squazzoni, F. Understanding COVID-19 diffusion requires an interdisciplinary, multi-dimensional approach. Environ. Res. 2020, 188, 109814. [Google Scholar] [CrossRef] [PubMed]
  17. Ko, F.W.S.; Tam, W.; Wong, T.W.; Chan, D.P.S.; Tung, A.H.; Lai, C.K.W.; Hui, D. Temporal relationship between air pollutants and hospital admissions for chronic obstructive pulmonary disease in Hong Kong. Thorax 2007, 62, 780–785. [Google Scholar] [CrossRef] [PubMed] [Green Version]
  18. Medina-Ramon, M.; Zanobetti, A.; Schwartz, J. The Effect of Ozone and PM10 on Hospital Admissions for Pneumonia and Chronic Obstructive Pulmonary Disease: A National Multicity Study. Am. J. Epidemiol. 2006, 163, 579–588. [Google Scholar] [CrossRef] [PubMed]
  19. Kappos, A.D.; Bruckmann, P.; Eikmann, T.; Englert, N.; Heinrich, U.; Hˆppe, P. Report the German view Health effects of particles in ambient air. Int. J. Hyg. Environ. Health 2004, 207, 399–407. [Google Scholar] [CrossRef]
  20. Zhu, F.; Ding, R.; Lei, R.; Cheng, H.; Liu, J.; Shen, C.; Zhang, C.; Xu, Y.; Xiao, C.; Li, X.; et al. The short-term effects of air pollution on respiratory diseases and lung cancer mortality in Hefei: A time-series analysis. Respir. Med. 2019, 146, 57–65. [Google Scholar] [CrossRef]
  21. Kim, K.-H.; Kabir, E.; Kabir, S. A review on the human health impact of airborne particulate matter. Environ. Int. 2015, 74, 136–143. [Google Scholar] [CrossRef]
  22. Long, N. From social distancing to social containment: Reimagining sociality for the coronavirus pandemic. Med. Anthropol. Theory 2020, 7, 247–260. [Google Scholar] [CrossRef]
  23. The impacts of the Covid-19 crisis on global energy demand and CO2 emissions. In Global Energy Review 2020; International Energy Agency: Paris, France, 2020.
  24. Eurocontrol COVID-19 Impact on the European Air Traffic Network. 2020. Available online: https://www.eurocontrol.int/publication/eurocontrol-comprehensive-assessment-covid-19s-impact-european-air-traffic (accessed on 23 December 2020).
  25. International Civil Aviation Organization Effects of Novel Coronavirus (COVID-19) on Civil Aviation: Economic Impact Analysis. 2020. Available online: https://www.icao.int/sustainability/Documents/Covid-19/ICAO_coronavirus_Econ_Impact.pdf (accessed on 23 December 2020).
  26. Baldasano, J.M. COVID-19 lockdown effects on air quality by NO2 in the cities of Barcelona and Madrid (Spain). Sci. Total Environ. 2020, 741, 140353. [Google Scholar] [CrossRef] [PubMed]
  27. Bucsky, P. Modal share changes due to COVID-19: The case of Budapest. Transp. Res. Interdiscip. Perspect. 2020, 8, 100141. [Google Scholar] [CrossRef]
  28. Aloi, A.; Alonso, B.; Benavente, J.; Cordera, R.; Echániz, E.; González, F.; Ladisa, C.; Lezama-Romanelli, R.; López-Parra, Á.; Mazzei, V.; et al. Effects of the COVID-19 Lockdown on Urban Mobility: Empirical Evidence from the City of Santander (Spain). Sustainability 2020, 12, 3870. [Google Scholar] [CrossRef]
  29. Loske, D. The impact of COVID-19 on transport volume and freight capacity dynamics: An empirical analysis in German food retail logistics. Transp. Res. Interdiscip. Perspect. 2020, 6, 100165. [Google Scholar] [CrossRef]
  30. COVID-19 Community Mobility Report, Greece, 2 May 2020. Available online: https://www.gstatic.com/covid19/mobility/2020-05-02_GR_Mobility_Report_en.pdf (accessed on 23 December 2020).
  31. De Haas, M.; Faber, R.; Hamersma, M. How COVID-19 and the Dutch ‘intelligent lockdown’ change activities, work and travel behaviour: Evidence from longitudinal data in the Netherlands. Transp. Res. Interdiscip. Perspect. 2020, 6, 100150. [Google Scholar] [CrossRef]
  32. Hadjidemetriou, G.M.; Sasidharan, M.; Kouyialis, G.; Parlikad, A.K. The impact of government measures and human mobility trend on COVID-19 related deaths in the UK. Transp. Res. Interdiscip. Perspect. 2020, 6, 100167. [Google Scholar] [CrossRef]
  33. Wen, Y.; Zhang, S.; Zhang, J.; Bao, S.; Wu, X.; Yang, D.; Wu, Y. Mapping dynamic road emissions for a megacity by using open-access traffic congestion index data. Appl. Energy 2020, 260, 260. [Google Scholar] [CrossRef]
  34. Mellios, G.; Van Aalst, R.; Samaras, Z. Validation of road traffic urban emission inventories by means of concentration data measured at air quality monitoring stations in Europe. Atmos. Environ. 2006, 40, 7362–7377. [Google Scholar] [CrossRef]
  35. Pant, P.; Harrison, R.M. Estimation of the contribution of road traffic emissions to particulate matter concentrations from field measurements: A review. Atmos. Environ. 2013, 77, 78–97. [Google Scholar] [CrossRef]
  36. Nagpure, A.S.; Sharma, K.; Gurjar, B.R. Traffic induced emission estimates and trends (2000–2005) in megacity Delhi. Urban Clim. 2013, 4, 61–73. [Google Scholar] [CrossRef]
  37. Tezel-Oguz, M.N.; Sari, D.; Ozkurt, N.; Keskin, S.S. Application of reduction scenarios on traffic-related NOx emissions in Trabzon, Turkey. Atmos. Pollut. Res. 2020, 11, 2379–2389. [Google Scholar] [CrossRef]
  38. Jiang, P.; Chen, X.; Li, Q.; Mo, H.; Li, L. High-resolution emission inventory of gaseous and particulate pollutants in Shandong Province, eastern China. J. Clean. Prod. 2020, 259, 120806. [Google Scholar] [CrossRef]
  39. Requia, W.J.; Koutrakis, P.; Roig, H.L. Spatial distribution of vehicle emission inventories in the Federal District, Brazil. Atmos. Environ. 2015, 112, 32–39. [Google Scholar] [CrossRef]
  40. Pachón, J.E.; Galvis, B.; Lombana, O.; Carmona, L.G.; Fajardo, S.; Rincón, A.; Meneses, S.; Chaparro, R.; Nedbor-Gross, R.; Henderson, B.H. Development and Evaluation of a Comprehensive Atmospheric Emission Inventory for Air Quality Modeling in the Megacity of Bogotá. Atmosphere 2018, 9, 49. [Google Scholar] [CrossRef] [Green Version]
  41. Ramacher, M.O.P.; Matthias, V.; Aulinger, A.; Quante, M.; Bieser, J.; Karl, M. Contributions of traffic and shipping emissions to city-scale NOx and PM2.5 exposure in Hamburg. Atmos. Environ. 2020, 237, 117674. [Google Scholar] [CrossRef]
  42. European Environment Agency National emissions reported to the Convention on Long-range Transboundary Air Pollution (LRTAP Convention). 2020. Available online: https://www.eea.europa.eu/data-and-maps/data/national-emissions-reported-to-the-convention-on-long-range-transboundary-air-pollution-lrtap-convention-14 (accessed on 23 December 2020).
  43. Regione Emilia Romagna Aggiornamento Dell’inventario Regionale delle Emissioni in Atmosfera Dell’Emilia-Romagna Relativo All’anno 2013. 2017. Available online: https://www.arpae.it/cms3/documenti/aria/rapp_fin_inv_emi_2013.pdf (accessed on 23 December 2020).
  44. Righi, S.; Farina, F.; Marinello, S.; Andretta, M.; Lucialli, P.; Pollini, E. Development and evaluation of emission disaggregation models for the spatial distribution of non-industrial combustion atmospheric pollutants. Atmos. Environ. 2013, 79, 85–92. [Google Scholar] [CrossRef]
  45. Marinello, S.; Lolli, F.; Gamberini, R. Roadway tunnels: A critical review of air pollutant concentrations and vehicular emissions. Transp. Res. Part D Transp. Environ. 2020, 86, 102478. [Google Scholar] [CrossRef]
  46. Harantová, V.; Hájnik, A.; Kalašová, A. Comparison of the Flow Rate and Speed of Vehicles on a Representative Road Section before and after the Implementation of Measures in Connection with COVID-19. Sustainability 2020, 12, 7216. [Google Scholar] [CrossRef]
  47. Budd, L.; Ison, S. Responsible Transport: A post-COVID agenda for transport policy and practice. Transp. Res. Interdiscip. Perspect. 2020, 6, 100151. [Google Scholar] [CrossRef]
  48. Katrakazas, C.; Michelaraki, E.; Sekadakis, M.; Yannis, G. A descriptive analysis of the effect of the COVID-19 pandemic on driving behavior and road safety. Transp. Res. Interdiscip. Perspect. 2020, 7, 100186. [Google Scholar] [CrossRef]
  49. Unindustria Reggio Emilia Reggio Emilia Produce—il Contributo delle Imprese Alla Comunità. 2017. Available online: http://www.unindustriareggioemilia.it/tower-file-storage/aire/13401/attachment/reggio-emilia-produce-il-contributo-delle-imprese.pdf (accessed on 23 December 2020).
  50. AUSL della Romagna. COVID-19 Resoconto Giornaliero. 2020. Available online: https://www.auslromagna.it/covid-19-aggiornamenti (accessed on 23 December 2020).
  51. Istituto Superiore di Sanità Epidemia COVID-19—Aggiornamento Nazionale. 2020. Available online: https://www.epicentro.iss.it/coronavirus/aggiornamenti (accessed on 23 December 2020).
  52. European Parliament. Directive 2008/50/EC of the European Parliament and of the Council of 21 May 2008 on Ambient Air Quality and Cleaner Air for Europe 2008. Available online: https://eur-lex.europa.eu/legal-content/en/ALL/?uri=CELEX%3A32008L0050 (accessed on 23 December 2020).
  53. Google Community Movement Reports. Available online: https://www.google.com/covid19/mobility/ (accessed on 23 December 2020).
  54. Menut, L.; Bessagnet, B.; Siour, G.; Mailler, S.; Pennel, R.; Cholakian, A. Impact of lockdown measures to combat Covid-19 on air quality over western Europe. Sci. Total Environ. 2020, 741, 140426. [Google Scholar] [CrossRef]
  55. Velásquez, R.M.A.; Lara, J.V.M. Gaussian approach for probability and correlation between the number of COVID-19 cases and the air pollution in Lima. Urban Clim. 2020, 33, 100664. [Google Scholar] [CrossRef] [PubMed]
  56. Lokhandwala, S.; Gautam, P. Indirect impact of COVID-19 on environment: A brief study in Indian context. Environ. Res. 2020, 188, 109807. [Google Scholar] [CrossRef] [PubMed]
  57. Berman, J.; Ebisu, K. Changes in U.S. air pollution during the COVID-19 pandemic. Sci. Total Environ. 2020, 739, 139864. [Google Scholar] [CrossRef] [PubMed]
  58. Sicard, P.; De Marco, A.; Agathokleous, E.; Feng, Z.; Xu, X.; Paoletti, E.; Rodriguez, J.J.D.; Calatayud, V. Amplified ozone pollution in cities during the COVID-19 lockdown. Sci. Total Environ. 2020, 735, 139542. [Google Scholar] [CrossRef] [PubMed]
  59. Nakada, L.Y.K.; Urban, R.C. COVID-19 pandemic: Impacts on the air quality during the partial lockdown in São Paulo state, Brazil. Sci. Total Environ. 2020, 730, 139087. [Google Scholar] [CrossRef]
  60. Sharma, S.; Zhang, M.; Gao, J.; Zhang, H.; Kota, S.H. Effect of restricted emissions during COVID-19 on air quality in India. Sci. Total Environ. 2020, 728, 138878. [Google Scholar] [CrossRef]
  61. Kanniah, K.; Zaman, N.A.F.K.; Kaskaoutis, D.G.; Latif, M.T. COVID-19’s impact on the atmospheric environment in the Southeast Asia region. Sci. Total Environ. 2020, 736, 139658. [Google Scholar] [CrossRef]
  62. Mahato, S.; Pal, S.; Ghosh, K.G. Effect of lockdown amid COVID-19 pandemic on air quality of the megacity Delhi, India. Sci. Total Environ. 2020, 730, 139086. [Google Scholar] [CrossRef]
  63. Dantas, G.; Siciliano, B.; França, B.B.; Da Silva, C.M.; Arbilla, G. The impact of COVID-19 partial lockdown on the air quality of the city of Rio de Janeiro, Brazil. Sci. Total Environ. 2020, 729, 139085. [Google Scholar] [CrossRef]
  64. Arora, S.; Bhaukhandi, K.D.; Mishra, P.K. Coronavirus lockdown helped the environment to bounce back. Sci. Total Environ. 2020, 742, 140573. [Google Scholar] [CrossRef]
  65. Bao, R.; Zhang, A. Does lockdown reduce air pollution? Evidence from 44 cities in northern China. Sci. Total Environ. 2020, 731, 139052. [Google Scholar] [CrossRef]
  66. Cameletti, M. The Effect of Corona Virus Lockdown on Air Pollution: Evidence from the City of Brescia in Lombardia Region (Italy). Atmos. Environ. 2020, 239, 117794. [Google Scholar] [CrossRef] [PubMed]
  67. Collivignarelli, M.C.; Abbà, A.; Bertanza, G.; Pedrazzani, R.; Ricciardi, P.; Miino, M.C. Lockdown for CoViD-2019 in Milan: What are the effects on air quality? Sci. Total Environ. 2020, 732, 139280. [Google Scholar] [CrossRef] [PubMed]
  68. Zoran, M.A.; Savastru, R.S.; Savastru, D.M.; Tautan, M.N. Assessing the relationship between ground levels of ozone (O3) and nitrogen dioxide (NO2) with coronavirus (COVID-19) in Milan, Italy. Sci. Total Environ. 2020, 740, 140005. [Google Scholar] [CrossRef] [PubMed]
  69. European Environment Agency Monitoring Covid-19 Impacts on Air Pollution. 2020. Available online: https://www.eea.europa.eu/themes/air/air-quality-and-covid19/monitoring-covid-19-impacts-on (accessed on 23 December 2020).
  70. Arpae Aria e lockdown, l’analisi nel bacino padano. Ecoscienza 2020, 3, 58–61.
  71. Li, W.; Shao, L.; Wang, W.; Li, H.; Wang, X.; Li, Y.; Li, W.; Jones, T.; Zhang, D. Air quality improvement in response to intensified control strategies in Beijing during 2013–2019. Sci. Total Environ. 2020, 744, 140776. [Google Scholar] [CrossRef]
  72. Bigazzi, A.Y.; Rouleau, M. Can traffic management strategies improve urban air quality? A review of the evidence. J. Transp. Health 2017, 7, 111–124. [Google Scholar] [CrossRef]
Figure 1. Confirmed cases of COVID-19 at international level—situation as of 18 December 2020 [9].
Sustainability 13 00118 g001
Figure 2. Study area and spatial distribution of the monitoring points.
Sustainability 13 00118 g002
Figure 3. Trend in the annual average values of daily transits for the period 2015–2020.
Sustainability 13 00118 g003
Figure 4. Trend in the annual average values of daily transits—comparison between February and May 2019 and 2020.
Sustainability 13 00118 g004
Figure 5. Wind rose—period February–May 2019 and 2020.
Sustainability 13 00118 g005
Figure 6. Cumulative precipitation—period February–May 2019 and 2020.
Sustainability 13 00118 g006
Figure 7. Trend in the daily average values of air pollutants (a,b) NO2, (c) O3, (d) CO, (e) and (f) PM10, (g) PM2.5—period February–May 2019 and 2020.
Sustainability 13 00118 g007
Figure 8. Percentage differences of PM10 concentrations for the periods 1 February—31 May 2019 and 2020.
Sustainability 13 00118 g008
Figure 9. Daily trend of percentage differences.
Sustainability 13 00118 g009
Figure 10. Vehicle traffic and air pollutants (a) and (b) NO2, (c) O3, (d) CO, (e) and (f) PM10, (g) PM2.5—weekly average values for the period February–May 2020.
Sustainability 13 00118 g010
Figure 11. PM10 concentration values during some periods with emergency measures: (a) October 2019, (b) December 2019.
Sustainability 13 00118 g011
Table 1. Vehicle traffic sampling points.
IDRoad NameType of Sensor
138State road 0063Underground
139Provincial road 467RUnderground
140State road 009Underground
143Provincial road 063RUnderground
383State road 722Underground
452Provincial road 003Underground
620Provincial road 113Underground
624Provincial road 023Underground
638State road 009Underground
Table 2. Meteorological station.
IDStation NameMeasured Parameters
Met.Meteorological station RETemperature (°C)
Wind speed (m/s)
Wind direction (°)
Precipitation (mm)
Table 3. Selected AQMSs.
IDStation NameClassificationMeasured Parameters
S.Laz.“San Lazzaro”Urban backgroundNO, NOx, NO2, O3, PM10, PM2.5
Tim.“Timavo”Urban trafficCO, BTEXs, NO, NOX, NO2, PM10
Table 4. Percentage change in the movement of citizenship compared to some significant sectors [53].
Retail and RecreationGrocery and PharmacyParksTransit StationsWorkplacesResidential
Italy−65−36−51−64−4922
Emilia-Romagna regional area−65−33−47−64−4723
Reggio Emilia provincial area−66−34−45−62−4723
Table 5. Annual average of daily transits for the period 2015–2020.
Measuring Station IDAverage Daily Transits [n. Vehicles/Day]Percentage Difference
201520162017201820192020 *2020—(Period 2015–2019)
13811,63411,97612,17112,12912,1758138−48%
13915,05715,37315,73615,75315,95110,719−45%
14024,47324,91924,70324,71924,12515,957−54%
14321,27422,30622,65022,87723,13815,715−43%
383n,a,27,87729,10829,63829,20220,252−43%
45210,12610,48610,56110,83711,1787462−43%
620671968087128722271904784−47%
62410,66710,69410,87610,87110,8127153−51%
63818,53018,77218,56518,40618,39012,711−46%
* The data for 2020 include the period January–July.
Table 6. Percentage difference of average traffic values between 2019 and 2020 (green: below −25%, yellow: between −25% and −50%, orange: between −51% and −75%, red: above 75%).
IDPercentage Difference [%]
Weeks
1234567891011121314151617
138511−6−12−38−72−80−80−76−78−70−73−46−34−23−11
139300−11−15−42−70−80−80−77−78−66−67−51−42−32−23
140−2−4−2−13−15−44−69−77−78−76−78−66−69−50−43−34−24
143321−10−14−41−69−79−81−77−78−65−67−49−41−32−24
3831−20−13−15−44−66−76−76−74−71−58−43−42−44−36−28
452411−12−14−42−68−80−82−78−78−65−66−48−42−34−25
6201−1−1−14−18−45−67−78−81−77−77−63−62−49−43−35−28
624311−9−14−41−71−80−80−78−78−67−70−49−40−30−23
638212−9−13−41−67−75−77−73−73−61−64−43−36−25−20
Table 7. Main meteorological parameters measured during the study period 2019–2020.
Measured Parameters20192020
MinMeanMaxMinMeanMax
Daily temperature (°C)1122121320
Wind speed (m/s)0.91.63.31.41.61.9
Wind direction (°)6717428373171284
Cumulative daily precipitation (mm)03750122
Table 8. Annual average of the main air pollutants measured by the selected AQMSs—2015–2020.
ID AQMSNO2 [µg/m3]O3 [µg/m3]CO [mg/m3]PM10 [µg/m3]PM2.5 [µg/m3]
S.Laz.Tim.S.Laz.Tim.S.Laz.Tim.S.Laz.Tim.S.Laz.Tim.
2015234044n.a.n.a.0.6293721n.a.
2016233941n.a.n.a.0.5283319n.a.
2017254244n.a.n.a.0.6334023n.a.
2018223543n.a.n.a.0.5283520n.a.
2019233445n.a.n.a.0.5273218n.a.
2020 *172850n.a.n.a.0.5273122n.a.
Perc. diff. 2020—(2015–2019)−27%−26%+15%n.a.n.a.−7%−7%−12%+9%n.a.
* The data for 2020 include the period January–July.
Table 9. Minimum, average and maximum concentrations of the main air pollutants measured by the AQMSs during the period February–May 2019 and 2020.
NO2 [µg/m3]O3 [µg/m3]CO [mg/m3]PM10 [µg/m3]PM2.5 [µg/m3]
S.Laz.Tim.S.Laz.Tim.S.Laz.Tim.S.Laz.Tim.S.Laz.Tim.
2019Min0.70.60.7n.a.n.a.0.20.40.50.6n.a.
Mean253945n.a.n.a.0.6263217n.a.
Max537076n.a.n.a.1.2899676n.a.
2020Min363n.a.n.a.0.2774n.a.
Mean162749n.a.n.a.0.5263117n.a.
Max435786n.a.n.a.1.0999958n.a.
Corr.S.Laz 2019—S.Laz 20200.720.67n.a.0.440.58
Tim. 2019—Tim. 20200.60n.a.0.760.51n.a.
S.Laz 2019—Tim. 20190.93n.a.n.a.0.96n.a.
S.Laz 2020—Tim. 20200.95n.a.n.a.0.95n.a.
Perc. diff. (%)S.Laz 2019—2020−41%+13%n.a.+27%+31%
Tim. 2019—2020−32%n.a.−22%+23%n.a.
Perc. diff. (%)
Only lockdown period (10 March—18 May)
S.Laz
lockdown compared to 2019
−52%+16%n.a.+43%+46%
Tim.
lockdown compared to 2019
−41%n.a.−25%+37%n.a.
Table 10. “Traffic” AQMS selected for each province.
PM10 conc. Values [µg/m3]PiacenzaParmaReggio EmiliaModenaBolognaFerraraRavennaForlì-CesenaRimini
GiordaniMontebelloTimavoGiardiniDe AmicisIsonzoZalamellaRomaFlaminia
2019Min461626629
Mean312932332135302630
Max9795969960112888588
2020Min157825437
Mean282731312530282430
Max891019999112107124105140
Table 11. Correlation between road traffic and pollutant concentrations.
Correlation
NO2O3COPM10 PM2.5
S.Laz.Tim.S.Laz.Tim.S.Laz.Tim.S.Laz.Tim.S.Laz.Tim.
1380.670.67−0.67n.a.n.a.0.590.310.370.42n.a.
1390.750.78−0.75n.a.n.a.0.730.370.500.50n.a.
1400.740.77−0.74n.a.n.a.0.720.370.480.49n.a.
1430.740.77−0.74n.a.n.a.0.720.360.480.49n.a.
3830.730.77−0.75n.a.n.a.0.760.340.490.47n.a.
4520.740.78−0.75n.a.n.a.0.740.370.500.49n.a.
6200.750.79−0.75n.a.n.a.0.760.370.520.50n.a.
6240.710.73−0.72n.a.n.a.0.660.350.430.47n.a.
6380.710.75−0.72n.a.n.a.0.700.350.460.47n.a.
Publisher’s Note: MDPI stays neutral with regard to jurisdictional claims in published maps and institutional affiliations.

