Article

Interplay between Diets, Health, and Climate Change

by
Prajal Pradhan
1,* and
Jürgen P. Kropp
1,2
1
Potsdam Institute for Climate Impact Research (PIK), Member of the Leibniz Association, P.O. Box 60 12 03, D-14412 Potsdam, Germany
2
Institute for Environmental Science and Geography, University of Potsdam, D-14476 Potsdam, Germany
*
Author to whom correspondence should be addressed.
Sustainability 2020, 12(9), 3878; https://doi.org/10.3390/su12093878
Submission received: 30 March 2020 / Revised: 30 April 2020 / Accepted: 6 May 2020 / Published: 9 May 2020
(This article belongs to the Section Sustainable Agriculture)

Abstract

:
The world is facing a triple burden of undernourishment, obesity, and environmental impacts from agriculture while nourishing its population. This burden makes sustainable nourishment of the growing population a global challenge. Addressing this challenge requires an understanding of the interplay between diets, health, and associated environmental impacts (e.g., climate change). For this, we identify 11 typical diets that represent dietary habits worldwide for the last five decades. Plant-source foods provide most of all three macronutrients (carbohydrates, protein, and fat) in developing countries. In contrast, animal-source foods provide a majority of protein and fat in developed ones. The identified diets deviate from the recommended healthy diet with either too much (e.g., red meat) or too little (e.g., fruits and vegetables) food and nutrition supply. The total calorie supplies are lower than required for two diets. Sugar consumption is higher than recommended for five diets. Three and five diets consist of larger-than-recommended carbohydrate and fat shares, respectively. Four diets with a large share of animal-source foods exceed the recommended value of red meat. Only two diets consist of at least 400 gm/cap/day of fruits and vegetables while accounting for food waste. Prevalence of undernourishment and underweight dominates in the diets with lower calories. In comparison, a higher prevalence of obesity is observed for diets with higher calories with high shares of sugar, fat, and animal-source foods. However, embodied emissions in the diets do not show a clear relation with calorie supplies and compositions. Two high-calorie diets embody more than 1.5 t CO 2 eq/cap/yr, and two low-calorie diets embody around 1 t CO 2 eq/cap/yr. Our analysis highlights that sustainable and healthy diets can serve the purposes of both nourishing the population and, at the same time, reducing the environmental impacts of agriculture.

1. Introduction

The world is facing a triple burden while nourishing its population. Currently, around 821 million people are undernourished and suffering from hunger [1], while around 2 billion adults are overweight, including 660 million people suffering from obesity [2]. Undernutrition, overweight, and obesity are different forms of malnutrition that are caused by food insecurity. These different forms of malnutrition coexist in many countries [1]. Currently, a huge share of the global population is food-insecure and does not have the conditions for ‘an active and healthy life’ [3].
At the same time, agriculture is also one of the primary drivers of global environmental changes. Currently, one-third of the global land area is covered by agriculture, including pastures and meadows [4]. The agriculture sector consumes around 70% of the global water withdrawal, also known as blue water use [5]. Around 21–37% (10.8–19.1 Gt CO 2 eq/yr) of the global anthropogenic greenhouse gas (GHG) emissions come from food systems that include the agriculture sector together with forestry and other land uses [3,6]. Therefore, a global challenge is to nourish the growing population sustainably.
Food systems should be sustainable as well as nourishing [7], but they are currently sustainable on neither the production nor the consumption sides [8]. On the production side, food systems contribute to global environmental changes via agriculture and various food supply chain activities, e.g., carbon emissions from food transportation [9]. On the consumption side, the global supply is 20% higher than what is required, leading to a huge amount of food waste [10]. Traditionally, a large focus was on production-side management to ensure food security. Currently, consumption-side management (e.g., reducing food waste and consuming healthy diets) is getting attention to sustainably ensure food security and reduce GHG emissions associated with food systems [10,11,12]. For example, several studies have highlighted the potentials of sustainable and healthy diets to either mitigate climate change or to fulfill the food and nutrition requirements of the growing population [11,13,14,15].
The World Health Organization (WHO) [16], World Cancer Research Fund (WCRF), and American Institute for Cancer Research (AICR) [17] have provided recommendations for healthy diets, considering compositions and amounts of macro-nutrients (carbohydrates, proteins, and fats) and food types (e.g., sugar, fruits and vegetables, and red meat). Similarly, the recent Eat-Lancet report has suggested dietary targets for different food groups as recommendations for healthy diets [12]. This report highlights that what we eat and how we produce need to change significantly for healthy lives and a sustainable planet. However, a comparison of the current diets with the recommended healthy diet (RHD) is, so far, globally missing at the country level. This comparison is essential to understand how close or far the current food and nutrition supply is from the recommendations. Furthermore, linking the current food and nutrition supply with different forms of malnutrition is also globally missing at the country level.
This study investigates the interplay between diets, health, and climate change to fill the above- mentioned gaps. Mainly, we identify typical diets based on the global food and nutrition supply for the last five decades, compare the identified diets with the RHD, link the diets with different forms of malnutrition, and estimate embodied GHG emissions in the diets. By this investigation, we aim to answer the research question of how sustainable and healthy the current diets are, contributing to addressing the global challenge of sustainable nourishment, mainly through consumption-side management.

2. Material and Methods

2.1. Diet Analysis

This study generalizes nourishing styles across the world in terms of supply and composition of food and macro-nutrients (carbohydrates, proteins, and fats) by analyzing typical diets. To identify the typical diets, we use data on the supply of calories from the 14 different food groups and on the supply of proteins and fats from plants and animals for 217 countries and regions between 1961 and 2013 from FAOSTAT [4] and apply cluster analysis.
The 14 food groups consist of plant- and animal-source foods in calories. Cereals, starchy roots, sweeteners (sugar and sweeteners), sugar crops, pulses, oils (vegetable oils), oil crops, fruits, vegetables, alcohol, and others are the food groups for plant-source foods. “Others“ consist of the sources that are consumed in relatively small amounts (e.g., tree nuts, spices).
We distinguish animal-source foods into aquatic, ruminant, and non-ruminant products, mainly due to nutritional values and greenhouse gas emission intensities. The aquatic products consist of food from freshwater and seawater (e.g., fishes, mollusks, crustaceans) that play an important role in providing essential nutrients and minerals [18]. We group ruminant-source foods (e.g., cows, buffaloes, sheep, and goats) with ruminant products and non-ruminant-source foods (e.g., pigs and chickens) with non-ruminant products. Ruminants are the major contributors to GHG emissions from the livestock sector, mainly due to enteric fermentations [19,20]. The difference in emission intensities for ruminants and non-ruminants motivated us to treat them separately.
For comparing the typical diets with the RHD, we make use of the country-scale data on the supply of fruits, vegetables, and red meat from FAOSTAT [4]. Red meat consists of bovine meat, mutton, goat meat, and pig meat. To account for the actual consumption of fruits, vegetables, and red meat, we consider their global average food waste of 25.7% and 12.6%, respectively [21].

2.1.1. Cluster Analysis

This study identifies the typical diets by applying k-means cluster analysis on the data on the supply of calories, proteins, and fats. By doing so, we aim to group similar nourishing styles across the world between 1960 and 2013 into different clusters for investigating health and sustainability aspects of these nourishing styles. The k-means clustering partitions n observations (the data on the supply of calories, proteins, and fats) into predefined k clusters (here, typical diets), in which each observation belongs to the cluster with the nearest mean [22]. Many studies have used this method to identify patterns and typologies across socioeconomic and biophysical datasets (e.g., [23,24]).
Based on elbow and silhouette criteria, we determine 11 clusters—in other words, 11 typical diets that represent the food supply data (Figure S1). The number of typical diets depends on the period of analysis and the compositions of the diets. The elbow and silhouette methods provide a measure for consistency in cluster analysis. The elbow method estimates the percentage of variance explained by the cluster for different cluster numbers. Adding the number of clusters increases the explained variances, but the marginal gain will drop after a certain point. Based on the elbow criteria, the cluster number is determined at this point. However, this method cannot always unambiguously identify the right cluster number [25], which is the case while analyzing the food supply data (Figure S1).
We additionally use the silhouette method, which provides a measure of how similar an object is to its cluster compared to other clusters [26]. The values for the silhouette range between −1 and +1. A high value shows that the object is similar to its cluster but different from neighboring clusters. When most objects have high values, the number of clusters is appropriate. We estimate an average silhouette value/width for a different number of clusters. The optimal cluster number is determined based on the maximum average silhouette value that is close to the elbow.

2.1.2. Diet Shift Analysis

Since we identify the typical diets for the period 1961–2013 across the world, the food and nutrition supply of a country could belong to different typical diets for different years. We define a diet shift as a change in the diet of a country from one typical diet to another in a consecutive year. To have a complete picture on diet shifts, we estimate how often the diet of a country changed from one typical diet to other in consecutive years between 1961 and 2013, globally.

2.2. Linking Diets, Heath, and Climate Change

We compare the identified typical diets with the RHD and estimate the prevalence of different body mass index (BMI) categories and GHG emissions associated with the diets. By analyzing this, we relate the diets with human health and climate change.

2.2.1. Recommended Healthy Diet (RDH)

We compare the typical diets with recommended healthy diets by WHO [16] and WCRF and AICR [17]. The WHO [16] recommends that contributions of sugar, carbohydrates, proteins, and fats in daily dietary energy requirements need to be <10%, 55–75%, 10–15%, and 15–30%, respectively. Furthermore, an adult needs to consume at least 400 g/cap/day of fruits and vegetables. The WCRF and AICR [17] advise the limitation of red meat consumption to less than 300 g/cap/week.
The dietary energy requirements for the typical diets are estimated using country-scale dietary energy requirements for the moderate physical activity level. Hiç et al. [10] calculated the dietary energy requirements from 1960 to 2015 in a five-year interval for 197 countries by considering countries’ demographies, body weight distributions based on age class, and physical activity levels. First, we consider the set Z of pairs of countries C and years Y that make up the typical diets, and relate subsets Z as the elements for which data on X (here, dietary energy requirements) are available. Then, the average value X z for a typical diet is calculated as the average from the set Z (Equation (1)). We apply the method described to estimate the average supply of fruits, vegetables, and red meat in typical diets.
X z = 1 # ( Z ) ( C , Y ) Z X ( C , Y )
This study calculates the total protein and fat contents in the typical diets as sums of proteins and fats from both animal- and plant-source foods, respectively. We use the value of sweeteners as a proxy for sugar content in the diets. The total calories consist of calories from carbohydrate, protein, and fat. We estimate the carbohydrate content in a diet (in calories) by subtracting its calorie content in proteins (4 kcal/gram) and fats (9 kcal/gram) from its total calories, as presented in Equation (2) [27].
c a r b o h y d r a t e = c a l o r i e s 4 × p r o t e i n s 9 × f a t s

2.2.2. Body Mass Index (BMI)

Body mass index (BMI) is an outcome of dietary choices and level of physical activity [28,29], which can also represent the status of health risk in combination with other factors, e.g., age [30]. Therefore, we estimate the average prevalence of four BMI categories in the typical diets by applying the method described by Equation (1), considering X as the BMI categories. The four BMI categories are: <18.5 (underweight), 18.5–24.9 (normal weight), 25.0–29.9 (overweight), and >30 (obesity). We obtain the data on the prevalence of the BMI categories from the NCD Risk Factor Collaboration for 200 countries between 1975 and 2016 for adult males and females [2].
Similarly, we calculate the average prevalence of undernourishment in the typical diets by using the data from FAOSTAT. We use the method described by Equation (1), considering X as the prevalence of undernourishment. FAOSTAT provides country-scale data on the average prevalence of undernourishment for 204 countries between 2000 and 2016 [4].

2.2.3. Greenhouse Gas Emissions

The agriculture sector is one of the primary contributors to anthropogenic greenhouse gas emissions. Thus, embodied emissions of diets play an essential role in determining how sustainable a diet is. We estimate the average agricultural emissions from different sub-domains for producing the typical diets by using the data from FAOSTAT [4] and the method described by Equation (1), considering X as emissions. The different agricultural emission sub-domains are enteric fermentation, manure left on the pasture, manure management, manure applied to soils, synthetic fertilizers, rice cultivation, cultivation of organic soils, crop residues, burning—crop residues, and burning—savanna [31]. The FAOSTAT provides data from agricultural emissions for 243 countries between 1961 and 2013.

3. Results

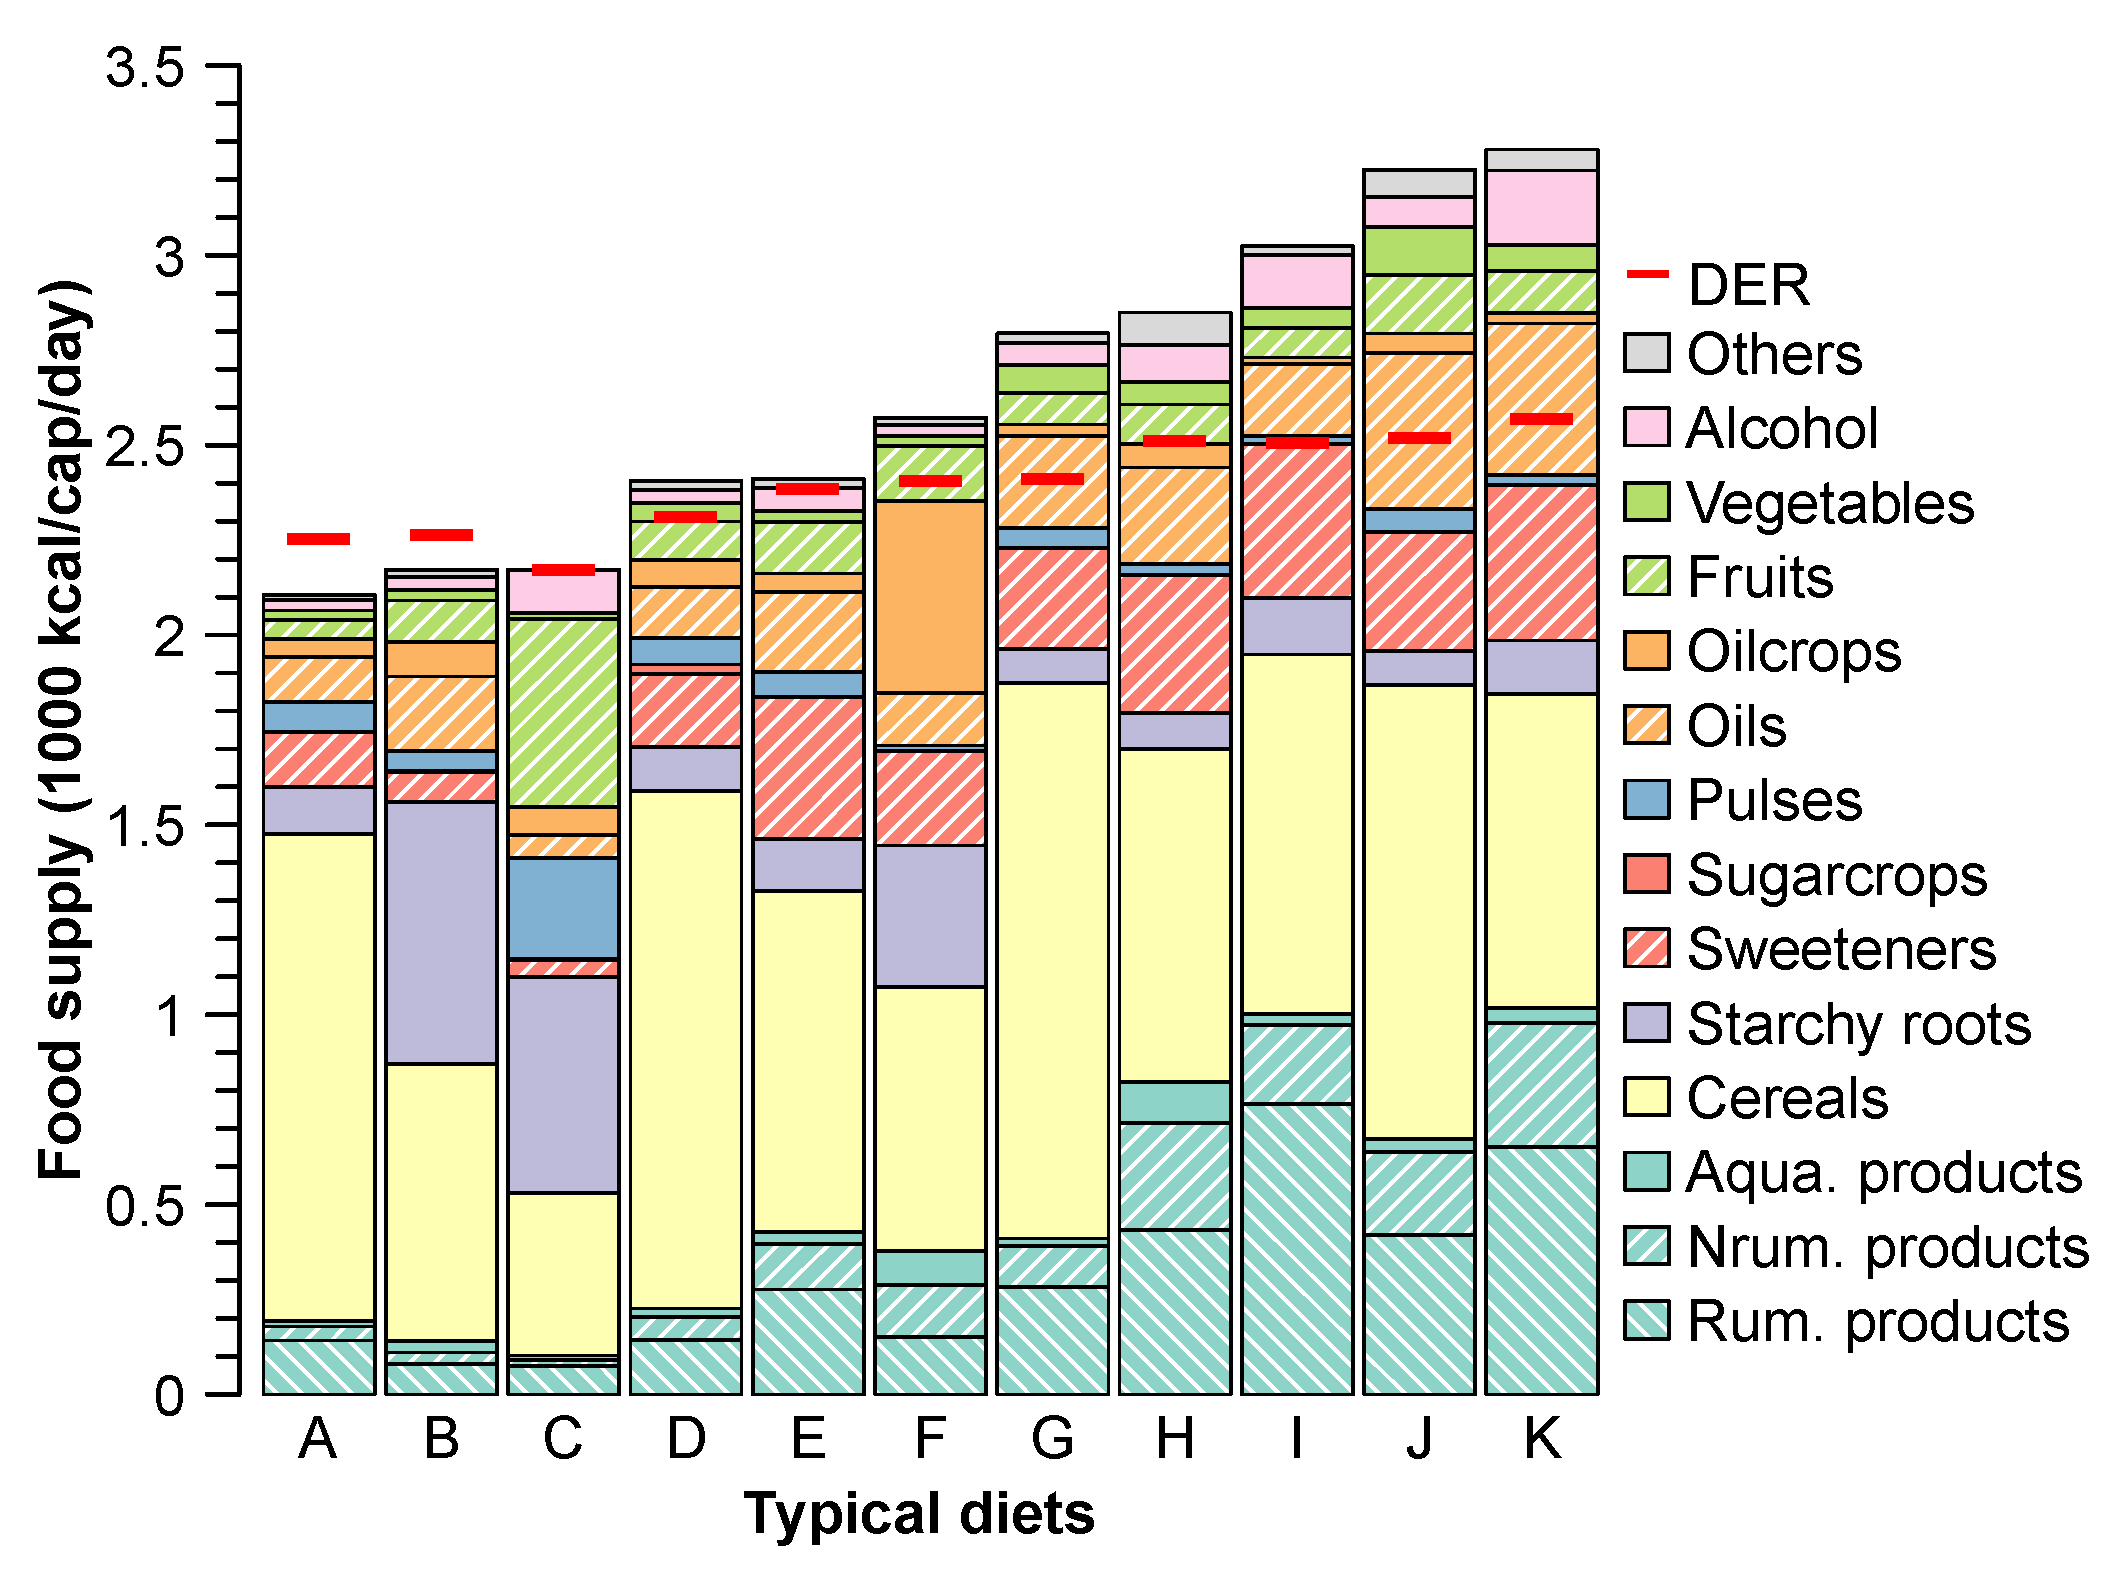
3.1. Nourishment Styles

The global nourishment styles in terms of food and macro-nutrient consumption and composition for the last five decades can be explained by 11 typical diets (Figure 1). Amounts and compositions of calories, proteins, and fats vary across these diets (Figures S2–S4).
The three diets (A–C) contain total calories of less than 2400 kcal/cap/day, which are mainly provided by a mixture of cereals, starchy roots, and pulses. These diets consist of relatively low amounts of proteins (<60 g/cap/day) and fats (<50 g/cap/day), with a major share coming from plant-source foods (Figures S3 and S4). The food supply in most countries in Africa and Asia reflects the diets A–C, which can also be called low-calorie diets, until 1990 (Figure 2). Afterward, some countries, mainly in Asia, shifted to other diets.
Four diets (D–G) contain total calories of between 2400 kcal/cap/day and 2800 kcal/cap/day. These diets are composed of a slightly higher amounts of calories from animal-source foods in comparison to the diets A–C. A mixture of cereals, sugar crops and sweeteners, oil crops and oils, and starchy roots provides a major source of calories in these diets. The protein contents in the diets are relatively low (<60 g/cap/day), except for diet G (≈75 g/cap/day). Diet G also contains a larger amount of cereal compared to the diets D–F (Figures S2–S4). The fat content is less than 70 g/cap/day in these diets, except for the diet F (95 g/cap/day), which consists of a larger amount of oil crops and aquatic products. The food supply in most countries in South America reflects the diets D–G, which was also the case for the Former Soviet Union before 1967 (Figure S5).
The rest of the diets (H–K) consist of total calories of more than 2800 kcal/cap/day, with at least 20% of calories coming from animal-source foods, mainly from ruminants. These diets consist of a relatively lower share of cereals, starchy roots, and pulses, but a relatively higher share of sweeteners and oils in comparison to other diets. The protein and fat contents of these diets are very high— 90 g/dap/day and 100 g/cap/day, respectively—with more than 50% of both protein and fat coming from animal-source foods (Figures S3 and S4). These diets (H–K) can also be called high-calorie diets, which are traditionally predominant in North America, Europe, and Australasia. During the last five decades in every continent, at least a few countries have shifted to these diets (Figure S5).

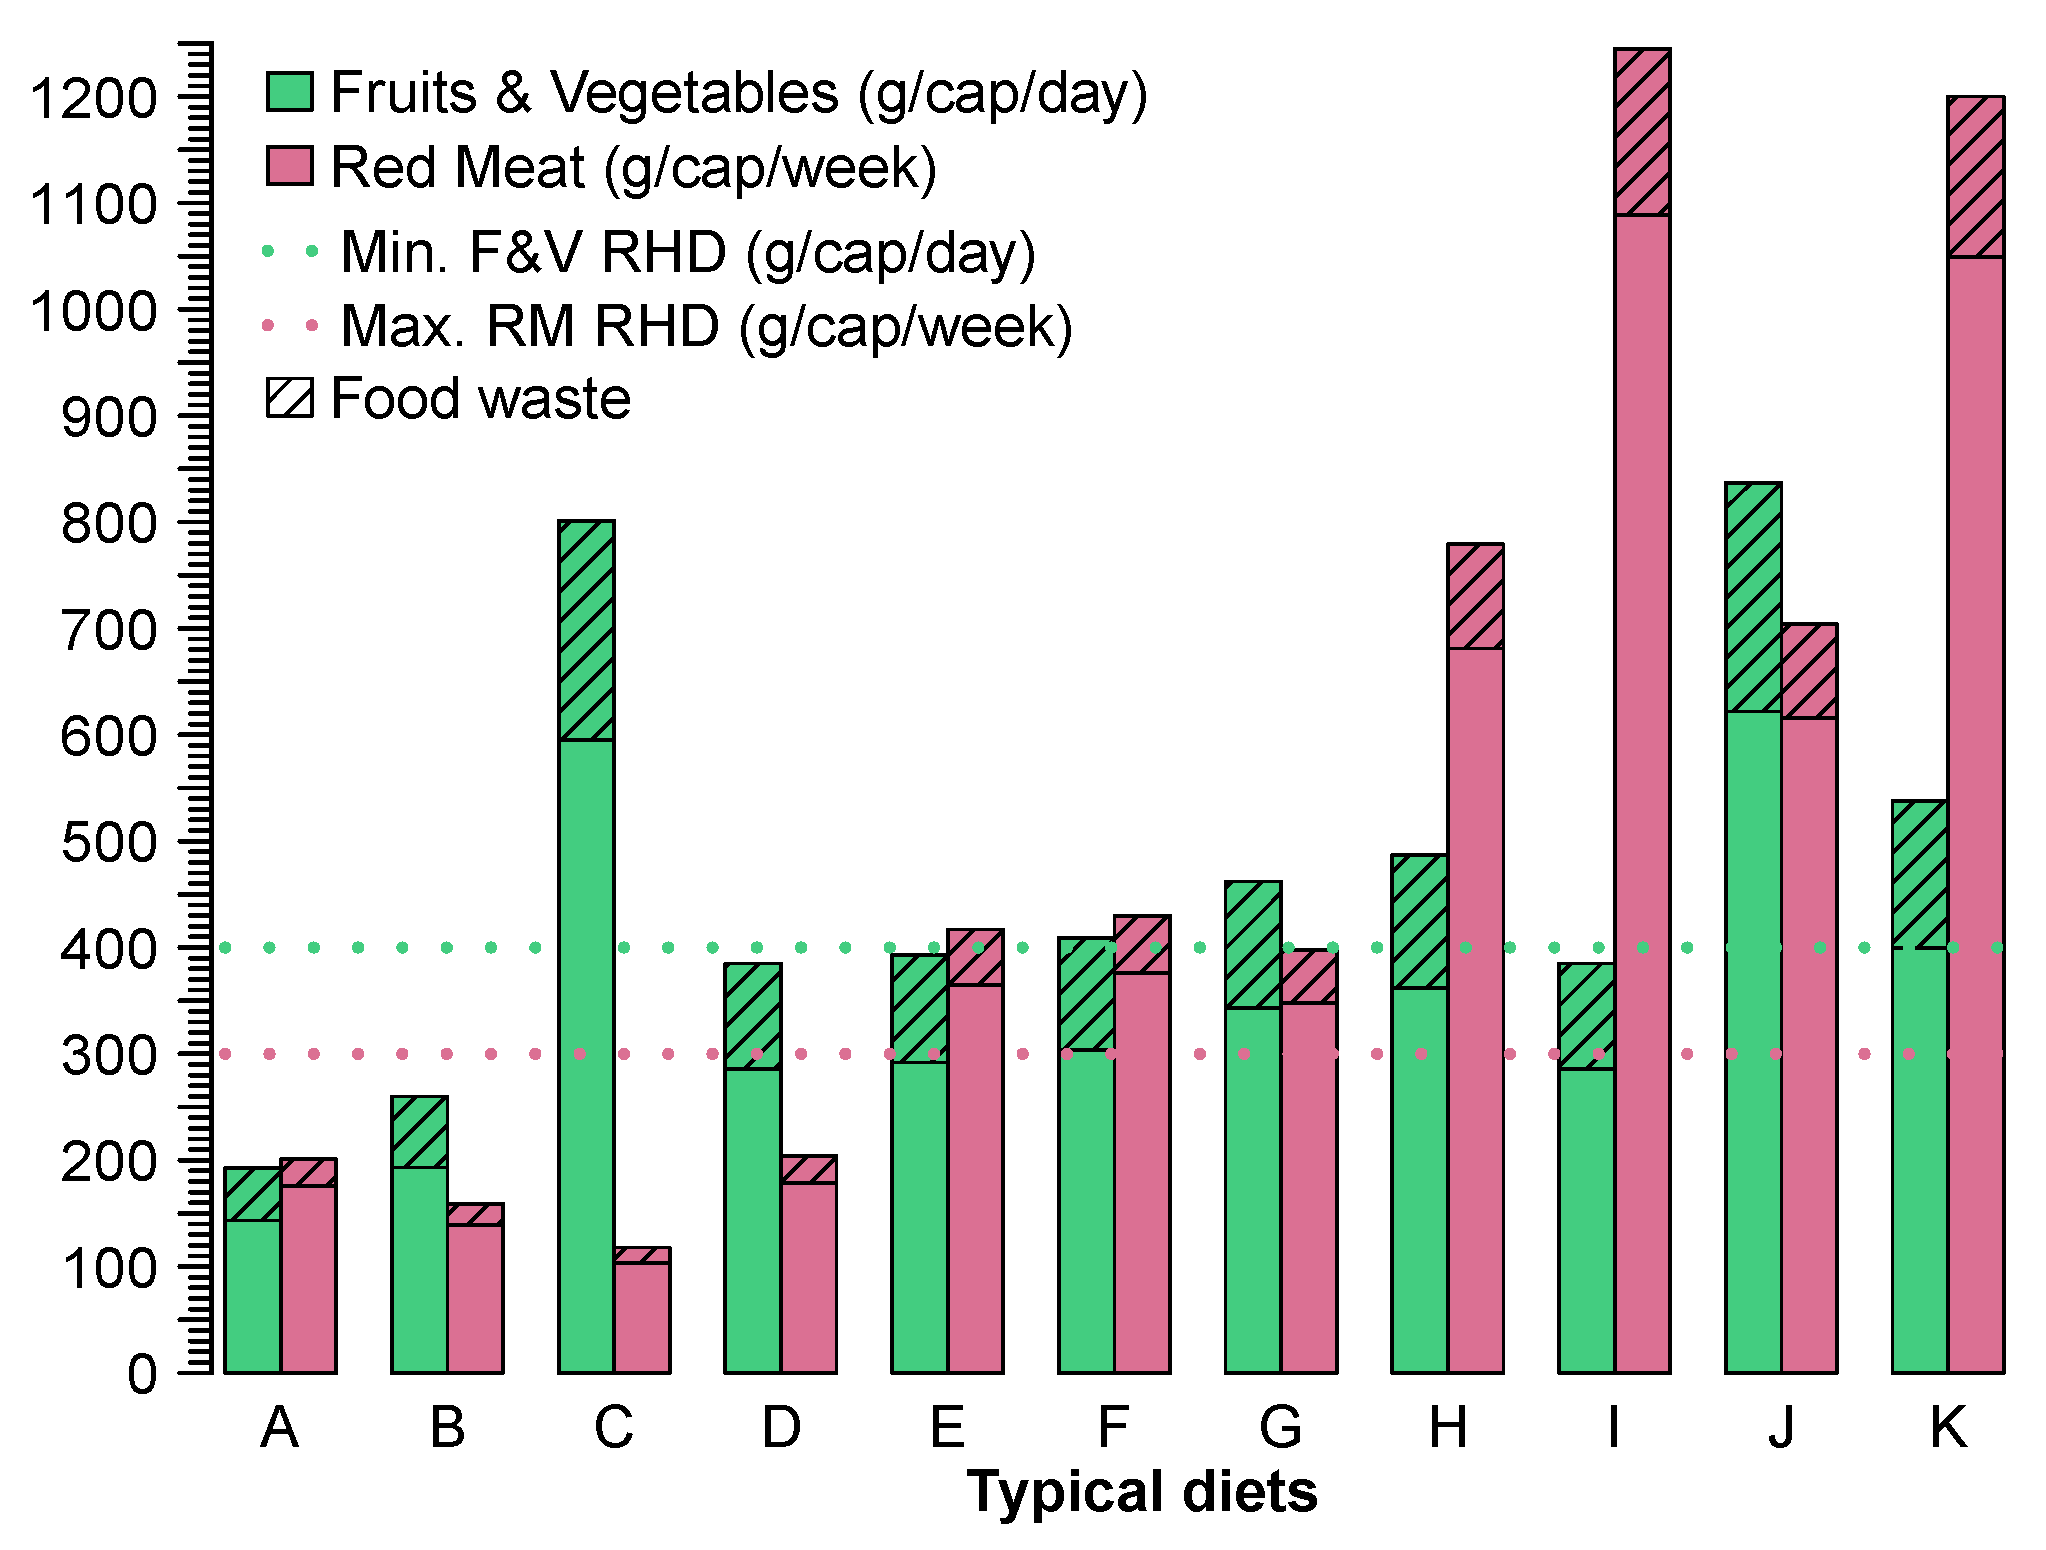
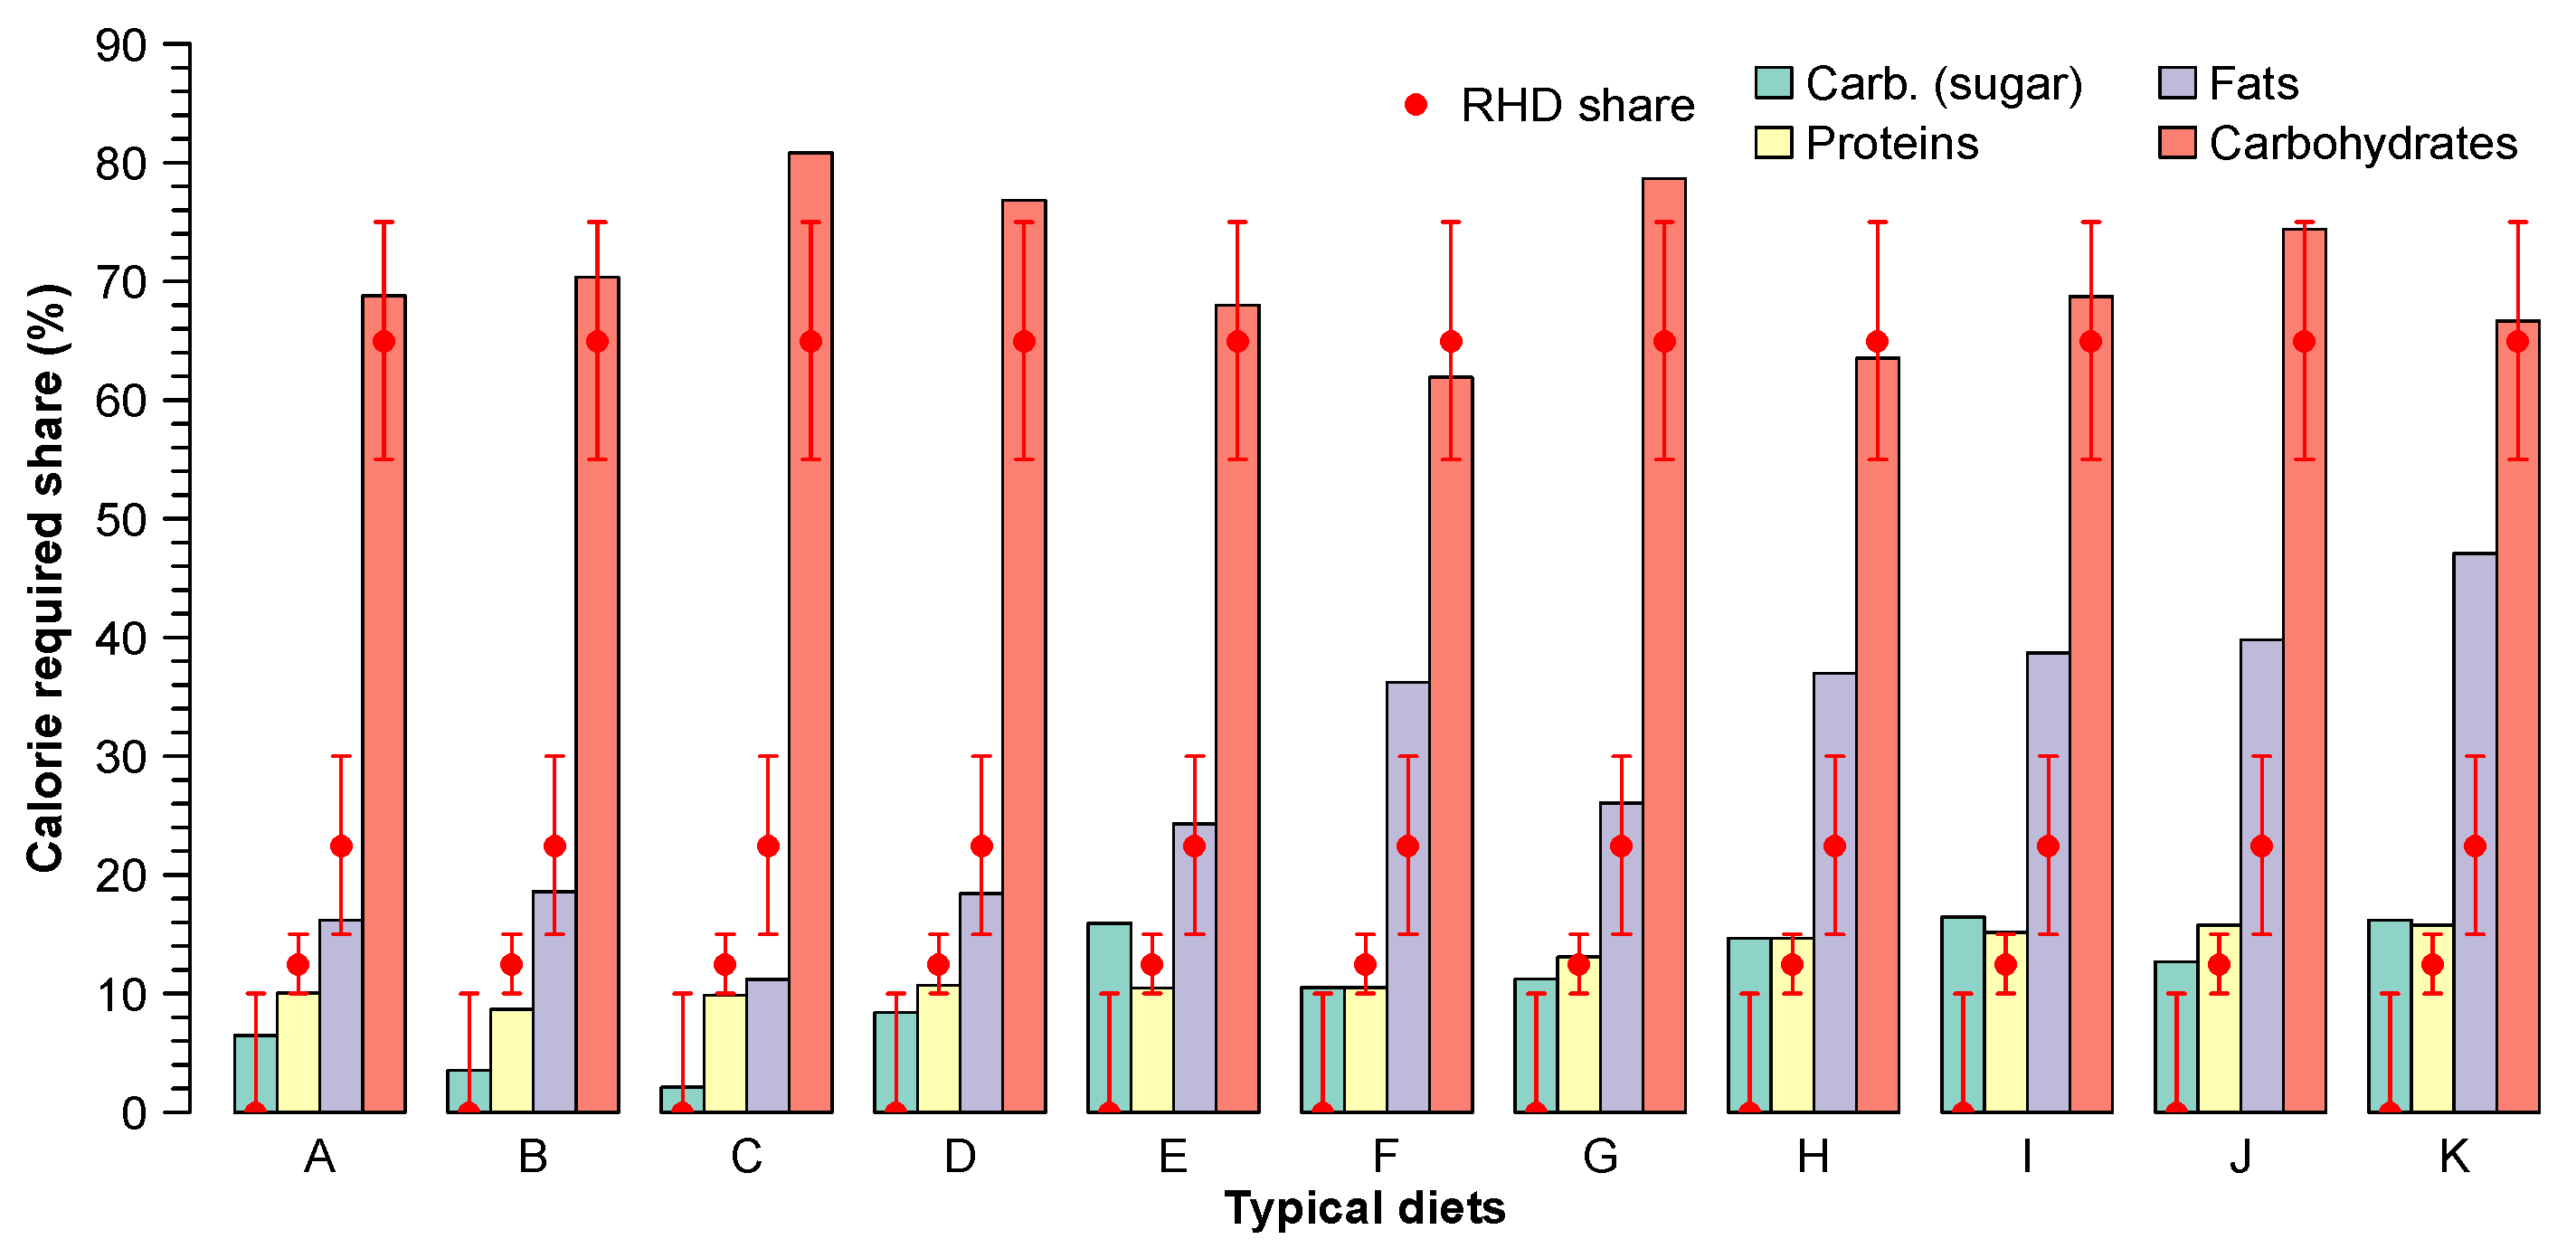
3.2. Deviation from the Recommended Healthy Diet (RHD)

We find discrepancies between the composition of diets and that of the RHD. The diets have either too much or too little food and nutrition supply (Figure 1, Figure 2, Figure 3 and Figure 4 and Figures S3 and S4). In terms of calories, seven out of 11 diets (D, F–K) consist of more than the required calories, which can be interpreted as overconsumption or food waste. The food available for human consumption was 20% higher than the required amount in 2010 on a global scale [10]. The calorie content in two diets (A, B) is less than the required amount (Figure 1). This lower amount of calories reflects a high prevalence of undernourishment and hunger in some countries. Globally, around 821 million people suffered from hunger in 2017 [1].
Most diets contain either higher than the recommended amount of red meat or lower than the advised value of fruits and vegetables (Figure 3). Seven out of 11 diets (E–K) are composed of more than the recommended maximum of 300 g/cap/week of red meat, even while accounting for food waste. In contrast, all other diets contain lower than the advised value of at least 400 g/cap/day of fruits and vegetables, except for diets C, K, and J, while considering food waste. The supply of fruits and vegetables is lower than the recommended value in only diets A and B when food waste is not considered. Other diets have at least 385 g/cap/day of fruits and vegetables, which is close to the recommended value. Hence, these diets could provide the recommended value of fruits and vegetables by avoiding food waste. Studies show that excess consumption of red meat increases risks of cardiovascular disease and certain cancers [32]. In contrast, the consumption of enough fruits and vegetables is beneficial for health because they provide essential nutrients, dietary fiber, vitamins, and minerals [33].
We observe similar discrepancies in over- and under-supply of the macro-nutrient in the diets (Figure 4 and Figures S3 and S4). Two diets (B, C) consist of under-supply of proteins. The other four diets (A, D–F) are very close to the lower bound of the recommended protein share of at least 10% of the dietary energy requirements. All of these diets (A–F) consist of more than 50% plant protein (Figure S3). Some studies argue that the consumption of sufficient animal protein is essential for the physical development of children [34]. For example, lack of animal protein consumption is argued as one of the undernourishment factors, resulting in stunting in children in large parts of Sub-Saharan Africa [35]. However, other studies have highlighted that different sustainable options can also contribute to access to sufficient foods for children without including animal-source foods, especially red meat [36]. Reducing consumption of animal-source foods is essential because excess meat consumption can lead to poor health and preventable ailments [32,37,38]. Three diets (I–K) contain slightly more than the upper bound of the recommended protein share of 15% of the dietary energy requirements. More than 50% of the protein in these three diets comes from animal-source foods.
In terms of fats, only one diet (C) contains less than the recommended fat share of at least 15% of the dietary energy requirements. Five diets (A, B, D, E, G) contain a fat share within the advised range of 15–30% of dietary energy requirements. The fat share is higher than the recommended value in the rest of the diets (F, H–K). For diets F and J, the majority of the fats come from plant-source foods (i.e., oils), while animal-source foods provide most of the fats in diets H, I, and K (Figure S5). Too much fat in diets, especially saturated fats, can raise cholesterol levels, which increases the risk of heart disease [39].
Sugar provides more than 10% of the dietary energy requirements for seven diets (E–K). These seven diets also contain more than the required amount of calories. Three diets (C, D, G) contain more than the recommended range of carbohydrates of 55–75% of the dietary energy requirements, lacking essential share of proteins and fats. Excess consumption of sugar and carbohydrates increases the risk of type 2 diabetes mellitus, while excess sugar may additionally cause greater dental caries [40].

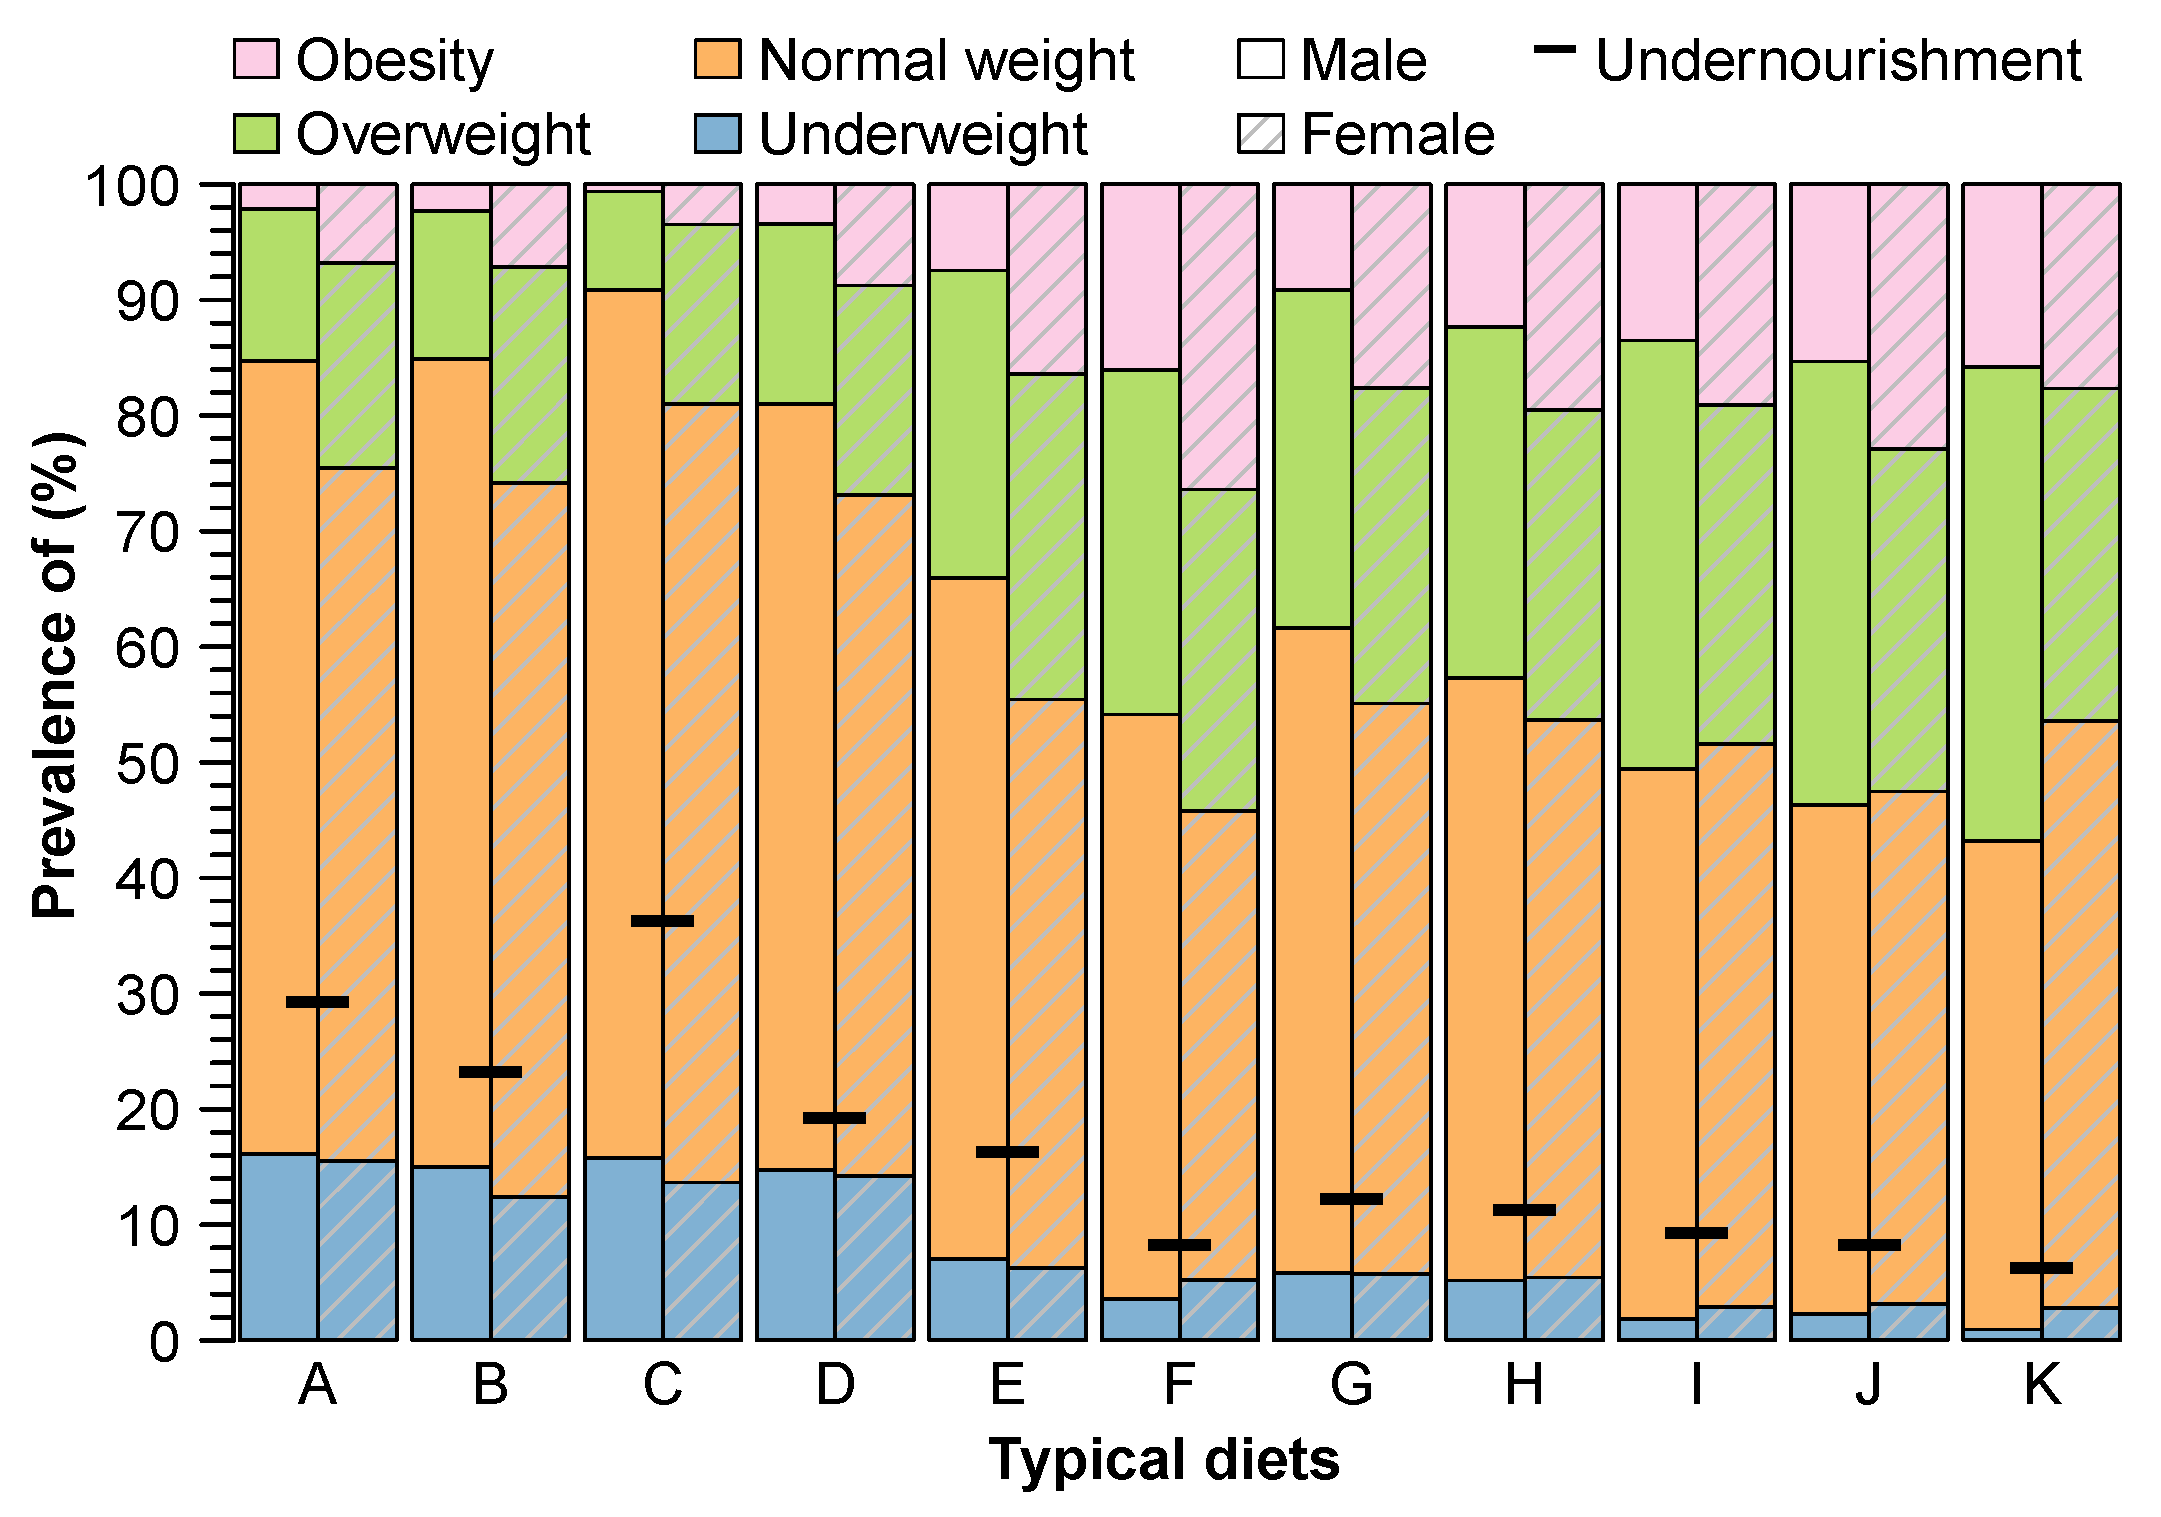
3.3. Diets and Body Mass Index (BMI)

The prevalence of different BMIs varies with diets for both male and female populations (Figure 5). In general, a larger share of females than males suffer from obesity, while a larger share of males is overweight than females. For example, the prevalence of obesity is between 16% and 26% in the female population and between 8% and 16% in the male population in the countries that consume the seven diets (E–K) with calorie supplies of more than 2400 cal/cap/day. These diets consist of a high share of sugar, oils, and animal-source foods, and have a larger prevalence of obesity than underweight. In these countries, 25–40% of males and 25–30% of females are overweight.
A large share of both the male (66–75%) and female (59–67%) population is of normal weight in the countries with the diets A–D. These four diets contain totals of calories slightly lower or higher than the dietary energy requirements, with a small share (less than 10%) of animal-source foods (i.e., A–D). However, these countries also have large shares of their populations that suffer from underweight (12–15% of females and 15–16% of males) and undernourishment (18–35% of the population).

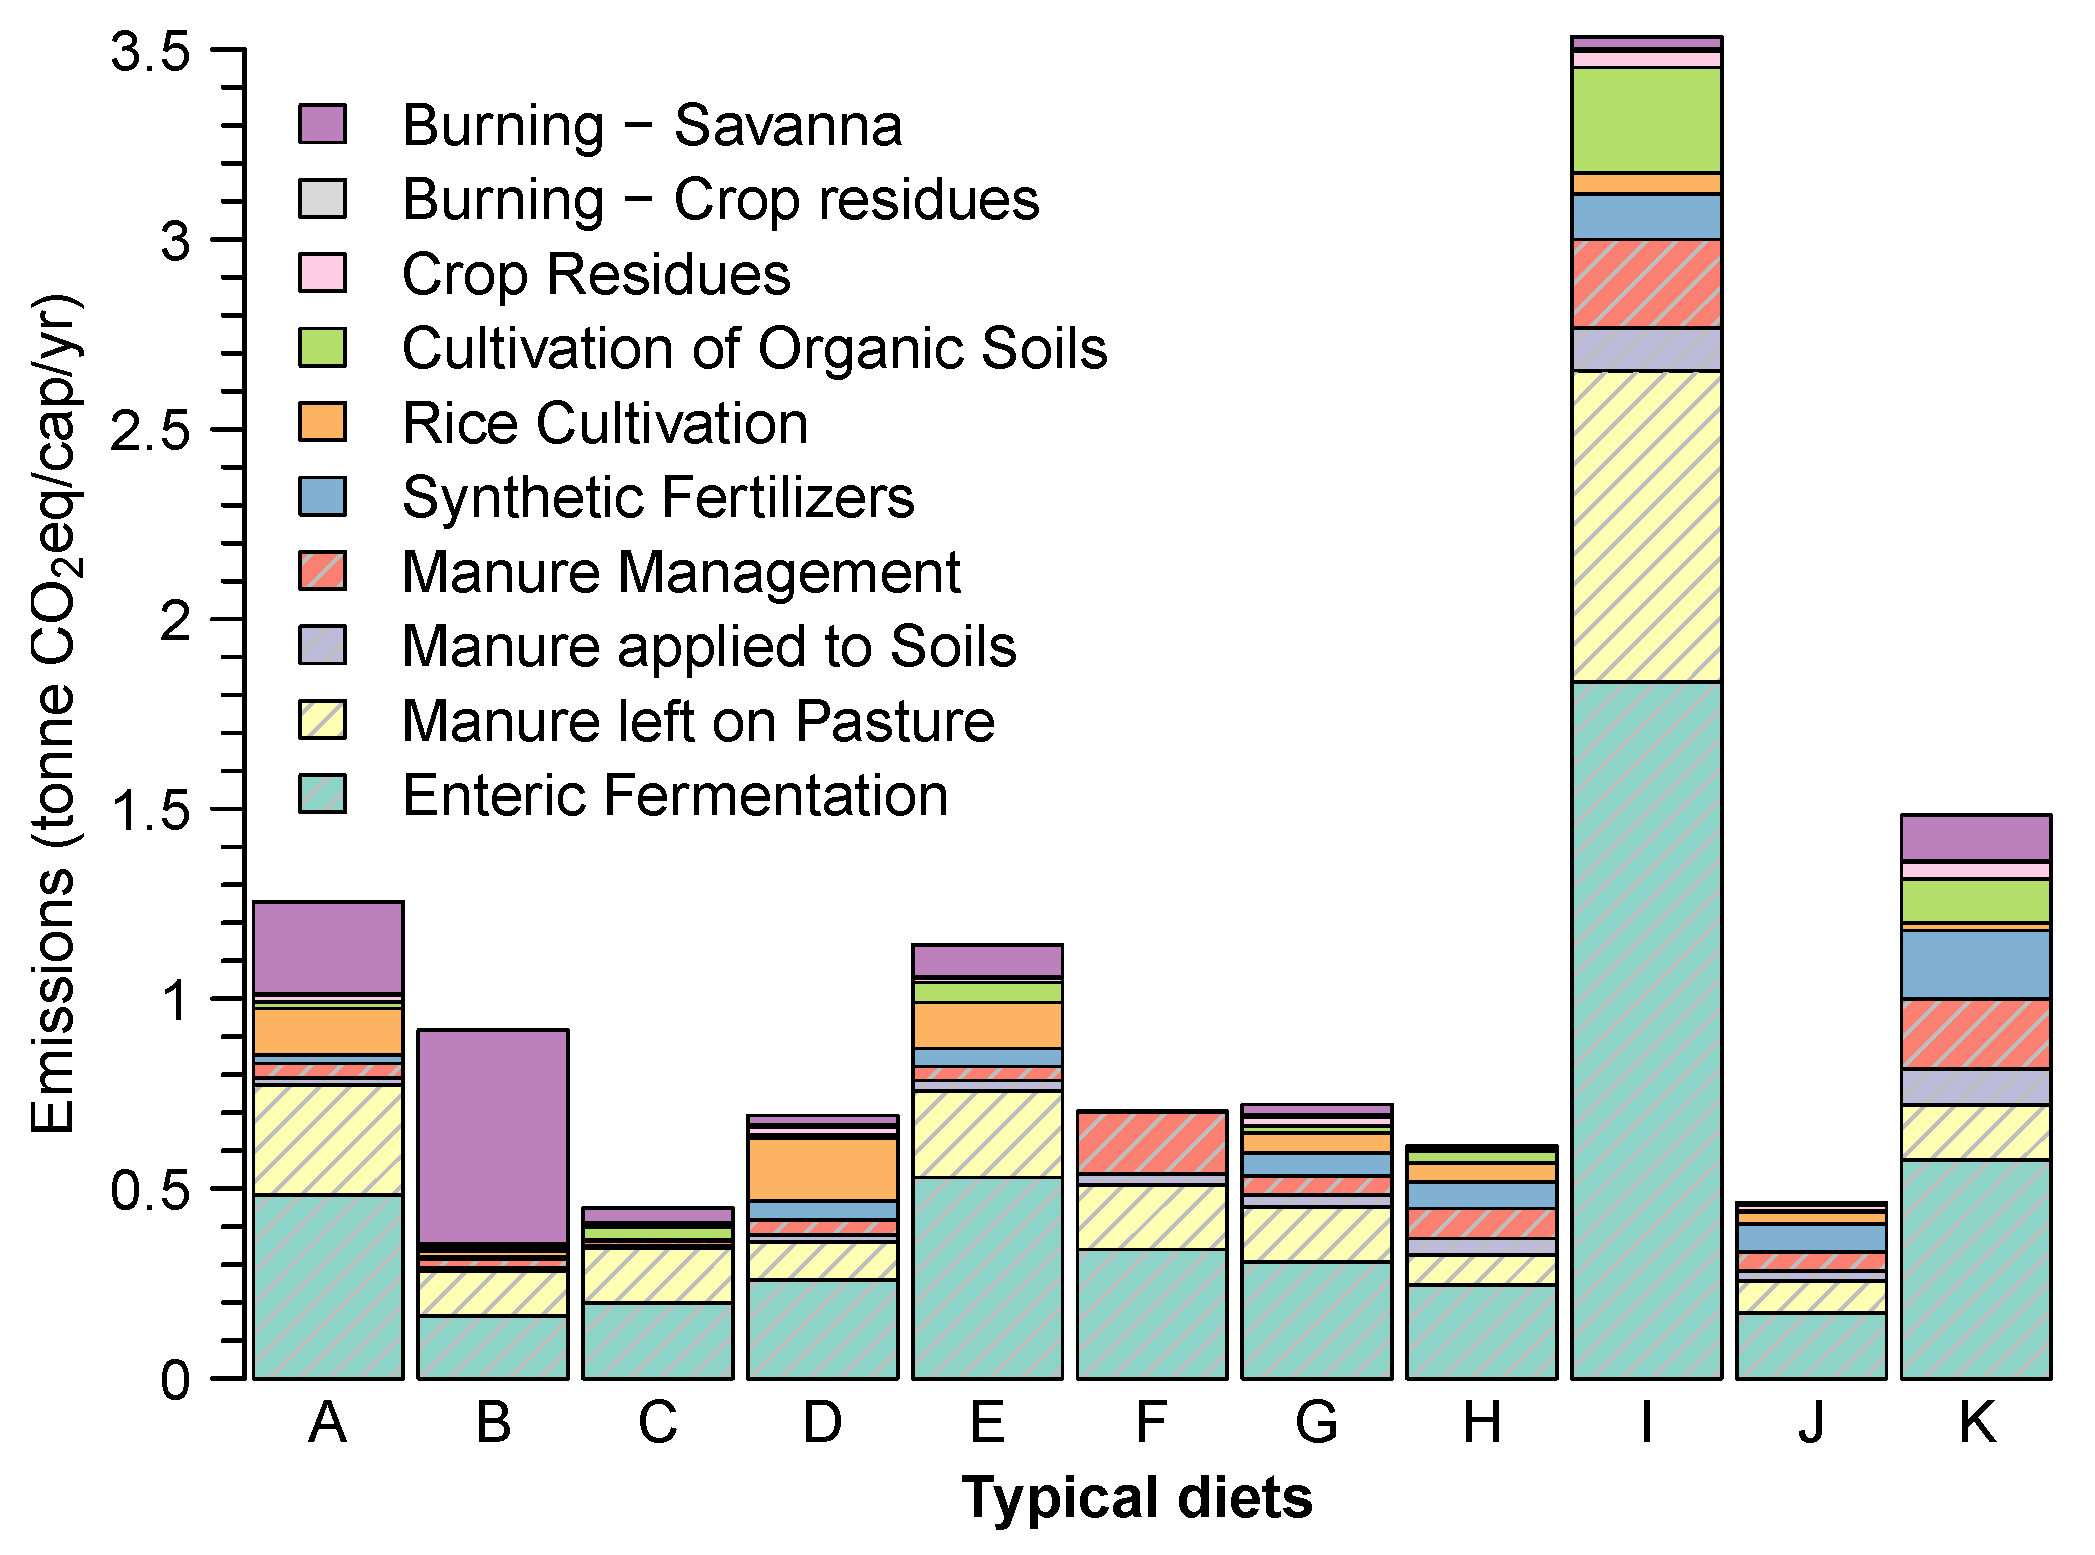
3.4. Embodied Greenhouse Gas Emissions
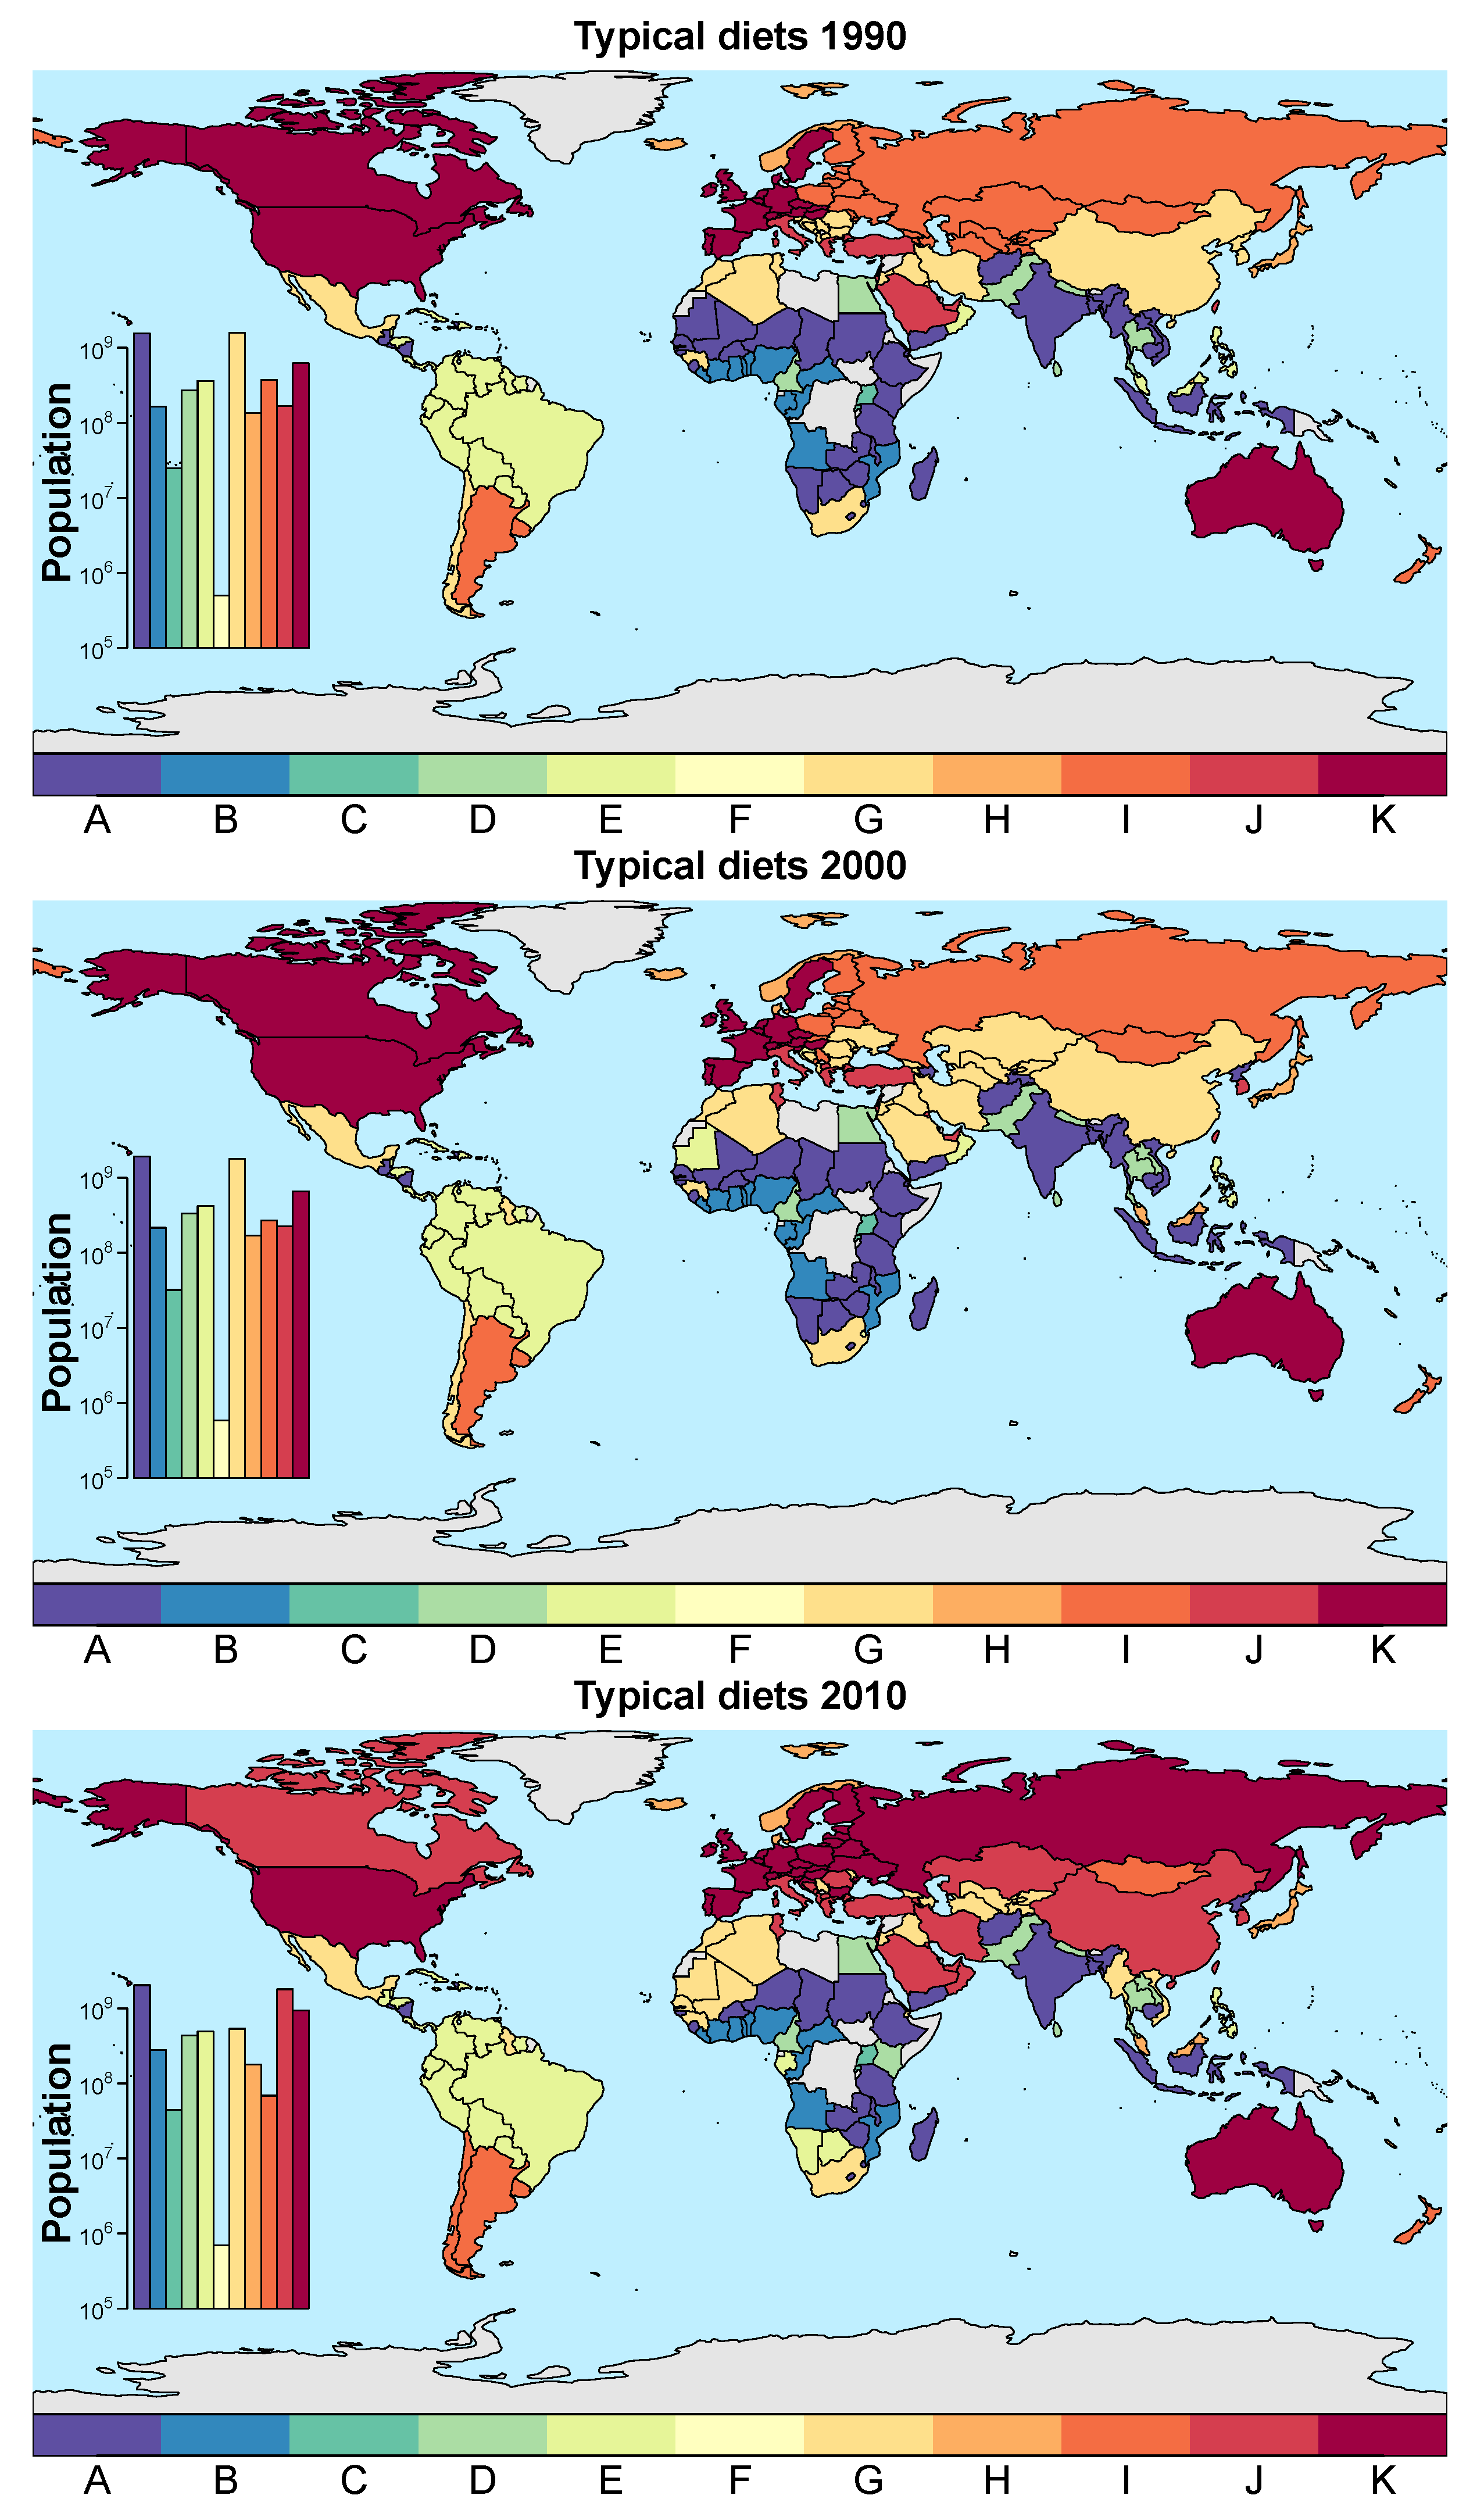
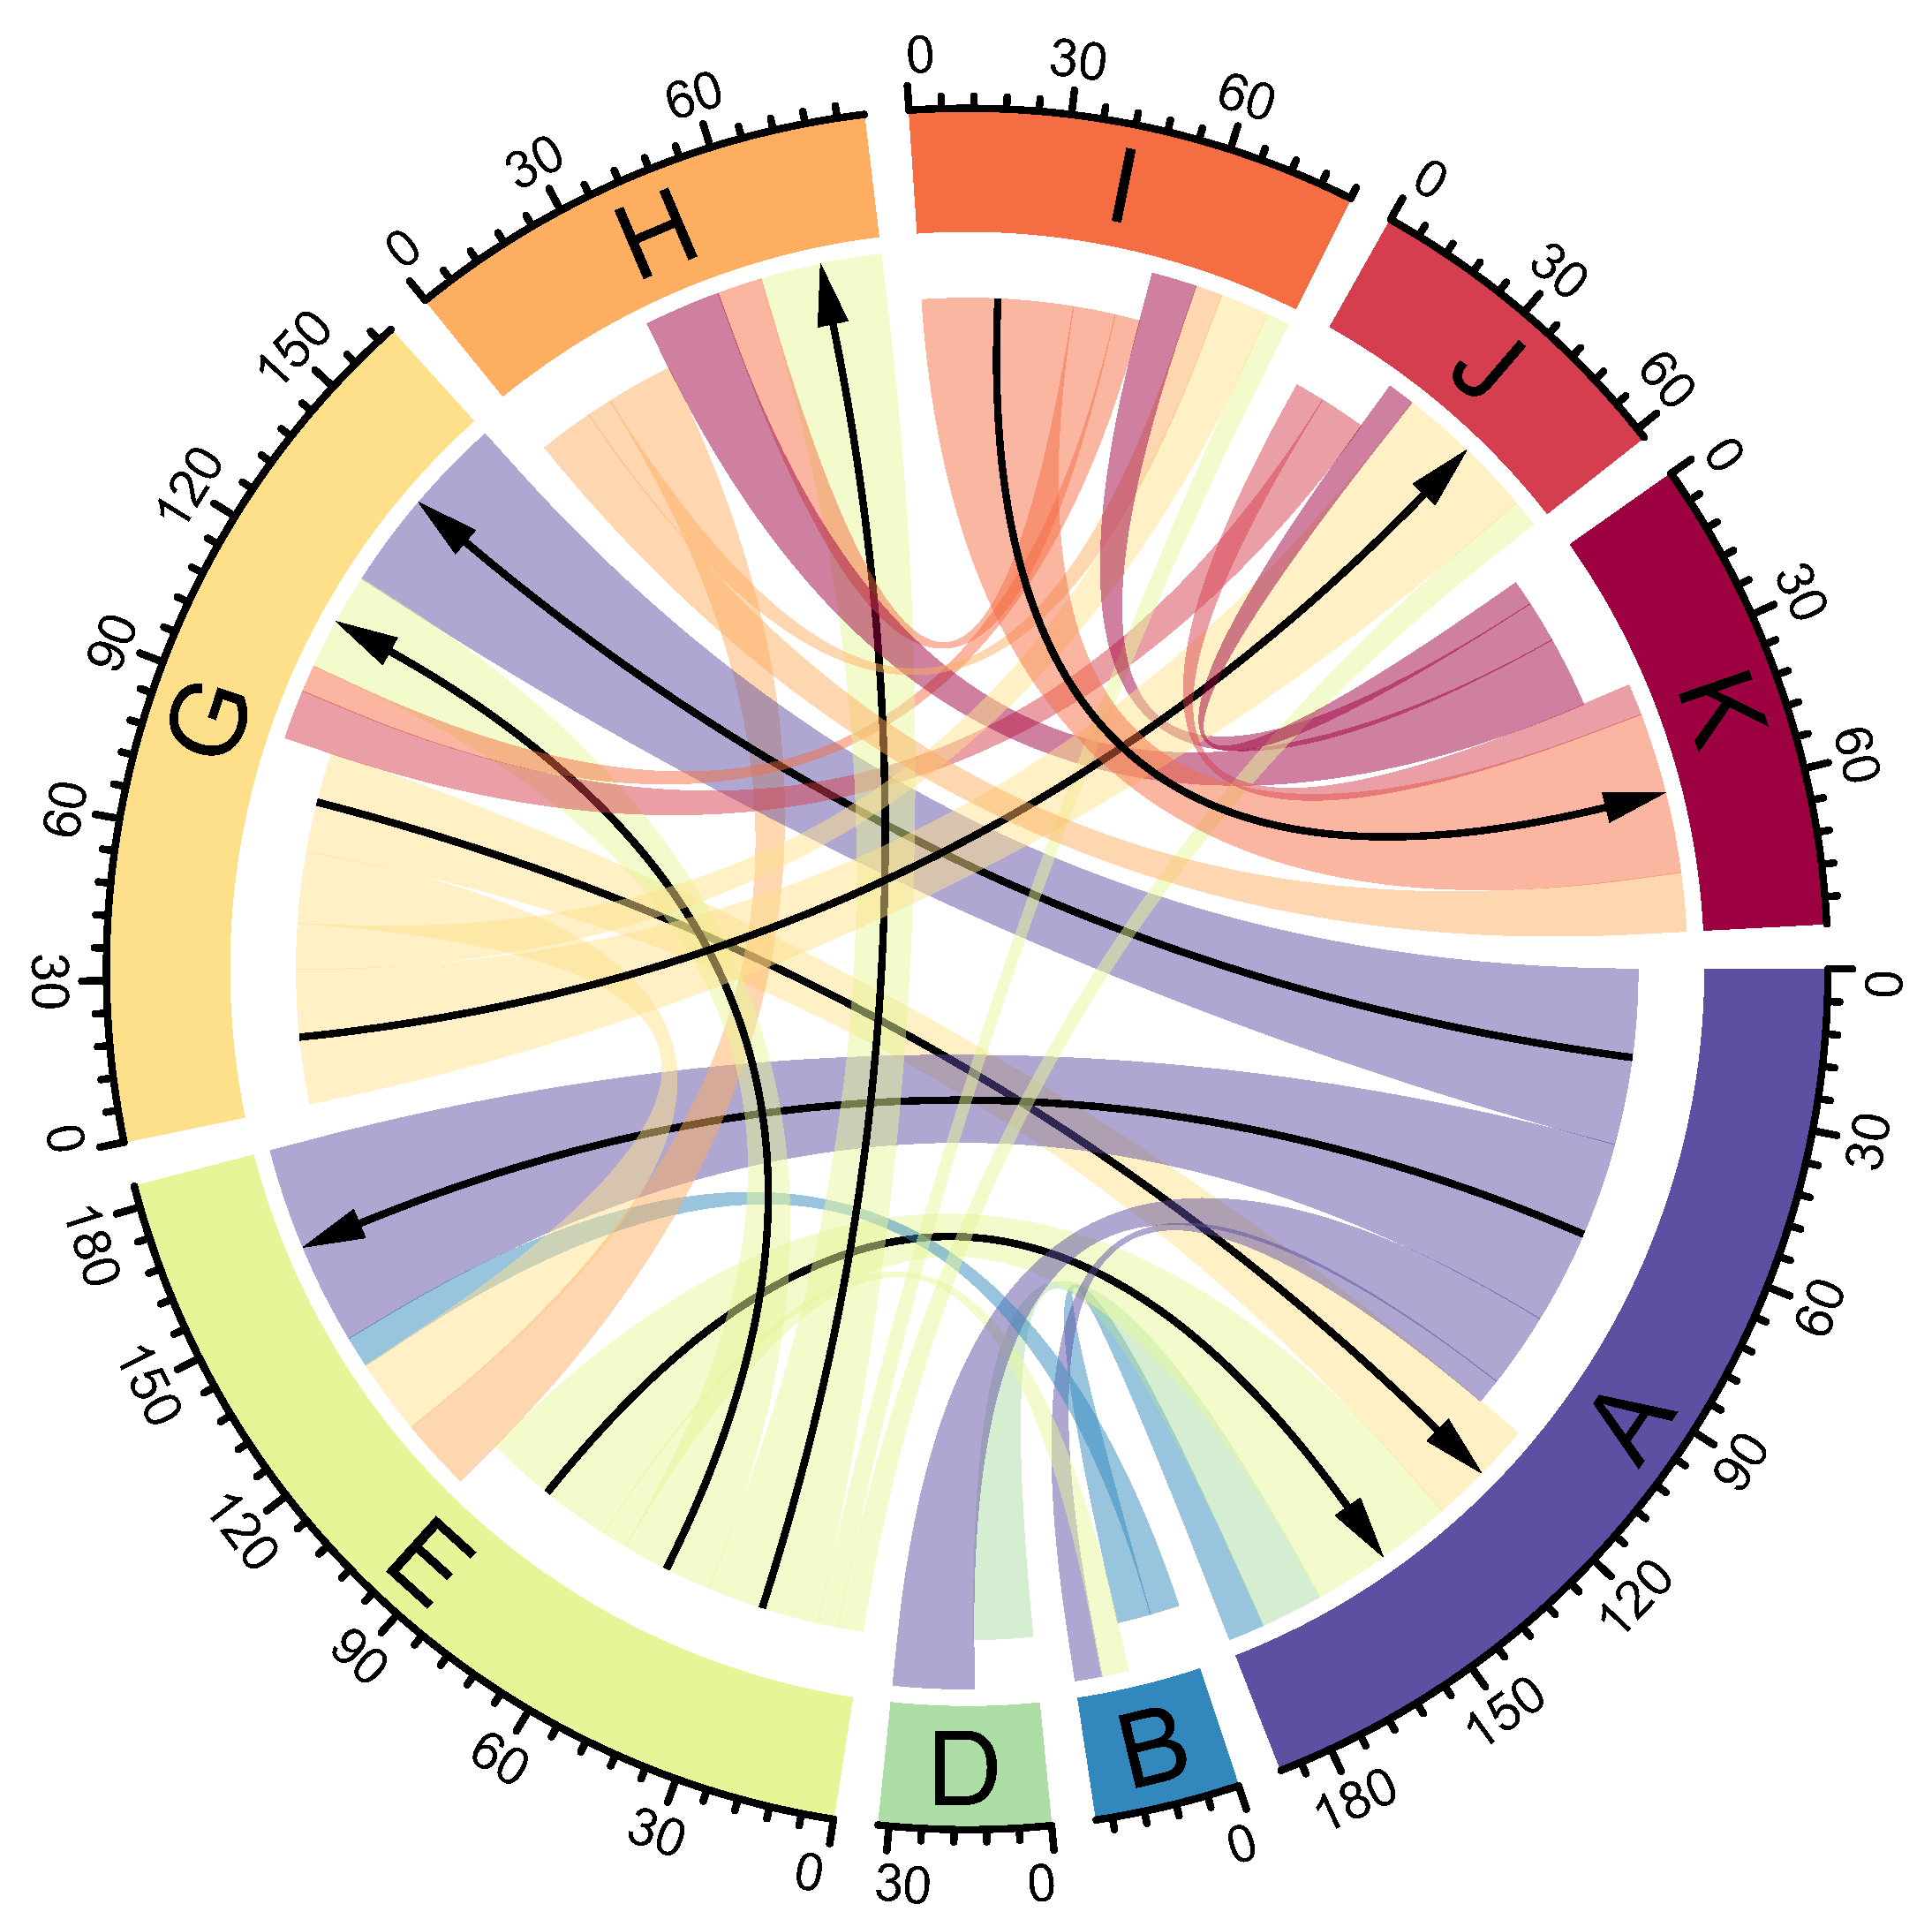
The production-phase agricultural GHG emissions associated with the diets do not provide a clear relation with the calorie supply (Figure 6) due to the lower emission intensities in countries consuming high-calorie diets and vice-versa [4,20]. Diets I and K, consisting of greater than 3000 kcal/cap/day with around 30% of calories from animal origins, embody GHG emissions of 3.3 t CO 2 eq/cap/yr and 1.4 t CO 2 eq/cap/yr, respectively. Diets A and E, containing less than 2500 kcal/cap/day, emit around 1 t CO 2 eq/cap/yr. Embodied emissions in the rest of the diets vary between 0.4 t CO 2 eq/cap/yr and 0.7 t CO 2 eq/cap/yr, irrespective of calorie content and diet composition.
The contribution of emissions from different agricultural sub-domains varies across the diets depending on the diet composition (Figure S6). In most diets (except B), the livestock sector shares more than 60% of the agricultural emissions due to enteric fermentation and manure. Within the livestock sector, enteric fermentation is the major contributor. Rice cultivation shares at least 7% of the embodied emissions in the diets A, D, G, and J, which consist of at least 1000 kcal/cap/day of cereals.
The embodied emissions in the diets also vary according to agricultural practices. Savanna burning contributes to around 20% (0.24 t CO 2 eq/cap/yr) and 60% (0.56 t CO 2 eq/cap/yr) of the embodied emissions in diets A and B. Emissions from synthetic fertilizers contribute to at least 0.7 t CO 2 eq/ cap/yr in the diets H–K, which are composed of more than 2800 kcal/cap/day. These emissions from synthetic fertilizers reflect high-input agriculture for producing these diets. Around 8% of the embodied emissions in diets I and K are contributed by cultivation of organic soils, which is associated with nitrous oxide emissions from drained histosols in croplands and grasslands [31].

3.5. Diet Shifts

The global nutrition status has improved during the last five decades (Figure 2 and Figure 7, Figure S1). Between 1961 and 2013, the share of the global population consuming the low-calorie diets (A–C), consisting of less than 2200 kcal/cap/day, decreased from 61% to 31%. Out of these three diets, two diets contain less than the required dietary energy and recommended amount of fruits and vegetables. Protein and fat contents in these diets are close to or less than the lower bound of the RHD. In contrast to the percentage, the absolute number of the population with these diets increased from 1.8 billion to 2.2 billion in the same period, reflecting that many people still suffer from undernourishment and hunger [1,7]. In 2013, many countries in South Asia and sub-Saharan Africa consumed these diets.
Globally, food consumption is changing towards high-calorie diets, composed of a large share of animal-source foods, sugar and sweeteners, and oils. The share of the global population consuming the high-calorie diets (H–J), consisting of more than 2800 kcal/cap/day, increased from 17% (540 million people) to 46% (3260 million people) between 1961 and 2013. These four diets contain calories higher than the dietary energy requirements, amounts fats, sugar, and red meat larger than those of the RHD, and not enough fruits and vegetables. Around 50% of the population consuming these diets are either suffering from overweight or obesity. In 2013, many countries in North America, South America, Europe, East Asia, and Australasia consumed these diets.
Diet shifts are occurring as a gradual process across the world, which follows similar pathways from low- to high-calorie diets, transitioning through the diets (D–G) that consist of between 2400 and 2800 kcal/cap/day (Figure 7). Although the share of the global population consuming these four diets remained around 22% between 1961 and 2013, the number of people increased from 660 million to 1560 million. Among the four diets, E and G are the main transition points. We observed more than 40 diet shifts from low-energy diets (mostly A) to diets E and G during the last five decades. Similarly, more than 40 diet shifts occurred from diet E and G to energy-dense diets (H–K). Diets C and F are isolated, with one or no shift from and to these diets.

4. Discussion

Our study provides several novel contributions to understanding the interplay of diets, health, and climate change for the last five decades. First, we systematically identify diets and diet shifts based on global food and nutrition supply data. The number of diets we identified (11 diets) varies slightly from that of Pradhan et al. [20] (16 diets). This is because we apply a linear approach (k-means clustering) in contrast to a non-linear method, Self-Organizing Map with Topological Product, used by Pradhan et al. [20]. Since the supply of calories has a linear relation with the supply of macro-nutrients, i.e., carbohydrates, proteins, and fats (see Equation (2), we chose the linear approach to identify the typical diets. Additionally, we update the study of Pradhan et al. [20], which only accounts for the supply of calories between 1961 and 2007, by considering the supply of calories and macro-nutrients between 1961 and 2013. Our study also divides animal-source food into ruminants, non-ruminants, and aquatic products, which were treated as a single category in the previous study.
Second, our study compares the 11 identified diets with the recommended healthy diet. Several studies have emphasized the importance of balanced diets for healthy lifestyles [12,15]. In this line, we highlight that the typical diets deviate from the RHD in terms of one or more measures. The diets consist either too much (e.g., sugar and red meat) or too little (e.g., fruits and vegetables) of food and nutrition supply. Willett et al. [12] also reported similar findings. The consumption of red meat is excess the recommended value in most of the world’s regions. In contrast, consumption of vegetables, fruits, legumes, whole grains, and nuts is below the recommended value. For associating diets with health, we considered recommendations for carbohydrates, fats, and proteins in addition to fruits and vegetables, red meat, sugar, and calories accounted for by Springmann et al. [15]. Our study also relates the diets with the distribution of BMI categories. Prevalence of underweight, normal weight, overweight, and obesity are highly related to the number of calories and composition of diets. Therefore, changes in diet composition are essential in most countries, regardless of their current development status. These changes will ensure food security as envisioned by Sustainable Development Goal 2 (“Zero hunger”) by eliminating all forms of malnutrition.
Third, our study presents GHG emissions embodied in diets, considering different agricultural emission sub-domains. In agreement with previous studies, we highlight that consumption of animal-source foods, mainly ruminant-source ones, is the major source of agricultural emissions. More than 60% of GHG emissions embodied in the diets comes from livestock sources. The IPCC special report on Climate Change and Land highlights that livestock contributes to two-thirds of the global agricultural emissions within farm gates [3]. Therefore, on the demand side, limiting the consumption of animal-source foods is a climate change mitigation option that is also a component of a healthy lifestyle. This consumption reduction holds especially for red meat, the intake of which is higher than the recommended value in six out of the 11 diets. These diet changes towards sustainable and healthy diets are an example of climate change response options with climate change adaptation and mitigation synergies [6]. Additionally, reducing food waste and limiting food consumption within the RHD will also reduce the embodied emissions.
Our study additionally shows a similar amount of embodied emissions in most of the diets. This similarity is due to the lower agriculture emission intensities in the countries consuming high-calorie diets in comparison to the countries with low-calorie diets [4,20]. The countries consuming low-calorie diets need to improve their farming practices for reducing their emission intensities. In such cases of high emission intensities, closing yield gaps and agricultural intensification would be an option for climate change mitigation [20,41,42]. However, diet changes toward sustainable and healthy diets and food waste reduction need to go hand in hand with improvements in agricultural efficiencies. Otherwise, agricultural emissions and embodied emissions in diets could not be lowered only with efficient agriculture. The rebound effects associated with diet shifts towards high-calorie diets and increases in food waste could even lead to inefficient food systems.
Although our study provides clear findings, they come along with some caveats, implied from the data sources and chosen methodology. The data we use to identify diets refer to food availability per person in the country, but not actual food consumption [4]. Thus, the identified diets may consist of food waste [10]. We account for food waste while comparing the amounts of fruits, vegetables, and red meat in diets with the those of the RHD. Our estimates on embodied emissions in diets are production-based. When consumption-based emissions are considered, the embodied emissions may increase for import-dependent countries but may decrease for exporting countries [43]. So far, a dataset on consumption-based emissions accounting for different agricultural sub-domains is not publicly available. Additionally, we associate BMI only with diets in this study. This limitation could be improved by also considering the physical activity levels.
Summing up, our study reflects the current situation where diets in most countries are unhealthy. Diets either contain an excessive amount of food and nutrient that needs to be limited (e.g., sugar and red meat) or do not contain an adequate amount of essential ones (e.g., fruits and vegetables). Thus, the development of a healthy diet index that compares the current food and nutrition supply with that of the RHD will be the next step in contributing to shifting diets towards healthy lifestyles. Another step would be to classify diets according to the food groups provided by different healthy dietary guidelines, e.g., the Harvard University Healthy Eating Plate model and the Eat-Lancet report. Similarly, the plant-source foods can be grouped into C3 and C4 plants that adapt differently to climate change, or irrigated or rain-fed crops that have different carbon and water footprints. Additionally, diets need to be sustainable as well, both from the production and consumption perspectives. Diets embody emissions generated during their production, processing, distribution, and consumption. Hence, sustainable and healthy diets synergize purposes of both nourishing the population and, at the same time, to reducing agricultural environmental impacts, which are crucial to achieving Sustainable Development Goals and the Paris Agreement.

Supplementary Materials

The following are available online at https://www.mdpi.com/2071-1050/12/9/3878/s1, Figure S1. We determine 11 clusters to represent the food supply data based on the elbow and silhouette method based on 100 iterations. The elbow at k equals 10 is ambiguous. Therefore, we additionally apply the silhouette method to choose the right cluster number, Figure S2. The calorie shares of different food groups vary in the diets. The animal source foods, consisting of aquatic (Aqua.), ruminants (Rum.) and non-ruminants (Nrum.) products, contribute to more than 20% of calorie share in the energy-dense diets, composed of larger than 2800 kcal/cap/day (H–K), Figure S3. Plant and animal protein content varies among the diets. A larger share of proteins is contributed by animal sources in the energy-dense diets, composed of larger than 2800 kcal/cap/day (H–K). The red dots represent the average amount of proteins based on the recommended healthy diet (RHD) and the dietary energy requirements, Figure S4. Fat from animal source foods varies among the diets. A larger share of fats is contributed by animal source foods in the energy-dense diets composed of larger than 2800 kcal/cap/day (H–K). The red dots represent the average amount of fats based on the recommended healthy diet (RHD) and the dietary energy requirements, Figure S5. The contributions of the agricultural emissions sub-domains to the total agricultural emissions differ according to the diets. In most of the diets, the livestock sector contributes a larger share of emissions than crop production (shaded lines), Gif S1. World maps show the spatial distribution of the diets between 1961 and 2013. In recent decades, countries are mostly shifting for low-energy diets (A–C) to energy-dense diets (H–K). Grey color represents countries with no data.

Author Contributions

Conceptualization: P.P. and J.P.K.; Software, Methodology, Writing–Original Draft, Formal analysis: P.P.; Writing–Reviewing and Editing: J.P.K. All authors have read and agreed to the published version of the manuscript.

Funding

P.P. acknowledges funding from the German Federal Ministry of Education and Research (BMBF) for the SUSFOOD project (grant agreement No 01DP17035) and the German Federal Ministry for the Environment, Nature Conservation, Building, and Nuclear Safety for the I-CCC project (Contract No 81227263).

Acknowledgments

We are thankful to Diego Rybski for the valuable comments and suggestions on our study.

Conflicts of Interest

The authors declare no conflict of interest.The funders had no role in the design of the study; in the collection, analyses, or interpretation of data; in the writing of the manuscript, or in the decision to publish the results.

References

  1. FAO; IFAD; UNICEF; WFP; WHO. The State of Food Security and Nutrition in the World 2018: Building Climate Resilience for Food Security and Nutrition; FAO: Rome, Italy, 2018; p. 181. [Google Scholar]
  2. Abarca-Gómez, L.; Abdeen, Z.A.; Hamid, Z.A.; Abu-Rmeileh, N.M.; Acosta-Cazares, B.; Acuin, C.; Adams, R.J.; Aekplakorn, W.; Afsana, K.; Aguilar-Salinas, C.A.; et al. Worldwide trends in body-mass index, underweight, overweight, and obesity from 1975 to 2016: A pooled analysis of 2416 population-based measurement studies in 128· 9 million children, adolescents, and adults. Lancet 2017, 390, 2627–2642. [Google Scholar] [CrossRef] [Green Version]
  3. Mbow, C.; Rosenzweig, C.; Barioni, L.G.; Benton, T.G.; Herrero, M.; Krishnapillai, M.; Liwenga, E.T.; Pradhan, P.; Rivera-ferre, M.G.; Sapkota, T.; et al. Food Security. In Climate Change and Land: An IPCC Special Report on Climate Change, Desertification, Land Degradation, Sustainable Land Management, Food Security, and Greenhouse Gas Fluxes in Terrestrial Ecosystems; Shukla, P., Skea, J., Buendia, E.C., Masson-Delmotte, V., Pörtner, H.O., Roberts, D., Zhai, P., Slade, R., Connors, S., van Diemen, R., et al., Eds.; Cambridge University Press: Cambridge, UK, 2019; Chapter 5; pp. 437–550. [Google Scholar]
  4. FAO. FAOSTAT 2014, FAO Statistical Databases: Agriculture, Fisheries, Forestry, Nutrition; FAO: Rome, Italy, 2017. [Google Scholar]
  5. Rost, S.; Gerten, D.; Bondeau, A.; Lucht, W.; Rohwer, J.; Schaphoff, S. Agricultural green and blue water consumption and its influence on the global water system. Water Resour. Res. 2008, 44. [Google Scholar] [CrossRef] [Green Version]
  6. Rosenzweig, C.; Mbow, C.; Barioni, L.G.; Benton, T.G.; Herrero, M.; Krishnapillai, M.; Liwenga, E.T.; Pradhan, P.; Rivera-Ferre, M.G.; Sapkota, T.; et al. Climate change responses benefit from a global food system approach. Nat. Food 2020, 1, 1–4. [Google Scholar] [CrossRef]
  7. Development Initiatives. Global Nutrition Report 2017: Nourishing the SDGs; Development Initiatives: Bristol, UK, 2017. [Google Scholar]
  8. Godfray, H.C.J.; Beddington, J.R.; Crute, I.R.; Haddad, L.; Lawrence, D.; Muir, J.F.; Pretty, J.; Robinson, S.; Thomas, S.M.; Toulmin, C. Food security: The challenge of feeding 9 billion people. Science 2010, 327, 812–818. [Google Scholar] [CrossRef] [PubMed] [Green Version]
  9. Kriewald, S.; Pradhan, P.; Costa, L.; Ros, A.G.C.; Kropp, J.P. Hungry cities: How local food self-sufficiency relates to climate change, diets, and urbanisation. Environ. Res. Lett. 2019, 14, 094007. [Google Scholar] [CrossRef]
  10. Hiç, C.; Pradhan, P.; Rybski, D.; Kropp, J.P. Food surplus and its climate burdens. Environ. Sci. Technol. 2016, 50, 4269–4277. [Google Scholar] [CrossRef] [Green Version]
  11. Bajželj, B.; Richards, K.S.; Allwood, J.M.; Smith, P.; Dennis, J.S.; Curmi, E.; Gilligan, C.A. Importance of food-demand management for climate mitigation. Nat. Clim. Chang. 2014, 4, 924. [Google Scholar] [CrossRef] [Green Version]
  12. Willett, W.; Rockström, J.; Loken, B.; Springmann, M.; Lang, T.; Vermeulen, S.; Garnett, T.; Tilman, D.; DeClerck, F.; Wood, A.; et al. Food in the Anthropocene: The EAT–Lancet Commission on healthy diets from sustainable food systems. Lancet 2019, 393, 447–492. [Google Scholar] [CrossRef]
  13. Biesbroek, S.; Bueno-de Mesquita, H.B.; Peeters, P.H.; Verschuren, W.M.; van der Schouw, Y.T.; Kramer, G.F.; Tyszler, M.; Temme, E.H. Reducing our environmental footprint and improving our health: Greenhouse gas emission and land use of usual diet and mortality in EPIC-NL: A prospective cohort study. Environ. Health 2014, 13, 27. [Google Scholar] [CrossRef] [Green Version]
  14. Green, R.; Milner, J.; Dangour, A.D.; Haines, A.; Chalabi, Z.; Markandya, A.; Spadaro, J.; Wilkinson, P. The potential to reduce greenhouse gas emissions in the UK through healthy and realistic dietary change. Clim. Chang. 2015, 129, 253–265. [Google Scholar] [CrossRef]
  15. Springmann, M.; Godfray, H.C.J.; Rayner, M.; Scarborough, P. Analysis and valuation of the health and climate change cobenefits of dietary change. Proc. Natl. Acad. Sci. USA 2016. [Google Scholar] [CrossRef] [PubMed] [Green Version]
  16. WHO. Diet, Nutrition, and the Prevention of Chronic Diseases: Report of a Joint WHO/FAO Expert Consultation; World Health Organization (WHO): Geneva, Switzerland, 2003; Volume 916. [Google Scholar]
  17. WCRF; AICR. Food, Nutrition, Physical Activity, and the Prevention of Cancer: A Global Perspective; American Institute for Cancer Research (AICR): Washington, DC, USA, 2007; Volume 1. [Google Scholar]
  18. Thilsted, S.H.; Thorne-Lyman, A.; Webb, P.; Bogard, J.R.; Subasinghe, R.; Phillips, M.J.; Allison, E.H. Sustaining healthy diets: The role of capture fisheries and aquaculture for improving nutrition in the post-2015 era. Food Policy 2016, 61, 126–131. [Google Scholar] [CrossRef] [Green Version]
  19. Herrero, M.; Havlík, P.; Valin, H.; Notenbaert, A.; Rufino, M.C.; Thornton, P.K.; Blümmel, M.; Weiss, F.; Grace, D.; Obersteiner, M. Biomass use, production, feed efficiencies, and greenhouse gas emissions from global livestock systems. Proc. Natl. Acad. Sci. USA 2013, 110, 20888–20893. [Google Scholar] [CrossRef] [Green Version]
  20. Pradhan, P.; Reusser, D.E.; Kropp, J.P. Embodied greenhouse gas emissions in diets. PLoS ONE 2013, 8, e62228. [Google Scholar] [CrossRef] [PubMed] [Green Version]
  21. FAO. Global Food Losses and Food Waste—Extent, Causes and Prevention; FAO: Rome, Italy, 2011; p. 38. [Google Scholar]
  22. Macqueen, J. Some methods for classification and analysis of multivariate observations. In Proceedings of the 5-th Berkeley Symposium on Mathematical Statistics and Probability, Berkeley, CA, USA, 21 June–18 July 1967; pp. 281–297. [Google Scholar]
  23. Zhou, B.; Rybski, D.; Kropp, J.P. On the statistics of urban heat island intensity. Geophys. Res. Lett. 2013, 40, 5486–5491. [Google Scholar] [CrossRef]
  24. Kok, M.; Lüdeke, M.; Lucas, P.; Sterzel, T.; Walther, C.; Janssen, P.; Sietz, D.; de Soysa, I. A new method for analysing socio-ecological patterns of vulnerability. Reg. Environ. Chang. 2016, 16, 229–243. [Google Scholar] [CrossRef] [Green Version]
  25. Ketchen, D.J., Jr.; Shook, C.L. The application of cluster analysis in strategic management research: An analysis and critique. Strat. Manag. J. 1996, 441–458. [Google Scholar]
  26. Rousseeuw, P.J. Silhouettes: A graphical aid to the interpretation and validation of cluster analysis. J. Comput. Appl. Math. 1987, 20, 53–65. [Google Scholar] [CrossRef] [Green Version]
  27. FAO. Food Energy—Methods of Analysis and Conversion Factors; FAO: Rome, Italy, 2003; p. 86. [Google Scholar]
  28. Kennedy, E. Dietary Diversity, Diet Quality, and Body Weight Regulation. Nutr. Rev. 2004, 62, S78–S81. [Google Scholar] [CrossRef]
  29. Kant, A.K.; Graubard, B.I. Energy density of diets reported by American adults: Association with food group intake, nutrient intake, and body weight. Int. J. Obes. 2005, 29, 950. [Google Scholar] [CrossRef] [Green Version]
  30. Nuttall, F.Q. Body mass index: Obesity, BMI, and health: A critical review. Nutr. Today 2015, 50, 117. [Google Scholar] [CrossRef] [Green Version]
  31. Tubiello, F.N.; Salvatore, M.; Rossi, S.; Ferrara, A.; Fitton, N.; Smith, P. The FAOSTAT database of greenhouse gas emissions from agriculture. Environ. Res. Lett. 2013, 8, 015009. [Google Scholar] [CrossRef]
  32. Pan, A.; Sun, Q.; Bernstein, A.M.; Schulze, M.B.; Manson, J.E.; Stampfer, M.J.; Willett, W.C.; Hu, F.B. Red meat consumption and mortality: Results from 2 prospective cohort studies. Arch. Int. Med. 2012, 172, 555–563. [Google Scholar]
  33. Slavin, J.L.; Lloyd, B. Health benefits of fruits and vegetables. Adv. Nutr. 2012, 3, 506–516. [Google Scholar] [CrossRef] [PubMed] [Green Version]
  34. Neumann, C.; Harris, D.M.; Rogers, L.M. Contribution of animal source foods in improving diet quality and function in children in the developing world. Nutr. Res. 2002, 22, 193–220. [Google Scholar] [CrossRef]
  35. Bwibo, N.O.; Neumann, C.G. The need for animal source foods by Kenyan children. J. Nutr. 2003, 133, 3936S–3940S. [Google Scholar] [CrossRef]
  36. Bodirsky, B.L.; Pradhan, P.; Springmann, M. Reducing ruminant numbers and consumption of animal source foods are aligned with environ-mental and public health demands. J. Sustain. Organ. Agric. Syst. 2019, 69, 25–30. [Google Scholar]
  37. Fehrenbach, K.S.; Righter, A.C.; Santo, R.E. A critical examination of the available data sources for estimating meat and protein consumption in the USA. Public Health Nutr. 2016, 19, 1358–1367. [Google Scholar] [CrossRef] [Green Version]
  38. Bernstein, A.M.; Sun, Q.; Hu, F.B.; Stampfer, M.J.; Manson, J.E.; Willett, W.C. Major dietary protein sources and the risk of coronary heart disease in women. Circulation 2010, 122, 876. [Google Scholar] [CrossRef] [Green Version]
  39. Lichtenstein, A.H.; Kennedy, E.; Barrier, P.; Danford, D.; Ernst, N.D.; Grundy, S.M.; Leveille, G.A.; Horn, L.; Williams, C.L.; Booth, S.L. Dietary fat consumption and health. Nutr. Rev. 1998, 56, 3–19. [Google Scholar] [CrossRef]
  40. SCAN. Carbohydrates and Health: Scientific Advisory Committee on Nutrition (SCAN); The Stationery Office (TSO): London, UK, 2011; p. 396. [Google Scholar]
  41. Burney, J.A.; Davis, S.J.; Lobell, D.B. Greenhouse gas mitigation by agricultural intensification. Proc. Natl. Acad. Sci. USA 2010, 107, 12052–12057. [Google Scholar] [CrossRef] [Green Version]
  42. Pradhan, P.; Fischer, G.; van Velthuizen, H.; Reusser, D.E.; Kropp, J.P. Closing yield gaps: How sustainable can we be? PLoS ONE 2015, 10, e0129487. [Google Scholar] [CrossRef] [PubMed] [Green Version]
  43. Davis, S.J.; Caldeira, K. Consumption-based accounting of CO2 emissions. Proc. Natl. Acad. Sci. USA 2010, 107, 5687–5692. [Google Scholar] [CrossRef] [PubMed] [Green Version]
Figure 1. The typical diets observed across the world between 1961 and 2013. The composition and the calorie content vary among the dietary patterns. The calorie content of the two diets (A,B) is lower than the dietary energy requirements (DERs, red dash). The animal-source foods are divided into aquatic (Aqua.), ruminant (Rum.), and non-ruminant (Nrum.) products.
Sustainability 12 03878 g001
Figure 2. World maps that show spatial distributions of the diets for 1990, 2000, and 2010. In recent decades, countries have mostly shifted from low-energy diets (A–C) to energy-dense diets (H–K). Gray color represents countries with no data.
Sustainability 12 03878 g002
Figure 3. Fruit and vegetable (green bar) and red meat (red bar) contents in the diets mostly do not match with the recommended healthy diet (RHD) of at least 400 g/cap/day of fruits and vegetables (green dotted line) and the maximum of 300 g/cap/week of red meat (red dotted line). The shaded lines represent the average food waste of the respective food types.
Sustainability 12 03878 g003
Figure 4. Shares of macro-nutrients—sugar, proteins, fats, and carbohydrates (Carb.)—vary in the diets. The red dots represent the average shares of macro-nutrients based on the recommended healthy diet (RHD) and the dietary energy requirements, as well as their upper and lower bounds. The RHD suggests consuming less than 10%, 10–15%, 15–30%, and 55–75% of the dietary energy requirements from sugar, proteins, fats, and carbohydrates (including sugar), respectively.
Sustainability 12 03878 g004
Figure 5. Prevalences of obesity, overweight, normal weight, and underweight in males and females (with shading lines) differ across the world according to the diets. The countries with a food supply of less than 2300 kcal/cap/day have a lower prevalence of obesity and overweight but a higher prevalence of underweight and undernourishment (black dash).
Sustainability 12 03878 g005
Figure 6. Embodied greenhouse gas emissions in the diets vary in terms of contribution of the different agricultural emissions sub-domains. Shaded lines represent emissions from the livestock sector, which is responsible for a larger share of emissions within agriculture.
Sustainability 12 03878 g006
Figure 7. Diet shifts observed across the world between 1961 and 2013. The width of the links represents the observed number of diet shifts. The diet shifts with at least five observations are plotted. The direction of the diet shift is presented by shortening the position of the starting end of the link and by the arrow when the diet shift has occurred at least 20 times.
Sustainability 12 03878 g007

