Abstract
While researchers have long examined the relationship between corporate environmental responsibility (CER) and financial performance, the evidence remains inconclusive. Moreover, whether sustainable supply chain management plays a role in enhancing the financial performance of focal firms has yet to be fully investigated. As firms’ investment in CER often pays off in the long-term, applying multiple time horizons, short- to long-term considerations, is needed to determine the effects of CER. This study examined the role of CER in improving financial performance based on multiple time horizons. In particular, the effects of CER on financial performance were explored in terms of internal operations and supply chains. The moderating effects of regulatory stringency on the relationship between CER and a firm’s short- or long-term financial performance were also investigated. Firms’ CER was studied using carbon data from Trucost. Carbon footprint can be an appropriate proxy for CER, as it provides information on supply partners’ environmental concerns. A unique dataset of the carbon footprint of 714 North American firms in 19 industry sectors in 2003–2010 was used. The results indicated that firms benefit from CER not only in their internal operations but also in their supply chains in both the short and long-terms. The moderating effects of regulatory stringency were significant for CER only in terms of the supply chain but not for internal operations. In industries with a high level of regulatory stringency, the positive effects of CER on short-term financial performance in the supply chain become weaker, but the same effects on long-term financial performance become stronger. By investigating the effects of two distinct carbon footprint aspects on financial performance at different time horizons, this study sheds light on the importance of CER in firms’ internal operations and supply chains.
1. Introduction
Over the past decade, environmental awareness has increased. Corporate environmental responsibility (CER) has become increasingly important for academics and practitioners [1]. A long-standing debate in the business strategy literature has been the influence of environmental performance on firm profit. Whether the benefits of environmental sustainability outweigh the costs and risks is still unclear. The findings on the profit-generating effects of environmental sustainability have been mixed [2,3,4,5,6]. Some have asserted that CER entails costs and hinders economic performance [7,8]. Firms are likely to overlook profitable opportunities for improving environmental performance [9,10]. Others have argued that superior performance in the environmental arena provides a potential source for competitive advantage because it can bring to more efficient processes, improvements in productivity, lower costs of compliance, new market opportunities, and a strong positive reputation [11,12,13,14,15].
Firms are increasingly being pressured by their stakeholders to ensure the environmental sustainability of their suppliers [16]. The Organization for Economic Co-operation and Development (OECD) guidelines suggest that firms consider the environmental impact of not only their internal operations but also their supply chain partners [17]. In response to these environmental concerns, which extend beyond the boundaries of a firm, a growing number of firms have begun to include their supply chain partners in their implementation of CER. Walmart launched an ambitious sustainability program related to the energy efficiency of its supply chain. A U.K. retailer Sainsbury’s “20 × 20 Sustainability Plan” aimed to reduce the environmental impact of the carbon footprint of its supply chain. As firms place increasing emphasis on CER, major changes are expected to occur in their supply chains and internal operations [18].
Firms are being pressured to pursue environmental supply chain sustainability. However, the financial benefits are unclear. Little is known about the relationship between CER and firm performance when supply chain environmental responsibility is considered [19,20,21]. Previous studies on the effects of the integration of supply chain environmental responsibility on profit generation have had mixed results [22,23,24]. While researchers showed that focal firms’ sustainable supply-chain management (SSCM) practices positively influence financial performance [25], others suggested that participating in SSCM programs leads to the negative stock price reaction [20]. Bose and Pal [19] reported that not all the firms benefit from the SSCM initiatives and that the extent of economic benefit depends on the characteristics of the firm. The “pay to be green” discussion that embraces a broader perspective of firm boundaries is still at the nascent stage.
The financial benefits of the implementation of CER are often realized over the long term [19]. The existing research has been based mostly on short-term horizons. Thus, the studies on the relationship between CER and profitability have produced mixed results [4]. CER initiatives require initial investments that will not have a short-term payoff and the generated positive effects of CER initiatives may take years, therefore, short-term performance measures cannot reflect the effect [26]. Researchers pointed out the necessity of rejection of relying on single measures of financial performance to fully understand how firms’ socially responsible actions create value [27]. More careful approaches that apply multiple time horizons, i.e., short- to long-term considerations, are needed to determine the effects of CER in internal operations and supply chains on financial performance. This study extends the existing theories to develop hypotheses on the influence of CER on firm’s performance. Specifically, it considered CER in two distinct areas, i.e., internal operations and supply chains, to determine whether reduced environmental costs improve financial performance. To draw clearer conclusions, short- and long-term performance was explored. The study further examined whether the influence of CER of internal and supply chain on short- and long-term performance differs depending on regulatory stringency of industry.
To answer these research questions, the study elaborated hypotheses and empirically tested the model. A unique dataset that provides firm-level information regarding greenhouse gas (GHG) emissions was used. Growing environmental concerns about the carbon footprint of firms have attracted media attention. The carbon footprint is measured far beyond a focal firm’s boundaries [28,29,30]. A firm’s carbon footprint is defined as the total GHG emissions produced by its activities. The term also captures the GHG emissions generated by first-tier and other suppliers [31]. According to Apple’s [32] environmental responsibility reports indicated that the carbon footprint of the iPhone 6 was 95 kg of a carbon dioxide-equivalent of which 89 percent came from the supply chain, e.g., production (85%), transportation (3%), and recycling (1%). As more firms voluntarily participate in the Carbon Disclosure Project (CDP), a growing number have been disclosing information about the carbon footprint of their internal operations and supply chains. This study examined firms’ CER using carbon data from Trucost. Random effects models were applied to a panel of 714 North American firms in 19 industries over the 2003–2010 period. Random effects models were allowed for the estimation of time-invariant variables of interest, such as regulatory stringency.
The present study makes a contribution to the literature by applying the carbon footprint to the measurement of GHG emissions. Scholars have emphasized the need to apply outcome-based measures to the determination of the relationship between CER and financial performance [33,34]. Process-based measurements reflect a firm’s internal efforts to address environmental issues, and outcome-based measurements directly capture a firm’s environmental performance [35]. A firm’s efforts cannot guarantee that a reduction in the “true environmental cost” would affect its performance [36,37]. Outcome-based measures could provide a better understanding of the direct effects of CER on financial performance.
The remainder of this paper is structured as follows: The next section reviews some of the studies on the effects of CER and firm performance. It also introduces the main hypotheses. The third section presents the data and research design. The main results of the study are then discussed. Finally, the main findings are summarized, and the implications are discussed.
2. Literature Review and Hypotheses
2.1. Is Paying to Be Green Worth It?
CER can be considered as a part of CSR (Corporate Social Responsibility). Firms’ sustainable development includes three pillars: Economic, social, and environmental [38,39,40]. Among the three pillars of CSR, there has been a flow of research focused on the environmental aspect of CSR [4,12,41,42].
In the business strategy literature, the “pay to be green” debate has focused on the possibility of firms’ profiting from reducing their impact on the natural environment [6,43,44]. The findings on the profit-generating effects of environmental sustainability have been inconclusive [2,3,4]. Conventional argument adopted perspective seeing the issues as inevitable trade-offs between the social benefit and the private costs to firms. The classic Friedman’s [45] view is that environmental responsibility will dampen the economic benefits because of the associated substantial costs. On the other hand, Porter [13] criticized the conventional notion. He argued that environmental improvement-related innovation can reduce the cost of inefficient production and facilitate firm competitiveness. Porter and Van der Linde [14] asserted that a competitive advantage is dependent on innovation and improvement capacity, which removes constraints. Environmental issues could impose constraints, however, in many industries, they also offer opportunities to shift the competitive landscape [46]. However, Porter’s view has been challenged by arguing that environmental improvement-related innovation can be developed in unusual cases and is thus implausibly to create competitive advantages [47,48].
The “win-win” hypothesis suggests that firms can profit from the social benefit that accrues from improved environmental performance [49,50]. King and Lenox [50] found that only by preventing pollution can firms recognize inefficient processes, reduce unnecessary costs, and increase profits. Such conclusions are consistent with the natural resource-based view: A competitive advantage can be gained through the incorporation of environmental challenges into a firm’s resources [11].
According to the natural resource-based view, there are three sources of strategic capabilities: Pollution prevention, product stewardship, and sustainable development [11]. Most of the previous research has focused on pollution prevention, with an emphasis on environmental management, e.g., total quality environmental management, in a firm’s internal operations. Pollution prevention focuses on building new internal production and operations capabilities. Product stewardship highlights the stakeholders’ perspectives on the environmental impact. Thus, environmental improvement is integrated throughout the supply chain: From raw materials access to product disposal [11]. Stakeholders have increasingly focused on the practices of not only focal firms but also their extended supply chains [51]. As firms become more accountable for their suppliers’ environmental performance, their reputational risk increases with the suppliers’ poor management of environmental problems [52,53]. Researchers and managers have determined that firms and their supply chain partners should appraise their CER and financial performance [54]. However, few studies on the relationship between environmental performance and financial performance have included the role of the supply chain [2]. The findings on the relationship between profit generation and supply chain sustainability have been mixed [22,23,24]. Some findings suggested that integrating sustainability into focal firms’ supply chain management practices increase financial performance [25,55,56], while others argued that practices of supply chain sustainability may have uncertain or even negative influence on financial performance [57,58]. Some maintained that the extent of economic benefit depends on the characteristics of the firm [19]. They showed that firms with high R&D expenses, and early adopters benefit from participating in supply chain management practices. Because greener supply chains sometimes achieved at the expense of poorer business performance, such as poorer delivery and quality, significant planning and management of focal firms will be needed to avoid loss of profit [59]. Although sustainable supply chain management has received significant attention, firms are still debating the economic benefits it may yield.
2.2. Corporate Environmental Responsibility within the Boundaries of the Firm and Financial Performance
According to the natural resource-based view, the organizational capabilities for managing environmental problems can provide a competitive advantage [11]. It is inevitable that businesses will be more constrained by the natural environment in the near future, thus, those that focus on environmentally oriented resources and capabilities can gain competitive advantages. The capabilities to provide a firm’s competitive advantage depends on the environmental conditions in which it operates. Faced with external pressure to develop green business activities, implementing environmentally friendly business capabilities is becoming increasingly important for firms [42]. Therefore, to improve firm competitiveness, the adoption of a win-win strategy is necessary for harnessing the relationship between business and the environment [33].
Firms can start CER based on green product innovation and green process innovation [12]. In order to achieve green innovation, firms cannot only rely on existing capabilities. Firms need to disrupt the existing ways of doing and build new capabilities. Unlike in the past, when investment in the environmental activities was not necessary, increasing the strict environmental regulations have changed the way of competing rules and patterns of business [14,41]. Firms will have the socially required capabilities in the process of product development or product operation that consider the environment more.
Firms with high levels of environmental concern are likely to seek new opportunities [60,61]. The pursuit of environmental sustainability enables firms to increase their own benefits by charging premium prices and approaching new markets and consumer segments [62]. With the growing environmental problems, consumers have become more ecologically conscious in their preferences and purchasing behaviors [63,64,65]. Their willingness to make additional expenditures for environmentally friendly items has increased [66]. There are consumer groups that are willing to pay higher prices to protect the environment. Their consumption patterns are driven by environmental citizenship considerations. For firms, the existence of these groups justifies the additional costs of their environmentally friendly activities [67]. Rather than viewing this pressure to be green as an obstacle, some firms have already begun to take the opportunity to expand into new eco-friendly product categories or brands [68].
Firms can gain cost advantages by reducing environmental damage [14]. Previous studies have suggested that the environmental technology innovations that have resulted from environmental regulations can lower the cost of a product and enhance its value [14]. Environmental innovation minimizes production inefficiencies and facilitates the effective use of inputs. Significant cost savings can be achieved through the reduction of energy consumption, reuse of material, and redefinition of operation and production process [33,69,70].
Environmentally sustainable firms reduce risk, such as the possible higher costs from damage payments or fines and the lower sales resulting from reputation loss [52,71]. CER can reduce firm risk by providing insurance-like protection [72,73]. Responsible behavior earns stakeholder goodwill, which mitigates the effects of stakeholder sanctions in response to adverse events and, thus, financial risk [73,74]. A firm’s reputation affects not only the consumers but also the employees [75]. A corporate environmental reputation is relevant in employee recruitment and retention. Because employee turnover results in lost expertise and reduced productivity, the enhancement of employee commitment is critical to firm performance [76]. CER has been considered to be a determinant of employee commitment [77,78,79].
CER engagement is likely to reduce financial constraints and to provide easier access to financial markets [72,80]. With the emergence of socially responsible investing, institutional investors have been incorporating firms’ environmental data into their decisions [81]. Environmentally sustainable firms can gain access to financial aid and green capital [82].
In sum, a firm’s CER engagement can provide business opportunities and facilitate cost savings, risk reduction, reputation management, and financial resource assessment. These factors can contribute to improved performance. The discussion thus leads to the following hypothesis:
Hypothesis 1.
Corporate environmental responsibility in internal operations would be positively associated with financial performance.
2.3. Corporate Environmental Responsibility Beyond the Boundaries of Firms and Financial Performance
In recent years, firms have faced increasing pressure from stakeholders to ensure that their suppliers are also environmentally sustainable [20]. The main reason is that most environmental externalities tend to occur in the supply chain rather than in the firm itself [83]. Supply chain sustainability can be achieved when a focal firm secures that its upstream supply chain also concerns for the environmental aspects in their business activity [21,84,85]. Sustainable supply chain management becomes critical for firms that are vulnerable to stakeholder pressure [86]. Freeman’s [87] stakeholder theory suggests that firms can benefit from considering the interests of a broad range of stakeholders. Instrumental stakeholder theory, an important extension of stakeholder theory, proposed that CER efforts can be instrumental in obtaining stakeholder support [88]. Supply chain environmental sustainability enables a focal firm to obtain stakeholder support, which leads to improved performance.
A firm’s reputation depends on not only its own practices but also those of the firms in its extended supply chain [51]. When a supplier causes an environmental problem, its reputation is transferred, and this negatively affects the focal firm’s reputation. Focal firms increasingly rely on their supply network to handle increased customer expectations [89]. To decrease the risk of reputational spillover, many firms have begun to monitor their suppliers’ adherence to environmental standards [53].
Regardless of the external pressure by stakeholder groups, some firms proactively emphasize the importance of supply chain environmental sustainability for securing their own resources [86]. It has been argued that the promotion of environmental protection in the supply chain ensures long-term access to these resources [90]. Firm competitiveness depends on the ability to procure significant resources from the external environment [91].
According to Hart’s [11] natural resource-based view, the importance of environmental management principles has to be expanded to the supply chain. This is known as product stewardship, which encompasses activities, such as remanufacturing, reverse logistics, and product recovery. The implementation of such activities facilitates the recognition of inefficiencies in not only the firm’s processes but also the supply chain network. Focal firms are attempting to gain a competitive advantage by integrating their supply chain partners into environmental management processes (e.g. joint environmental goal setting, shared environmental planning) [60,89,92]. For example, Samsung Electronics joined the “Energy Mentorship Program for Small and Medium Enterprises” in April 2012 to collaborate with small- and medium-sized suppliers to improve energy efficiency through expertise transfer [93]. Samsung’s commitment to sustainable development in its supply chain resulted in increased resource sharing, which increases the focal firm’s knowledge about its supply chain network. As the example illustrates, the incorporation of ecological concerns into a business strategy could facilitate the recognition of inefficiencies in the supply chain and the focal firm’s internal operations.
CER is no longer an internal issue, rather, it is a matter of communication with business-related partners. Focal firms and their supply chain partners put collective efforts to achieve shared environmental goals [60]. This CER efforts facilitate the transfer and exchange of knowledge, thereby increasing efficiency in the entire business process [94]. Firms can increase productivity or lower costs by monitoring the supply chain partner firms’ environmental sustainability. Life cycle assessment (LCA) is a popular approach to quantifying the total environmental impact of product-related materials and energy throughout an extended supply chain [95]. Firms that adopt LCA have a greater potential to increase resource productivity because they are more likely to find cost-saving alternative sources (i.e., supply chains) [96].
Supply chain’s environmental sustainability enables a focal firm to obtain stakeholder support, to mitigate the risk of negative reputational spillover, to secure resources for the long term, to recognize inefficiencies, and to realize cost savings. This can facilitate improved performance. These arguments are captured in the following hypothesis:
Hypothesis 2.
Corporate environmental responsibility in the firm’s supply chain is positively associated with financial performance.
2.4. Moderating Effect of Regulatory Stringency on the Relationship Between Corporate Environmental Responsibility and Financial Performance
The cost of improving CER will not be uniformly incurred for every firm. The cost of maintaining CER differs because government regulations vary widely across industries in which each firm is embedded [97]. Stakeholders’ demand for firms’ sustainable efforts can vary depending on the business sector where firms are operating [98,99]. Thus, previous studies focused on the extent of industrial environmental regulation, which moderates the impact of a firm’s CSR activities on financial performance [80,99]. The market valuation of environmental performance was different depending on whether or not the firm belongs to environmentally sensitive industries.
Regulatory stringency results in compliance costs. The trade-offs between the social benefit and a firm’s private costs are likely to become more visible under stringent regulations [100]. Firms within a stringent regulation have greater exposure to the public policy process [101]. Industries that operate under very stringent environmental regulations are continually monitored by the media and the surrounding communities [102]. This is supported by the fact that firms in sensitive industries tend to disclose more on their environmental performance [103]. Therefore, the firms in these industries have a greater potential risk because of the high visibility of all aspects of the business (from their internal operations to their supply chains) that could affect the environment. If firms get too much pressure from the regulation, the ensuing cost to reduce environmental damage is difficult to offset by the potential benefits of CER in a short period [104].
One of the major challenges of focal firms faced in managing sustainable supply chains is difficulties in obtaining sufficient information of suppliers [105]. Researchers highlighted that effective information processing can be a prerequisite to supply chain management [106]. In a highly regulated industry, stronger management of suppliers will be needed, which will cost more to obtain sufficient information. The integration of supply chain partners’ environmental compliance could result in increasing time and costs of focal firms [107,108]. Ensuring supply chain partners are compliant with strong industry regulations required more time and costs to be invested. Managing sustainable supply chains incurred additional costs, such as setting up environmentally friendly policies, employee training, and community development [22]. The higher the level of compliance at the industrial level, the greater the cost. Some argued that the cost of raising a supplier’s CER can negatively affect a focal firm’s competitiveness [25]. Although firms’ efforts to minimize environmental damage can enhance their ability to recognize inefficient processes in their own businesses as well as their supply chains, short-term financial benefits are not guaranteed under stringent regulations [11,43].
Firms that have already made substantial investments in reducing environmental damage often face difficulties in making further improvements because of the need to adopt increasingly costly technologies and management programs [33,109,110]. Under less stringent environmental regulations, the least environmentally efficient firms can make improvements through small, relatively inexpensive changes [33]. Firms under more stringent environmental regulations will face higher marginal costs to improve their environmental performance.
Firms that have already incurred high regulatory compliance costs are less likely to increase productivity because of the additional costs of the environmental improvements in their internal operations or supply chains. Firms do not have infinite resources [111]. Thus, increasing CER expenditures means forgoing opportunities to generate profits from other strategic alternatives [4]. For firms under relatively more stringent regulations, the incorporation of ecological concerns into their own and their supply partners’ business activities could impede the core activities, which would be highly related to maximizing efficiencies and gaining short-term competitive advantages [2]. Managing environmental issues beyond those addressed by regulations can contradict productivity, and this can, in turn, reduce firm performance. The positive effects of CER on short-term performance could diminish under regulatory stringency. The discussion thus leads to the following hypotheses:
Hypothesis 3a.
Regulatory stringency would weaken the relationship between corporate environmental responsibility in internal operations and short-term financial performance.
Hypothesis 3b.
Regulatory stringency would weaken the relationship between corporate environmental responsibility in the supply chain and short-term financial performance.
In highly regulated industries, short-term performance can initially deteriorate because of the high costs, higher marginal costs, and relative difficulty in building a reputation for being environmentally responsible. However, the firms that invest heavily in CER perform well in the long run. Greater regulatory pressures guide firms where they have to concentrate on [112]. The industrial norms make it more attractive for firms to engage in environmentally responsible activities [113]. It has been argued that the relatively high costs of compliance with stringent regulations can initially be a burden, however, firms benefit from being able to offset these costs over time [13,114]. The eco-friendly technology that is necessary for regulatory compliance can enhance competitiveness in the long term [13].
As stakeholder theory suggests, the effective management of environmental responsibility can result in a positive reputation among stakeholders. Increasingly, stakeholder coalitions are being formed to demand more transparency around environmental damage [115]. The increasing stakeholder demands for CER are not limited to firms’ internal operations, they also apply to their supply chains. With the significant effects of supply chain management on value creation has come an increased demand for transparency in the supply chain [116,117]. To reflect the stakeholders’ growing interest in the environment, a firm’s commitment to environmental issues in its internal operations and supply chain could be beneficial after the core concerns (e.g., cost, quality, and faster time to market) have been resolved [118].
Regulatory stringency could hinder the positive effects of CER on firms’ short-term financial performance, however, it could have long-term benefits.
Hypothesis 4a.
Regulatory stringency would strengthen the relationship between corporate environmental responsibility in internal operations and long-term financial performance.
Hypothesis 4b.
Regulatory stringency would strengthen the relationship between corporate environmental responsibility in the supply chain and long-term financial performance.
Figure 1 graphically depicts the hypotheses of this study.
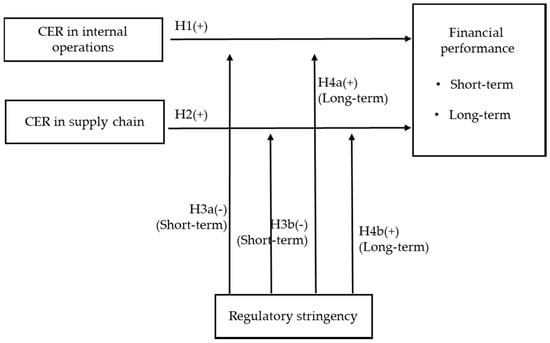
Figure 1.
Conceptual model.
3. Methods
3.1. Data, Sample, and Empirical Approaches
The present study used mainly carbon data from Trucost to examine firms’ CER. A large portion of the carbon inputs and GHG emissions comes from industrial production, thus, firms are required to take the lead in creating low-carbon societies [119]. The carbon footprint has been defined as the amount of GHG, primarily carbon dioxide, that is released into the atmosphere as the direct or indirect result of an activity or is accumulated over the life stages of a product [28]. Studies have focused on the carbon footprint of firms [29,30,120]. In order to standardize the way of measuring and reporting corporate emissions, World Resources Institute (WRI) and the World Business Council for Sustainable Development (WBCSD) developed The Greenhouse Gas Protocol: A Corporate Accounting and Reporting Standard (hereafter GHG Protocol). It categorizes emissions into Scopes 1, 2, and 3. Scope 1 is bounded by direct carbon emissions from sources owned or controlled by the reporting firm. Scope 2 covers indirect carbon emissions resulting from consumption of electricity, heat, or steam purchased by a reporting firm. Lastly, Scope 3 is all other indirect carbon emissions, excluding the boundary of Scope 2 [121,122]. Trucost provides direct GHG emissions released by a firm’s operation, as well as upstream GHG emissions that come from purchases of goods and services from first-tier suppliers.
The present study also used Compustat and Kinder, Lydenberg, Domini and Co (KLD) Index. These data were merged with those on the 2003–2010 list of North American firms in the Trucost database because almost all of the information on these firms was available in Compustat. The analysis was conducted on 714 firms in 19 industries. Table 1 shows the number of observations by the Industry Classification Benchmark (ICB) supersector on the basis of the Trucost data.

Table 1.
The number of observations and greenhouse gas emissions by sectors.
This study used STATA software to perform regression analysis. Assuming that the unobserved effects can be randomly distributed to each firm, random effects methods can provide greater efficiency. Conceptually, random effects models are suitable because they allow for general inferences to be made about the relationship between the carbon footprint and financial performance. Fixed-effects models do not allow for time-invariant variables in the regression model. Thus, they were inappropriate for this study because the variable regulatory stringency was time-invariant.
3.2. Measurement
3.2.1. Dependent Variables
Return on assets (ROA) and Tobin’s Q. To increase robustness, financial performance was measured with two variables: Return on assets (ROA) and Tobin’s Q. While ROA represents short-term financial performance by measuring a firm’s efficiency in generating profits with its assets during a fiscal year, Tobin’s Q represents long-term performance by reflecting the extent of the premium that investors are willing to pay in anticipation of future firm performance [49,123,124,125]. Because the intangible value that accrues from CER is often not captured in the short term, this study used both the short- and long-term performance measures. Tobin’s Q has been found to be an adequate proxy for intangible values, such as firm reputation and investor trust [23,32,126].
Compustat provided information for calculating the variables. On the basis of previous studies, the ROA was estimated by dividing the earnings before interest by the total sales [22]. In accordance with the method developed by Chung and Pruitt [127], Tobin’s Q was calculated as the ratio of a firm’s market value to the replacement cost of its assets.
3.2.2. Independent Variables
Internal and Supply chain carbon footprint. The carbon footprint was used as a proxy for CER. In the regression model, the carbon footprint required great attention in interpretation because high carbon footprint implied low CER. In other words, a low carbon footprint corresponded to high CER. On the basis of the Trucost database, a firm’s carbon footprint was defined through two main independent variables: Internal carbon footprint and supply chain carbon footprint. GHG emissions were measured in carbon dioxide equivalents (CO2es) in accordance with the Greenhouse Gas Protocol, which provides the most widely accepted accounting standards [128]. The internal carbon footprint was measured by normalizing the GHG emissions from the internal operations by sales. The supply chain carbon footprint was calculated by normalizing the GHG emissions from the first-tier suppliers by sales. Only the first-tier indirect GHG emissions were captured as supply chain GHG emissions mainly because these are the emissions over which a focal firm has control. Table 1 shows the average GHG emissions by sector. It indicates the variations in the internal carbon footprint and supply chain carbon footprint by industry.
3.2.3. Moderating Variable
Regulatory stringency. As was the case in previous studies, this study identified the firms that were operating under stringent environmental regulations [97,101]. A dichotomous variable, regulatory stringency was coded as “1” for firms with primary two-digit standard industrial classification (SIC) codes, e.g., mining (10), oil exploration (13), paper (26), chemical and allied products (28), petroleum refining (29), metals (33), and utilities (49). Those without were coded as “0.”
3.2.4. Control Variables
Environmental impact. To control for environmental issues other than GHG emissions, five additional environmental impact indicators were included: Water abstraction, general waste, land and water pollutants, air pollutants, and use of natural resources. The Trucost database offered a unique subset of GHG emissions. To resolve the multicollinearity concerns evinced by the relatively high pair-wise correlations between some of the environmental control variables, two variables, water abstraction, and air pollutants, were dropped. Multicollinearity was ascertained through the use of variance inflation factors (VIFs). As presented in Appendix A, all the factors were well below 10, thereby suggesting the absence of multicollinearity issues [129]. For the robustness check, two variables were included, and the same regression analysis was performed, however, the results were the same.
KLD environmental performance. To control for the effects of process-based environmental performance on financial performance, the relevant data were obtained from KLD, the most widely adopted proxy for environmental performance. As shown in Appendix B, KLD has been publishing environmental ratings for all members of the S&P 500 Index and Domini Social 400 Index since 1991. The environmental performance scores were aggregated into two groups. KLD environmental concerns represented the sum of all environmental concerns, and KLD environmental strengths represented the sum of all environmental strengths.
Disclosure. To control for any effects of the voluntary disclosure of environmental information on financial performance, a binary variable was included to account for the variations across firms. We put ‘1’ if the environmental data was provided by the firm so that publicly available, and ‘0’ if the data were imputed by third parties using input-output (IO) economic model [130]. This variable facilitated controlling for any potential bias based on a firm’s voluntary disclosure behavior.
Financial variables. On the basis of previous studies on the relationship between CER and corporate financial performance [49,50], several financial variables were included to control for firm-level heterogeneity. The financial information was obtained from the Compustat database. The total assets were included to account for variations in firm size. The ratio of total debt to total assets was also included to control for firm leverage. To control for the effects of production variation on firm performance, growth, measured as the yearly change in sales divided by the total sales, was added as a variable. Last, capital expenditures were divided by the total sales to control for the effects of capital intensity on firm performance. Each financial control variable was transformed with the natural logarithm to correct for skewed distributions.
Industry dummy. A series of dummies were included. They indicated each firm’s primary industry on the basis of the 19 ICB supersectors identified in Trucost.
4. Results
Table 2 presents the descriptive statistics and correlation matrices for the study variables. Table 3 provides the estimated random effects regression model that used ROA as the dependent variable. Table 4 presents the estimated random effects regression model that used Tobin’s Q as the dependent variable. In Model 2 of Table 3, the coefficient of the internal carbon footprint was significantly negative (p < 0.05). Model 2 of Table 4 provides evidence of the significantly negative coefficient of the internal carbon footprint (p < 0.05). The results supported the prediction that CER in a firms’ internal operations would have a positive effect on financial performance, thus, Hypothesis 1 was confirmed. CER in firms’ internal operations had positive effects on both the ROA and Tobin’s Q. In Model 4 of Table 3, the coefficient of the supply chain carbon footprint was significantly negative (p < 0.001). This indicated that CER in the supply chain was positively associated with the ROA. Model 4 of Table 4 indicates that the coefficient of the supply chain carbon footprint was also significantly negative (p < 0.05). This indicated that CER in the supply chain was positively associated with Tobin’s Q. Hypothesis 2 was supported, thereby suggesting that CER in the supply chain positively influenced financial performance.
Table 2.
Descriptive statistics.
Table 3.
The random effects regression model of return on assets.
Table 4.
The random effects regression model of Tobin’s Q.
In Model 3 of Table 3, the interaction terms between the internal carbon footprint and regulatory stringency variables were included to determine whether the effect of an internal carbon footprint on ROA was moderated by regulatory stringency. The coefficient of the interaction term was not statistically significant, thus, Hypothesis 3a was not supported. Regulatory stringency did not affect the relationship between CER in internal operations and short-term financial performance. Model 5 in Table 3 adds the interaction terms between supply chain carbon footprint and regulatory stringency variables to test Hypothesis 3b. The interaction term was significantly positive (p < 0.05). This suggested that the relationship between the supply chain carbon footprint and ROA was weaker for firms operating under stringent regulations, therefore, Hypothesis 3b was supported. The results confirmed the prediction that regulatory stringency would weaken the relationship between supply chain environmental responsibility and short-term financial performance.
Model 3 of Table 4 shows the interaction terms between the internal carbon footprint and regulatory stringency variables. The reason was to test Hypothesis 4a by determining whether the effects of an internal carbon footprint on Tobin’s Q were moderated by regulatory stringency. Regulatory stringency was predicted to strengthen the relationship between corporate environmental responsibility in internal operations and long-term financial performance. Because the coefficient of the interaction terms did not indicate statistical significance, Hypothesis 4a was not supported.
Model 5 in Table 4 included the interaction terms of supply chain carbon footprint and regulatory stringency variables to test Hypothesis 4b. The interaction terms show significantly negative (p < 0.05). This suggested that the relationship between the supply chain carbon footprint and long-term performance was stronger for firms operating under stringent regulations, thus, Hypothesis 4b was supported.
Table 3 shows that the estimates for the control variables firm size and leverage were negatively associated with ROA. Two environmental impact control variables, general waste, and natural resource use, were statistically significant across all models. The disclosure was not found to have an effect on ROA in Models 1–3, however, it had a significantly positive effect in Models 4–6. The voluntary disclosure of carbon emissions was inferred to be more relevant when the supply chain carbon footprint was taken into account.
Table 4 shows that the estimated KLD environmental concerns variable had a positive effect on Tobin’s Q. An examination of the financial variables indicated that the estimates for firm size and leverage were negatively associated with Tobin’s Q, and those for growth and capital intensity were positively related to Tobin’s Q across all models. Only one environmental impact control variable, natural resource pollutants, was statistically significant. Regulatory stringency had a positive effect on Tobin’s Q.
5. Discussion and Conclusions
5.1. Discussion
Using carbon footprint data, this study has demonstrated that higher levels of CER in internal operations increase not only a firm’s short-term financial performance but also its long-term financial performance. It has further shown that CER in the supply chain also increases short- and long-term financial performance. In providing a theoretical account of these relationships, the study has highlighted the importance of implementing CER in internal operations and the relevant supply chain partners.
The study found that regulatory stringency hinders the positive financial effects of CER in the supply chain in the short term, however, the long-term market value improves. These empirical results improve our understanding that regulatory stringency seems to be an obstacle to increasing profitability in the earlier stages where CER of supply chain begins, however, regulatory stringency appears to be another source of competitive advantage if well managed. Contrary to our expectations, the moderating effect of regulatory stringency was not significant in the relationship between CER in internal operation and short- and long-term financial performance. It could be inferred that this is due to the unique perspective that stakeholders interpret on the internal CER of firms operating in highly regulated industries. Stakeholders in sectors with high externalities and stringent regulations have distinctive views on firms’ CER [131]. For firms in highly regulated industries, CER is not likely to be perceived as voluntary to some of the stakeholders. They are likely to be skeptical about the environmental involvement of firms internal operating under stringent regulations, and this ambiguous stance diluted the direction we expected and did not show statistically significant results. In a similar vein, a previous study reported that the market only positively values the environmental practices carried out by firms that do not belong to environmentally sensitive industries [80]. We can also interpret that CER in internal operating in a highly regulated industry tends to be taken for granted by some of stakeholders but the CER in the supply chain is not.
5.2. Conclusions
This study helps to resolve the mixed results regarding CER on firm performance over various time horizons: From the short term to the long term. Scholars have argued that the effects of CER on financial performance can take a long time and stressed the need for looking at the relation long term [4]. This study also contributes to the natural resource-based view by extending the “pay to be green” debate beyond the boundaries of the firm. Several studies have focused on stakeholder pressure on firms to practice CER in their internal operations, however, few have focused on its influence beyond the firms’ boundaries [19,20,120]. The evidence highlights the importance of firms’ finding and managing greener suppliers with a low carbon footprint [132,133]. By verifying the effects of supply chain partners’ CER on a focal firm’s performance, this study has concluded that CER encompassing a wider range of the boundary of the firms benefits them financially.
One of contributions of this study is the use of outcome-based measures of CER. This empirical study of CER used a unique dataset that provides firm-level information on GHG emissions. Studies have stressed the importance of using outcome-based measures that directly capture firms’ environmental performance to study the effects of CER on financial performance [33,34]. Process-based measures that reflect firms’ internal efforts to manage environmental issues cannot guarantee a decrease in environmental concerns [36]. Outcome-based measures improve the understanding of the direct effects of CER on financial performance.
This study aimed to expand the scope of the research on GHG emissions in the industries that have not previously received attention. Previous studies of GHG emissions have focused mainly on heavy polluters, such as the chemical, mining, and utility industries, thus, the implications could not be generalized [134,135]. However, the environmental impact of GHG emissions is influenced by other sectors. For example, the information and communication technology (ICT) sector needs to be addressed because the GHG emissions from purchased electricity are significant and continually increasing. The ICT sector is responsible for almost 2%-2.5% of the global GHG emissions [136]. It is necessary that a wider range of industries, including the seemingly nonpolluting sectors, be considered because the true cost of the associated environmental damage can be unexpectedly high. This study is expected to initiate related research by comprehensively examining 19 various industries, as well as heavily polluting industries.
There are several implications for practitioners. The results of this study indicate that a reduction in the carbon footprint has positive effects on firm profits and the ecological environment. A smaller carbon footprint suggests greater capabilities for managing environmental responsibility. More important, this capability not only contributes to a greener ecological environment, it also enhances a firm’s competitive advantage. For the benefit of the firm, managers have to continue to strive for internal CER.
The business environment is changing. Fewer firms manage all of their processes in-house. Supply chain partners are increasingly being relied upon, thus, the notion of CER must also change. CER should no longer be confined to the domain of an individual firm, it should include its partners [137]. Firms should always be concerned about the CER of their supply chain partners. As environmental regulations are expected to become stronger, the competitiveness of focal firms relied highly upon supply chain partnerships [120]. Managers should recognize the importance of understanding supply chain networks and collaborating with their partners to reduce carbon emissions. If focal firms share their carbon emissions reduction expertise with their partners, they will accumulate more relevant knowledge about the supply chain network. With this knowledge, firms can carefully monitor the CER in the supply chain. In today’s corporate environment, it is not enough to merely adopt internal efforts to deal with environmental responsibilities. Firms have to be aware of their partners’ environmental sustainability. It is important to consider suppliers’ CER from the stage of selecting partners, which will reduce supplier-related risks.
Firms in modern society should move away from the archaic goal of “just maximizing profit” and start thinking about how to proactively take up roles that would bring benefit to society. Even firms operating in highly regulated industries should not be satisfied with doing CER according to the industry level. A discretionary responsibility today may become a legal responsibility tomorrow as more people expect from the firm to perform. Stakeholders’ pressures to embrace the challenge of environmental problems will be increasing [138]. Taking a more proactive stance than industry regulation will provide a competitive advantage.
These results could lead policymakers to consider both the focal firm and its supply chain in their implementation of the plans for reducing the environmental damage caused by business activities. It is crucial that a focal firms have the ability to influence its supply chain partners. This could mitigate environmental concerns by transferring the burden of environmental responsibility to the supply chain. Therefore, policymakers need to have a holistic approach to providing the appropriate incentives for a focal firm to initiate the mitigation of environmental concerns and collaboration with its supply chain partners.
The present study has limitations that could offer opportunities for further research. First, as has been previously done, this study employed the two-digit SIC code as a criterion for distinguishing firms by regulatory stringency [97,101]. For a more rigorous measure of regulatory stringency, firm-level data could be used to examine the regulatory pressures on individual firms. Second, as a proxy for CER, the study used the carbon footprint, which was calculated by dividing firm-level GHG emissions by firm revenue. Precision in interpreting the results from this calculation method is difficult if a smaller carbon footprint represents lower GHG emissions or higher sales.
Future studies can use rigorous measures to avoid potential bias. However, the carbon footprint offers a more direct and conservative method for hypothesis testing. Because this study aimed to examine outcome-based CER, the process-based effects were not measured. Future comparative analyses of firms on the basis of process- and outcome-based measures would be informative. The carbon footprint has its limitation because it cannot capture all of the CER efforts of focal firms. Future studies can further contribute to this line of research by using alternative proxy of CER.
We applied two different financial measures, ROA and Tobin’s Q, to examine the effects of firms’ CER. Although we tried to fill the gap as not relying on a single financial measure, studies that measure more diverse financial performance will be needed. In addition, there may be potential performance measures that are not expressed in financial figures, but that provide enough value to the firm, so this should be considered for future studies.
The degree of regulation can vary not only by industry but also by the country level to which it belongs. The sample of this study only includes those firms that appear in North America, possibly reducing the generalizability of results. Future research would need to show evidence of applicability to broader samples in order to counter this limitation. It would be interesting to study a country other than North America, which was the research setting of this study.
Because of the limited data accessibility, this study conducted the analyses based on the non-up-to-date data. Countries around the world that have expressed much concern about GHG emissions have agreed to join forces to reduce carbon emissions. The emissions trading system is a cornerstone of the world nations’ policy to fight climate change. It provides a cost-effective way of decreasing GHG emissions. The first phase of the emissions trading system was from 2005 to 2007, and the second phase was from 2008 to 2012. The third phase is currently in progress. As each phase progresses, the interest and actual efforts to reduce carbon emissions are progressing at both the countries’ and firms’ level. Against this backdrop, CER efforts by firms would have been further amplified. We studied based on 2003-2010, the period during which these efforts have been actively taking place. We thus believe that there are still theoretical and managerial implications from these non-up-to-date data analyses. We acknowledged the limitation of data period, and future studies can further contribute to this line of research by using the recent data set. Although there are some limitations, the present study will inspire further efforts to bring greater cumulativeness and theoretical sophistication to the CER literature.
Author Contributions
Conceptualization, J.S. and N.K.; methodology, J.L.; Formal Analysis, J.S. and J.L.; data curation, J.S.; writing—original draft preparation, J.S.; writing—review & editing, N.K.; supervision, J.L.; project administration, N.K. All authors have read and agreed to the published version of the manuscript.
Conflicts of Interest
The authors declare no conflict of interest.
Appendix A
Table A1.
Variance inflation factors, multicollinearity test.
Table A1.
Variance inflation factors, multicollinearity test.
| Variables | VIF |
|---|---|
| General Waste | 7.09 |
| Natural Resource Use | 6.35 |
| Land and Water Pollutant | 5.52 |
| Supply Chain Carbon Footprint | 4.35 |
| Internal Carbon Footprint | 4.08 |
| Firm Size | 2.94 |
| KLD Environmental Concerns (t − 1) | 1.98 |
| Regulatory Stringency | 1.94 |
| Capital Intensity | 1.58 |
| Disclosure | 1.35 |
| KLD Environmental Strengths (t − 1) | 1.28 |
| Leverage | 1.13 |
| Growth | 1.08 |
| Mean VIF | 3.13 |
Appendix B
Table A2.
List of KLD environmental performance.
Table A2.
List of KLD environmental performance.
| Environmental Concerns |
| Hazardous Waste |
| Regulatory Problems |
| Ozone Depleting Chemicals |
| Substantial Emissions |
| Agriculture Chemicals |
| Climate Change (from 1999) |
| Negative Impact of Products and Services |
| Land Use and Biodiversity |
| Non Carbon Releases |
| Supply Chain Management |
| Water Management |
| Environment Other Concerns |
| Environment: Number of Concerns |
| Environmental Strengths |
| Beneficial Products and Services |
| Pollution Prevention |
| Recycling |
| Clean Energy |
| Property, Plant, Equipment (through 1995) |
| Management Systems Strength |
| Water Stress |
| Biodiversity and Land Use |
| Raw Material Sourcing |
| Environment Other Strength |
| Environment: Number of Strengths |
References
- Lewis, B.W.; Walls, J.L.; Dowell, G.W.S. Difference in degrees: CEO characteristics and firm environmental disclosure. Strat. Manag. J. 2014, 35, 712–722. [Google Scholar] [CrossRef]
- Delmas, M.A.; Nairn-Birch, N.S. Is the tail wagging the dog? An empirical analysis of corporate carbon footprints and financial performance. In Working Paper. Center for Corporate Environmental Performance; UC Los Angeles: Los Angeles, CA, USA, 2011. [Google Scholar]
- Dam, L.; Koetter, M.; Scholtens, L.J.R. Why Do Firms Do Good? Evidence from Managerial Efficiency; In CORE Working Paper Series No. 1; University of Groningen: Groningen, Germany, 2009. [Google Scholar]
- Jo, H.; Kim, H.; Park, K. Corporate Environmental Responsibility and Firm Performance in the Financial Services Sector. J. Bus. Ethics. 2015, 131, 257–284. [Google Scholar] [CrossRef]
- Margolis, J.D.; Walsh, J.P. People and Profits? The Search for a Link Between a Company’s Social and Financial Performance; Erlbaum: Greenwich, CT, UK, 2001. [Google Scholar]
- Margolis, J.D.; Walsh, J.P. Misery loves companies: Rethinking social initiatives by business. Adm. Sci. Q. 2003, 48, 268–305. [Google Scholar] [CrossRef]
- Jaggi, B.; Freedman, M. An examination of the impact of pollution performance on economic and market performance: Pulp and paper firms. J. Bus. Finance Account. 1992, 19, 697–713. [Google Scholar] [CrossRef]
- Wagner, M.; Van Phu, N.; Azomahou, T.; Wehrmeyer, W. The relationship between the environmental and economic performance of firms: An empirical analysis of the European paper industry. Corp. Soc. Responsibility Environ. Manag. 2002, 9, 133–146. [Google Scholar] [CrossRef]
- Palmer, K.P.; Oates, W.E.; Portney, P.R. Tightening environmental standards: The benefit–cost or nocost paradigm. J. Econ. Perspect. 1995, 9, 119–132. [Google Scholar] [CrossRef]
- Singh, P.; Sethuraman, K.; Lam, J. Impact of corporate social responsibility dimensions on firm value: Some evidence from Hong-kong and China. Sustainability 2017, 9, 1532. [Google Scholar] [CrossRef]
- Hart, S.L. A natural-resource-based view of the firm. Acad. Manag. Rev. 1995, 20, 986–1014. [Google Scholar] [CrossRef]
- Huang, J.; Li, Y. Green Innovation and Performance: The View of Organizational Capability and Social Reciprocity. J. Bus. Ethics. 2017, 145, 309–324. [Google Scholar] [CrossRef]
- Porter, M. The Competitive Advantage of Nations; MacMillan: London, UK, 1990. [Google Scholar]
- Porter, M.E.; van der Linde, C. Green and competitive: Ending the stalemate. Harv. Bus. Rev. 1995, 73, 120–134. [Google Scholar]
- Schmidheiny, S. Changing Course; MIT Press: Cambridge, UK, 1992. [Google Scholar]
- Sharma, S.; Henriques, I. Stakeholder influences on sustainability practices in the Canadian forest products industry. Strat. Manag. J. 2005, 26, 159–180. [Google Scholar] [CrossRef]
- OECD. OECD Guidelines for Multinational Enterprises. OECD Publishing. 2011. Available online: http://dx.doi.org/10.1787/9789264115415-en (accessed on 19 March 2020).
- Howard-Grenville, J.; Buckle, S.J.; Hoskins, B.J.; George, G. Climate change and management. Acad. Manag. 2014, 57, 615–623. [Google Scholar] [CrossRef]
- Bose, I.; Pal, R. Do green supply chain management initiatives impact stock prices of firms? Decis. Support Syst. 2012, 52, 624–634. [Google Scholar] [CrossRef]
- Dam, L.; Petkova, B.N. The impact of environmental supply chain sustainability programs on shareholder wealth. Int. J. Oper. Prod. Manag. 2014, 34, 586–609. [Google Scholar] [CrossRef]
- Srivastava, S.K. Green supply-chain management: A state-of-the-art literature review. Int. J. Manag. Rev. 2007, 9, 53–80. [Google Scholar] [CrossRef]
- McWilliams, A.; Siegel, D.S. Creating and capturing value: Strategic corporate social responsibility, resource-based theory, and sustainable competitive advantage. J. Manag. 2011, 37, 1480–1495. [Google Scholar] [CrossRef]
- Arya, B.; Zhang, G. Institutional reforms and investor reactions to CSR announcements: Evidence from an emerging economy. J. Manag. Stud. 2009, 46, 1089–1112. [Google Scholar] [CrossRef]
- Sarkis, J.; Zhu, Q.; Lai, K. An organizational theoretic review of green supply chain management literature. Int. J. Prod. Econ. 2011, 130, 1–15. [Google Scholar] [CrossRef]
- Paulraj, A.; Chen, I.J.; Blome, C. Motives and Performance Outcomes of Sustainable Supply Chain Management Practices: A Multi-theoretical Perspective. J. Bus. Ethics. 2017, 145, 239–258. [Google Scholar] [CrossRef]
- Rodgers, W.; Choy, H.L.; Guiral, A. Do Investors Value a Firm’s Commitment to Social Activities? J. Bus. Ethics. 2013, 114, 607–623. [Google Scholar] [CrossRef]
- Peloza, J. The challenge of measuring financial impacts from investments in corporate social performance. J. Manag. 2009, 356, 1518–1541. [Google Scholar] [CrossRef]
- Liu, Y. Dynamic study on the influencing factors of industrial firm’s carbon footprint. J. Clean. Prod. 2015, 103, 411–422. [Google Scholar] [CrossRef]
- Penela, A.C.; García-Negro, M.C.; Quesada, J.L. A methodological proposal for corporate carbon footprint and its application to a wine-producing company in Galicia, Spain. Sustainability 2009, 1, 302–318. [Google Scholar] [CrossRef]
- Zhou, Y.; Zhang, B.; Zou, J.; Bi, J.; Wang, K. Joint R&D in low-carbon technology development in China: A case study of the wind-turbine manufacturing industry. Energy Policy. 2012, 46, 100–108. [Google Scholar]
- Burki, U.; Ersoy, P.; Najam, U. Top Management, Green Innovations, and the Mediating Effect of Customer Cooperation in Green Supply Chains. Settings. Sustainability 2019, 11, 1031. [Google Scholar] [CrossRef]
- Apple. Environmental Responsibility. Apple Inc. 2014. Available online: http://www.apple.com/environment/reports (accessed on 19 March 2020).
- Hart, S.L.; Ahuja, G. Does it pay to be green? An empirical examination of the relationship between emission reduction and firm performance. Bus. Strategy Environ. 1996, 5, 30–37. [Google Scholar] [CrossRef]
- King, A.; Lenox, M. Exploring the locus of profitable pollution reduction. Manag. Sci. 2002, 48, 289–299. [Google Scholar] [CrossRef]
- Busch, T.; Hoffmann, V.H. How hot is your bottom line? Linking carbon and financial performance. Bus. Soc. 2011, 50, 233–265. [Google Scholar] [CrossRef]
- Delmas, M.; Etzion, D.; Nairn-Birch, N. Triangulating Environmental Performance: What Do Corporate Social Responsibility Ratings Really Capture? Acad. Manag. Perspect. 2013, 27, 255–267. [Google Scholar] [CrossRef]
- Schneider, A.; Meins, E. Two dimensions of corporate sustainability assessment: Towards a comprehensive framework. Bus. Strategy Environ. 2012, 21, 211–222. [Google Scholar] [CrossRef]
- Fatemi, A.; Glaumb, M.; Kaiserc, S. ESG Performance and Firm Value: The Moderating Role of Disclosure. Glob. Financ. J. 2018, 38, 45–64. [Google Scholar] [CrossRef]
- Kim, I.; Wan, H.; Wang, B.; Yang, T. Institutional investors and corporate environmental, social, and governance policies: Evidence from toxics release data. Manag. Sci. 2019, 65, 1–26. [Google Scholar] [CrossRef]
- Yoon, B.; Lee, J.H.; Byun, R. Does ESG Performance Enhance Firm Value? Evidence from Korea. Sustainability 2018, 10, 3635. [Google Scholar] [CrossRef]
- Chang, C. The Influence of Corporate Environmental Ethics on Competitive Advantage: The Mediation Role of Green Innovation. J. Bus. Ethics. 2011, 104, 361–370. [Google Scholar] [CrossRef]
- El-Kassar, A.N.; Singh, S.K. Green innovation and organizational performance: The influence of big data and the moderating role of management commitment and HR practices. Technol. Forecast. Soc. Change. 2019, 144, 483–498. [Google Scholar] [CrossRef]
- Ambec, S.; Cohen, M.A.; Elgie, S.; Lanoie, P. The Porter Hypothesis at 20: Can Environmental Regulation Enhance Innovation and Competitiveness? In Discussion Paper 11–01; Resources for the Future: Washington, DC, USA, 2011. [Google Scholar]
- Orlitzky, M.; Schmidt, F.L.; Rynes, S.L. Corporate social and financial performance: A meta-analysis. Organ. Stud. 2003, 24, 403–441. [Google Scholar] [CrossRef]
- Friedman, M. The social responsibility of business is to increase its profits. The New York times Magazine, 13 September 1970. [Google Scholar]
- Shrivastava, P. Environmental technologies and competitive advantage. Strat. Manag. J. 1995, 16, 183–200. [Google Scholar] [CrossRef]
- Romstad, E. Environmental regulation and competitiveness. In International Competitiveness and Environmental Policies; Barker, T., Koehler, J., Eds.; Elgar: Cheltenham, UK, 1998; pp. 185–196. [Google Scholar]
- Simpson, R.D.; Bradford, R.L. Taxing variable cost: Environmental regulation as industry policy. J. Environ. Econ. Manag. 1996, 30, 282–300. [Google Scholar] [CrossRef]
- Dowell, G.; Hart, S.; Yeung, B. Do Corporate Global Environmental Standards Create or Destroy Market Value? Manag. Sci. 2000, 46, 1059–1074. [Google Scholar] [CrossRef]
- King, A.A.; Lenox, M.J. Does it really pay to be green? An empirical study of firm environmental and financial performance: An empirical study of firm environmental and financial performance. J. Ind. Ecol. 2001, 5, 105–116. [Google Scholar] [CrossRef]
- Heide, J.B.; Kumar, A.; Wathne, K.H. Concurrent sourcing, governance mechanisms, and performance outcomes in industrial value chains. Strat. Manag. J. 2014, 35, 1164–1185. [Google Scholar] [CrossRef]
- Miles, M.P.; Covin, J.G. Environmental marketing: A source of reputational, competitive, and financial advantage. J. Bus. Ethics. 2000, 23, 299–311. [Google Scholar] [CrossRef]
- Short, J.L.; Toffel, M.W.; Hugill, A.R. Monitoring global supply chains. Strat. Manag. J. 2016, 37, 1878–1897. [Google Scholar] [CrossRef]
- Carter, C.R.; Rogers, D.S. A framework of sustainable supply chain management: Moving toward new theory. Int. J. Phys. Distrib. Logist. Manag. 2018, 38, 360–387. [Google Scholar] [CrossRef]
- Golicic, S.L.; Smith, C.D. A meta-analysis of environmentally sustainable supply chain management practices and firm performance. J. Supply Chain Manag. 2013, 49, 78–95. [Google Scholar] [CrossRef]
- Ortas, E.; Moneva, M.; Alvarez, I. Sustainable supply chain and company performance A global examination. Supply Chain Manag. Supply Chain Manag. Int. J. 2014, 19, 332–350. [Google Scholar] [CrossRef]
- Hahn, T.; Figge, F.; Pinkse, J.; Preuss, L. Trade-offs in corporate sustainability: You can’t have your cake and eat it. Bus. Strat. Environ. 2010, 19, 217–229. [Google Scholar] [CrossRef]
- Winn, M.; Pinkse, J.; Illge, L. Case studies on trade-offs in corporate sustainability. Corp. Soc. Responsib. Environ. Manag. 2012, 19, 63–68. [Google Scholar] [CrossRef]
- Bai, C.; Sarkis, J. Green supplier development: Analytical evaluation using rough set theory. J. Clean. Prod. 2010, 18, 1200–1210. [Google Scholar] [CrossRef]
- Zhu, Q.; Sarkis, J.; Lai, K.H. Green supply chain management innovation diffusion and its relationship to organizational improvement: An ecological modernization perspective. J. Eng. Technol. Manag. 2012, 29, 168–185. [Google Scholar] [CrossRef]
- Bocken, N.M.P.; Farracho, M.; Bosworth, R.; Kemp, R. The front-end of eco-innovation for eco-innovative small and medium sized companies. J. Eng. Technol. Manag. 2014, 31, 43–57. [Google Scholar] [CrossRef]
- Zhu, Q.; Sarkis, J. Relationships between operational practices and performance among early adopters of green supply chain management practices in Chinese manufacturing enterprises. J. Oper. Manag. 2004, 22, 265–289. [Google Scholar] [CrossRef]
- Leonidou, L.C.; Leonidou, C.N.; Kvasova, O. Antecedents and outcomes of consumer environmentally friendly attitudes and behavior. J. Mark. Manag. 2010, 26, 1319–1344. [Google Scholar] [CrossRef]
- Lins, K.; Servaes, H.; Tamayo, A. Social capital, trust, and firm performance: The value of corporate social responsibility during the financial crisis. J. Finance. 2017, 72, 1785–1824. [Google Scholar] [CrossRef]
- Nie, Y.; Wang, E.; Guo, Q.; Shen, J. Examining shanghai consumer preferences for electric vehicles and their attributes. Sustainability 2018, 10, 2036. [Google Scholar] [CrossRef]
- Ataei, H.; Taherkhani, F. Analysis of Canadian Consumer Spending Patterns towards Green Products. Int. J. Mark. Stud. 2015, 7, 19–26. [Google Scholar] [CrossRef]
- Finisterra do Paço, A.M.; Barata Raposo, M.L. Green consumer market segmentation: Empirical findings from Portugal. Int. J. Consum. Stud. 2010, 34, 429–436. [Google Scholar] [CrossRef]
- Newman, G.E.; Gorlin, M.; Dhar, R. When going green backfires: How firm intentions shape the evaluation of socially beneficial product enhancements. J. Consum. Res. 2014, 41, 823–839. [Google Scholar] [CrossRef]
- Huang, Y.C.; Wu, Y.C. The effects of organizational factors on green new product success-evidence from high-tech industries in Taiwan. Manag. Decis. 2010, 48, 1539–1567. [Google Scholar] [CrossRef]
- Dong, Y.; Wang, X.; Jin, J.; Qiao, Y.; Shi, L. Effects of ecoinnovation typology on its performance: Empirical evidence from Chinese enterprises. J. Eng. Tech. Manag. 2014, 34, 78–98. [Google Scholar] [CrossRef]
- Maxwell, J.W.; Decker, C.S. Voluntary Environmental Investment and Responsive Regulation. Environ. Resour. Econ. 2006, 33, 425–439. [Google Scholar] [CrossRef]
- Cai, L.; Cui, J.; Jo, H. Corporate Environmental Responsibility and Firm Risk. J. Bus. Ethics. 2016, 139, 563–594. [Google Scholar] [CrossRef]
- Shiu, Y.M.; Yang, S.L. Does engagement in corporate social Responsibility provide strategic Insurance-like effects? Strat. Manag. J. 2017, 38, 455–470. [Google Scholar] [CrossRef]
- Burlea-Schiopoiu, A.; Mihai, L.S. An Integrated Framework on the Sustainability of SMEs. Sustainability 2019, 11, 6026. [Google Scholar] [CrossRef]
- Ghoul, S.E.; Guedhami, O.; Kim, Y. Country-level institutions, firm value, and the role of corporate social responsibility initiatives. J. Int. Bus. Stud. 2017, 48, 360–385. [Google Scholar] [CrossRef]
- Liu, J.; Hui, C.; Lee, C.; Chen, Z.X. Fulfilling Obligations: Why Chinese Employees Stay. Int. J. Hum. Resour. Man. 2012, 23, 35–51. [Google Scholar] [CrossRef]
- Bhattacharya, C.B.; Sen, S.; Korschun, D. Using Corporate Social Responsibility to Win the War for Talent. Sloan Manag. Rev. 2008, 49, 37–44. [Google Scholar]
- Dögl, C.; Holtbrügge, D. Corporate environmental responsibility, employer reputation and employee commitment: An empirical study in developed and emerging economies. Int. J. Hum. Resour. Man. 2014, 25, 1739–1762. [Google Scholar] [CrossRef]
- Perrini, F.; Russo, A.; Tencati, A.; Vurro, C. Deconstructing the Relationship Between Corporate Social and Financial Performance. J. Bus. Ethics. 2011, 102, 59276. [Google Scholar] [CrossRef]
- Miralles-Quirós, M.; Miralles-Quirós, J.; Valente Gonçalves, L. The value relevance of environmental, social, and governance performance: The brazilian case. Sustainability 2018, 10, 574. [Google Scholar] [CrossRef]
- Eccles, R.G.; Ioannou, I.; Serafeim, G. The impact of corporate social responsibility on investment recommendations: Analysts’ perceptions and shifting institutional logics. Acad. Manag. J. 2015, 36, 1053–1081. [Google Scholar]
- Ghoul, S.E.; Guedhami, O.; Kim, H.; Park, K. Corporate Environmental Responsibility and the Cost of Capital: International Evidence. J. Bus. Ethics. 2018, 149, 335–361. [Google Scholar] [CrossRef]
- Nixon, B. Unearthed: Agricultural Emissions in the Corporate Supply Chain: Findings from the CDP 2011 U.S. Agriculture Supply Chain Pilot. Carbon Disclosure Project by: Common Fields. 2011, pp. 1–20. Available online: www.cdp.net/CDPResults/CDP-2011-Agriculture-Report.pdf (accessed on 13 February 2020).
- Carter, C.R. Ethical issues in international buyer-supplier relationships: A dyadic examination. J. Oper. Manag. 2000, 18, 191–208. [Google Scholar] [CrossRef]
- Krause, D.R.; Ragatz, G.L.; Hughley, S. Supplier development from the minority supplier’s perspective. J. Supply Chain Manag. 1999, 35, 33–41. [Google Scholar] [CrossRef]
- Wolf, J. The relationship between sustainable supply chain management, stakeholder pressure and corporate sustainability performance. J. Bus. Ethics. 2014, 119, 317–328. [Google Scholar] [CrossRef]
- Freeman, R.E. Strategic Management: A Stakeholder Approach; Pitman: Boston, MA, USA, 1984. [Google Scholar]
- Jones, T.M. Instrumental stakeholder theory: A synthesis of ethics and economics. Acad. Manag. Rev. 1995, 20, 404–437. [Google Scholar] [CrossRef]
- Vachon, S.; Klassen, R.D. Environmental management and manufacturing performance: The role of collaboration in the supply chain. Int. J. Prod. Econ. 2008, 111, 299–315. [Google Scholar] [CrossRef]
- Banerjee, S.B. Who sustains whose development? Sustainable development and the reinvention of nature. Organ. Stud. 2003, 24, 143–180. [Google Scholar] [CrossRef]
- Pfeffer, J.; Salancik, G.R. The External Control of Organizations: A Resource Dependence Perspective; Stanford University Press: Stanford, CA, USA, 1978. [Google Scholar]
- Chiou, T.Y.; Chan, H.K.; Lettice, F.; Chung, S.H. The influence of greening the suppliers and green innovation on environmental performance and competitive advantage in Taiwan. Transp. Res. Part E. 2011, 47, 822–836. [Google Scholar] [CrossRef]
- Samsung. Sustainability Reports. Samsung Electronics Co., Ltd. 2014. Available online: http://www.samsung.com/us/aboutsamsung/sustainability/sustainabilityreports (accessed on 19 March 2020).
- Lin, M.J.; Hung, S.W.; Chen, C.J. Fostering the determinants of knowledge sharing in professional virtual communities. Comput. Hum. Behav. 2009, 25, 929–939. [Google Scholar] [CrossRef]
- Klassen, R.D.; Vachon, S. Greener Supply Chain Management; Oxford University Press: New York, NY, USA, 2012. [Google Scholar]
- Roos, S.; Posner, S.; Jönsson, C.; Olsson, E.; Nilsson-Lindén, H.; Schellenberger, S.; Larsson, M.; Hanning, A.C.; Arvidsson, R.A. Function-Based Approach for Life Cycle Management of Chemicals in the Textile Industry. Sustainability 2020, 12, 1273. [Google Scholar] [CrossRef]
- Chatterji, A.K.; Toffel, M.W. How firms respond to being rated. Strat. Manag. J. 2010, 31, 917–945. [Google Scholar] [CrossRef]
- Da Rosa, F.S.; Guesser, T.; Hein, N.; Pfitscher, E.D.; Lunkes, R.J. Environmental impact management of Brazilian companies: Analyzing factors that influence disclosure of waste, emissions, effluents, and other impacts. J. Clean. Prod. 2015, 96, 148–160. [Google Scholar] [CrossRef]
- Garcia, A.S.; Mendes-Da-Silva, W.; Orsato, R.J. Sensitive industries produce better ESG performance: Evidence from emerging markets. J. Clean. Prod. 2017, 150, 135–147. [Google Scholar] [CrossRef]
- Leone, R.A. Government Regulation of Business: Developing the Managerial Perspective: Division of Research; Harvard Business School: Boston, MA, USA, 1981. [Google Scholar]
- Cho, C.H.; Patten, D.M. The role of environmental disclosures as tools of legitimacy: A research note. Account. Organ. Soc. 2007, 32, 639–647. [Google Scholar] [CrossRef]
- Fernandez-Feijoo, B.; Romero, S.; Ruiz, S. Effects of stakeholders’ pressure of transparency of sustainability reports within the GRI framework. J. Bus. Ethics. 2014, 122, 53–63. [Google Scholar] [CrossRef]
- Richardson, A.J.; Welker, M. Social disclosure, financial disclosure and the cost of equity capital. Account. Organ. Soc. 2001, 26, 597–616. [Google Scholar] [CrossRef]
- Walley, N.; Whitehead, B. It’s not easy being green. Harv. Bus. Rev. 1994, 72, 46–52. [Google Scholar]
- Busse, C.; Meinlschmidt, J.; Foerstl, K. Managing information processing needs in global supply chains: A prerequisite to sustainable supply chain management. J. Supply Chain. Manag. 2017, 53, 87–113. [Google Scholar] [CrossRef]
- Zhou, H.; Benton, W.C., Jr. Supply chain practice and information sharing. J. Oper. Manag. 2007, 25, 1348–1365. [Google Scholar] [CrossRef]
- Das, A.; Narasimhan, R.; Talluri, S. Supplier integration-Finding an optimal configuration. J. Oper. Manag. 2006, 24, 563–582. [Google Scholar] [CrossRef]
- Ragatz, G.L.; Handfield, R.B.; Petersen, K.J. Benefits associated with supplier integration in new product development under conditions of technology uncertainty. J. Bus. Res. 2002, 55, 389–400. [Google Scholar] [CrossRef]
- Darnall, N.; Edwards, D. Predicting the cost of environmental management system adoption: The role of capabilities, resources, and ownership structure. Strat. Manag. J. 2006, 27, 301–320. [Google Scholar] [CrossRef]
- Graham, M.; Miller, C. Disclosure of toxic releases in the United States. Environ. Sci. Sustain. Dev. 2001, 43, 8–20. [Google Scholar] [CrossRef]
- Sirmon, D.G.; Hitt, M.A.; Ireland, D. Managing firm resources in dynamic environments to create value: Looking inside the black box. Acad. Manag. Rev. 2007, 32, 273–292. [Google Scholar] [CrossRef]
- Li, D.; Cao, C.; Zhang, L.; Chen, X.; Ren, S.; Zhao, Y. Effects of corporate environmental responsibility on financial performance: The moderating role of government regulation and organizational slack. J. Clean. Prod. 2017, 166, 1323–1334. [Google Scholar] [CrossRef]
- Berrone, P.; Fosfuri, A.; Gelabert, L.; Gomez-Mejia, L.R. Necessity as the mother of ‘green’ inventions: Institutional pressures and environmental innovations. Strat. Manag. J. 2013, 34, 891–909. [Google Scholar] [CrossRef]
- Nehrt, C. Timing and intensity effects of environmental investments. Strat. Manag. J. 1996, 17, 535–547. [Google Scholar] [CrossRef]
- Kolk, A.; Levy, D.; Pinkse, J. Corporate responses in an emerging climate regime: The institutionalization and commensuration of carbon disclosure. Eur. Account. Rev. 2008, 17, 719–745. [Google Scholar] [CrossRef]
- Christopher, M.; Ryals, L. Supply chain strategy: Its impact on shareholder value. Int. J. Logist. Manag. 1999, 10, 1–10. [Google Scholar] [CrossRef]
- Hendricks, K.B.; Singhal, V.R. The effect of supply chain glitches on shareholder wealth. J. Oper. Manag. 2003, 21, 501–522. [Google Scholar] [CrossRef]
- Vachon, S.; Klassen, R.D. Extending green practices across the supply chain: The impact of upstream and downstream integration. Int. J. Oper. Prod. Manag. 2006, 26, 795–821. [Google Scholar] [CrossRef]
- Hoffmann, V.; Busch, T. Corporate carbon performance indicators. J. Ind. Ecol. 2008, 12, 505–520. [Google Scholar] [CrossRef]
- Lee, K.H. Carbon accounting for supply chain management in the automobile industry. J. Clean. Prod. 2012, 36, 83–93. [Google Scholar] [CrossRef]
- WBCSD; WRI. The Greenhouse Gas Protocol: A Corporate Accounting and Reporting Standard; World Business Council for Sustainable Development: Geneva, Switzerland, 2004. [Google Scholar]
- WBCSD; WRI. The Greenhouse Gas Protocol: Corporate Value Chain (Scope 3) Accounting and Reporting Standard; World Business Council for Sustainable Development: Geneva, Switzerland, 2011. [Google Scholar]
- Cahan, S.F.; De Villiers, C.; Jeter, D.C.; Naiker, V.; Van Staden, C.J. Are CSR Disclosures value Relevant? Cross-Country evidence. Eur. Account. Rev. 2016, 25, 579–611. [Google Scholar] [CrossRef]
- Kang, K.H.; Lee, S.; Huh, C. Impacts of positive and negative corporate social responsibility activities on company performance in the hospitality industry. Int. J. Hosp. Manag. 2009, 29, 72–82. [Google Scholar] [CrossRef]
- Taylor, J.; Vithayathil, J.; Yim, D. Are corporate social responsibility (CSR) initiatives such as sustainable development and environmental policies value enhancing or window dressing? Corp. Soc. Responsib. Environ. Manag. 2018, 25, 971–980. [Google Scholar] [CrossRef]
- Konar, S.; Cohen, M.A. Does the market value environmental performance? Rev. Econ. Stat. 2001, 83, 281–289. [Google Scholar] [CrossRef]
- Chung, K.H.; Pruitt, S.W. A simple approximation of Tobin’s q. Financ. Manag. 1994, 23, 70–74. [Google Scholar] [CrossRef]
- Ranganathan, J.; Corbier, L.; Bhatia, P.; Schmitz, S.; Gage, P.; Oren, K. The Greenhouse Gas Protocol: A Corporate Accounting and Reporting Standard; World Resources Institute and World Business Council for Sustainable Development: Washington, DC, USA, 2004. [Google Scholar]
- Kutner, M.H.; Nachtsheim, C.; Neter, J. Applied Linear Regression Models; McGraw-Hill/Irwin: New York, NY, USA, 2004. [Google Scholar]
- Trucost Plc. Trucost Methodology Overview: Measuring Company Environmental Impacts; Trucost Plc.: London, UK, 2008. [Google Scholar]
- Aqueveque, C.; Pablo Rodrigo, P.; Duran, I.J. Be bad but (still) look good: Can controversial industries enhance corporate reputation through CSR initiatives? Bus. Ethics: Eur. Rev. 2018, 27, 222–237. [Google Scholar] [CrossRef]
- Herold, D.; Lee, K.H. Carbon management in the logistics and transportation sector: An overview and new research directions. Carbon Manag. 2017, 8, 79–97. [Google Scholar] [CrossRef]
- Lee, K.H.; Wu, Y. Integrating sustainability performance measurement into logistics and supply networks: A multi-methodological approach. Br. Account. Rev. 2014, 46, 361–378. [Google Scholar] [CrossRef]
- Freedman, M.; Jaggi, B. Global warming, commitment to the Kyoto Protocol, and accounting disclosures by the largest global public firms from polluting industries. Int. J. Account. 2005, 40, 215–232. [Google Scholar] [CrossRef]
- Freedman, M.; Wasley, C. The association between environmental performance and environmental disclosures in annual reports and 10 Ks. Adv. Pub. Int. Acc. 1990, 3, 163–171. [Google Scholar]
- Kumar, R.; Mieritz, L. Conceptualizing ‘Green’ IT and Data Center Power and Cooling Issues; Gartner, Inc.: Stamford, CT, USA, 2007. [Google Scholar]
- Andersen, M.; Skjoett-Larsen, T. Corporate social responsibility in global supply chains. Supply Chain Manag. 2009, 14, 75–86. [Google Scholar] [CrossRef]
- Herold, D.; Lee, K.H. The influence of internal and external pressures on carbon management practices and disclosure strategies. Australas. J. Environ. Manag. 2019, 26, 63–81. [Google Scholar] [CrossRef]
© 2020 by the authors. Licensee MDPI, Basel, Switzerland. This article is an open access article distributed under the terms and conditions of the Creative Commons Attribution (CC BY) license (http://creativecommons.org/licenses/by/4.0/).