1. Introduction
Equitable access to reliable, affordable, and safe drinking water is essential to human health and livelihood. The Joint Monitoring Program for Water Supply and Sanitation (JMP) estimates that globally, at least 2 billion people use a drinking water source that is contaminated with fecal matter [
1]. Drinking water containing fecal contamination is a leading cause of preventable diseases and higher mortality, particularly through diarrheal infections, which overwhelmingly affect children under five in low- and middle-income countries [
2]. Monitoring fecal contamination in drinking water supplies is a critical function of water service providers. In low- and middle-income countries, service providers often cannot afford the monitoring technologies proven to provide robust data. While the World Health Organization’s (WHO)
Guidelines for Drinking Water Quality have been adopted by most water service providers globally, microbial water quality testing needed to analyze the fecal contamination risk is conducted infrequently [
3]. This is because testing routines are time-consuming, expensive, require trained personnel and consumables, and compete for resources.
Escherichia coli (
E. coli) is the World Health Organization’s (WHO) recommended indicator for fecal contamination of drinking water [
4].
E. coli is the only coliform almost exclusively associated with a fecal source, making it a reliable indicator of fecal contamination in drinking water [
5]. The products currently available for
E. coli testing fall under three categories: Presence–Absence, Most Probable Number (MPN), and Colony Counting. All of these tests require retrieving a sample, typically from a point of water collection or household consumption, along with follow-up laboratory analyses. Microbial enumeration tests, on average, cost approximately
$21 to conduct including consumables, equipment, lab, and logistics [
3]. All of these tests also require 18–48 hours of incubation before the results can be analyzed. This limitation is potentially dangerous: by the time contamination is detected, consumers may already be exposed [
6]. Other important barriers of traditional testing methods include high initial costs, extensive training requirements, inability to provide information on the source of contamination, and a high probability of missed contamination events [
7]. These constraints often prevent service providers from maintaining accurate and precise measures of microbial contamination. This prevents their ability to validate their treatment processes, assess the quality of source waters, perform operational and routine monitoring, and provide verification of the quality of their end product [
8].
Instrumentation used to identify other potential indicators of fecal contamination, including residual chlorine or turbidity, also have important limitations. Residual chlorine presence in drinking water is used to indicate an absence of most disease-causing organisms. For detecting residual chlorine, amperometric and colorimetric sensors have been widely used in water treatment and distribution systems. Amperometric sensors use electrodes to measure a change in current caused by the chemical reduction of hypochlorous acid. These sensors are very sensitive to changes in the water’s pH and thus require frequent recalibration, which has an impact on the sensor’s accuracy over time [
9]. Colorimetric sensors rely on chemical reagents to react with the residual chlorine in the water, and quantify the amount of residual chlorine using a spectrophotometer. The requirement of constant dosing with reagents makes these sensors difficult to employ remotely and autonomously [
10]. Turbidity is the measurement of cloudiness of water. Multiple studies have shown a correlation between turbidity and
E. coli measurements [
11,
12,
13]. There are various methods and instrumentation for measuring turbidity and they do not often produce comparable results. Depending on the size and make-up of the particles in the water, different measurement methods may produce conflicting results [
14]. The turbidity sensors that are available for in-line, continuous monitoring are expensive and require site- and device-specific calibration, limiting their potential for low-cost, remote use [
15].
The United Nations Children’s Fund (UNICEF) has recently identified real-time, in situ
E. coli detection as a “target product” for research, development and ultimately UNICEF procurement [
4]. The Target Product Profile (TPP) presents minimum performance requirements for such a product which include being battery-based, minimal processing requirements, no need for reagent mixing or incubation, qualitative output based on quantifiable ranges of fecal contamination, the ability to sample a variety of water sources, and sensitivity and specificity goals equating to the ability to detect 10 colony forming units (CFUs) per 100 mL, with false positives and negatives below 10%. The product is required to have a detection time of less than 3 hours, a two-year minimum lifespan, and must be portable.
Using spectroscopy to measure tryptophan-like fluorescence (TLF) in drinking water has shown potential to address many of the requirements identified in UNICEF’s TPP. Fluorescence occurs when a molecule absorbs a photon from light at a specific wavelength, known as the excitation wavelength. The absorbed photon causes an electron to jump to a higher energy state. Once the electron drops back down to its ground electronic state, it emits a photon at another, higher, specific wavelength, known as the emission wavelength [
16]. TLF measurements rely on the intrinsic fluorescence of the aromatic amino acid, tryptophan, whose presence is often related to microbial activity [
17]. Compared to the other two aromatic amino acids (phenylalanine and tyrosine), tryptophan is the dominant intrinsic fluorophore, absorbs light at the longest wavelength, and displays the largest extinction coefficient. Microbial activity also converts tryptophan to indole which enhances its fluorescence output because indole exhibits a similar fluorescent signature to tryptophan and fluoresces at approximately 33% greater intensity [
16,
18].
E. coli produces indole from lactose and tryptophan causing it to have the highest TLF per occurrence compared to other bacteria [
19]. A major challenge with associating TLF with bacterial concentrations in drinking water is the presence of multiple compounds emitting TLF. TLF can be contained within bacterial cells as well as be associated with particles or entirely freely dissolved [
20,
21]. This leaves uncertainty over what is actually being measured.
Nonetheless, multiple recent studies have shown TLF measurements can be used as an alternative or additive risk assessment tool to traditional microbial testing methods. Strong correlations are shown between the presence of TLF and that of heterotrophic bacteria,
E. coli, and total coliforms in drinking water [
22,
23,
24]. Nowicki et al. (2019) showed that TLF is “precise, rapid, and practical for groundwater sampling”, but that it should not act as a proxy for
E. coli measurements [
24]. The ability of the instruments tested to produce exact correlation to traditionally used plate counts is limited because of noise in the output signal as well as the detection limit of the sensor. TLF is shown to have greater success distinguishing between the established WHO microbial risk levels [
18]. The WHO has established decimal categories of potential health risk related to
E. coli or thermotolerant coliform (TTCs) concentrations. These risk categories are low (<1 CFU/100 mL), intermediate (1–10 CFU/100 mL), high (11–100 CFU/100 mL), and very high (>100 CFU/100 mL), as shown in
Table 1 [
25]. This approach has the potential to improve risk assessment of microbial contamination in drinking water, especially when coupled with traditional methods.
Most established literature only examines and demonstrates these theories with submersible or cuvette-based, portable fluorimeters that are currently available on the market. Sorensen et al. (2018) compiled data from recent studies analyzing the ability of both submersible (the UviLux from Chelsea Technologies Group Ltd., UK) and cuvette-based (the SMF4 from STS Instrument Ltd., UK) fluorimeters to indicate fecal contamination risk in drinking water [
18]. The study found that TLF had the ability to classify high-risk sources containing >10 CFUs/100 mL. This coliform threshold was correlated with a tryptophan concentration of 1.3 parts per billion (ppb). The sensors analyzed were not intended for long-term, autonomous operation and were expensive, ranging from
$4000–
$10,000. Recent advances in the semiconductor industry are quickly driving down the costs of high sensitivity and high-power components included within these sensors, namely deep-UV light emitting diodes (LEDs) and sensitive semiconductor photodiodes and photomultipliers. To our knowledge, the only attempt at the design of a low-cost, flow-through fluorimeter sensor for fecal contamination detection in drinking water was conducted by Simões and Dong (2018) [
26]. In that study, a sensor design was presented with a limit of detection of 1.4 x 10
3 CFU/mL. This research presents an improvement of that detection limit with the design of a low-cost, remotely reporting, near-time TLF sensor for detecting high-risk (>10 CFUs/100 mL) fecal contamination in drinking water along with the preliminary validation data. A viable internet of things-(IOT) based TLF sensor for monitoring fecal contamination risk in resource constrained and power constrained environments would be compatible with a wide variety of water distribution infrastructures, would keep a running log of the baseline and off-nominal TLF features of the water source, and have the capability to trigger an alarm through IOT channels in the event of a sudden increase in TLF. This research shows the potential of an instrument capable of fulfilling these requirements while significantly decreasing costs by taking advantage of recent semiconductor technologies to replace complex and expensive optical systems.
2. Materials and Methods
We first demonstrated a detectable correlation between TLF and
E. coli using novel components, replicating results from traditional bench-top fluorimetry methods. We then developed a novel flow-through sensor and tested its sensitivity limits compared to corresponding WHO microbial risk levels. This section describes several elements of these demonstrations. Typical fluorescence sensors contain an emitter, detector, and various filters and lenses in order to direct light at the required wavelengths for optimal sensitivity. In order to achieve a sensitivity capable of measuring high-risk microbial contamination in drinking water, the literature shows a necessary limit of detection (LOD) between 1-1.3 ppb tryptophan [
7,
24]. The goal of this study was to first test this theory, then to design a low cost, flow-through instrument that could achieve that LOD.
2.1. TLF Response to E. coli Concentration Validation
Before the design of a prototype could begin, a validation of the correlation between TLF and
E. coli contamination of water was performed. The intent was to better characterize testing for
E. coli at the 1–10 CFU/mL level. These experiments were conducted on a Cary Eclipse Fluorescence Spectrophotometer and compared
E. coli fluorescence response to that of L-tryptophan. Serial dilutions of F-amp
E. coli were produced from 8 x 10
8 CFU/mL, down to the 0.8 CFU/mL level.
E. coli were quantified in water samples using membrane filtration followed by 24 hours of incubation at 35° C in accordance with EPA method 1604 [
27]. Samples consisted of 4 mL aliquots for 0.8, 4.0, 8.0, 40.0, and 80.0 CFU/mL. The TLF response of these samples was compared to that of previous L-tryptophan responses on the same spectrofluorometer.
2.2. E. coli Detection Limits
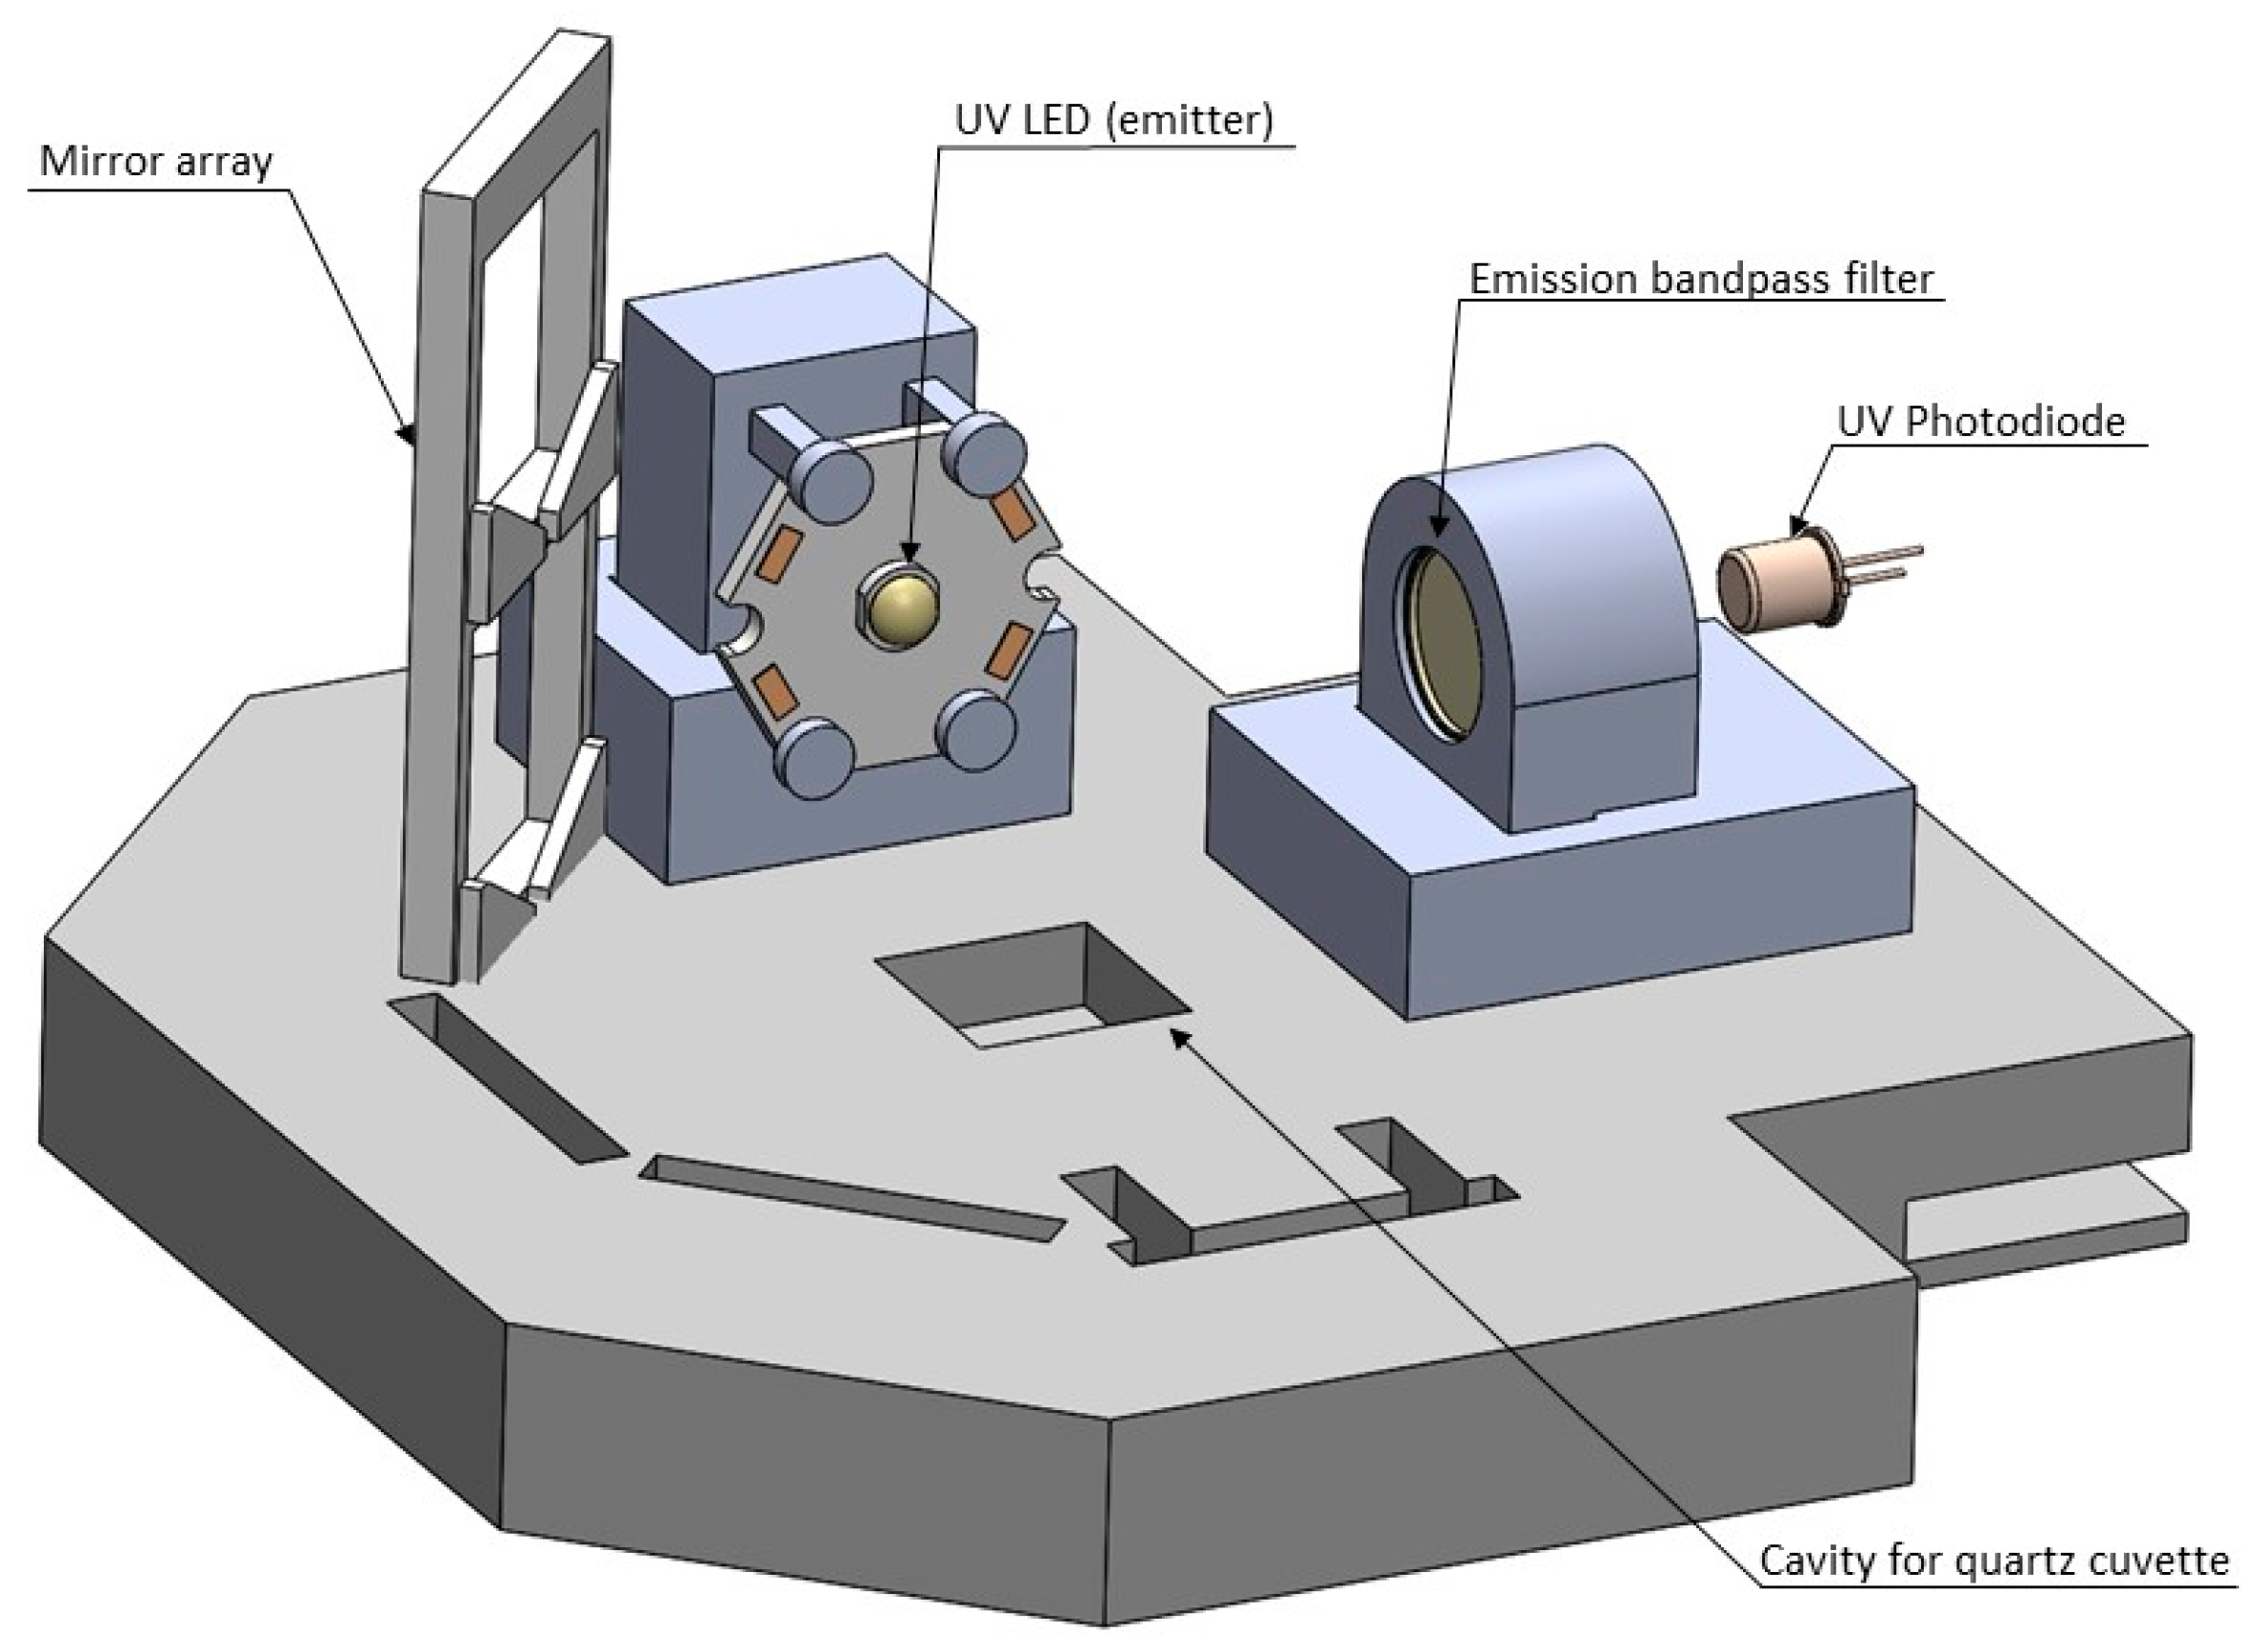
Based on the results from the spectrofluorometer, a prototype was designed. It used stationary samples contained in a quartz cuvette, RayVio XD 280 nm UV LEDs, an Edmund Optics optical band-pass filter centered around 355 +/- 10 nm, and a Thorlabs UV photodiode. The signal from this photodiode was amplified using a current-to-voltage converter circuit and a series of inverting op-amp circuits to filter and amplify the output. These circuits were built using TL084 op-amps, and amplified the output voltage by a factor of 5000. The amplified signal was measured and displayed for the user through an Arduino Uno, with maximum voltages being reported for each test. Updates to the system were made between design iterations. These updates sought to increase the consistency of the sensor’s output and the difference in output between clean water and contaminated water. Major adjustments included treating the photodiode output as a current source versus a voltage source (this change occurred after the first iteration), and the use of Lithium batteries to increase consistency of LED output. The design of prototype iteration 5 is seen below in
Figure 1.
Before the tests were performed, the UV cuvette was cleaned, flushed with deionized water, and dried. Sample containers were similarly cleaned, flushed with deionized water, and dried. Samples were made as serial dilutions, with an original stock solution of F-amp E. coli at 8x10⁸ CFU/mL. Twenty mL of each serial dilution were made down to the 0.4 CFU/mL level. Dilutions were made using DI water, down to the 0.4 CFU/mL.
For each test, 4 mL of the sample was pipetted into the cuvette. Between each test, the cuvette was flushed with DI water. All tests were conducted with the cuvette being placed inside the light-tight box containing the testing equipment, which remained slightly above room temperature throughout testing. When the sample was sealed in the container, the Arduino Uno switched on the UV-LEDs on a pulse with 85% duty cycle, and recorded the output voltage. Four tests were conducted for each concentration, and the averaged peak of these samples was calculated.
Testing was carried out by first characterizing response to DI water to establish a reference point. This characterization process follows the testing procedure listed above. Each concentration was subsequently tested from the 0.4 CFU/mL sample up to the 800 CFU/mL sample.
2.3. TLF Signal Optimization
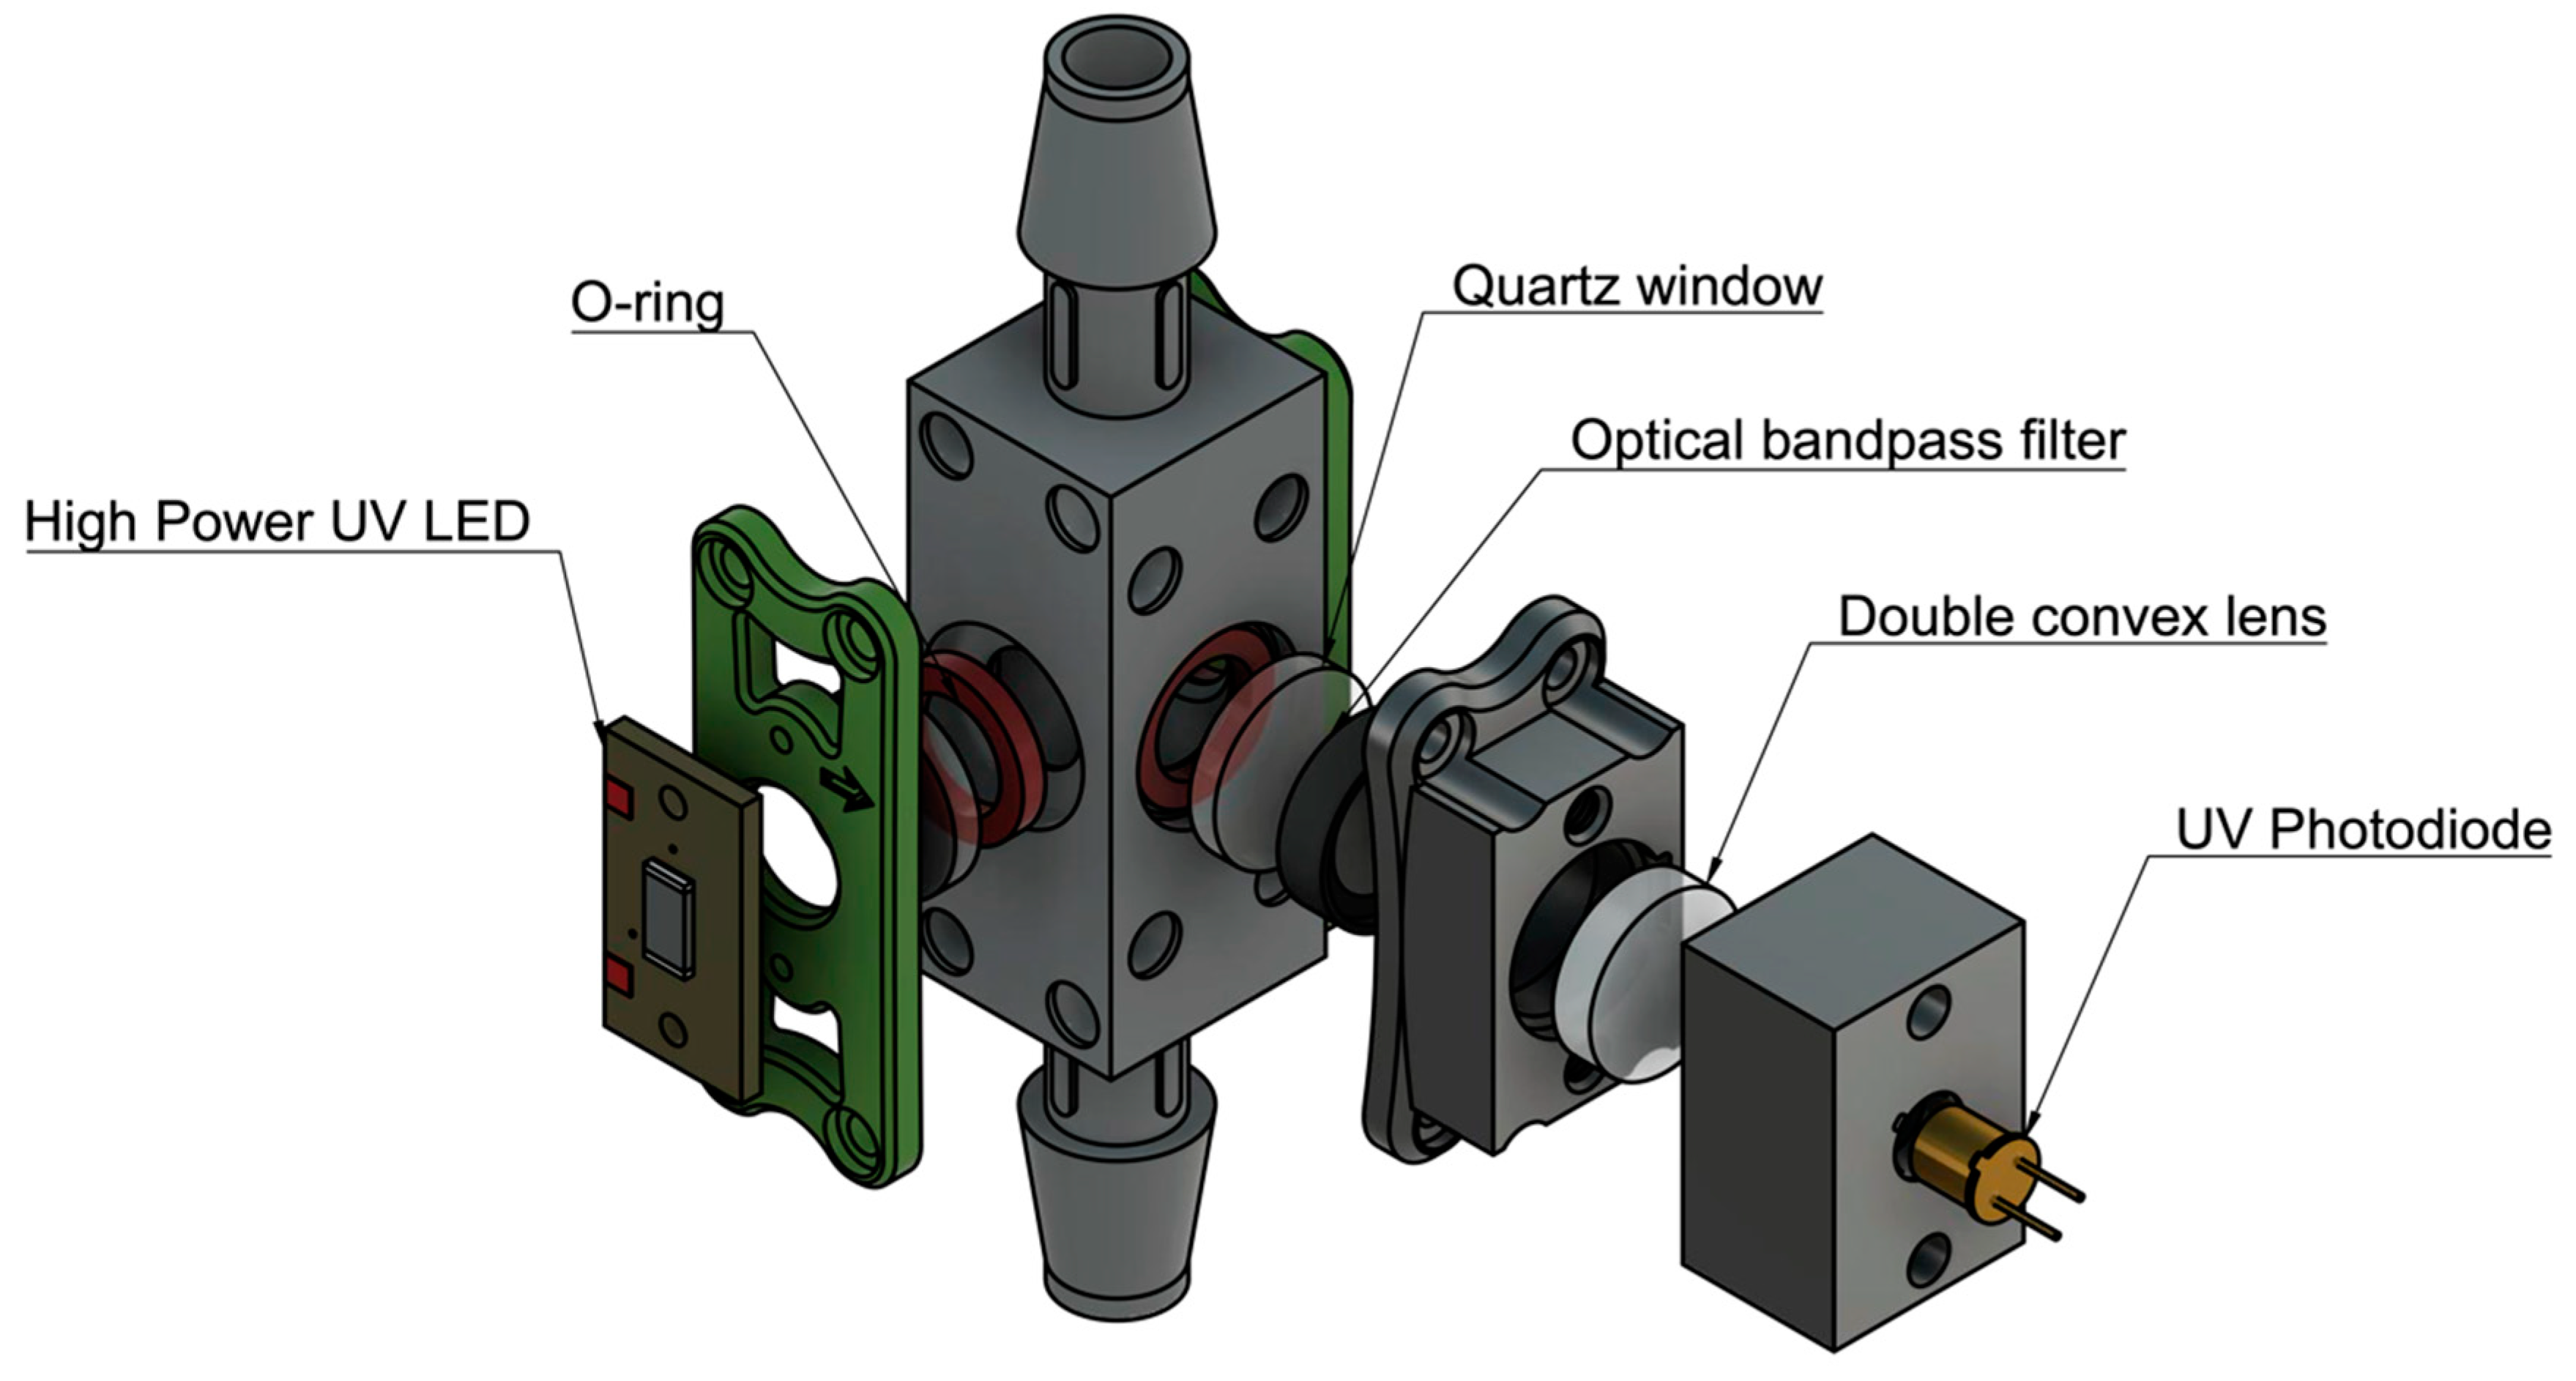
Based on the results found in the detection limits part of this study, a field-deployable product design approach was employed. The sensitivity of the instrument was optimized by completing successive experiments with differing components and placement. First, a static system was designed and optimized using a UV quartz cuvette (FireflySci) containing the sample water. Components were held in place by 3D printed parts designed in Autodesk’s Fusion360 and printed on a Formlabs Form2 stereolithography printer. The initial prototype components include a UV-LED centered around 280 nm (Marktech Optoelectronics) with no secondary optical bandpass filter; a UV Photodiode centered around 350–360nm (Marktech Optoelectronics), a double converging lens with UV transmission coating (Edmund Optics), and an emission bandpass filter (Edmund Optics), shown in
Figure 2.
The sensitivity was initially tested by mixing solutions of 1, 10, 100, 10,000, 100,000 ppb L-tryptophan in deionized (DI) water. The concentrations were mixed using serial dilutions and measured on the same day of mixing. Each concentration was pipetted into the quartz cuvette, placed in the prototype, the LED was powered using a regulated power supply and 100 readings were taken from the photodiode by a Keithley 6485 Picoammeter. Readings were averaged and the noise level was subtracted from each measurement. Signal optimization was attempted by successive experiments with differing components and placement.
The first component and configuration tests included four different iterations. First, the original prototype, second, moving the emitter back to its focal length, third, placing a concave mirror across from the emitter, and fourth, placing a concave mirror across from the detector.
The prototype did not consistently produce a signal at the desired sensitivity in the 1–10 ppb range. A hypothesis was formed that increasing the number of emitters would increase the sensitivity by increasing signal-to-noise ratio (SNR). Experiments were then run using 1, 2, 3, and 4 LEDs of the same type and the SNR was compared at 100 ppb L-tryptophan measurements. These results were also compared to the SNR produced using two high-powered LED’s along with a higher responsivity photodiode.
Using two high-powered LEDs consistently showed the sensitivity needed at lower concentrations—1, 3, and 10 ppb of tryptophan—sufficient to move forward with the flow-through design.
2.4. Flow-through Demonstration
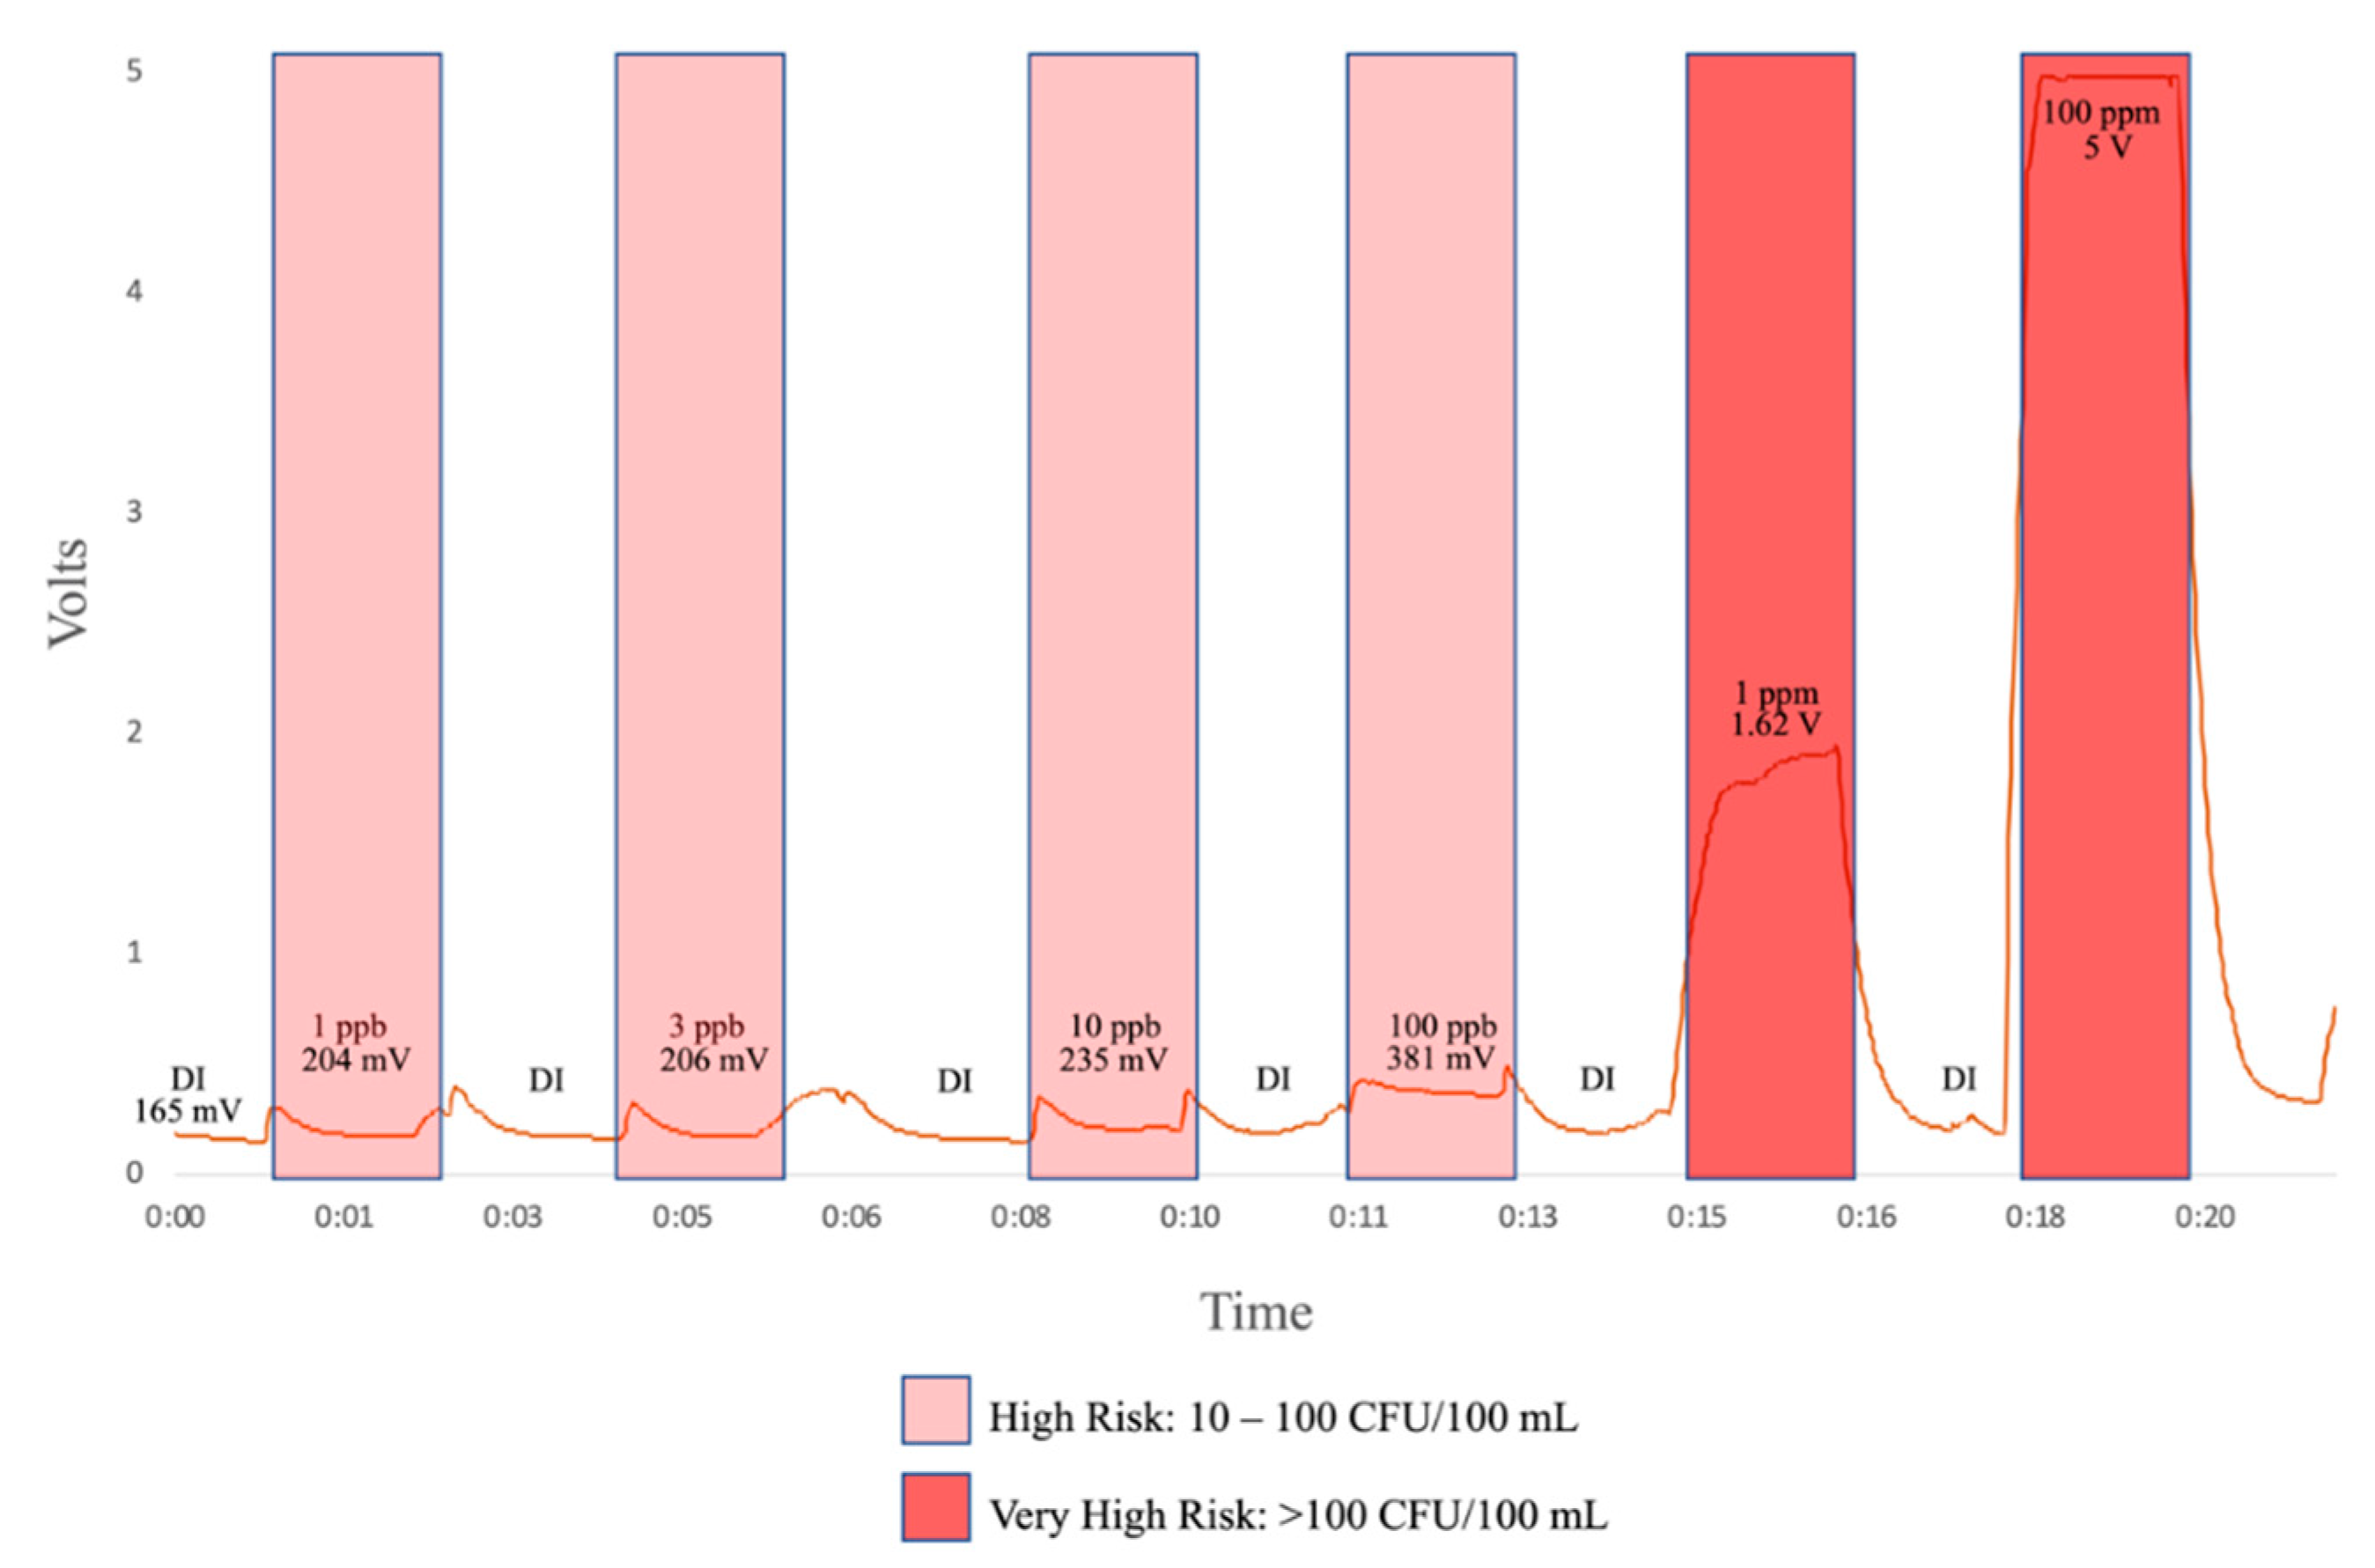
Once the desired sensitivity was achieved on a static, cuvette-utilized setup, a flow-through unit was designed (
Figure 3). The preliminary flow-through design uses three 12.5 mm diameter quartz windows for the LEDs and photodiode to fluoresce and detect the sample. The design incorporates O-rings to seal the sample flowing through a 12 mm x 12 mm cavity, shown in
Figure 3. The flow-through prototype was further developed by adding a femtoampere input bias current electrometer amplifier (Analog Devices) to convert the output signal from the photodiode from picoamps to millivolts. Water was pumped through the prototype using a peristaltic pump at a flow-rate of 10 mL/s and the sensitivity of the design was tested using 1, 3, 10, 100 ppb L-tryptophan solution.
4. Discussion
In this work, we explored the initial development of a low-cost, continuously monitoring TLF sensor to remotely report fecal contamination risk in drinking water. These design approaches first successfully demonstrated a correlation between TLF and E. coli using existing spectroscopy technology. This presents evidence of the current potential to quantify TLF instantaneously at a sensitivity that is meaningful for monitoring drinking water quality. We used that evidence to design a simple, one UV-LED, one photodiode fluorimeter to test the feasibility of producing a cost-effective fecal contamination risk sensor. That configuration achieved a LOD of 4 CFU/mL E. coli on a bench-top prototype. This sensitivity limit will not allow for presence/absence detection of contamination or detection of low or intermediate risk, but can provide information and data on sources containing high-risk contamination. Since E. coli is an indicator of fecal contamination, this initial prototype design indicates the potential for TLF to detect potentially harmful pathogens in drinking water, even with the cheapest available emission and detection technology. We then developed and demonstrated a two-LED flow-through configuration capable of detecting TLF levels corresponding to high-risk fecal contamination levels (>10 CFUs/100 mL). The flow-through design shows that a TLF product capable of continuous detection is a viable option for real or near-time detection of fecal contaminated in drinking water, which is currently being consumed by approximately 2 billion people globally.
The design presented in this paper has the potential to respond to the majority of UNICEF’s needs for a novel, real-time, in situ E. coli detection device. The device can be battery-based, has a processing time requirement of milliseconds, eliminates the need for a reagent or incubation, and presents qualitative output based on fecal contamination ranges greater than 10 CFUs/100 mL. Further testing will need to be conducted to determine the sensor’s false positive and false negative error rates.
The novelty of this work lies in the sensor cost and its ability to monitor water contamination risk continuously. The prototype sensor is envisioned to be an order of magnitude more affordable than currently available on the market by employing newly available semiconductor technologies. Where existing sensors available for TLF measurements are portable and handheld, the sensor presented in this paper will have the ability to be installed in-line in drinking water distribution systems and report remotely in near-time. This has the potential to provide actionable fecal contamination risk data to water service providers in low-income settings, positively impacting important decision making and leading to improved health and livelihood of consumers.
Moving forward, interference in the current design’s signal from physicochemical parameters will need to be determined. Temperature, pH, and turbidity, can all impact TLF signal, although these impacts are most important outside of typical natural ranges. Increasing temperature can reduce fluorescence intensity, signal quenching can be up to 15% in waters with low pH (below 4.5), and turbidity may have varying impacts on the signal depending on the contents of the water [
20,
28,
29]. The current configuration may require an added thermocouple for correction measurements and limits may need to be set on specific use cases of the sensor. Some of these challenges can be addressed by advanced signal processing utilizing data from large networks of sensors deployed in one area.
Barriers to this design approach for detecting
in situ fecal contamination primarily include biofouling and baseline drift that attenuate and ambiguate the signal [
30]. The extent of biofouling varies as a function of the environment. Typically, careful cleaning and calibration must be performed at each sample site. Current anti-biofouling mechanisms include the use of shutters, plates, and wipers which all require frequent maintenance and upkeep.
In further work, we will attempt to address signal drift through machine-learning based synthetic calibration to enable alarm-threshold detection [
31]. Through a combination of low-cost, robust hardware design and machine learning, we will attempt to address the signal drift limitations through long-term characterization of in situ water quality, and identify potential microbial contamination through alarm-based event detection. This will allow for site sensor-specific baseline calibration and the detection of sudden and large changes in TLF rather than relying on a universal threshold for all sensors.


