Article

Vulnerability and Resilience Analysis of the Air Traffic Control Sector Network in China

1
College of Air Traffic Management, Civil Aviation University of China, Tianjin 300300, China
2
Department of Engineering, Centre for Smart Infrastructure and Construction, University of Cambridge, Cambridge CB2 1PZ, UK
*
Author to whom correspondence should be addressed.
Sustainability 2020, 12(9), 3749; https://doi.org/10.3390/su12093749
Submission received: 23 March 2020 / Revised: 17 April 2020 / Accepted: 1 May 2020 / Published: 6 May 2020
(This article belongs to the Special Issue Aviation Management and Air Transport Industry)

Abstract

:
Sustainability and its component resilience have become an important issue that cannot be neglected in airspace planning and development. Resilience, as an emerging system concept, is critical to sustainability in many fields. With the rapidly growing demand in China’s air transportation sector, airspace congestion and flight delays have become a major issue in the fast development of this sector, and threatens the sustainability and resilience of air traffic control (ATC) systems such as waste of resources, air pollution, etc. Sectors, the basic units of an ATC system, play a significant role in ensuring the safe and smooth operations of day-to-day flights. In this paper, we apply the complex network theory to establish a model of China’s air sector network (CASN) and examine a series of characteristic parameters with an empirical analysis on its vulnerability and resilience. Through a simulation-based approach, the CASN’s resilience was quantitatively assessed with a resilience indicator (RI) in different scenarios to identify the optimal recovery strategy for building higher system resilience. The results show that the CASN has a lengthy average shortest path and a small clustering coefficient, which demonstrates a hybrid topological feature. We have also found that betweenness has the greatest impact on the resilience and has managerial implications to understand the relationship between vulnerability and resilience in CASN, so as to achieve the resilience and sustainability of CASN.

1. Introduction

In the past decade, the average annual growth rate of China’s air traffic volume was around 10%, which is considered far higher than that of the United States and Europe, according to the China’s 2017 civil aviation airspace development report. Such a large volume of traffic demand leads to a severe problem that flight delays has been constantly increasing in the same time, which not only affects the economic benefits of airlines but also increases side effects such as consumption of public resources, exhaust emissions, and noise. Among them, air traffic congestion is one of the main reasons leading to massive flight delays. According to the Civil Aviation Administration (CAA) of China (2017), the average on-time rate of domestic passenger airlines decreased to 71.67%, which was 7.17% lower than that of the previous year, with a delay time of 24 min on average (8 min more than the previous annual figure).
Sectors, the basic units of the air traffic control (ATC) system, designed by certain operational rules to improve air traffic service quality and operation safety and efficiency, are connected by flights and ATC equipment to form a complex transport network. The analysis of the complexity and topological characteristics of the network is conducive to optimizing airspace configuration and reducing air traffic congestion so as to remedy flight delay [1].
Vulnerability and resilience are important components of sustainable development, and have been widely investigated in urban planning and design. Vulnerability, an important property of complex networks that originated from the study of natural disasters [2], refers to the connectivity of the network being compromised when the nodes or edges were attacked compared with that under normal situation [3]. Vulnerability research is a hot issue and an important analytical tool in the field of global change and sustainability science. It has been widely used in many research fields, such as the power system [4,5,6], transportation [7,8,9,10], biology [11], and other fields. The ATC system is a complex system composed of multiple factors such as people, aircraft, and the environment, which both are not independent but deeply linked together. When the system is disturbed by disruptive events such as congestion, accidents, construction, and extreme weather events, it can lead to inefficient operations and costly delays, which may exacerbate problems such as air pollution, fuel consumption, and infrastructure deterioration [12]. Therefore, it is significant to align resilience with an ATC system. With the increase of air traffic volume, the uncertainty factors and unknown risks faced by ATC systems are also increasing. The vulnerability of the ATC sector network refers to the decline in the sector’s serviceability compared with previous abilities due to severe weather, military activities, equipment failure, and other emergencies. In the face of all kinds of sudden natural and man-made disasters, most of the air transportation systems often show great vulnerability [13], which is gradually becoming a bottleneck problem restricting the aviation industry and its sustainable development. Therefore, a sustainable and resilient ATC sector network is playing an important role in airspace planning and development.
On the other hand, to better understand the performance of the system during and after disruptive events, and to maintain the sustainability of the system or environment, resilience analysis provides a new perspective and an alternative way to improve the function of the system by preventing disaster before destruction event, reducing performance loss during event, and improving system recoverability after the event. A sustainable system offers greater flexibility, coordination, and redundancy. It aims to ensure that environment, social, and economic considerations are factored into decisions. At the same time, a resilient system highlights the capacity to absorb disturbances and adapt to unexpected events in order to improve its safety and availability [14]. The word resilience originates from the Latin word “resiliere,” which means to bounce back [15]. The concept of resilience contains multiple dimensions and is closely related to fault-tolerance, robustness, adaptability, and flexibility. The corresponding definitions of resilience were given in different research fields [16,17,18,19,20]. Although there is no uniform definition, the system that is able to reduce the initial negative effect, adjusts itself to adapt the disturbance and eventually recovers from the disturbance would be a definition with which many would largely agree [21,22,23,24]. In recent years, resilience has increasingly been seen in the research literature and has become a major concern for the power system [25,26], water resources [27], the military [28,29], ground infrastructure [30], and transportation [31,32,33,34,35]. Researchers have proposed several methods and frameworks to assess and analyze the resilience of the system in a comprehensive manner. In 2015, Hosseini, S. et al. summarized and reviewed papers on the definition and quantification of resilience in various disciplines in recent years, including social, engineering, and economic fields [15]; Cen, N. et al. proposed a quantitative method for assessing system resilience, defining resilience as the ability of a system to withstand changes or disruptions by reducing initial negative impacts (absorptive capacity), adapting it (adaptive capacity), and recovering from it (recovery capacity), and the feasibility and applicability of the method were tested for the power system [21]. In an urban transportation network, sustainability and resilience are the key factors for using the infrastructure efficiently, economically, and environmentally to meet the basic needs of individuals in order to balance the impact on urban environment and natural resources. It can be achieved through minimize emissions and waste, limit fuel consumption, and maximize the capacity to cope with unexpected events and to improve safety on roadways [14]. Therefore, considering the unclear relationship between vulnerability and resilience in aviation, and the significant role of air transport in the provision of basic services, there is a need to study the resilience of ATC sector networks to better achieve sustainability for the ATC system.
It has been well acknowledged that the critical infrastructure which promotes the mobility of goods, people, and information around the world is mostly networked systems [36]. Complex network theory has been widely applied in the design of transportation systems, such as urban traffic [37,38], railway [39], or subway networks [40], and has also become one of the most important means of investigating aviation networks [41,42]. The literature [43,44,45,46,47] indicated that the aviation network is a small-world network (with small average shortest path length and large clustering coefficient) and its degree distribution follows a power-law probability distribution. Cai et al. constructed a Chinese air route network (CARN), with the waypoints as nodes for the first time and conducted an empirical analysis on CARN [48]. Zeng conducted an empirical analysis on the Chinese aviation network from perspectives of topology, hub level, and invulnerability by using complex network theory [49]. Li et al. established the evaluation methods of airport importance and network efficiency, and then compared the vulnerability of the US and China’s airport networks [50]. Oriol et al. conducted research on airport networks and they split the world airport network (WAN) into seven global region airport networks (GRANs), determining core cities through k-core decomposition and robustness analysis [36]. Li et al. proposed a model for resilience of the Chinese airport network (CAN) with data from real-world and obtained its performance from topology analysis and dynamic procedures [51]. Ren et al. constructed an air sector network (ASN) model, proposed a node ranking algorithm to identify key sectors, and analyzed the topological structure of the ASN [1]. The complex network theory provided a practical approach to evaluate some of the generic attributes hidden beneath the complexity of the system topology, but this theory largely relies on a comprehensive knowledge of the system topology, which might become a strong limitation when the topological structure of the system is not fully achievable [52]. The previous analyses of aviation networks are mainly focused on the airport or air route networks. The research on ATC sector networks was very limited. Besides, the studies on air sectors mainly focused on sector capacity evaluation [53] and sector division [54] and have not touched on the topological structure and traffic distribution characteristics of the ATC sector network from a system-based standpoint.
According to the previous analysis, most of the studies on aviation networks mainly focused on an airport network or air route network, and a very limited number of studies involved ATC sector networks. Research on vulnerability and resilience is also needed in ATC sector network studies. In this paper, an ATC sector network model was constructed based on complex network theory. Taking the sector within the airspace of China mainland as an example, we conducted an empirical analysis on topological characteristics of the model. Then, the vulnerability and resilience of the ATC sector network were analyzed. The main contributions of this paper can be summarized as follows:
  • By combining the control sector with complex networks, this paper enriches the research scope of aviation networks, which provides an alternative perspective and a new comparative investigation to studies in airport networks and air route networks.
  • We investigated the relationship between vulnerability and resilience of the ATC sector network under disruptive events, which fills one research gap in the air transportation community by improving the understanding of this type of complex system.
  • The results have practical implications that can be used to effectively evaluate the vulnerability of the ATC sector network and improve the network resilience, reducing flight delay and air traffic congestion, and thus improving the efficiency of airspace operation. Also, the research method and approach demonstrated in this paper is transferable to other infrastructure systems as well.
The remainder of the paper is organized as follows. Section 2 introduces the materials and methods. Then, Section 3 provides data acquisition and description. After that, Section 4 demonstrates the analysis and discussion of the results, including empirical study, vulnerability, and resilience analysis of CASN. Finally, we end this paper in Section 5 by providing concluding insights and giving future research implications.

2. Materials and Methods

2.1. Control Sectors Network Construction

Under the complex network theory, the ATC sector network can be abstracted into a graph G = ( V , E ) consisting of a node set V and an edge set E . The number of nodes is N = | V | and the number of edges is M = | E | . The ATC sector network model construction rules are as follows:
  • Each sector is considered as a node, and the edge is constructed according to flight flow relationships between adjacent sectors;
  • If sector A has a flight to sector B, we consider that there is an undirected edge between A and B;
  • Sectors are divided into high-altitude sectors and low-altitude sectors. If sectors of different heights have the same projection on a two-dimensional plane, these sectors are considered as one node.
  • The ATC sector network model is an undirected weighted network. The weight of a sector node is the sum of the flights connecting all edges of the sector.
Figure 1 shows the sector structure of Mainland China, in which we can see that sectors are unevenly distributed in space, the sectors in the east are very dense, and the sectors in the west are relatively sparse. By using the complex network theory, the CASN model was constructed as shown in Figure 2. It can be seen from the figure that the air traffic flow between the sectors in North China and Central South is relatively close and the controller has a large workload.

2.2. Network Centrality

The network centrality can reflect the network topological characteristics. Combined with the features of an ATC sector network, we adopted several widely applied and well-documented network centrality indicators to conduct an empirical analysis on CASN, all of which have been applied in many research areas. Strength is an extensive degree metric applied to practical issues, which represents the strength of the nodes based on its overall connection [46]. The degree of node is defined as the total number of edges linking it to other nodes [55]. Connections with the neighbors of the node are indicated by the clustering coefficient, which weighs the clustering level of the network [56]. The path length of two nodes is defined as the minimal number of edges connecting them [57]. The transfer loads on nodes can be represented by the betweenness, which indicates the importance of the nodes in the network structure, and in China railway network, it has been proven useful to have a larger average clustering coefficient and a smaller average shortest path length, which showed a small-world network with scale-free properties [58]. More definition details about the specific network centralities we used in this paper are shown in Table 1.

2.3. The Vulnerability of CASN

Vulnerability is the inherent and essential attribute of the system [59], which can be studied by simulating attacks on the networks. At present, the vulnerability analysis of complex networks mainly studies the changes of the selected Key Performance Indicators (KPIs) by attacking some nodes and their connected edges of the network. There are two strategies for network node and edge attack, namely random and deliberate attack, respectively. Random attack (RA) refers to randomly selecting a certain proportion of nodes in the network to attack, and the number of nodes being attacked increases gradually. In the ATC sector network, RA represents severe weather, equipment failure, and the spread of infectious diseases, resulting in the temporary closure of airports, waypoints, and sectors. Deliberate attack, in this paper, which includes degree attack (DA), betweenness attack (BA), and strength attack (SA), refers to selecting nodes to attack based on a certain strategy.
Through measurement and analysis, we can explore the vulnerable source of system and take measures to improve the resilience of system against disturbance, to reduce flight delays, and to reduce airspace congestion, thereby reducing exhaust emissions and noise pollution, improving operational safety, and ensuring harmonious coexistence between humans, society, and nature. This paper mainly analyzed the structural vulnerability of CASN by using the network efficiency and the maximum connected subgraph relative value. The specific parameters are as follows:

2.3.1. Network Efficiency

This indicator is mainly used to represent the accessibility of the entire network, and the formula is as follows [3]:
E = 1 N ( N 1 ) i j N 1 d i j
where E represents the network efficiency, and d i j indicates the shortest path length from sector i to sector j . If there is no path connection between sector i and sector j , then d i j = . The value range of network efficiency E is [ 0 , 1 ] . The higher the value of E , the better the network connectivity.

2.3.2. Maximum Connected Subgraph Relative Value

Maximum connected subgraph relative value represents the ratio of the number of nodes contained in the largest subgraph in a complex network to the total number of nodes in the entire network, and the formula is defined as [55]:
G = N N
where G is the maximum connected subgraph relative value, which can be used to measure the extent of network collapse. When G = 1 , indicating that the network is complete, and when the network is severely destroyed, successive failures occur. N is the quantity of all nodes in the sector network, and N is the number of nodes remaining in the maximum connected subgraph after some nodes are removed from the network under attack.

2.4. The Resilience of CASN

The resilience assessment of CASN refers to the analysis of the system’s ability to absorb, adapt to and eventually recover from external disturbances [52]. These external disturbances include extreme weather events, military activities, equipment failures, and the spread of the epidemic, leading to the closure of airports and sectors. After the disturbance, the performance of the system is restored to the normal level by adaptive adjustment. The specific manifestations are increased airspace capacity, normal air traffic order, and reduced flight delays.
Figure 3 shows the system resilience profile. The x-axis is time and the y-axis is the system level of performance (LOP). There are many indicators to characterize the system performance level, such as flight delay time, number of cancelled flights, connectivity of network, etc. The selection of appropriate indicators depends on the specific content of research. This article used Equations (1) and (2) to represent the level of performance. It is assumed that the LOP is normalized between 0 and 1, where 0 represents the system being paralyzed and 1 indicates that the system is in stable phase. The figure contains four phases, where the first phase is the original steady phase ( t 0 t < t d ) and the system performance assumes its target value. The second phase is the disruptive phase ( t d t < t r ) , in which the disruptive event occurs at t d and the LOP starts dropping until it reaches the lowest level at time t r . The third phase is recovery phase ( t r t < t n s ) , in which the LOP starts increasing until it reaches a new steady phase. The fourth phase is the new steady phase ( t t n s ) , in which the system performance recovers to its original state. In order to measure the overall performance loss of the system during the disruptive phase and the recovery phase, we adopted the following Resilience Index (RI) to measure the system’s resilience [60].
R = t d t n s P ( t ) d t t d t n s P ( t 0 ) d t
where t d is the time that system performance starts to decline and then recovers to the original phase at time t n s . P ( t 0 ) is the target value of system performance and P ( t ) is the function over time. From the Equation (3), the resilience of the system indicates the ratio of the shadow area to square area.
When the ATC sector network node is attacked, then the node fails and the edge connected with the node is removed immediately, thus forming a new network and calculating the performance index value of the new network. Then, different recovery methods are adopted to recover failed nodes, namely random recovery and deliberate recovery. Random recovery is used to randomly sort the failed nodes and recover the nodes according to the order. Deliberate recovery means that the degree and betweenness of failed nodes are sorted from large to small, and then they are restored in order. When the failure nodes are recovered, the edges connected to the node are also recovered immediately. The attack and recovery rules of CASN are as follows:
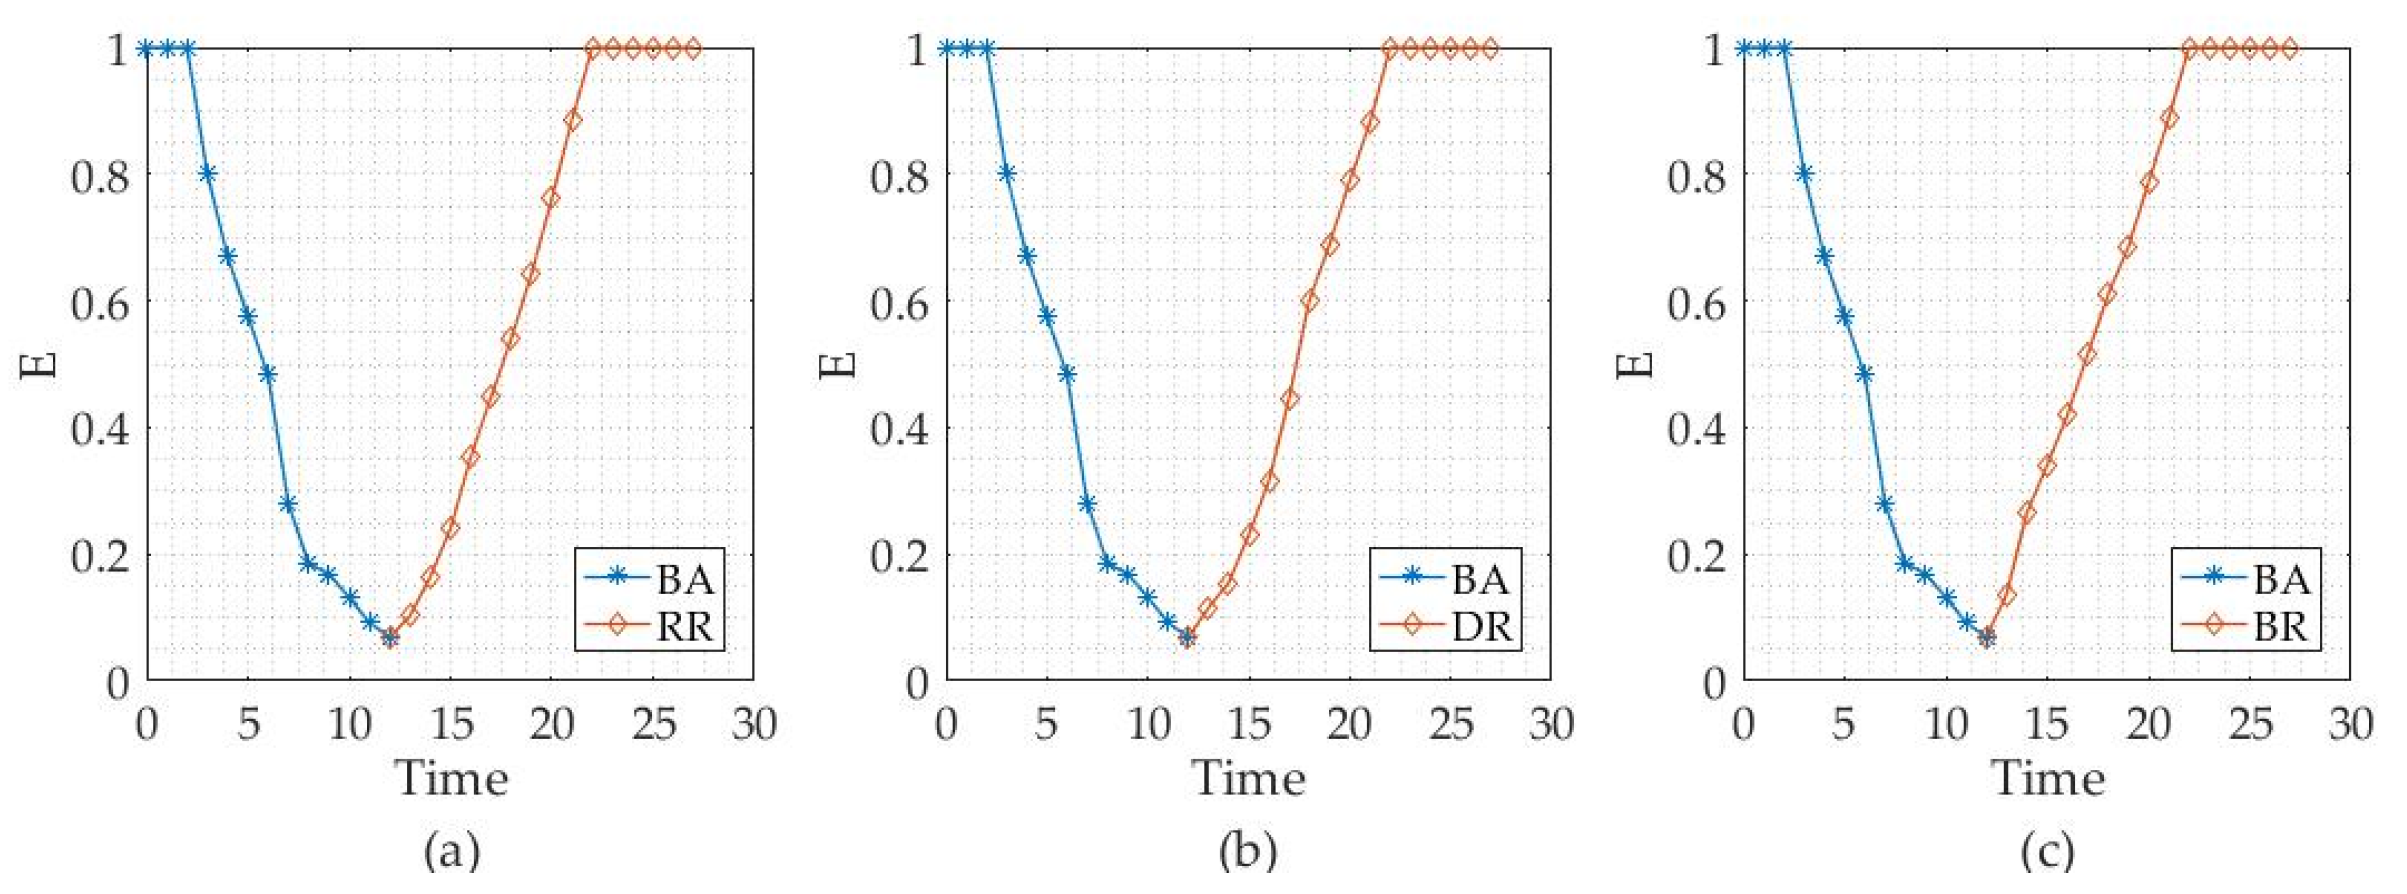
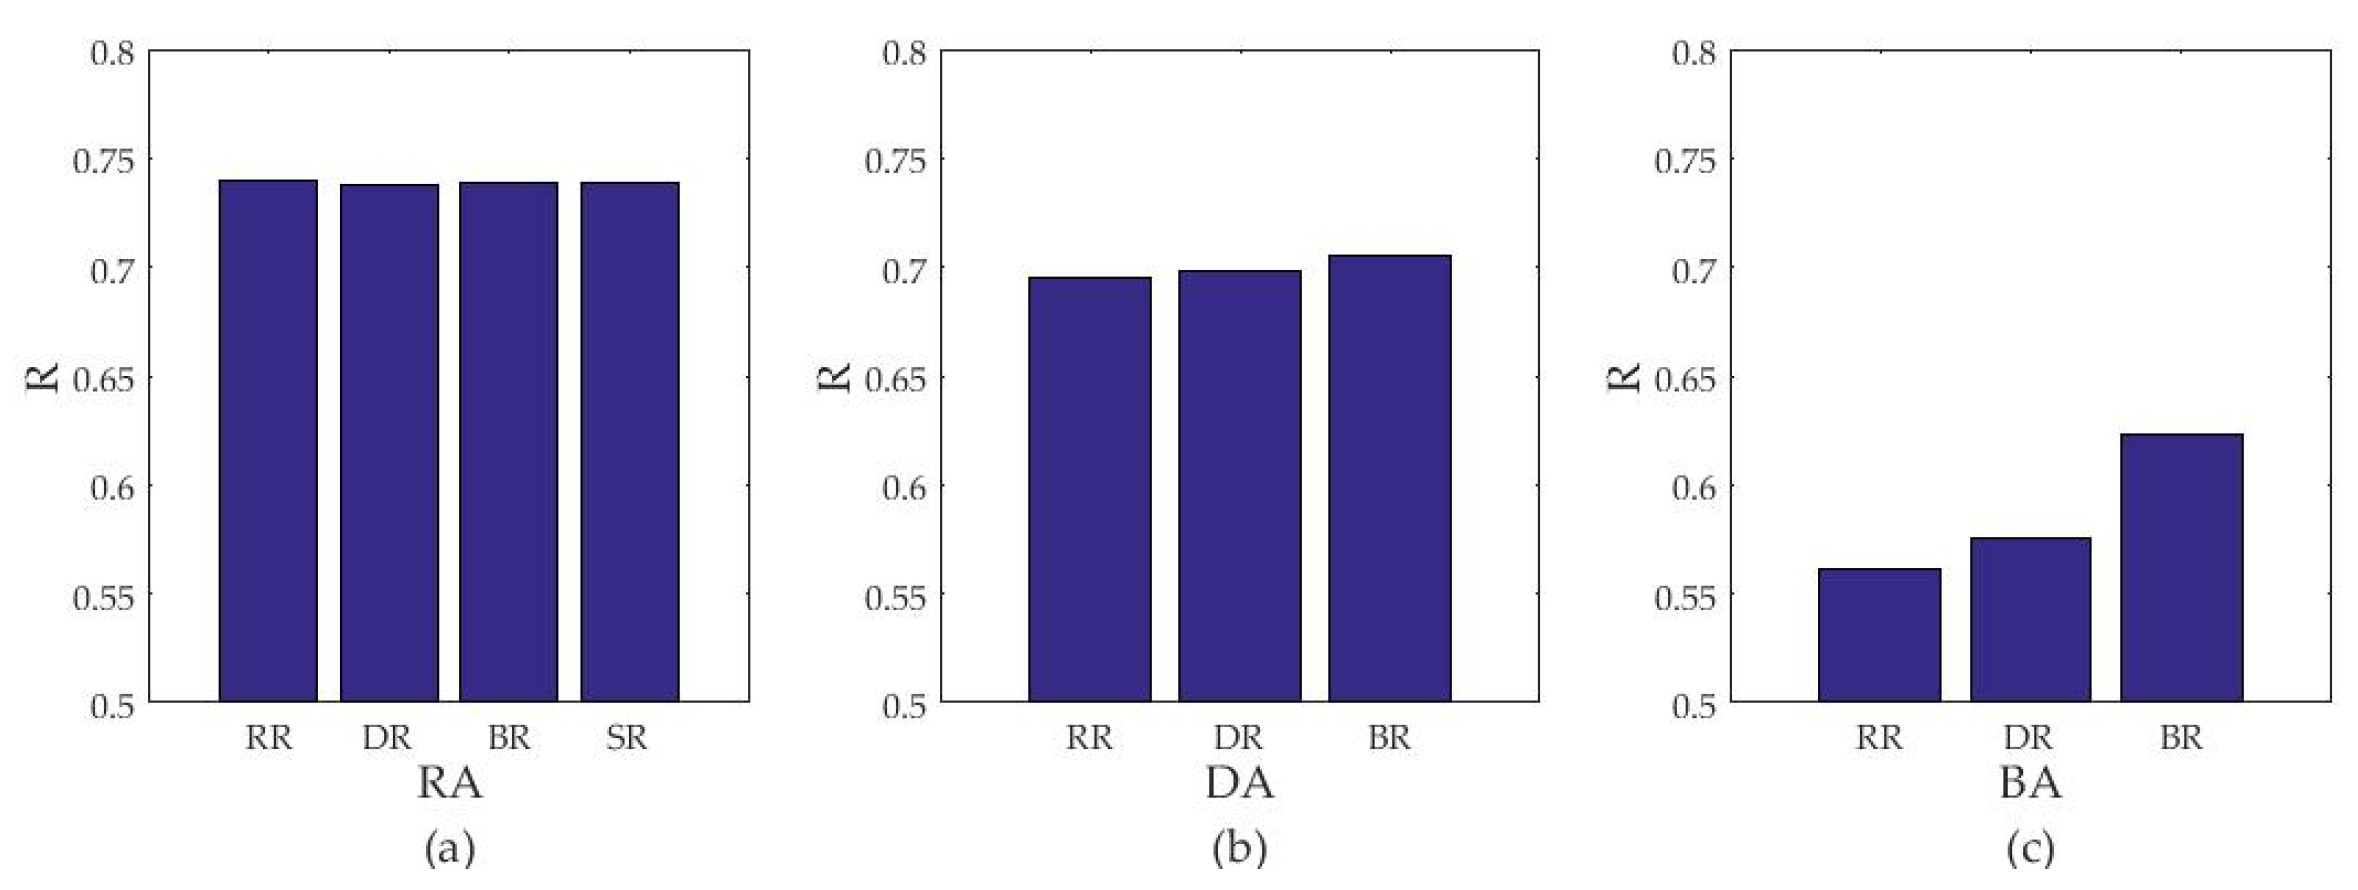
  • Firstly, random attack and deliberate attack are carried out on CASN, respectively to simulate the external disturbance suffered by the network. Among them, deliberate attack includes degree attack (DA) and betweenness attack (BA). Then, with the increase of time, the external disturbance gradually disappears, and different recovery strategies are adopted to improve the performance of the network. The recovery modes are random recovery (RR) and deliberate recovery, including degree recovery (DR) and betweenness recovery (BR). In addition, the sequence recovery (SR) mode is added for a random attack, that is, the node fails first and recovers first.
  • When external disturbance occurs, it is assumed that 5% of nodes fail at t d . Then, the 10% of nodes fails at the next period, until 50% of the nodes fail at t r ; When the disturbance disappears, the system performance starts to recover at t r . In the recovery phase, the number of recovered nodes at each period corresponds to the number of failed nodes in the disruptive phase until all failed nodes are restored. The changes in network efficiency and maximum connected subgraph relative value are studied under different attack and recovery strategies, and then the resilience values are calculated through the proposed index.

3. Data Acquisition and Description

The data used in this paper were all derived from the filed flight plan message (FPL), a telegraph sent by the air traffic service unit to the relevant air traffic service unit along the air route 45 min before the scheduled departure time of the aircraft according to the flight plan data submitted by the aircraft operator or its agent. The data were first preprocessed to make the track points into a track line, which was displayed on the software as flight trajectories. Then, we selected the FPL data on 1 May 2015, which contained flight path information for domestic and international flights. We imported the processed data into the ATC data mining software “TrkDig” so that the flight path can be restored in a 3D map. After that, we input the geographic coordinates of sectors across the country into the software and established a designated route between adjacent sectors. Through software simulation, the flight flow relationship between sectors was obtained, and then the network structure model of sectors was drawn (Figure 2), and the flight flow in sectors were counted accordingly.

4. Results and Discussion

4.1. Empirical Analysis of CASN

4.1.1. Statistical Analysis

Based on the flight data on 1 May 2015, and combined with the CASN structure chart, we selected the degrees of the top 10 sectors and presented the statistical results in Table 2. The sector with the largest degree value was Changsha 01, which was located at the geographical center of South-Central China. There were multiple air routes in the sector and there was a need for controllers to communicating with a larger number of sectors when transferring flights. Once the sector was congested, the controller needed to coordinate the number of flights and thus increased their workload. The sector with the largest strength value was Guangzhou 05, with more than 4000 daily flights and an average hourly traffic of 166. Due to its coverage of Guangzhou Baiyun Airport and Shenzhen Baoan Airport, the daily flight volume was large, and both the take-off and the landing needed to pass through the sector, making this sector the busiest one in China. The sector with the largest betweenness measurement was the Guiyang 04, which was the intersection of multiple air routes, with the ability to control the transmission of information along the shortest path between sector network nodes.

4.1.2. Network Characteristics Analysis

Through analysis and calculation of network characteristics, we found the CASN had a total of 155 nodes and 556 edges, where North China, East China, and Central South China had relatively close connections, while other areas were relatively sparsely connected. The length of the average shortest path of CASN was 4.45, which indicated that the flight can reach its destination sector through four sectors or the service of four controllers. The average degree of CASN was 7.16, that is, any sector had flight connections with seven adjacent sectors. The average clustering coefficient of CASN was 0.48, which indicated that the adjacent sector’s connection of any sector was dispersed. The controller contact between these sectors was sparse, and once the sector was crowded, it was not conducive to the coordinated management of flights. Therefore, the CASN had a larger average shortest path length and smaller clustering coefficient and did not reflect the properties of a small-world network.
Figure 4 showed the distribution of characteristic parameters, which can reflect the structural characteristics of the network accurately, including degree, betweenness, and strength.
The results showed that in the log-log coordinate system, the cumulative degree distribution of CASN followed a two-segmented power-law distribution. The degree distribution was uneven and featured a scale-free network, where the maximum degree value was 14 and the minimum degree value was 1. The sector with the degree value of 5 was the largest, accounting for 16%, and the degree value was relatively evenly distributed between 4 and 9, accounting for 70% of the total number of sectors. The cumulative distribution of the betweenness followed an exponential distribution, which was fitted to ( P ( B ) = 0.9619 e 49.54 B , R 2 = 0.9947 ). Most of the sectors with small betweenness were located at the edge of the network, which had little impact on the overall transportation efficiency of the network, but it was a hub connecting local transportation and played an important role in regional economic development and passenger travel. Such observation had also been confirmed by Verma et al. [61]. The cumulative distribution of strength showed an exponential distribution, fitted to ( P ( S ) = 1.151 e 0.002 S , R 2 = 0.9 ). The sectors with less than 100 flights accounted for 7%, and the sectors with a volume of 100–500 accounted for 55% of the total number of sectors. The excess average degree of CASN had a positive correlation in general, indicating a significant upward trend with the increase of degree, which reflected the CASN with more obvious homogeneity. The large degree nodes were more likely to link large degree ones, and the CASN was correlated with the degrees (Figure 4).
Degree distribution, betweenness distribution, and strength distribution can only reflect the topological characteristics of the network to a certain extent. Figure 5 showed the correlation analysis, which can well reflect the influence relationship between the parameters of the CASN and the connection preference of the node.
The correlation analysis showed that there was a positive correlation between node degree and betweenness. With the increase of the degree, the betweenness of nodes increased accordingly, and it was easier to become the center of the sector network and be preferred by the shortest path of the flight. However, there was a negative correlation between the degree and clustering coefficient. The sectors with a small degree were located at the edge of the network, and there were more connections between adjacent sectors, which was more convenient for controllers to communicate with each other. There were several air routes through the sectors with a large degree, but there were few connections between their adjacent sectors, which was not conducive to coordination and cooperation between controllers. The correlation between the degree and the strength was not significant, the sector with a large degree did not necessarily have large strength, and the sector strength was not directly related to the number of adjacent sectors. It can be found that there was no obvious correlation between strength and betweenness, strength and clustering coefficient, because the strength of the sector was mainly related to the number of air routes in the sector and regional economic situation, and had little to do with the topological structure of the network. On top of that, there was a negative correlation between the betweenness and clustering coefficient. Most of the sector betweenness was concentrated between 0 and 0.03. With an increment in betweenness, the clustering coefficient decreased, indicating that there was less flight flow between adjacent sectors of these sectors (Figure 5).

4.2. Vulnerability Analysis of CASN

According to the proposed parameters, the changes of the network vulnerability indicators were analyzed. Figure 6a showed the changes in network efficiency under different attack modes. In these attack modes, the network efficiency showed a linear decline. The drop rate of network efficiency based on random attack and strength attack was much smaller than the other two attack modes. Before the attack ratio reached 20%, degree-based and betweenness-based attack had roughly the same effect on network efficiency. When the attack rate reached 25%, the drop rate of network efficiency based on the betweenness attack was significantly faster than the degree-based attack, and the network was close to collapse.
Figure 6b showed the changes of the maximum connected subgraph relative value under different attack modes. It can be seen that before the attack ratio reached 20%, the change of four curves was approximately the same, and then the curve rapidly decreased based on the betweenness attack. When the attack ratio reached 50%, the network was completely destroyed.
The results showed that degree-based and betweenness-based attack had a significantly greater impact on network performance than random attack, and the CASN performance showed a linear decline, where random attack reduced the CASN efficiency to the lowest value of 0.21, degree attack was 0.08, and betweenness attack was 0.07. In addition, the random attack reduced the CASN maximum connected subgraph relative value to the lowest value of 0.49, degree attack was 0.25, and betweenness attack was 0.15 (Figure 6). Therefore, among these attack modes, the CASN showed better robustness against random attack and showed vulnerability to deliberate attack. Among them, the betweenness was the most important indicator affecting the vulnerability of the CASN, which can effectively identify the vulnerable nodes and was the fragile link in the CASN.

4.3. Resilience Measurement of CASN

Since the CASN is exposed to a complex and changeable environment, it is susceptible to external interference, which causes network connectivity to be compromised and decreases the system performance level. To effectively reduce the impact of disturbances and maintain the system operation ability, the performance of network will be restored by adopting appropriate recovery strategies until it reaches the original level. The resilience of CASN during the occurrence and dissipation of external disturbance was measured by the adopted RI metric.
Figure 7, Figure 8 and Figure 9 showed the changes in CASN efficiency under different attack and recovery strategies. At time t = 2, the network was disturbed by disruptive events, and the CASN performance started to decline, and reached the lowest value at time t = 12, where random attack reduced the sector network efficiency to the lowest value of 0.21, degree attack was 0.08, and betweenness attack was 0.07.
Figure 10, Figure 11 and Figure 12 showed the changes in CASN maximum connected subgraph relative value under different attack and recovery strategies, where random attack reduced the CASN performance to the lowest value of 0.49, degree attack was 0.25, and betweenness attack was 0.15.
At time t = 12, the network performance started to recover and returned to the original stable state at time t = 22. The CASN resilience index RI was calculated as shown in Figure 13 and Figure 14.
It can be seen that among the three attack modes, the CASN had the largest resilience under random attack with the least performance loss and can quickly recover to its original LOP. However, the betweenness attack mode had the greatest impact on network performance with the biggest performance loss, where the CASN showed poor resilience and was easy to paralyze due to external disturbance. In the recovery phase, among several recovery strategies under random attack, the resilience of the CASN under degree and betweenness recovery strategies was significantly greater than the random and sequence recovery. Among the recovery strategies based on degree and betweenness attack, the CASN under random recovery strategy had the least resilience, and it had to take a longer time to recover to the initial performance level when it was exposed to external disturbance. The resilience of the CASN was maximized under the betweenness recovery strategy, which can quickly restore the sector network from the failure state to the normal stable state. Therefore, betweenness had the greatest impact on the vulnerability and resilience of CASN. When the operational capacity of the sector was decreased due to external interference, the adoption of the betweenness recovery strategy played an important role in improving the overall operational efficiency of CASN, reducing flight delay, and ensuring flight safety (Figure 7, Figure 8, Figure 9, Figure 10, Figure 11, Figure 12, Figure 13 and Figure 14).
Therefore, the air traffic control operation unit should do a good job of providing risk management and control of sectors with large betweenness, and ensuring that the control equipment such as communication, navigation, and surveillance are highly automated. In this way, the risks facing by the system can be identified effectively and the warning can be given in advance, and the optimal disposal plan can be automatically generated according to the risk intensity, so as to reduce the economic losses caused by unexpected events and take effective measures to quickly restore the normal operation of the system. At present, the airspace of Mainland China is dominated by the military, which greatly restricts the use of the airspace for civil aviation, resulting in high traffic flows of busy air routes and severe airspace congestion. Once it is disturbed by unexpected events, the flight routes within the sector may be interrupted and the sector may even be closed, which will have a significant impact on the operation of the sector network. Therefore, for policymakers, it is also important that multiple parallel air routes be provided for busy routes and to make a reasonable planning of routes within the sector, so as to reduce flight delays caused by congested routes and ensure flight safety.

4.4. Comparative Analysis between CASN’s Vulnerability and Resilience

Vulnerability and resilience are a group of related concepts, both of which are considered to be intrinsic properties of the system and are susceptible to the influence of external disturbances. At present, there is no consensus on the relationship between them, and researchers in different fields have different views on it [62]. Figure 15 showed the different views of the researchers on the relationship between vulnerability and resilience. Turner believed that resilience is part of vulnerability [63]. Manyena believed that resilience and vulnerability are a set of opposite concepts [64]. Cutter et al. proposed that both of them are related and different in their research on the resilience and vulnerability of American states [65].
In this study, the vulnerability of the CASN reflects the degree to which the network is affected by destructive events. The greater the vulnerability, the more vulnerable it is to the impact of the disturbance. While the resilience reflects the ability of CASN to resist disasters. The greater the resilience of the CASN, the stronger its ability to deal with disturbance. In order to more intuitively compare the relationship between vulnerability and resilience, we took sector network efficiency as an example and calculated the vulnerability value under different attack modes and the average resilience value under different recovery strategies, where the value of vulnerability was the performance loss of the system. The specific results are shown in Table 3.
The results showed that the CASN was less vulnerable under random attack, while it is much more vulnerable under degree and betweenness attack (Figure 6). In the performance recovery phase, among several recovery strategies based on random attack, the average resilience of CASN was significantly higher than that of recovery strategies under degree and betweenness attack (Figure 13 and Figure 14).
Therefore, we would argue that the relationship between vulnerability and resilience of CASN was not subordinate, but showed a negative correlation tendency. The higher the vulnerability of the network, the smaller the resilience. Also, the lower the vulnerability of the network, the greater the resilience. An ATC sector network system with greater vulnerability and less resilience is more susceptible to disasters, and such a system with less vulnerability and greater resilience is more competent in handling disturbances. Both of these factors affect the performance of the ATC sector network system in different ways.

5. Conclusions

In this paper, we constructed a network model of the ATC sector system in mainland China by taking 183 sectors as a case study, according to the flight data on 1 May 2015, where the sector was considered as the nodes and the flight relationship between the sectors as the edges. The results showed that the CASN had a lengthy average shortest path and a small clustering coefficient, which demonstrated a hybrid topological feature. We also found that betweenness has the greatest impact on the resilience and has managerial implications for understanding the relationship between vulnerability and resilience in CASN. Their comparison results showed a negative correlation tendency in our study, which indicates that a sustainable CASN can show a low vulnerability in the face of destructive events, minimize the impact of damage, and maintain the basic performance of the system; at the same time, it can demonstrate a high resilience with the capacity to absorb disturbances and adapt to unexpected events.
This paper provides an alternative perspective to investigate the air traffic systems in China and sheds new light on the comparative studies between CASN’s vulnerability and resilience, which potentially enriches the toolkit for decision-makers and stakeholders to better understand its complexity and improve air traffic management. However, this study also has some limitations. Firstly, in this paper, the research on the vulnerability and resilience of CASN is mainly based on the network topology, without considering the flow in the network. Considering the operation condition of the system, focusing on the topology only could be too simplistic to some extent. Secondly, due to the data availability issue, we can only use one day’s track data in this study, which might contain some potential limitations or bias in terms of the regulated patterns in CASN network construction. Thus, for future studies, a combination of topology and information flow on the edges should be considered as a more feasible approach to overcome this limitation and we will also collect more data to address the aforementioned data limitation. Furthermore, we will consider issues such as traffic distribution and flow control, and then analyze the spatial and temporal distribution of carbon emissions in sector networks to assess the environmental resilience of the aviation systems in China.

Author Contributions

X.W., S.M. and J.T. All drafted the manuscript; X.W. and J.T. contributed to theories and revised the manuscript. X.W. and S.M. contributed to resource, validation, and funding acquisition. All authors have read and agreed to the published version of the manuscript.

Funding

This research was funded by The National Key Research and Development Program of China (NO. 2016YFB0502405) and The Fundamental Research Funds for the Central Universities (NO. 3122019191).

Conflicts of Interest

The authors declare no conflict of interest.

References

  1. Ren, G.; Lu, C.; Zhu, J.; Liu, X. Analyzing the topological characteristic and key nodes of Chinese air sector network. Int. J. Mod. Phys. B 2019, 33, 112–121. [Google Scholar] [CrossRef]
  2. Janssen, M.A.; Schoon, M.L.; Ke, W. Scholarly networks on resilience, vulnerability and adaptation within the human dimensions of global environmental change. Glob. Environ. Chang. 2006, 16, 240–252. [Google Scholar] [CrossRef] [Green Version]
  3. Xu, Y. Study of Robustness in Cmplex Interconnected System and Networks; Publishing House of Electronics Industry: Beijing, China, 2015; pp. 30–45. [Google Scholar]
  4. Ouyang, M.; Zhao, L.; Pan, Z.; Hong, L. Comparisons of complex network based models and direct current power flow model to analyze power grid vulnerability under intentional attacks. Physica A 2014, 403, 45–53. [Google Scholar] [CrossRef]
  5. Wang, K. Research on Structural Complexity and Vulnerability of Power Grids Based on Complex Network Theory. Ph.D. Thesis, Huazhong University of Science and Technology, Wuhan, China, 2011. [Google Scholar]
  6. Wang, Z.; Chen, G.; Hill, D.J.; Dong, Z. A power flow based model for the analysis of vulnerability in power networks. Physica A 2016, 460, 105–115. [Google Scholar] [CrossRef]
  7. Sun, D.; Guan, S. Measuring vulnerability of urban metro network from line operation perspective. Transp. Res. Part A Policy Pract. 2016, 94, 348–359. [Google Scholar] [CrossRef]
  8. Kim, S.; Yeo, H. A Flow-based Vulnerability Measure for the Resilience of Urban Road Network. Proced. Soc. Behav. Sci. 2016, 218, 13–23. [Google Scholar] [CrossRef] [Green Version]
  9. Viljoen, N.M.; Joubert, J.W. The vulnerability of the global container shipping network to targeted link disruption. Physica A 2016, 462, 396–409. [Google Scholar] [CrossRef] [Green Version]
  10. Wilkinson, S.M.; Dunn, S.; Ma, S. The vulnerability of the European air traffic network to spatial hazards. Nat. Hazards 2012, 60, 1027–1036. [Google Scholar] [CrossRef] [Green Version]
  11. Nimmegeers, P.; Telen, D.; Beetens, M.; Logist, F.; Impe, J.V. Robust multi-objective optimal control of dynamic biological networks. Comput. Aided Chem. Eng. 2016, 38, 433–438. [Google Scholar]
  12. Çolak, S.; Lima, A.; González, M.C. Understanding congested travel in urban areas. Nat. Commun. 2016, 7, 10793. [Google Scholar] [CrossRef]
  13. Helbing, D. Globally networked risks and how to respond. Nature 2013, 497, 51–59. [Google Scholar] [CrossRef] [PubMed]
  14. Sang, K.S.; Zhou, B.; Yang, P.; Yang, Z. A Survey on Urban Traffic Optimisation for Sustainable and Resilient Transportation Network. In Proceedings of the International Conference on Developments in Esystems Engineering IEEE, Liverpool, UK, 31 August–2 September 2016. [Google Scholar]
  15. Hosseini, S.; Barker, K.; Ramirez-Marquez, J.E. A Review of Definitions and Measures of System Resilience. Reliab. Eng. Syst. Saf. 2015, 145, 47–61. [Google Scholar] [CrossRef]
  16. Dinh, L.T.T.; Pasman, H.; Gao, X.; Mannan, M.S. Resilience engineering of industrial processes: Principles and contributing factors. J. Loss Prevent. Proc. 2012, 25, 233–241. [Google Scholar] [CrossRef]
  17. Adger, W.N. Social and ecological resilience: Are they related? Prog. Hum. Geog. 2000, 24, 347–364. [Google Scholar] [CrossRef]
  18. Rose, A.; Liao, S.Y. Modeling Regional Economic Resilience to Disasters: A Computable General Equilibrium Analysis of Water Service Disruptions. Soc. Sci. Electron. Publ. 2005, 45, 75–122. [Google Scholar] [CrossRef]
  19. Park, J.; Seager, T.P.; Rao, P.S.C. Lessons in risk- versus resilience-based design and management. Integr. Environ. Assess. Manag. 2011, 7, 396–399. [Google Scholar] [CrossRef]
  20. Holling, S.C. Resilience and Stability of Ecological Systems. Annu. Rev. Ecol. Syst. 1973, 4, 1–23. [Google Scholar] [CrossRef] [Green Version]
  21. Nan, C.; Sansavini, G. A quantitative method for assessing resilience of interdependent infrastructures. Reliab. Eng. Syst. Saf. 2017, 157, 35–53. [Google Scholar] [CrossRef]
  22. Aven, T. On Some Recent Definitions and Analysis Frameworks for Risk, Vulnerability, and Resilience. Risk Anal. 2011, 31, 515–522. [Google Scholar] [CrossRef]
  23. Ayyub, B.M. Systems Resilience for Multihazard Environments: Definition, Metrics, and Valuation for Decision Making. Risk Anal. 2013, 34, 340–355. [Google Scholar] [CrossRef]
  24. Haimes, Y.Y. On the Definition of Resilience in Systems. Risk Anal. 2009, 29, 498–501. [Google Scholar] [CrossRef] [PubMed]
  25. Hu, Y.; Gu, J. SNOP robust optimization for distribution network resilience enhancement. Electr. Power Auto Equip. 2019, 39, 85–91. [Google Scholar]
  26. Almoghathawi, Y.; Barker, K.; Albert, L.A. Resilience-driven restoration model for interdependent infrastructure networks. Reliab. Eng. Syst. Saf. 2019, 185, 12–23. [Google Scholar] [CrossRef]
  27. Lawson, E.; Farmani, R.; Woodley, E.; Butler, D. A Resilient and Sustainable Water Sector: Barriers to the Operationalisation of Resilience. Sustainability 2020, 12, 1797. [Google Scholar] [CrossRef] [Green Version]
  28. Cui, Q.; Li, J.; Ran, H.; Nan, M. Resilience measurement of command information system super-network based on mission capability. J. Command Control 2017, 3, 137–143. [Google Scholar]
  29. Cui, Q.; Li, J.; Wang, H.; Nan, M. Resilience analysis model od networked command information system based on node repairability. Comput. Sci. 2018, 45, 117–121. [Google Scholar]
  30. Ip, W.H.; Wang, D. Resilience and Friability of Transportation Networks: Evaluation, Analysis and Optimization. IEEE Syst. J. 2011, 5, 189–198. [Google Scholar] [CrossRef]
  31. Nogal, M.; O’Connor, A.; Caulfield, B.; Martinez-Pastor, B. Resilience of traffic networks: From perturbation to recovery via a dynamic restricted equilibrium model. Reliab. Eng. Syst. Saf. 2016, 156, 84–96. [Google Scholar] [CrossRef]
  32. Wang, Y.; Zhan, J.; Xu, X.; Li, L.; Chen, P.; Hansen, M. Measuring the resilience of an airport network. Chin. J. Aeronaut. 2019, 32, 2694–2705. [Google Scholar] [CrossRef]
  33. Gomes, J.O.; Woods, D.D.; Carvalho, P.V.R.; Huber, G.J.; Borges, M.R.S. Resilience and brittleness in the offshore helicopter transportation system: The identification of constraints and sacrifice decisions in pilots’ work. Reliab. Eng. Syst. Saf. 2009, 94, 311–319. [Google Scholar] [CrossRef]
  34. Ganin, A.A.; Kitsak, M.; Marchese, D.; Keisler, J.M.; Seager, T.; Linkov, I. Resilience and efficiency in transportation networks. Sci. Adv. 2017, 3, e1701079. [Google Scholar] [CrossRef] [PubMed] [Green Version]
  35. Tang, J.; Heinimann, H. A resilience-oriented approach for quantitatively assessing recurrent spatial-temporal congestion on urban roads. PLoS ONE 2018, 13, e0190616. [Google Scholar] [CrossRef] [PubMed] [Green Version]
  36. Lordan, O.; Sallan, J.M. Core and critical cities of global region airport networks. Physica A 2019, 513, 724–733. [Google Scholar] [CrossRef]
  37. Sergio, P.; Paolo, C.; Vito, L. The Network Analysis of Urban Streets: A Dual Approach. Physica A 2006, 369, 853–866. [Google Scholar]
  38. Paolo, C.; Vito, L.; Sergio, P. Centrality measures in spatial networks of urban streets. Phys. Rev. E 2006, 73, 036125. [Google Scholar]
  39. Seaton, K.A.; Hackett, L.M. Stations, trains and small-world networks. Physica A 2004, 339, 635–644. [Google Scholar] [CrossRef] [Green Version]
  40. Vito, L.; Massimo, M. Is the Boston subway a small-world network? Physica A 2002, 314, 109–113. [Google Scholar]
  41. Burghouwt, G.; Hakfoort, J.; Eck, J.R.V. The spatial configuration of airline networks in Europe. J. Air Transp. Manag. 2003, 9, 309–323. [Google Scholar] [CrossRef]
  42. Gastner, M.T.; Newman, M.E.J. The spatial structure of networks. Eur. Phys. J. B 2006, 49, 247–252. [Google Scholar] [CrossRef] [Green Version]
  43. Guimerá, R.; Amaral, L.A.N. Modeling the world-wide airport network. Eur. Phys. J. B 2004, 38, 381–385. [Google Scholar] [CrossRef]
  44. Bagler, G. Analysis of the airport network of India as a complex weighted network. Physica A 2008, 387, 2972–2980. [Google Scholar] [CrossRef] [Green Version]
  45. Chi, L.P.; Wang, R.; Su, H. Structural Properties of US Flight Network. Chin. Phys. Lett. 2003, 20, 1393–1396. [Google Scholar]
  46. Barrat, A.; Barthelemy, M.; Vespignani, A. The architecture of complex weighted networks. Proc. Natl. Acad. Sci. USA 2004, 101, 3747–3752. [Google Scholar] [CrossRef] [PubMed] [Green Version]
  47. Barrat, A.; Barthélemy, M.; Vespignani, A. The effects of spatial constraints on the evolution of weighted complex networks. J. Stat. Mech. Theory E 2005, 2005, P05003. [Google Scholar] [CrossRef]
  48. Cai, K.; Zhang, J.; Du, W.; Cao, X. Analysis of the Chinese air route network as a complex network. Chin. Phys. B 2012, 21, 596–602. [Google Scholar] [CrossRef]
  49. Zeng, X. Empirical Study of Chinese Airline Network Structure Based on Complex Network Theory. Ph.D. Thesis, Nanjing University of Aeronautics and Astronautics, Nanjing, China, 2011. [Google Scholar]
  50. Li, S.; Xu, X. Vulnerability analysis for airport networks based on fuzzy soft sets: From the structural and functional perspective. Chin. J. Aeronaut. 2015, 28, 780–788. [Google Scholar] [CrossRef] [Green Version]
  51. Li, B.; Du, W.; Liu, C.; Cai, K. Topologic and Dynamic Resilience Model of Chinese Airport Network. In Proceedings of the 11th IEEE International Conference on Control & Automation IEEE, Taichung, Taiwan, 18–20 June 2014; pp. 1460–1465. [Google Scholar]
  52. Tang, J. Assessment of Resilience in Complex Urban Systems. Industry, Innovation and Infrastructure. In Encyclopedia of the UN Sustainable Development Goals; Leal Filho, W., Azul, A.M., Brandli, L., Özuyar, P.G., Wall, T., Eds.; Springer: Cham, Switzerland, 2019; pp. 1–10. [Google Scholar]
  53. Bloem, M.; Gupta, P.; Kopardekar, P. Algorithms for Combining Airspace Sectors. Air Traffic Control Q. 2009, 17, 245–268. [Google Scholar] [CrossRef] [Green Version]
  54. Wang, C.; Chen, Y. Large-scale airspace sector partitioning based on binary space partitions and dynamic programming. Appl. Res. Comput. 2015, 32, 3259–3263. [Google Scholar]
  55. Wang, X.; Li, X.; Cheng, G. Network Science An Introduction; Higher Education Press: Beijing, China, 2012. [Google Scholar]
  56. Albert, R.; Barabási, A.L. Statistical mechanics of complex networks. Rev. Mod. Phys. 2002, 74, 47–97. [Google Scholar] [CrossRef] [Green Version]
  57. Zanin, M.; Lillo, F. Modelling the air transport with complex networks: A short review. Eur. Phys. J. Spec. Top. 2013, 215, 5–21. [Google Scholar] [CrossRef] [Green Version]
  58. Wang, W.; Liu, J.; Jiang, X.; Wang, Y. Topology properties on Chinese Railway network. J. Beijing Jiaotong Univ. 2010, 34, 148–152. [Google Scholar]
  59. Chen, X.; Sun, K.; Cao, Y. Structural vulnerability analysis of large power grid based on complex network theory. Transact. China Elect. Soc. 2007, 22, 138–144. [Google Scholar]
  60. Ouyang, M.; Dueñas-Osorio, L. Time-dependent resilience assessment and improvement of urban infrastructure systems. Chaos Interdiscip. J. Nonlinear Sci. 2012, 22, 033122. [Google Scholar] [CrossRef] [Green Version]
  61. Verma, T.; Araújo, N.A.M.; Herrmann, H.J. Revealing the structure of the world airline network. Sci. Rep. 2014, 4, 5638. [Google Scholar] [CrossRef] [PubMed] [Green Version]
  62. Lei, Y.; Wang, J.A.; Yue, Y.; Zhou, H.; Yin, W. Rethinking the relationships of vulnerability, resilience, and adaptation from a disaster risk perspective. Nat. Hazards 2014, 70, 609–627. [Google Scholar] [CrossRef]
  63. Turner Li, B.L. Vulnerability and resilience: Coalescing or paralleling approaches for sustainability science? Glob. Environ. Chang. 2010, 20, 570–576. [Google Scholar] [CrossRef]
  64. Manyena, S.B. The Concept of Resilience Revisited. Disasters 2006, 30, 434–450. [Google Scholar] [CrossRef]
  65. Cutter, S.L. Resilience to What? Resilience for Whom? Geogr. J. 2016, 182, 110–113. [Google Scholar] [CrossRef]
  66. Li, Y.; Zhai, G. Study on the Correlation of Urban Disaster Resilience and its Related Factors. In Proceedings of the Annual National Planning Conference 2018, Hangzhou, China, 24–26 November 2018; pp. 408–415. [Google Scholar]
Figure 1. Sector structure of Mainland China.
Sustainability 12 03749 g001
Figure 2. Sector complex network model of Mainland China.
Sustainability 12 03749 g002
Figure 3. System resilience profile (adapted from [60]).
Sustainability 12 03749 g003
Figure 4. Distribution of characteristic parameters: (a) Cumulative distribution of degree; (b) Cumulative distribution of betweenness; (c) Cumulative distribution of strength; (d) The node degree correlation.
Sustainability 12 03749 g004
Figure 5. Correlation analysis: (a) Degree-betweenness correlation; (b) Degree-clustering coefficient correlation; (c) Degree-strength correlation; (d) Strength-betweenness correlation; (e) Strength-clustering coefficient correlation; (f) Betweenness-clustering coefficient correlation.
Sustainability 12 03749 g005
Figure 6. Changes of the network vulnerability indicators: (a) Changes of the network efficiency; (b) Changes of the maximum connected subgraph relative value.
Sustainability 12 03749 g006
Figure 7. Changes of CASN efficiency under random attack and different recovery strategies: (a) Random recovery; (b) Degree recovery; (c) Betweenness recovery; (d) Sequence recovery.
Sustainability 12 03749 g007
Figure 8. Changes of CASN efficiency under degree attack and different recovery strategies: (a) Random recovery; (b) Degree recovery; (c) Betweenness recovery.
Sustainability 12 03749 g008
Figure 9. Changes of CASN efficiency under betweenness attack and different recovery strategies: (a) Random recovery; (b) Degree recovery; (c) Betweenness recovery.
Sustainability 12 03749 g009
Figure 10. Changes of CASN maximum connected subgraph relative value under random attack and different recovery strategies: (a) Random recovery; (b) Degree recovery; (c) Betweenness recovery; (d) Sequence recovery.
Sustainability 12 03749 g010
Figure 11. Changes of CASN maximum connected subgraph relative value under degree attack and different recovery strategies: (a) Random recovery; (b) Degree recovery; (c) Betweenness recovery.
Sustainability 12 03749 g011
Figure 12. Changes of CASN maximum connected subgraph relative value under betweenness attack and different recovery strategies: (a) Random recovery; (b) Degree recovery; (c) Betweenness recovery.
Sustainability 12 03749 g012
Figure 13. Changes of CASN resilience based on Figure 7, Figure 8 and Figure 9: (a) Random attack; (b) Degree attack; (c) Betweenness attack.
Sustainability 12 03749 g013
Figure 14. Changes of CASN resilience based on Figure 10, Figure 11 and Figure 12: (a) Random attack; (b) Degree attack; (c) Betweenness attack.
Sustainability 12 03749 g014
Figure 15. The relationship of vulnerability and resilience (adapted from [66]).
Sustainability 12 03749 g015
Table 1. The network centrality of China’s air sector network (CASN).
ParametersFormulaAnnotation
Degree [55] K i = j = 1 N e i j For the ATC sector network with N nodes, the degree K i of node i represents the number of sectors which have flight flow relationships with node i .
Cumulative degree distribution [55] P ( K ) = k = k P k This indicates the proportion of nodes whose degrees are not less than K , where the P k is the degree distribution.
Strength [46] S i = j V ( i ) ω i j Where S i is the flight flow of sector i , the V ( i ) is the neighbor sector set of sector i , and ω i j represents the number of flights between sector i and sector j .
Local clustering coefficient [56] C i = 2 E i K i ( K i 1 ) Where E i is the number of edges in the network formed by the set of adjacent sectors of sector i , and K i ( K i 1 ) 2 is the maximum number of possible edges in this network.
Average shortest path length [57] L = 2 N ( N 1 ) i > j d i j Where the total number of sectors is N and d i j is the shortest path length between sector i and sector j .
Betweenness [58] B i = j k n j k ( i ) n j k Where n j k is the total number of shortest paths from sector j to sector k , and n j k ( i ) is the number of shortest paths through sector i from sector j to sector k .
Excess average degree [55] K n n i = 1 k i j = 1 k i k i j
K n n ( K ) = 1 i k i = 1 i k K n n i
Where the k i j is the degree of neighbor nodes of node i , and the K n n i is the excess average degree of node i and the K n n ( K ) is the excess average degree of nodes with degree K .
Table 2. Data processing results.
Top-kSectorsKSCB
1Changsha 01141580.49450.0245
2Guangzhou 20138870.35900.0377
3Guangzhou 141315050.56410.0125
4Beijing 071310740.34620.0578
5Guangzhou 19136440.42310.0497
6Guiyang 04135770.30770.1662
7Changsha 02135210.53850.0187
8Guangzhou 12128380.33330.0707
9Shanghai 201210680.42420.0378
10Guangzhou 17126300.48480.0260
Table 3. Comparative results of vulnerability and resilience.
Attack ModesVulnerabilityResilience
Random attack0.790.55
Degree attack0.920.46
Betweenness attack0.930.43

