Article

Analysis of the Effects of Strengthening Building Energy Policy on Multifamily Residential Buildings in South Korea

Center for Housing Environment Research and Innovation of the Korea Land and Housing Institute, Sejong 30065, Korea
*
Author to whom correspondence should be addressed.
Sustainability 2020, 12(9), 3566; https://doi.org/10.3390/su12093566
Submission received: 27 March 2020 / Revised: 23 April 2020 / Accepted: 24 April 2020 / Published: 27 April 2020

Abstract

:
The purposes of this study were to overview the building-energy policy and regulations in South Korea to achieve energy-efficient multifamily residential buildings and analyze the effects of strengthening the building design requirements on their energy performances. The building energy demand intensity showed a linear relationship with the area-weighted average U-values of the building envelope. However, improving the thermal properties of the building envelope was limited to reducing the building-energy demand intensity. In this study, the effects of various energy conservation measures (ECMs) on the building-energy performance were compared. Among the various ECMs, improving the boiler efficiency was found to be the most efficient measure for reducing the building-energy consumption in comparison to other ECMs, whereas the building envelope showed the least impact, because the current U-values are low. However, in terms of the primary energy consumption, the most efficient ECM was the lighting power density because of the different energy sources used by various ECMs and the different conversion factors used to calculate the primary energy consumption based on the source type. This study showed a direction for updating the building-energy policy and regulations, as well as the potential of implementing ECMs, to improve the energy performances of Korean multifamily residential buildings.

1. Introduction

To follow the target of the Paris Agreement, the South Korean government released a plan in July 2018 with a target of a 37% reduction in emissions from the business-as-usual (BAU) levels by 2030, including an emissions reduction of 65 million tons, which is a 32.7% reduction from the BAU applied in the building sector by strengthening the energy standards for new buildings and the promotion of a green remodeling for existing buildings [1]. Indeed, the Korean government has made numerous efforts to accomplish highly energy-efficient multifamily residential buildings by improving the mandatory energy standards, such as the Building Act (BA) and the Building Design Criteria for Energy Saving (BDCES), and voluntary building energy rating systems, such as the Green Standard for Energy and Environmental Design (G-SEED) operated by the Korean Government and the Korea Building Energy Efficiency Certification (BEEC), which are grounded in relevant building energy codes and/or regulations [2,3,4]. Building energy policies and rating systems have been implemented in highly efficient building systems for multifamily residential buildings in South Korea.
According to the 2017 Population and Housing Census, the number of residential units of multifamily residential buildings in South Korea was 10,380,000 units, accounting for 60.6% of the total 17,120,000 housing units [5]. In particular, the census data also show that 3,890,000 residential units were 20 years and older (37.5%), and 640,000 units were 30 years and older (6.2%) as of 2017. In addition, a report from the Korea Energy Economics Institute shows that, in 2017, the energy consumption of the building sector was 19% of the total national energy consumption [6]. These statistical data imply that it is important to reduce the energy consumption and emissions of both existing and new residential units.
Some studies have considered the importance of building-energy-related policies to develop energy-efficient buildings in South Korea [7,8,9,10]. For example, Baek et al. examined the potential to reduce greenhouse gas emissions from existing residential buildings and studied several barriers to be considered to improve the energy performance of existing residential buildings [7]. According to Baek et al.’s results, the major barriers for residential buildings are (1) a lack of awareness, (2) financial burden, (3) insufficient information, and (4) absence of regulatory systems. These findings show the importance of detailed regulatory systems in establishing energy-efficient residential buildings in South Korea. Tae et al. also reviewed several efforts made in South Korea for environmentally friendly building construction [8]. The trends mentioned in their study have shown the policy efforts of the Korean government from various perspectives for reducing greenhouse gases in the building sector. Evans et al. introduced South Korea’s efforts to improve building-energy efficiency through relevant building energy standards and several voluntary programs, such as the Energy Efficiency Labeling Program for Buildings, Green Building Certification Program, and Financial Incentives [9]. Evans et al. also concluded that Korea has preferred a simple structure for building standards, allowing energy-efficient buildings to be more easily implemented, including the BDCES. Chandel et al. overviewed the building regulations enacted worldwide, focusing on energy savings as a part of their research on policy measures for energy renovation of existing buildings [10]. They studied the impacts of regulations on residential building energy consumption based on the energy consumption rates in kilotons of oil equivalent (ktoe, 1 ktoe = 11,630,000 kWh) in different countries. The authors found that the energy consumption rate in South Korea has decreased since 2008, and that it is important to enact strict national codes/regulations for improving the energy efficiency in buildings.
Some studies have been conducted on various building-energy conservation measures for energy-efficient residential buildings around the world [11,12,13,14,15,16,17,18]. Kwag et al. conducted a series of building-energy simulations using various energy conservation measures for the Nigerian climate, and found that energy-efficient lighting fixtures and highly efficient air-conditioning systems are cost- and energy-efficient measures for designing high-energy performance residential buildings [11]. Heravi et al. studied several energy conservation measures (ECMs) for highly energy-efficient residential buildings in Iran [12]. Heravi et al. mentioned that thermal roof isolation, material thermal specifications, story height, and window glazing were the most effective measures to be considered in designing buildings. In another study, Ihm et al. evaluated the effects of energy conservation measures on the energy performance of residential buildings in Tunisia and identified the optimized combinations of energy conservation measures for various climate conditions in the country [13]. As a result of this research, adding roof insulation, reducing air infiltration, and applying energy-efficient lighting fixtures and space heating and cooling equipment were selected as energy conservation measures to design high-energy saving homes throughout climatic zones in Tunisia. In addition, Sadineni et al. conducted a series of simulations to analyze the economic feasibility of energy conservation measures in residential buildings in Las Vegas, U.S. [14]. In Sadineni et al.’s study, a typical house with cost-effective methods, which were upgraded from the 2006 International Energy Conservation Code (IECC) standards, consumed less energy compared to a home built on the IECC.
Some studies have been conducted on building energy savings in South Korea. Ihm et al. researched the impact of window selection on the energy performance of residential buildings in South Korea [15]. Because windows have a significant contribution to building-energy consumption of residential buildings for space cooling and heating, as well as for lighting, the window is one of the important energy conservation measures for energy-efficient residential buildings [15,16]. In Ihm et al.’s research, they showed that the selection of low solar heat gain coefficient glazing is highly beneficial for buildings with large windows and located in mild climates, and demonstrated the potential of double-pane low-e glazing for a better energy performance of windows than clear double-pane glazing, which was required by the Korean building energy code. Han et al. studied the energy-saving potential of various building envelope materials for existing multifamily residential buildings in South Korea [17]. In Han et al.’s research, the authors studied the effects of building envelope properties on building-energy performances and found that the effects of building-energy conservation measures on building-energy consumption differ under different climate conditions. Park et al. studied Korean building-energy efficiency policies and analyzed the effects of building-energy certification on the energy performances of residential and nonresidential buildings [18]. They analyzed the actual energy consumption data of certified buildings of 86,138 households in 89 multifamily residential building complexes. From Park et al.’s research, it was found that the heating energy consumption decreased as the energy saving ratios increased because of BEEC even though the decreasing trends were not clear.
However, although some researchers have shown the possibility of implementing energy conservation measures to achieve energy-efficient residential buildings in South Korea, their research was based on specific energy conservation measures or relied on the actual specific building-energy consumption data. For example, among various ECMs, Ihm et al. only focused on the effects of selecting the glazing types of window systems on the building-energy performance, although they did present the limitations of the Korean building-energy code. In addition, Han et al. analyzed the impacts of improving the building-envelope requirements on the energy performance of multifamily residential buildings in South Korea through building-energy simulations. However, in Han et al.’s research, the building floor plan types applied were 59 m2 and 84 m2 in size. Moreover, Han et al. only analyzed the effects of improving the building-envelope requirements on the building-energy performances without clearly addressing the relations between the energy consumption data and the thermal properties of the building envelope. In Park et al.’s study, although the influences of the Korean building-energy policy were addressed for both residential and nonresidential buildings and the energy performance of certified buildings was analyzed, for residential buildings, their study focused only on the relationships between the actual energy consumption and the energy-saving rations of certified multifamily residential building complexes without a detailed analysis of the causes for the results. In addition, the actual energy data (i.e., annual gas and electricity consumption) was not clear, because it did not address the detailed energy consumption by end users. Therefore, a more detailed analysis of the influences of improving various ECMs needs to be performed.
Sadineni et al. reported that building energy codes, regulations, or standards do not guarantee highly energy-efficient residential buildings but provide the threshold required for such buildings [14]. This indicates that it is important to study and upgrade building-energy policies. Therefore, there is a need to investigate the effects of changes in the criteria of the building energy standards on the energy performance of multifamily residential buildings in South Korea as well as to study the contributions of these effects on the reduction of greenhouse gas emissions from multifamily residential buildings. For these reasons, this study was designed to investigate the effects of strengthening the building-energy standards on the energy consumption of a multifamily residential building in South Korea.

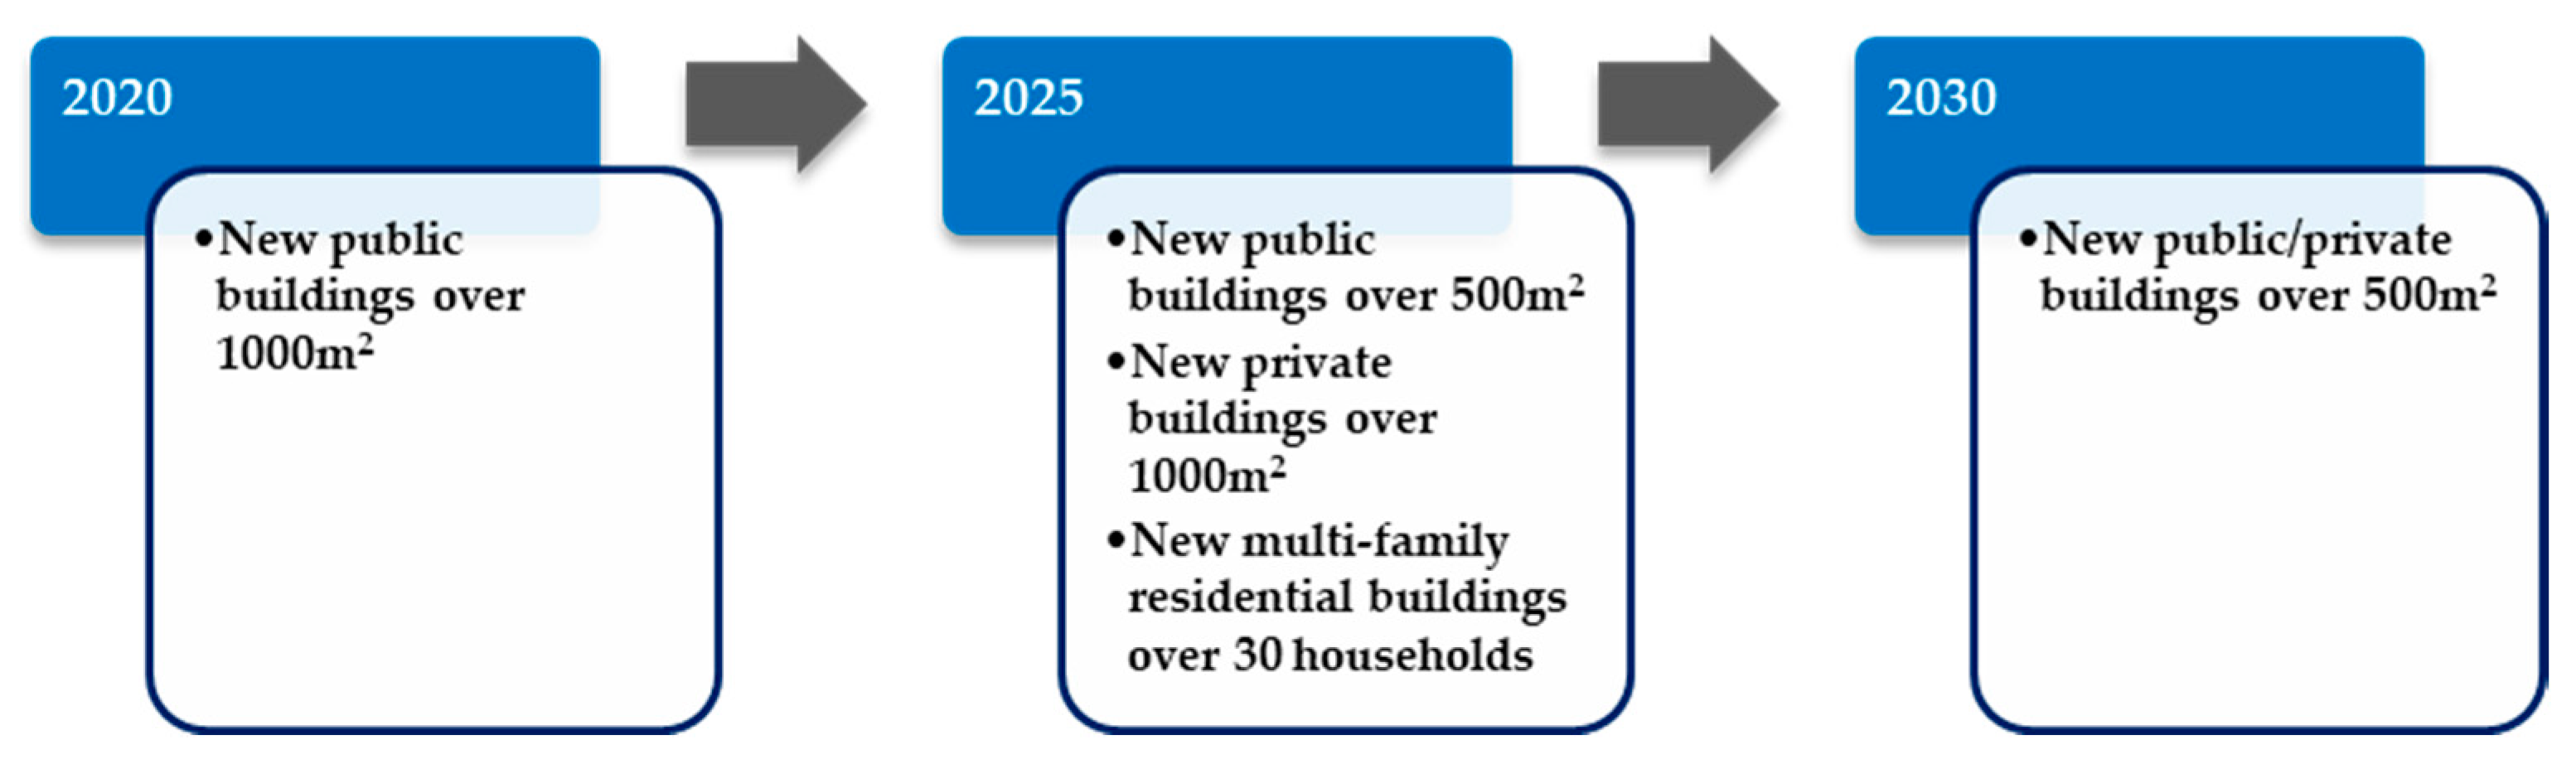
2. Building Envelope Requirements of Korean Building Energy Policies

In 2019, the Korean government announced a plan for new buildings to be zero-energy consuming. According to this stage-by-stage mandatory road map, as shown in Figure 1, newly developed public structures must be zero-energy buildings beginning in 2020, whereas new multifamily residential structures will be required to be zero-energy buildings from 2025 [19]. To develop zero-energy buildings, it is important to minimize the energy consumption and implement renewable energy systems. As illustrated in Figure 2, to fulfill this roadmap, some building energy regulations, including the building energy efficiency certification (BEEC) and zero-energy building certification (ZEBC), will become mandatory from 2025 for multifamily residential buildings with over 30 households, and are currently being recommended. BDCES is mandatory at present. In addition, BEEC was established and implemented in multifamily residential buildings in 2001 to estimate CO2 emissions and energy consumption for heating, cooling, and hot water supply in buildings based on their design documents. ZEBC was established in 2014 but officially launched in 2017. The purpose of ZEBC is to promote the implementation of renewable energy systems and building energy management systems to reduce building-energy consumption and improve building-energy independency rates. Detailed certification systems are described in Table 1. However, under the zero-energy building roadmap, 2025 multifamily residential buildings with more than 30 households must achieve a BEEC certification level of 1++ or higher, and a ZEBC certification level of 5 or greater [20].
To reduce building energy consumption, the Korean government has been developing building energy policies and regulations since 1979 when the Building Act (BA), which includes guidelines on the building envelope, space heating and cooling systems, and ventilation systems, was first implemented [21]. In addition, the BDCES regulations were officially launched in 2001 under the Building Act. The BDCES integrated the existing building-energy codes/standards of the Korean government and combined the building energy codes of five other countries, including the United States (U.S.), the United Kingdom (U.K.), Canada, Japan, and Germany for easy implementation [9,21].
In 2012, the Korean government established the Green Building Creation Support Act (GBCSA), which has been enforced since 2013. This act highlights the reduction of national energy consumption and carbon dioxide emissions. For this reason, the BDCES moved under GBCSA in 2013. In general, BA, GBCSA, and BDCES are mandatory prescriptive building-energy acts and regulations for all types of buildings expected to have high energy consumption. Thus, buildings must comply with the requirements of these acts and regulations to obtain a building permit.
In general, there are some building-energy conservation measures that can be implemented in Korean residential buildings, such as the thermal properties of the building envelope, the lighting power density, and heating system efficiency; however, cooling systems are not mandated for residential buildings in South Korea according to the BDCES and BEEC [2,3,21,22,23]. However, the building-energy acts and regulations on multifamily residential buildings in South Korea have been enforced mainly regarding the insulation applied in the building envelopes, including the exterior walls, roofs, floors, and windows.
For this reason, this study is designed to investigate the changes in properties of the building envelope based on building-energy regulations. Thus, in this study, the history of the design criteria for building envelopes is reviewed. Table 2 provides the history of the design criteria for residential buildings for different climate zones, and Figure 3 shows maps of South Korea and the Korean climate zone. As shown in Figure 3, South Korea has three climate zones: central, southern, and Cheju Island [22]. The central zone has hot and humid summers and cold and dry winters, whereas the southern zone is hot and humid in summer and cool and dry in winter. The climate conditions in the swing seasons (spring and fall) are warm and dry in both climate zones. The climate features of Cheju Island are warm and humid year-round. Figure 4 shows the average monthly outdoor temperature and relative humidity data of the three cities selected for this study. The weather data used in this study are typical meteorological years (TMY) derived from hourly weather data from the past 15 years (2004–2018) [24].
In Table 2, each envelope element is categorized into two cases based on whether the building shell element faces the outside air. “Direct” indicates an exterior element facing the outside air, whereas “Indirect” indicates an element that does not face the outside air directly, but has unconditioned adjacent spaces, such as an unconditioned enclosed balcony area [21]. As shown in Table 2, since 2001, when the BDCES was officially released, the design criteria for the building envelope in terms of thermal transmittance (U-value in W/m2·K) have been improved.
Because the BDCES has different requirements for various climate zones in South Korea, in this study, three major cities representing different climate regions for building-energy simulations were selected. Figure 3 illustrates the monthly average outdoor air temperature for the three selected cities used for the simulations.

3. Effects of Building Envelope Requirements on Building Energy Performances
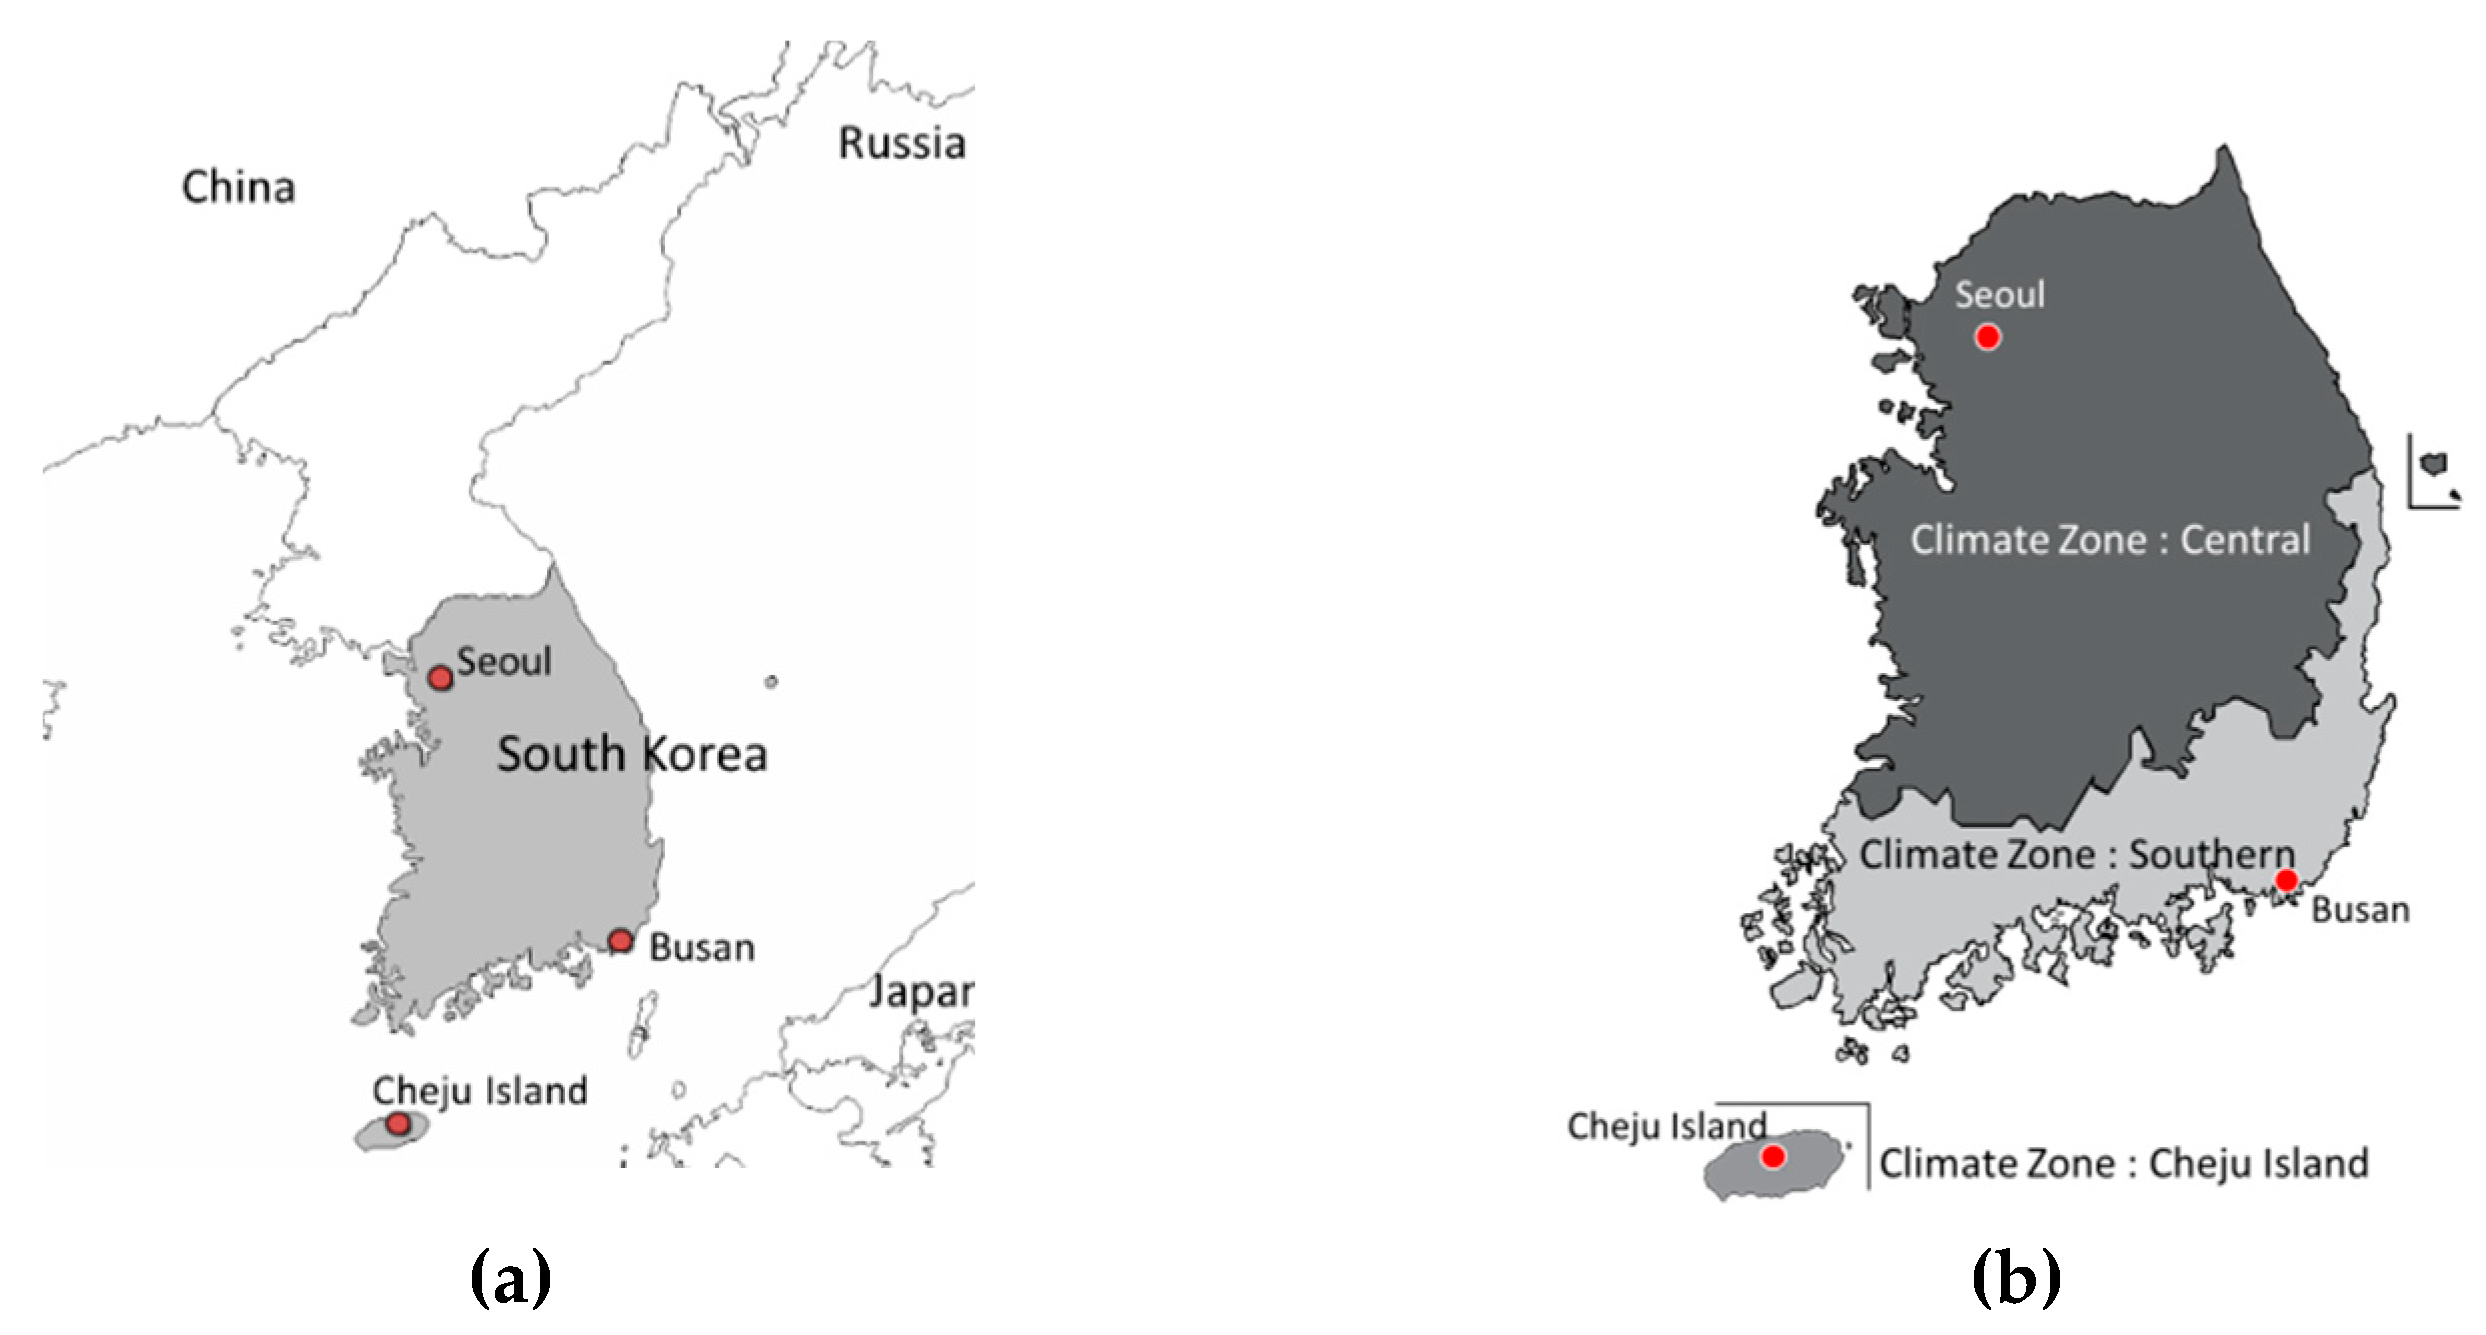
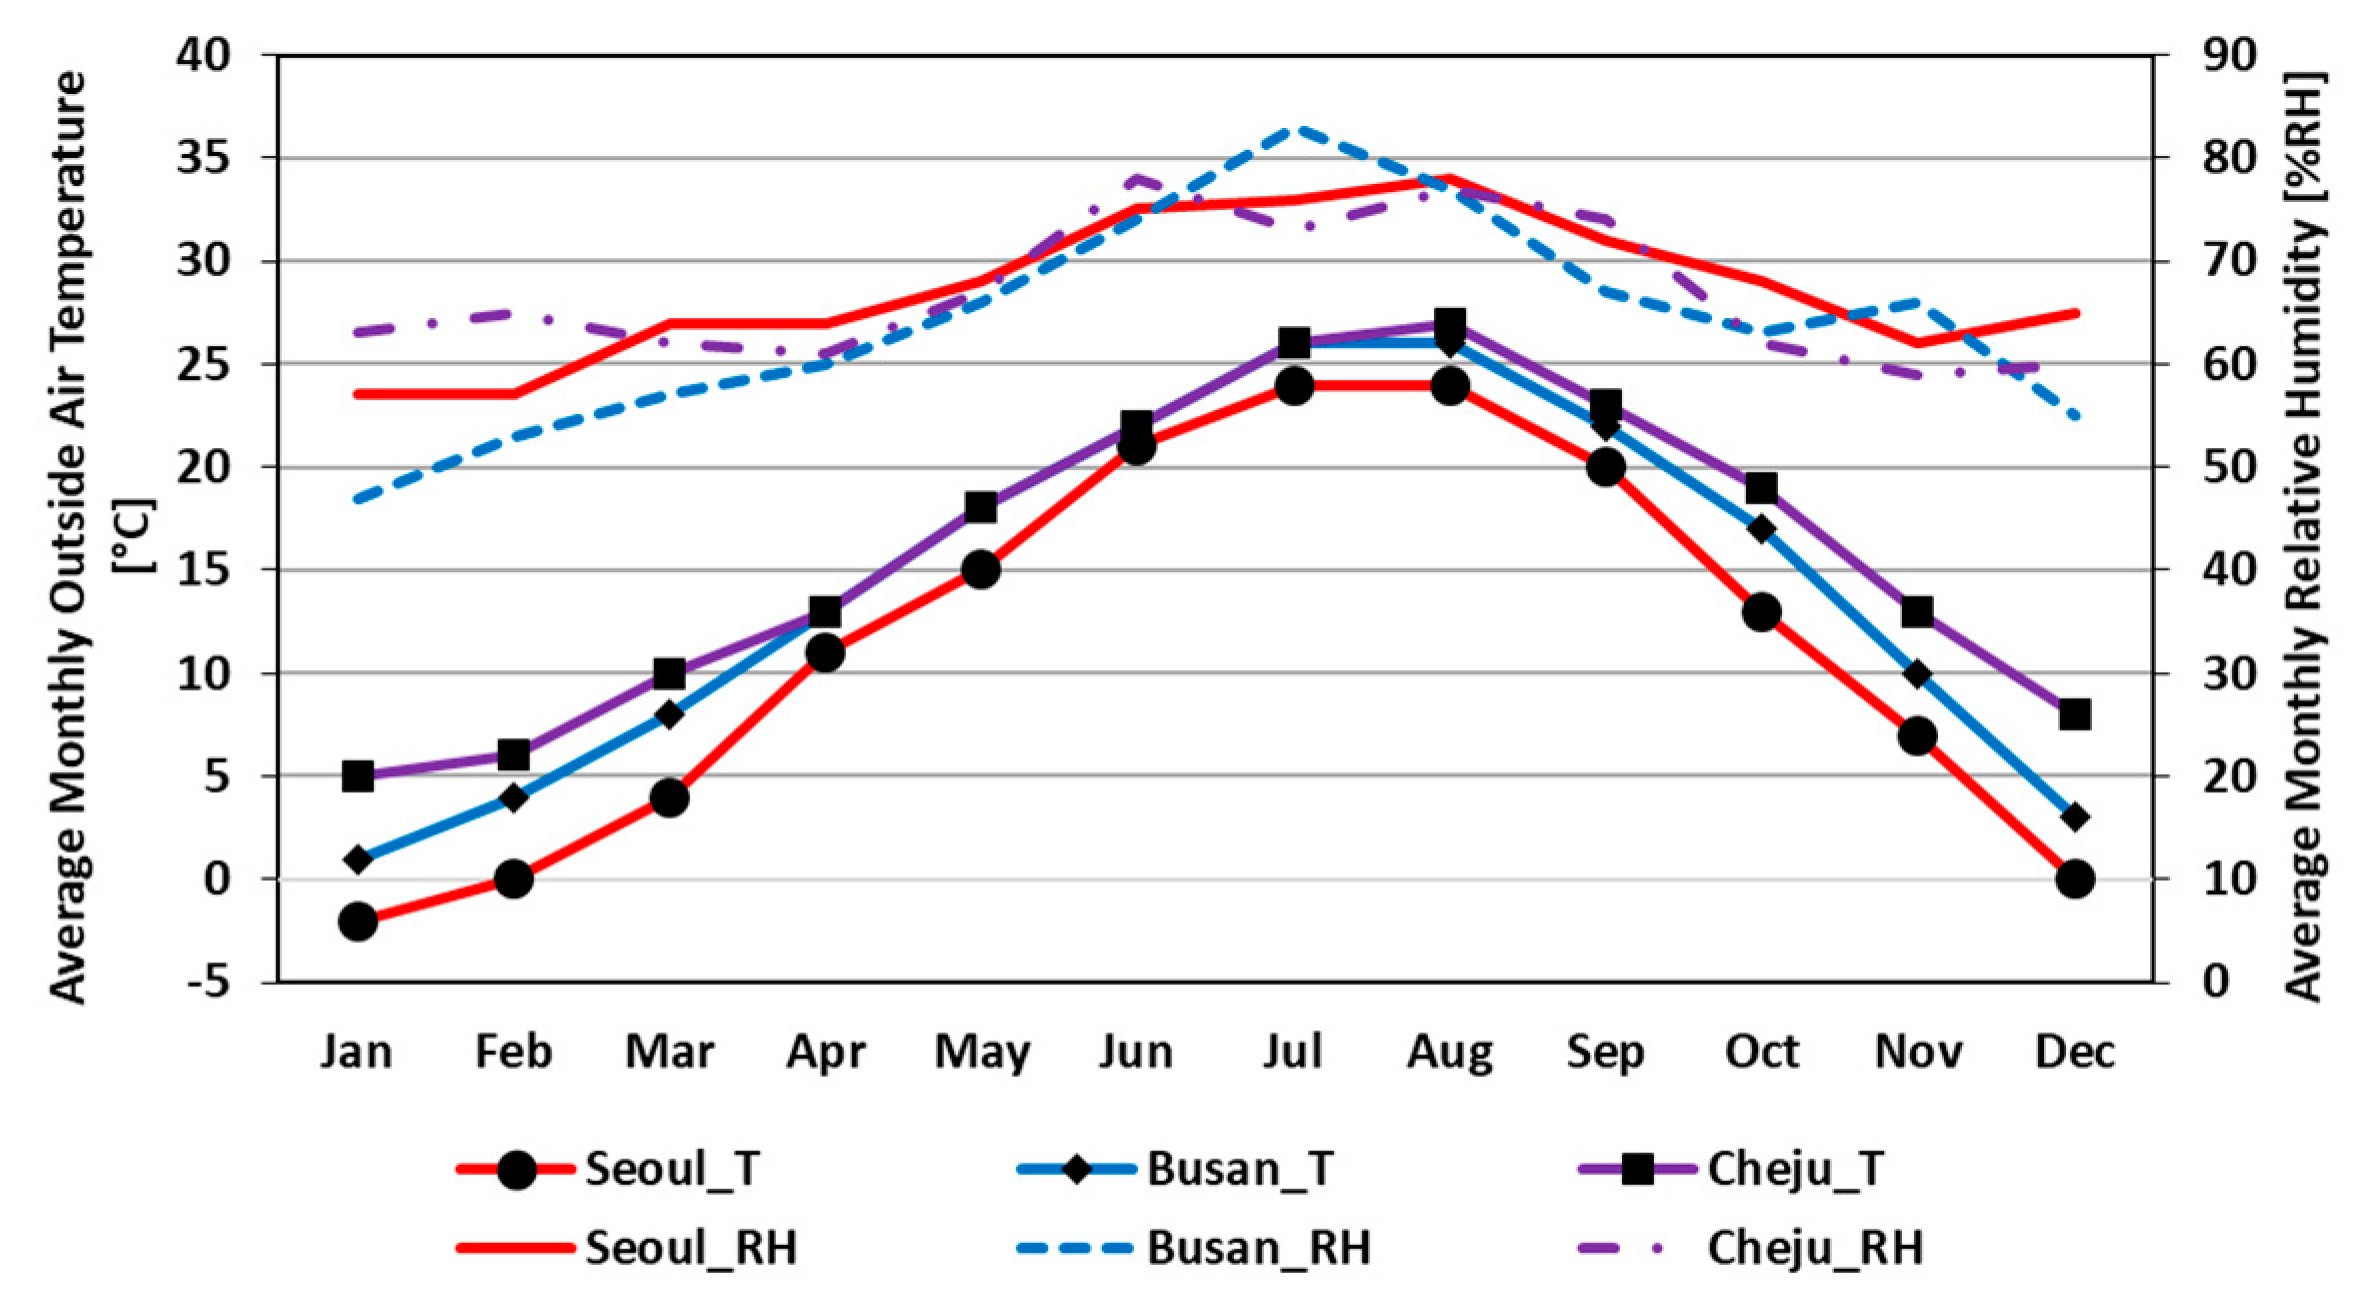
3.1. Methodology

Building-energy rating systems in South Korea, such as G-SEED and the Korea Building Energy Efficiency Certification, evaluate the building energy performances quantitatively based on the building energy code/standard, and grant relevant certifications to buildings that meet the criteria of these rating systems [3,4,18,25,26,27]. In other words, in these buildings, an evaluation of the energy rating systems for building-energy performance is one of the key processes, and thus these rating systems require building-energy simulation reports to be included in the application documents.
Figure 5 shows a schematic flowchart of the analysis of the effects of the building-energy code/standard on the energy performance of multifamily residential buildings. As shown in Figure 5, in this analysis, an official code compliance program used by the Korean government was employed to calculate the primary and secondary energy use intensities and greenhouse gas emissions. The official building-energy simulation tool used in South Korea as a code compliance tool is the ECO2 program developed by the Korean government and distributed by the Korea Energy Agency. The ECO2 program is based on ISO 13790 (EN 13790:2008, International Organization for Standardization) and DIN V 18599 (Fraunhofer IRB, Germany) for calculating primary and secondary building-energy demands and greenhouse gas emissions [28,29]. Some studies have shown that the ECO2 program can generate similar building energy use trends as found in their reference data [30,31,32].

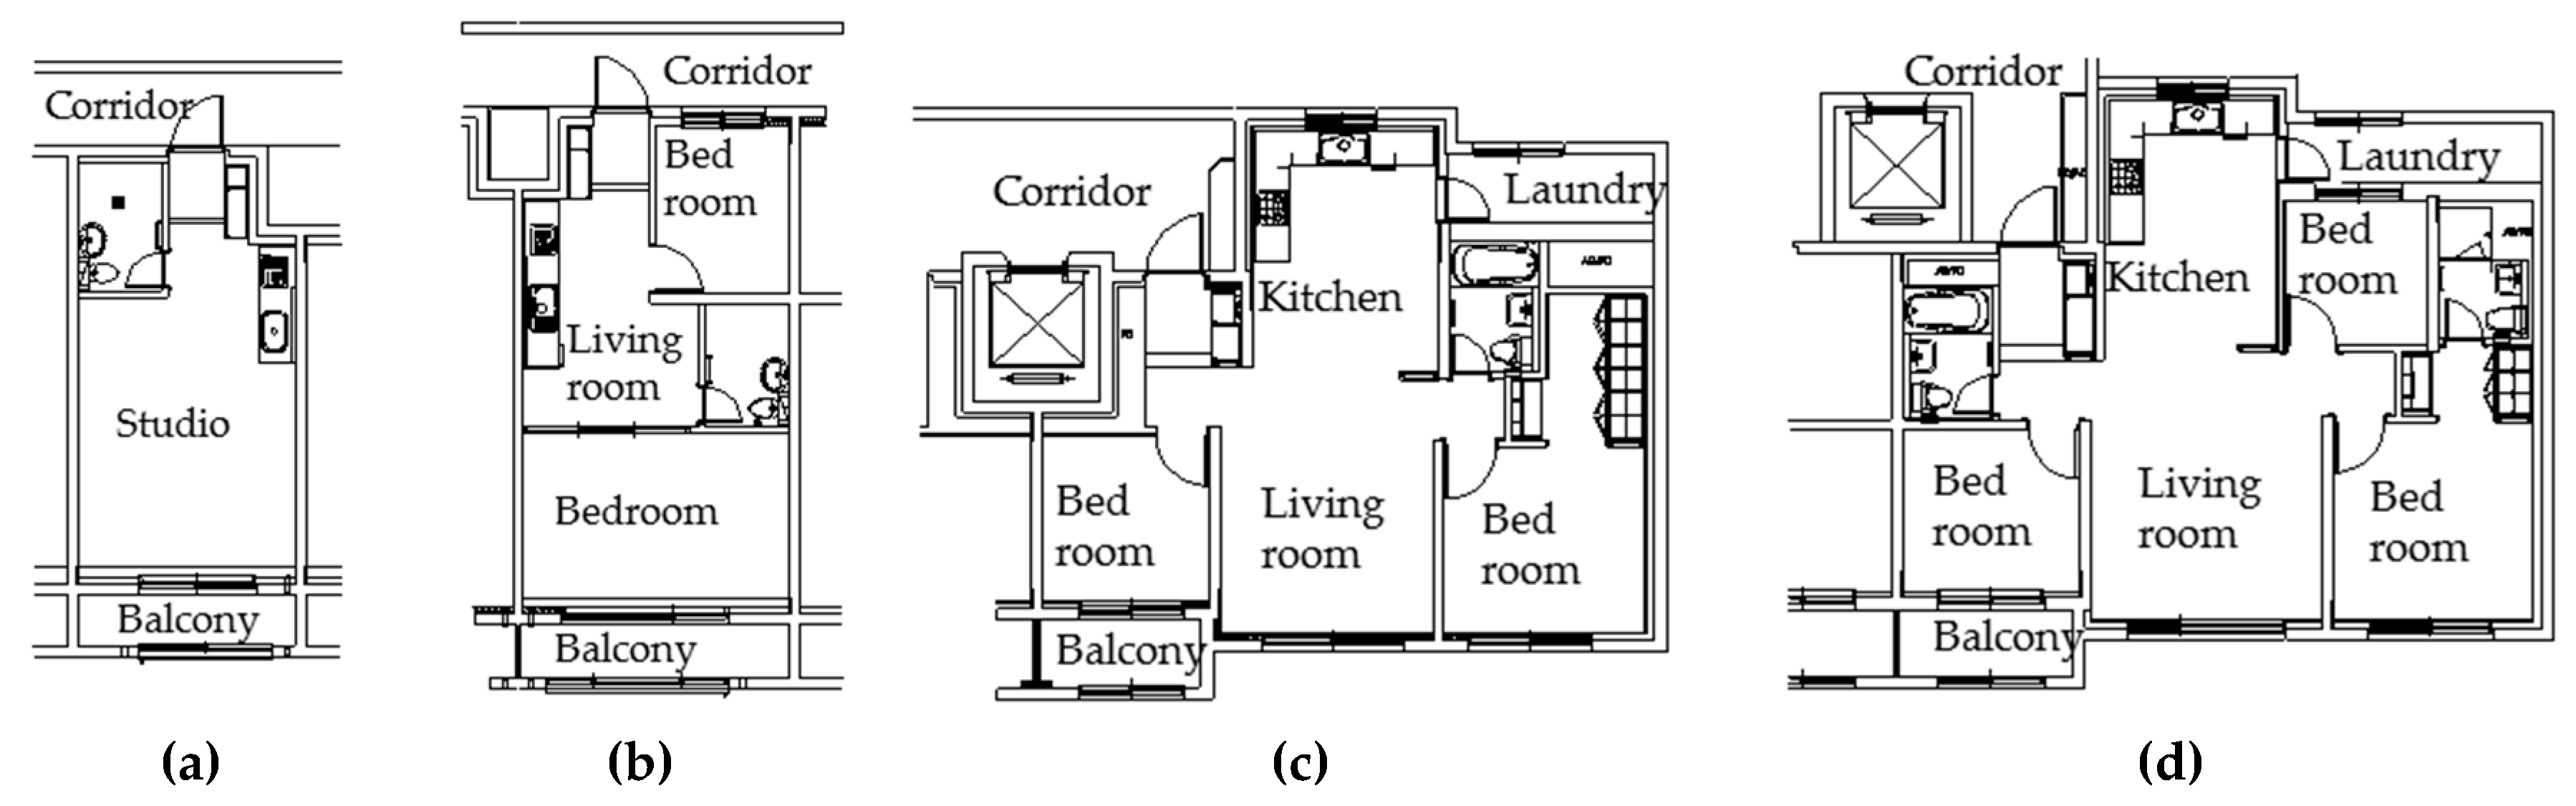
3.2. The Building Energy Simulation Models

In South Korea, most public residential buildings have been provided by the Korean government through the Korea Land and Housing Corporation (LH) owned by the Korean government since 1962. Since 1962, LH has supplied 2.76 million public residential housing units in the form of multifamily residential buildings [33]. Most LH public multifamily residential housing units are designed using one of the four floor plans shown in Figure 6, with a size of (a) 26 m2, (b) 39 m2, (c) 49 m2, (d) 59 m2, 66 m2, 74 m2, or 84 m2. LH multifamily residential buildings were built according to the envelope requirements of the Korean building design criteria, as shown in Table 2.
To validate the simulation models, this study utilized the actual building-energy data from the K-APT energy management system operated by the Korea Appraisal Board, which is owned by the Korean government [34]. The energy data provided in the K-APT system is for space heating, domestic hot water, and electricity used in a complex of multifamily residential buildings. However, the electricity data of the K-APT system includes all electrical equipment, such as indoor and/or outdoor lighting and plug loads. In addition, because the resulting simulation tool used in this study is the annual average energy use intensity data, only the annual average space heating energy use data can be compared between the actual energy data and the simulation model, as shown in Table 3. Because the K-APT system does not provide space heating data for multifamily residential buildings in Cheju Island, the comparison analysis shown in Table 3 does not include Cheju Island. The actual buildings used in this analysis are a complex of multifamily residential buildings with 809 units located in Kangnam-gu, Seoul, and a complex with 452 units located in Yangsan-si, a satellite city of Busan. As a result, the difference between the actual and simulation models are 9.8% and 5.0% for Seoul and Busan, respectively. These differences can be derived because of different schedules, such as the occupant schedule, lighting schedule, equipment schedule, and heating set-point temperature. Indeed, the actual building energy data from the K-APT system was for a complex of several residential building units. This means that the schedules of the residential units may be different, whereas the building energy simulations applied specific schedules to the simulated residential units.

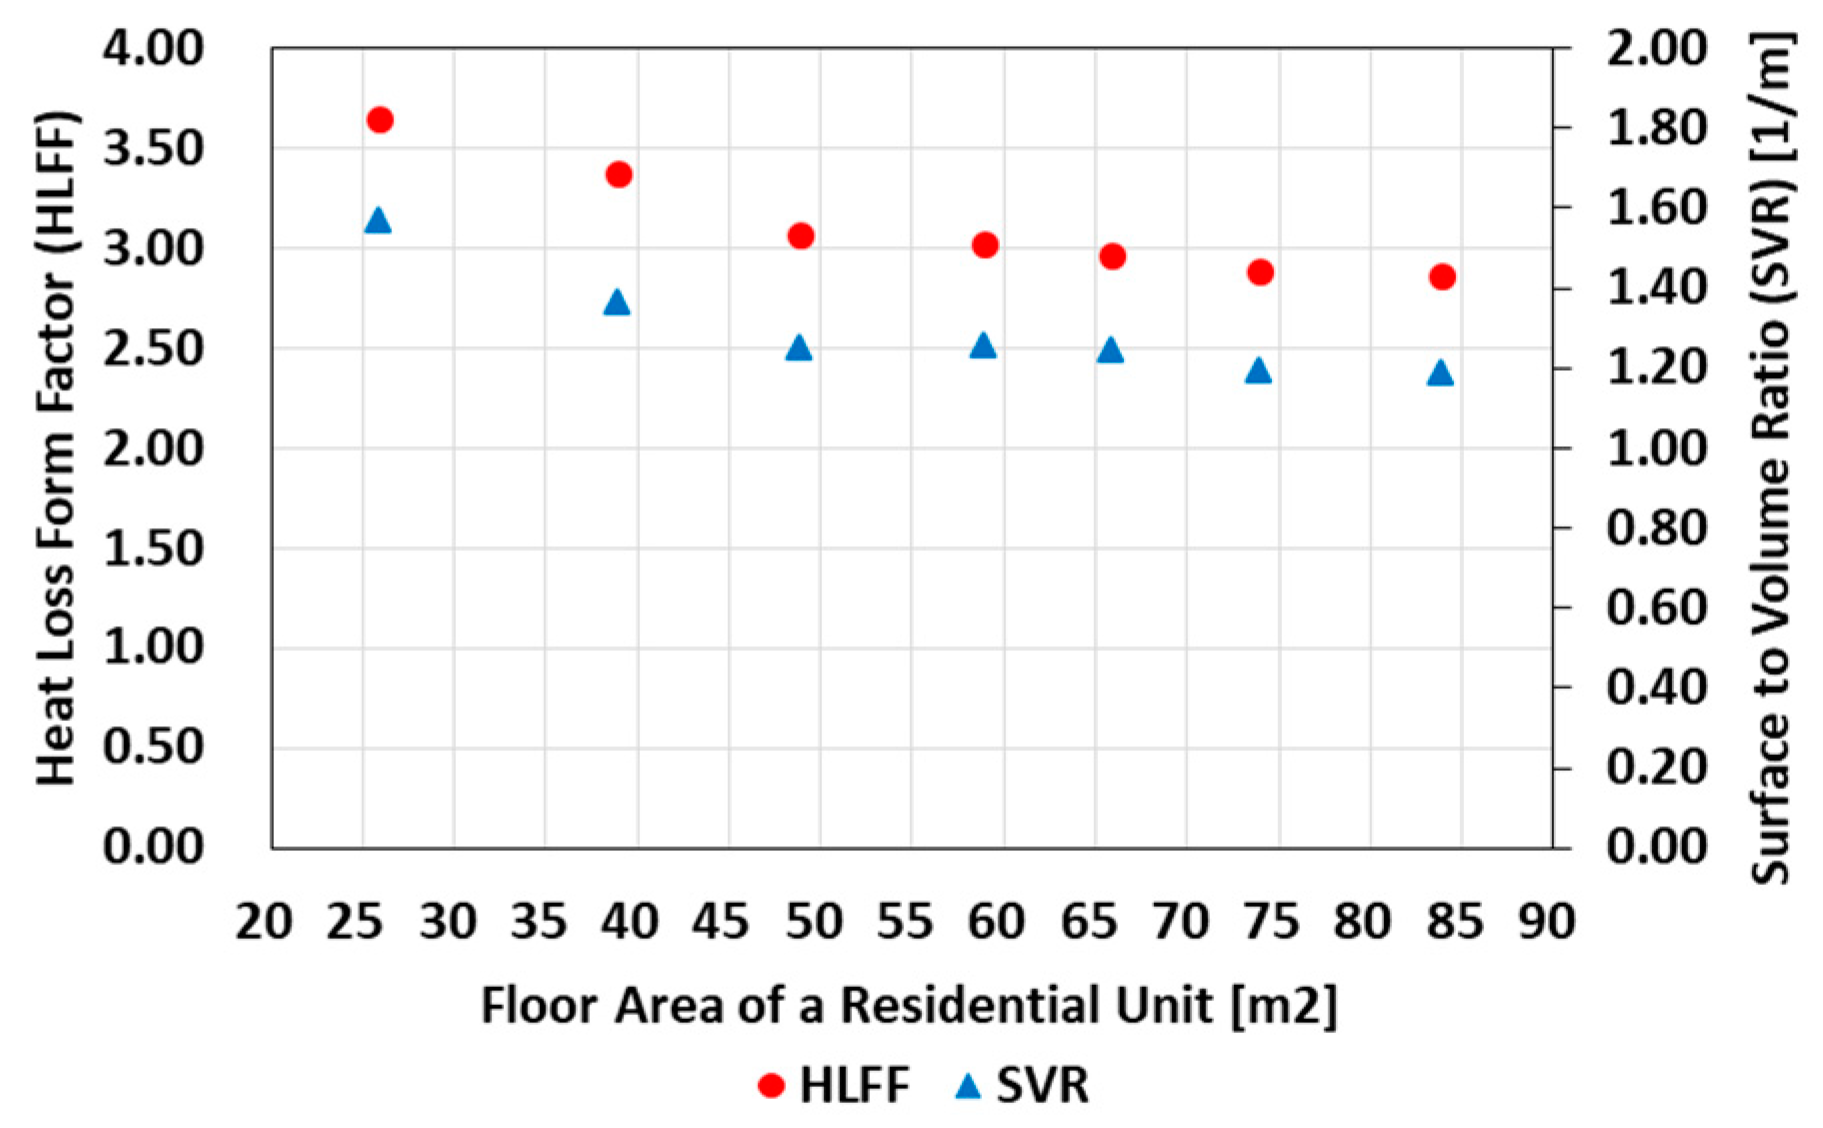
3.3. Shape Factors of Korean Public Multifamily Residential Buildings

Figure 7 shows the heat loss form factor (HLFF) values and the surface-to-volume ratio values for the floor types of the LH public multifamily residential units presented in Figure 6. The HLFF is the ratio of the overall building envelope area to the net floor area, which is nondimensional. The surface-to-volume ratio (SVR) is the ratio of the overall building envelope area to the building volume. These factors describe the thermal characteristics of a building showing a potential energy efficiency with a lower value indicating a more compact building with a smaller heat loss area [35]. The calculations of these factors are described through Equations (1) and (2). As shown in Figure 7, the HLFFs and SVRs of the 26 m2 and 39 m2 floor types were higher than the other floor configurations, which shared similar values. In other words, the 26 m2 and 39 m2 floor types showed more heat losses and heating loads than the other floor types studied in this paper.
HLFF = A en / A hf ,
SVR = A en / V bldg ,
  • Aen: Building envelope area [m2]
  • Ahf: Heated floor area [m2]
  • Vbldg: Building volume [m3]

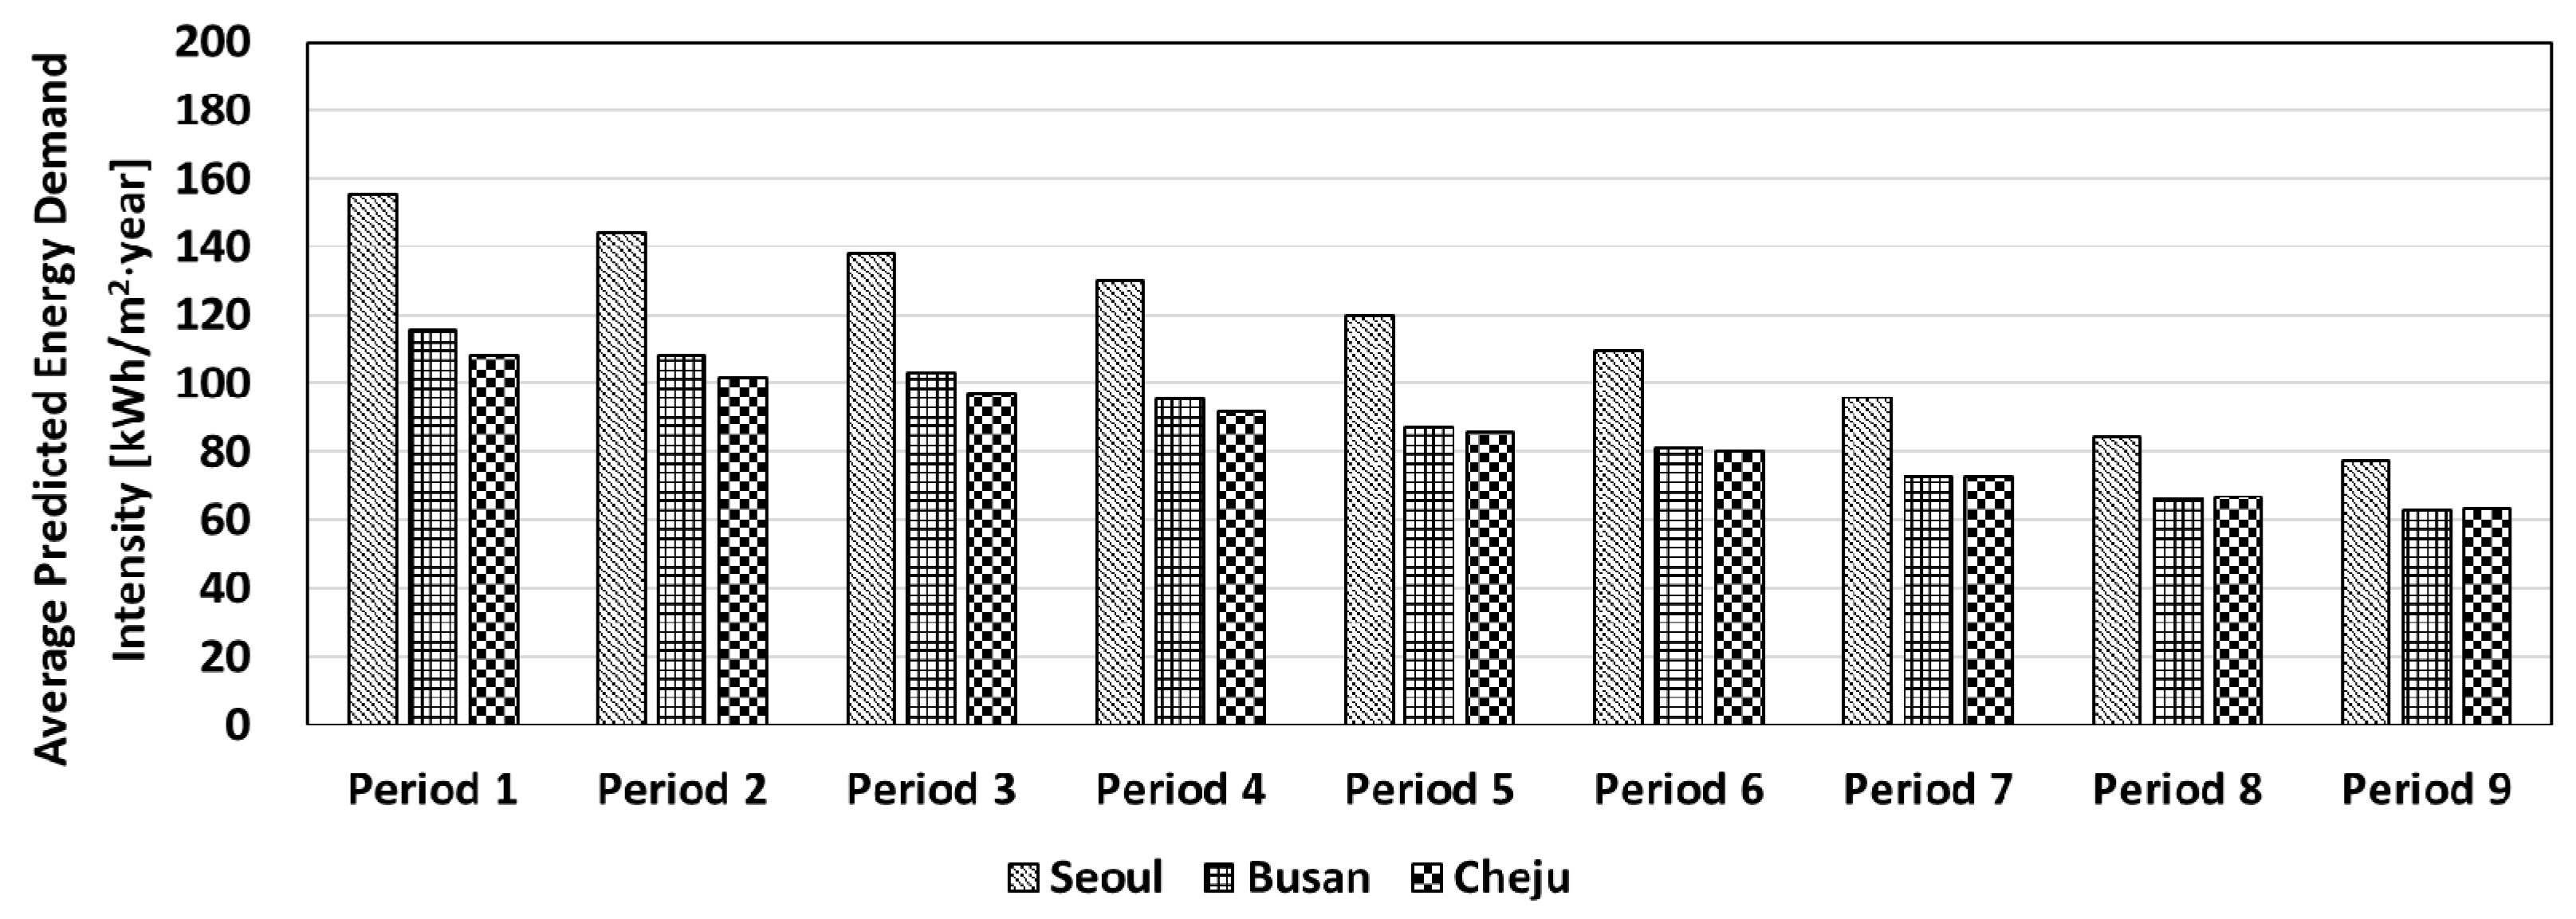
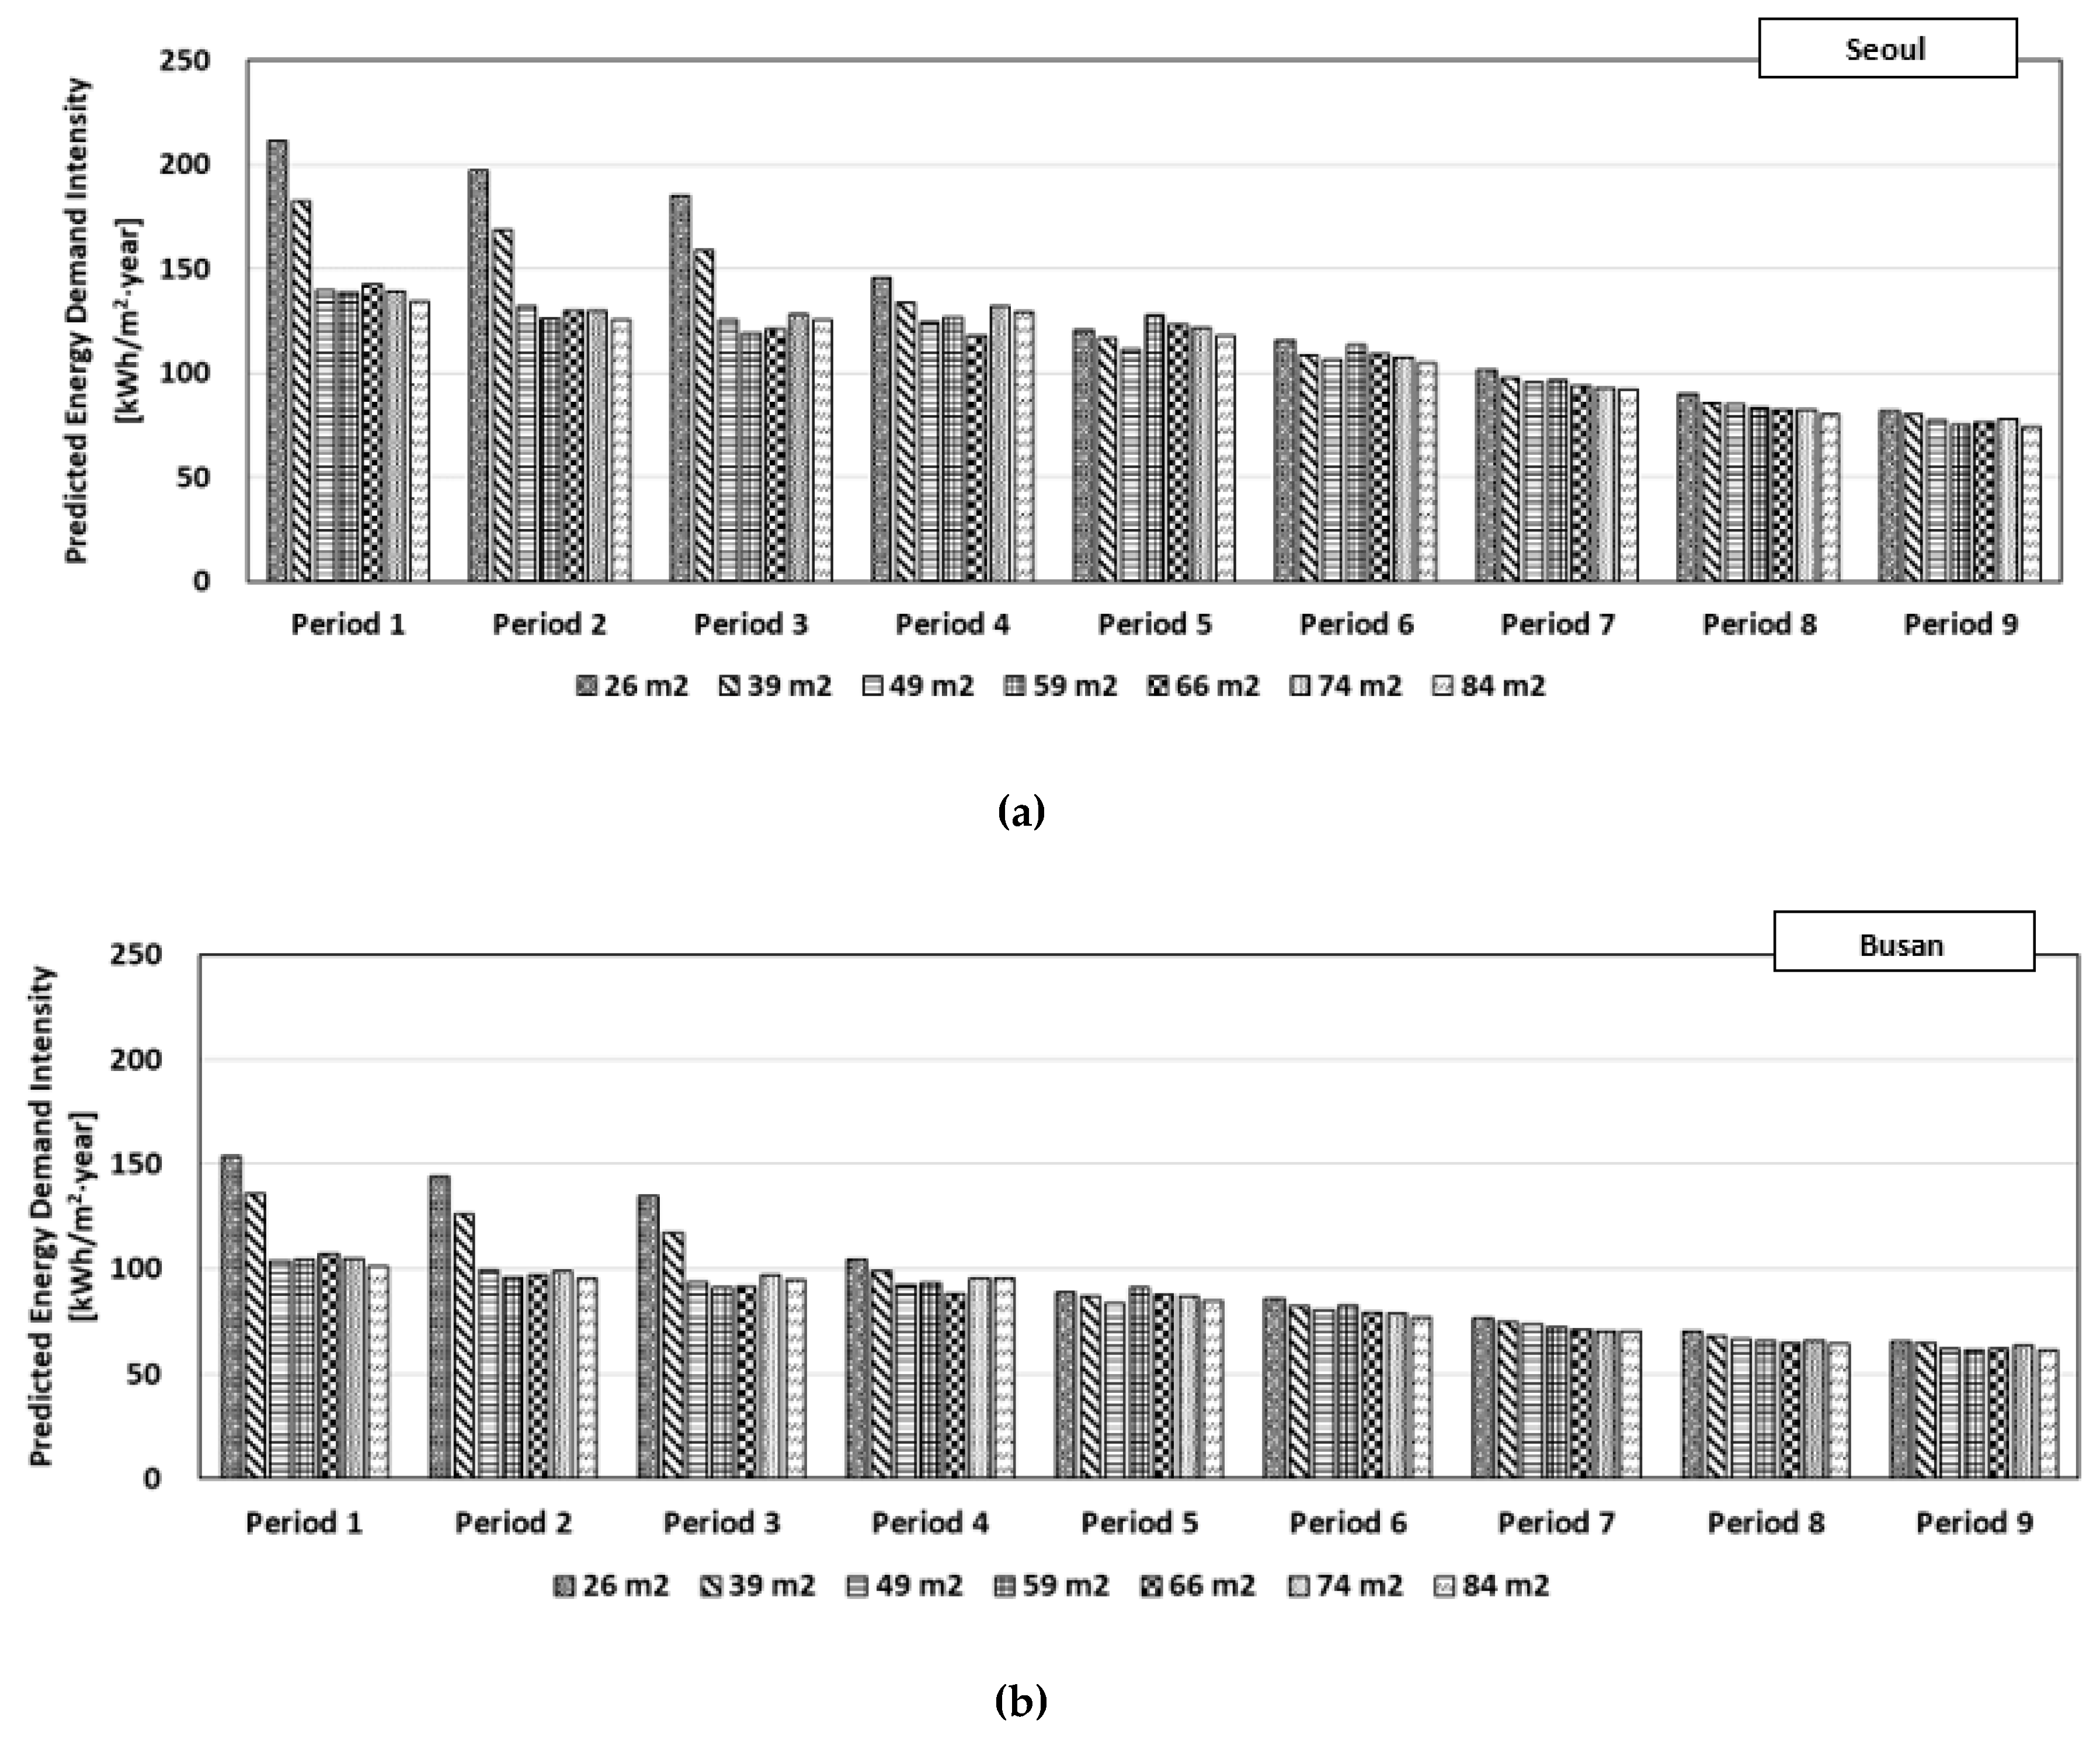
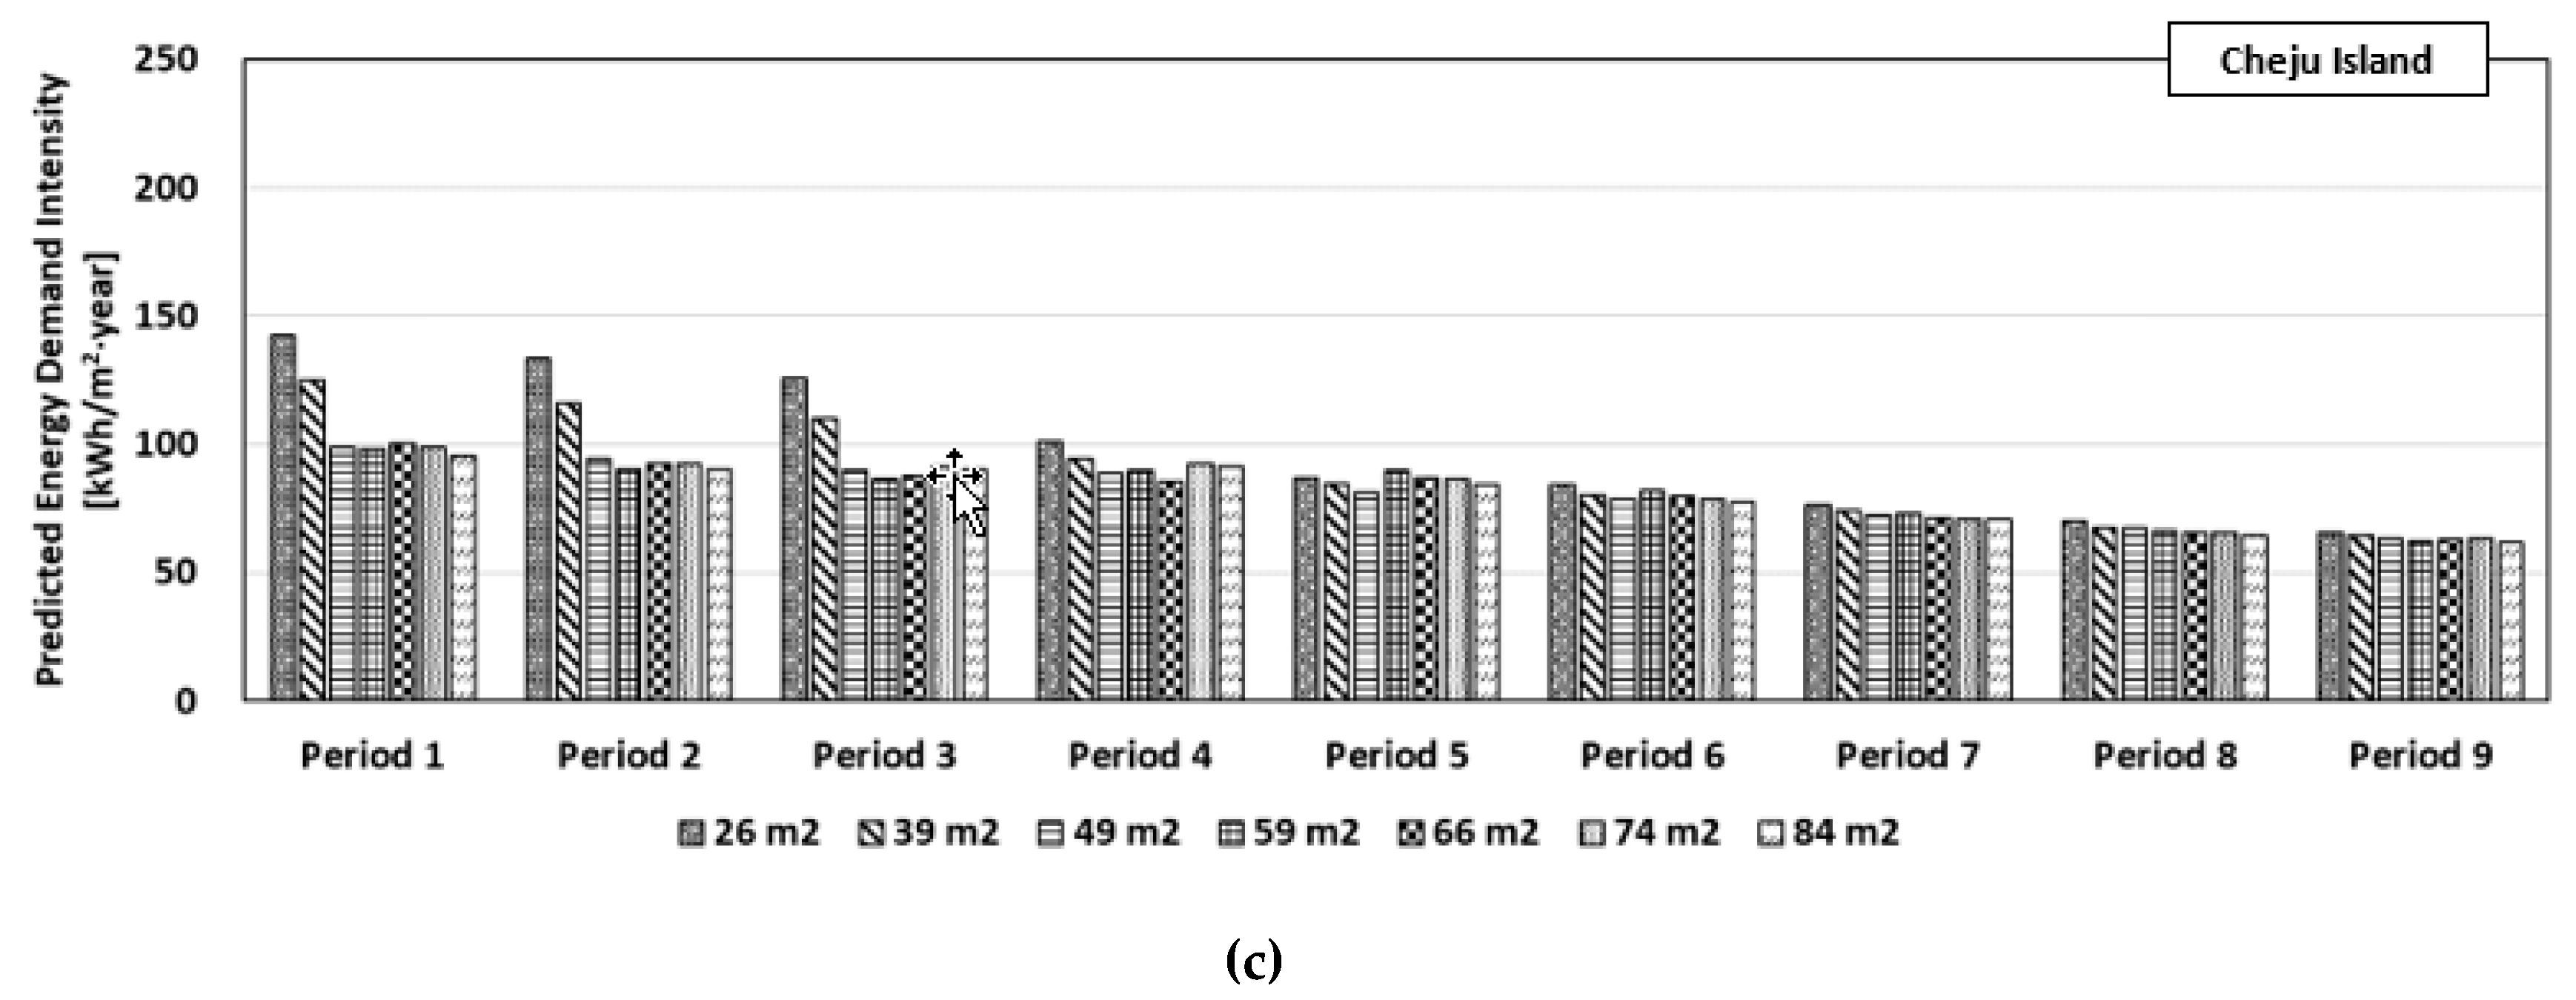
3.4. Energy Demand Intensity for Different Building Envelope Requirements

In this study, a series of simulations were carried out to analyze the building-energy performance by changing the building-envelope requirements in accordance with a strengthening of the building design criteria for Korean multifamily residential buildings. Table 4 provides the assumptions used for the building-energy simulations for the ECO2 building-energy calculation tool. Among the inputs shown in Table 4, the infiltration rate was determined based on the default setup for the pre-certification of the BEEC, and the building orientation was selected based on the design guidelines for building-energy saving of the Korea Energy Agency, which manages the BEEC [36,37]. For the lighting power density and the solar heat gain coefficient (SHGC) that is the fraction of solar radiation transmitted through a window, the researches of Hwang et al. [38] and Han et al. [17] were referenced, respectively.
As mentioned above, because cooling systems are not required as a default mechanical system for multifamily residential buildings in South Korea according to the BDCES and BEEC, only heating systems were modeled in the ECO2 program. The heating system assumed in this study was a radiant floor heating system connected to a hot water boiler, which is the dominant residential heating system in South Korea [39,40,41,42]. The indoor air temperature was assumed to be 26.0 °C for space heating, which was subject to the building energy policies of the Korean government [2,3,21,22,23].
Figure 8 shows the resulting building-energy demand intensity data of the Korean multifamily residential buildings as calculated by the ECO2 simulation tool for three different climate regions and for different periods with different building-envelope requirements, as shown in Table 2. As shown in Figure 8, the average building-energy demand intensities decreased when reaching the present, because the prescriptive building-envelope requirements have been strengthened, as shown in Table 2. However, for the smaller unit types, that is, 26 m2 and 39 m2, the energy demand intensity was higher than those of the other types, as indicated in Figure 8. This result could be caused by the different unit configurations between the two small units and the other unit types, as shown in Figure 7. As mentioned in Section 2, because three different regions had different climate characteristics, the overall building energy demand intensity data for these cities were different.
Figure 9 shows the average predicted building-energy demand intensities derived from different floor sizes for different periods. As shown in Figure 9, the energy demand intensities of Seoul were higher than those of Busan and Cheju Island because of the climate characteristics. The differences among these regions decreased over time because of a greater strengthening of the U-values for Seoul representing the central region more than the other regions, as shown in Table 2.

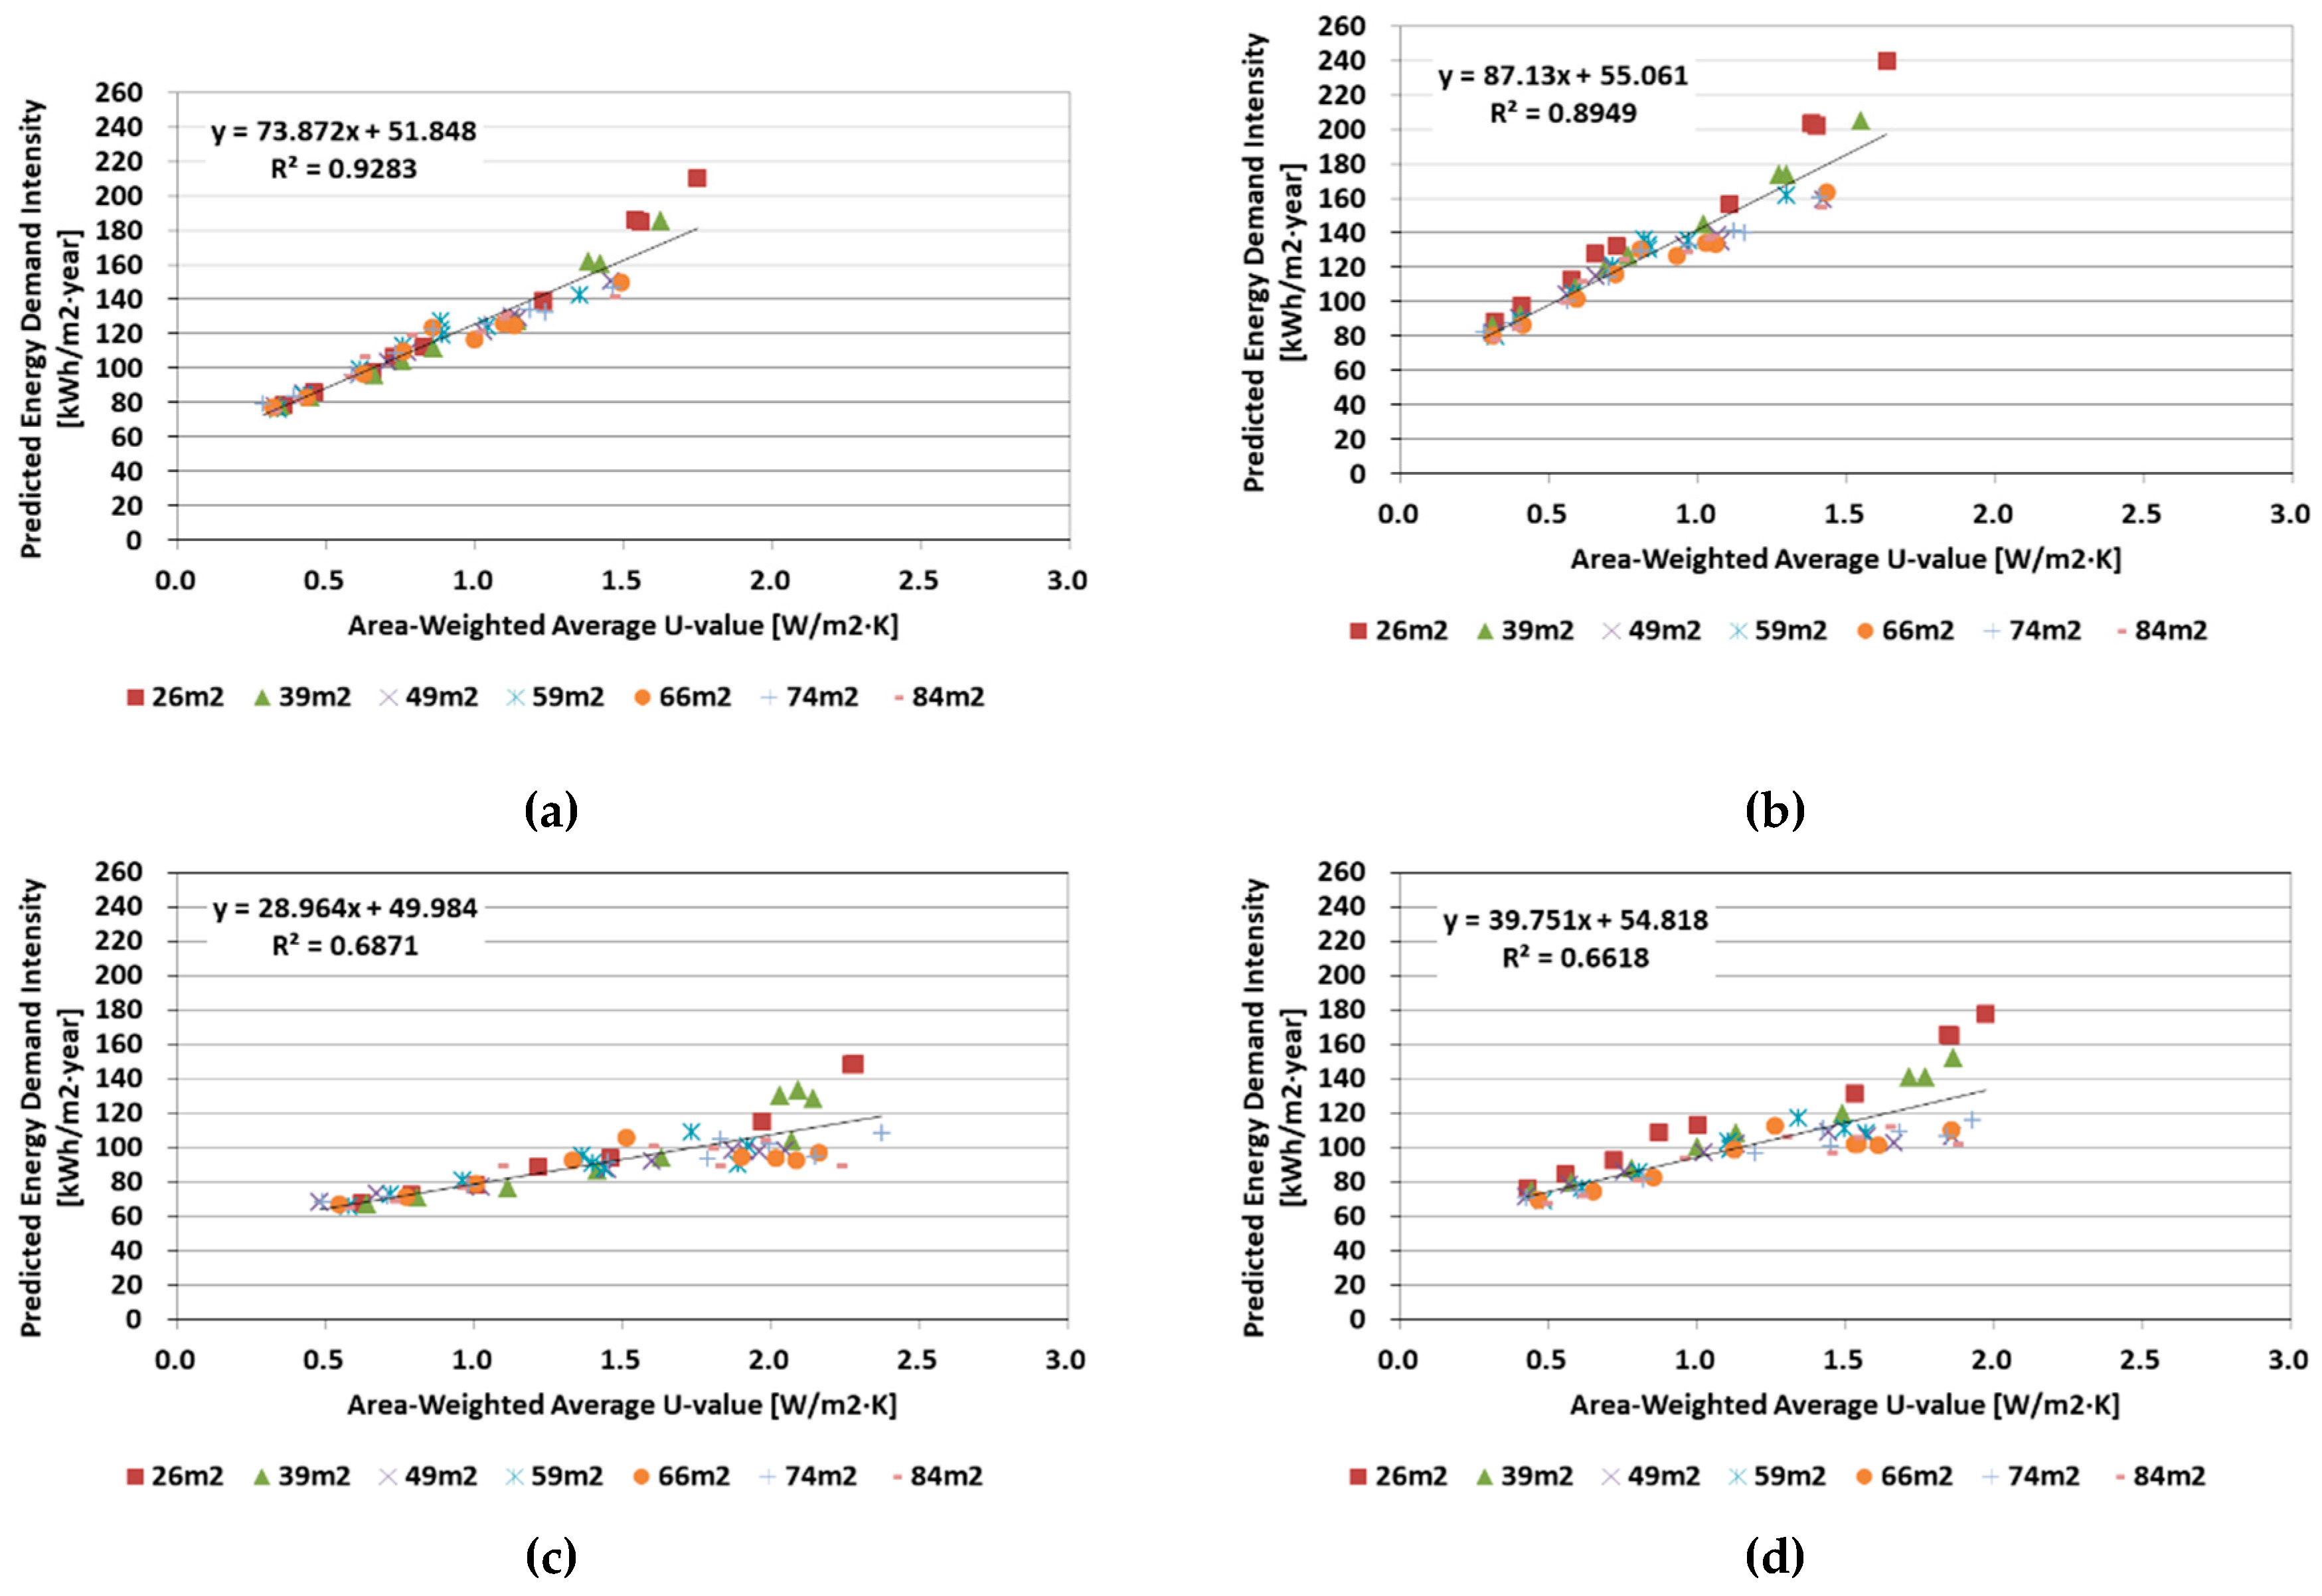
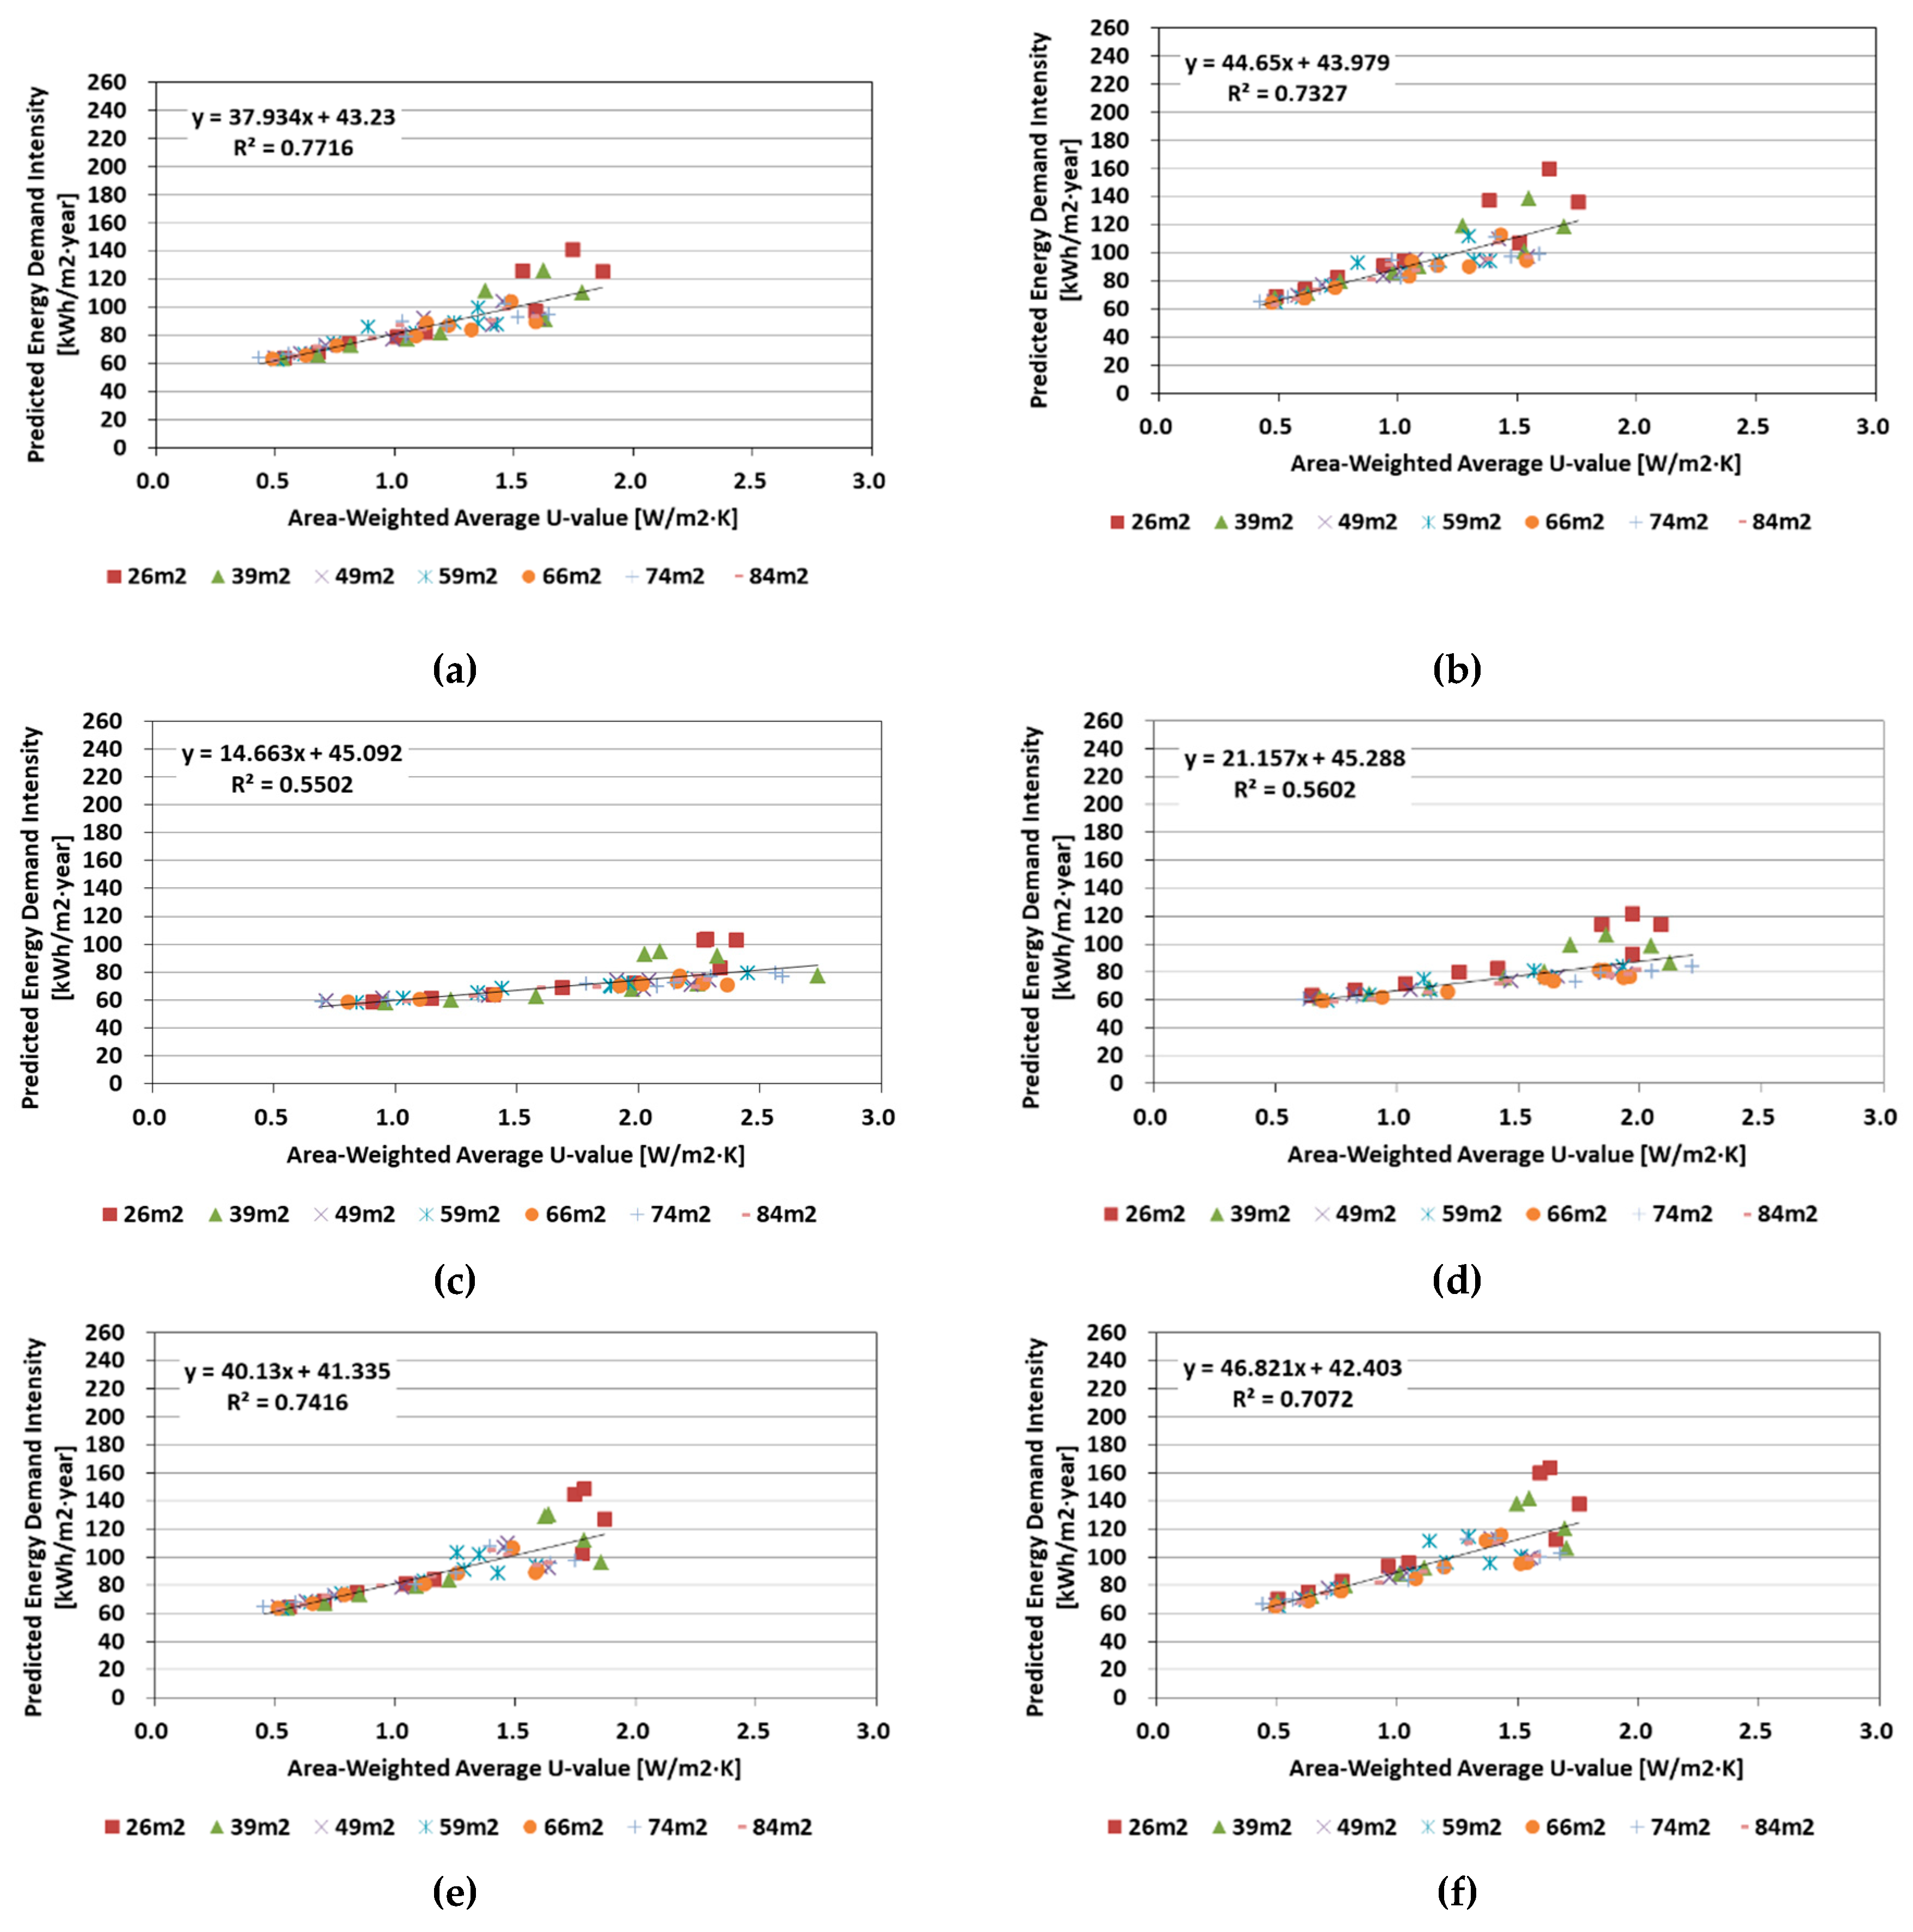
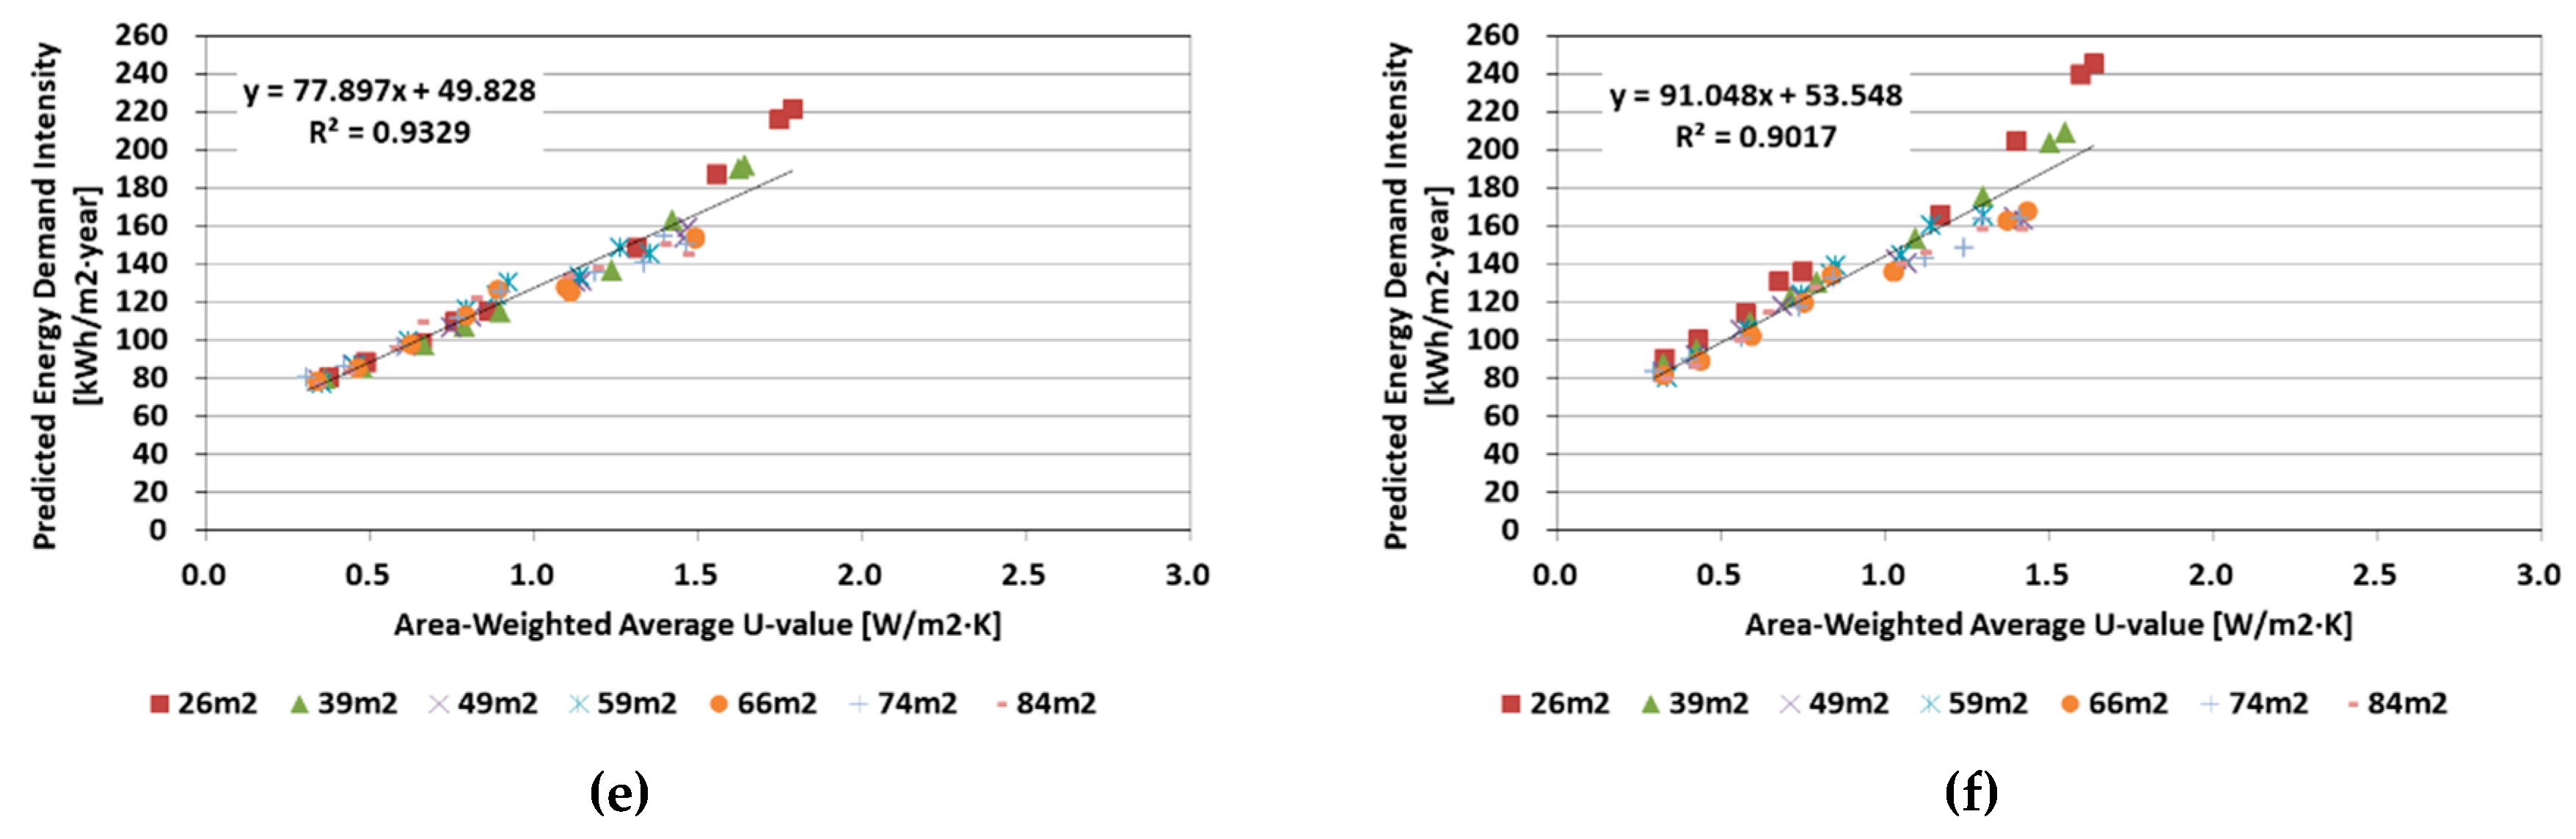
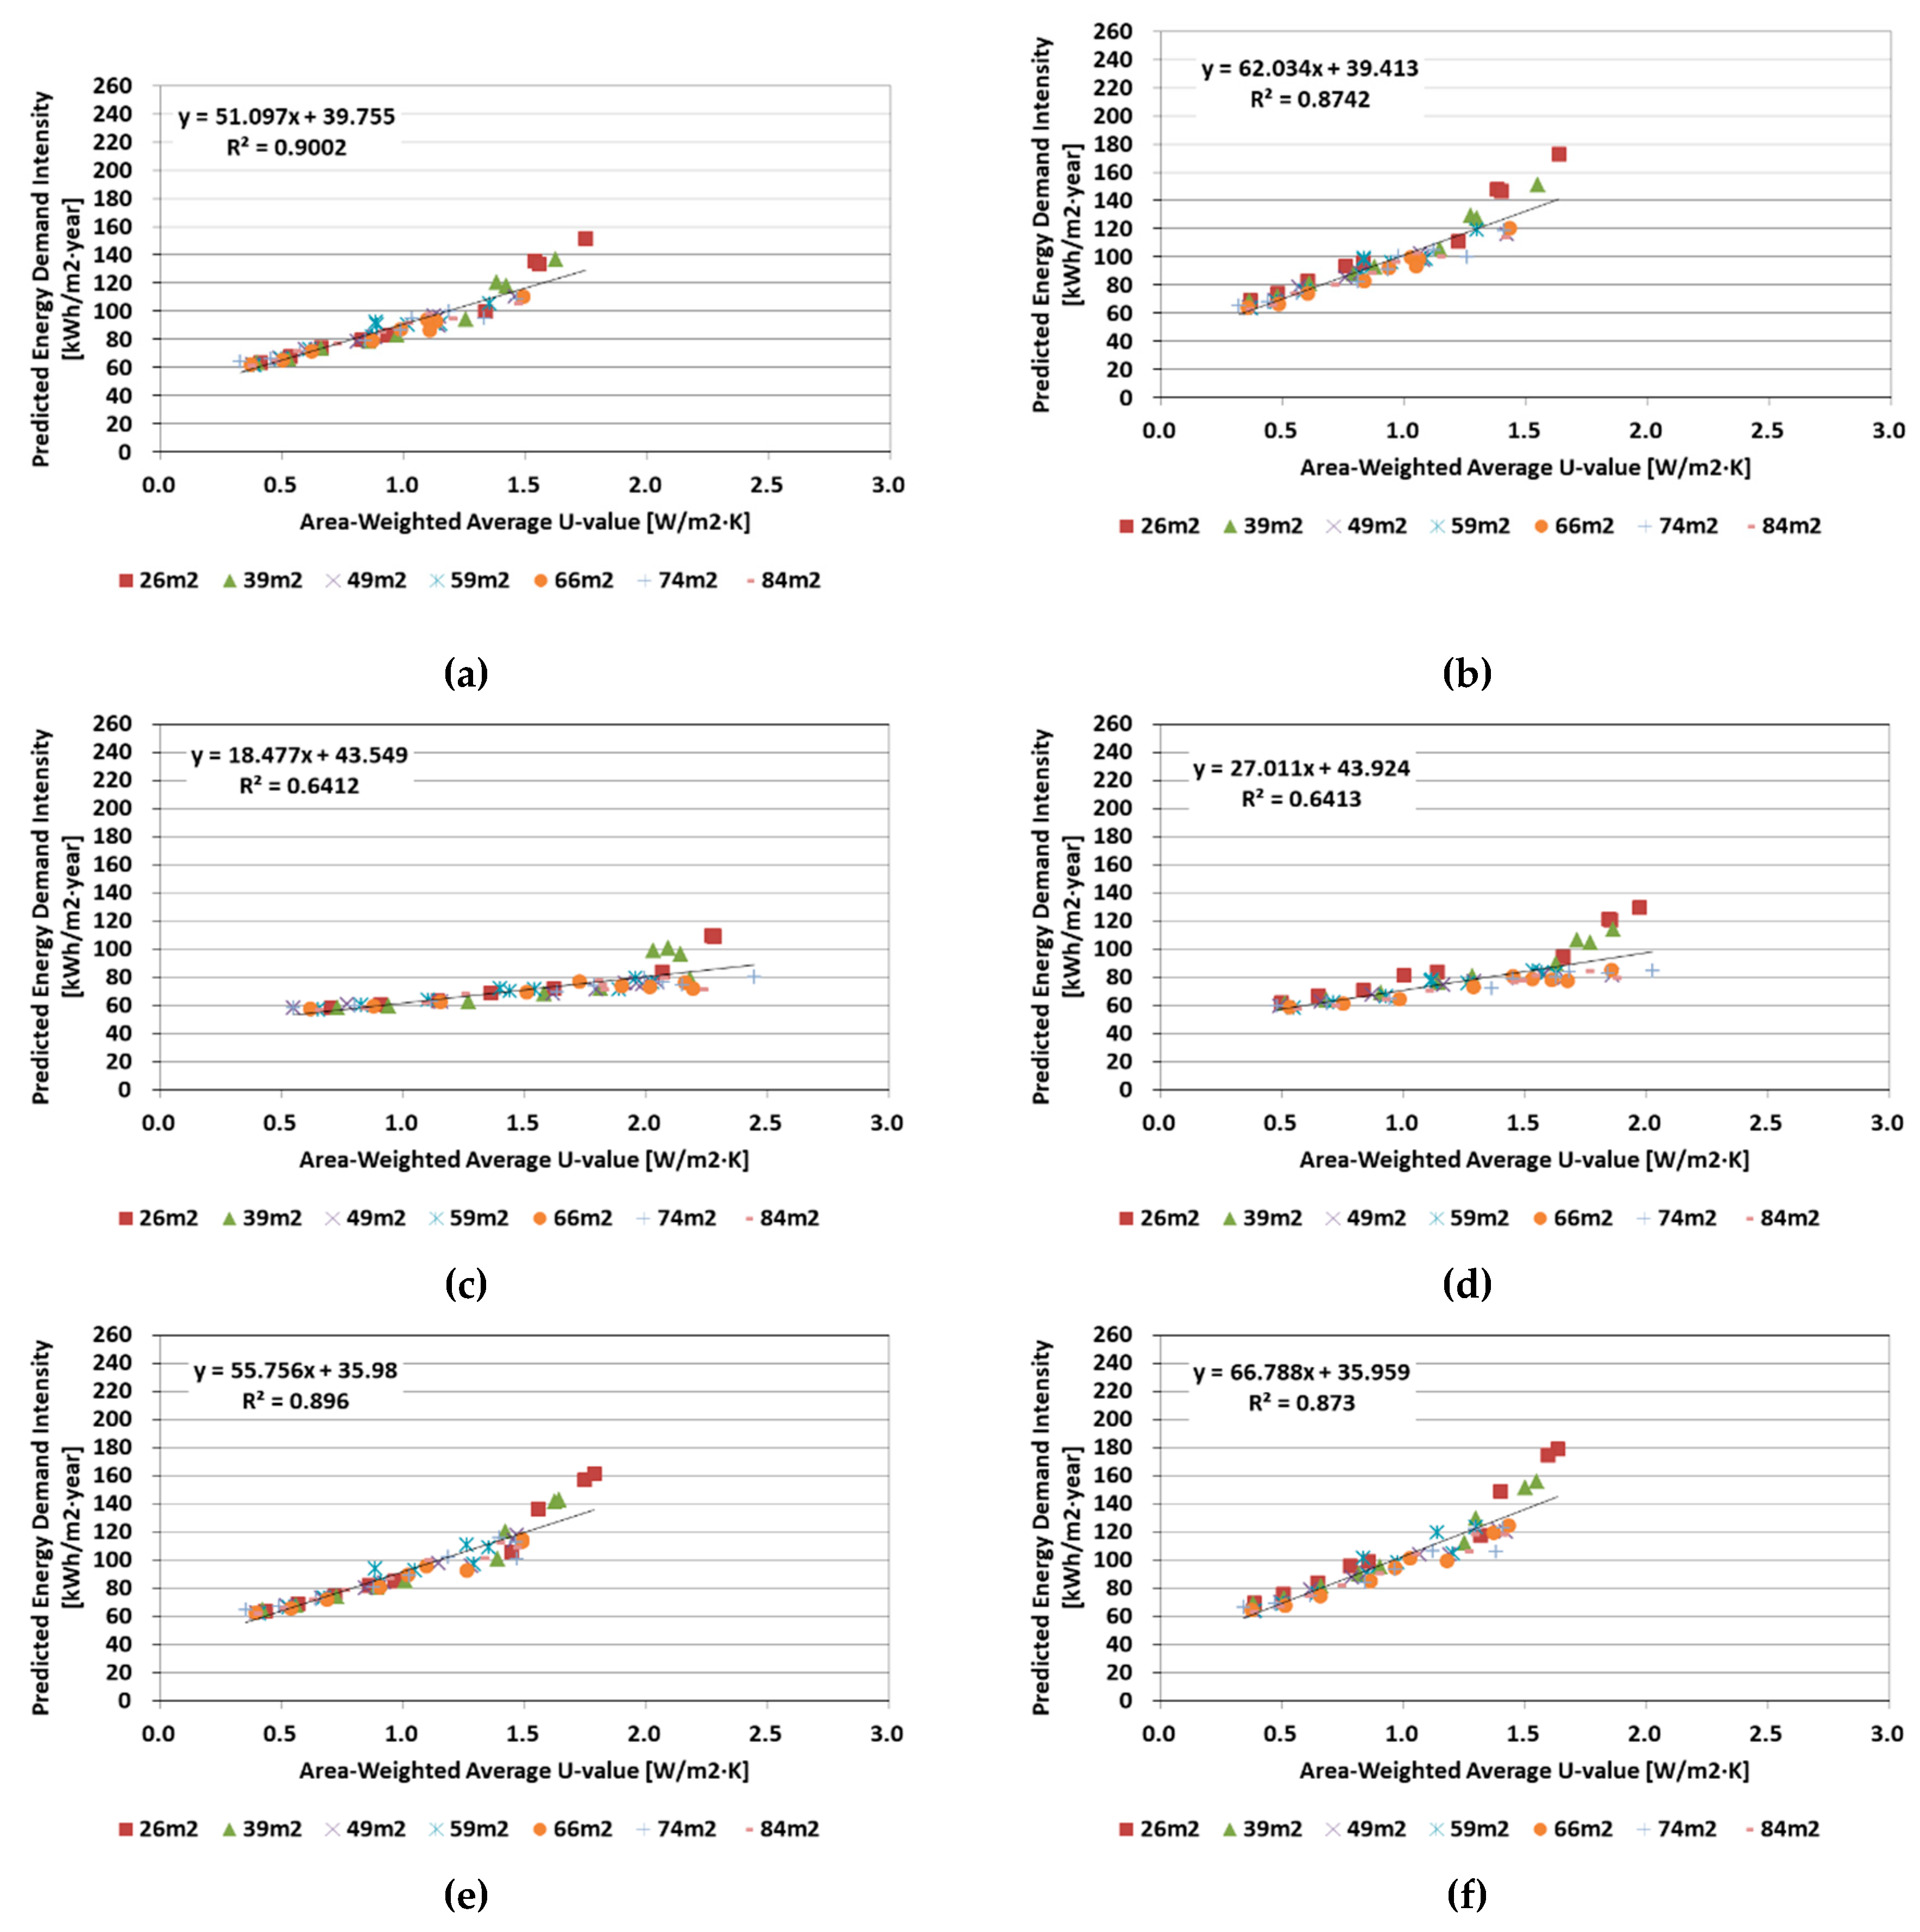
3.5. Correlation between Building Energy Performances and Building Envelope Requirements

This section presents the correlations between the building energy performances and building envelope requirements for simulated multifamily residential buildings for the three different climate regions. To analyze the correlation, this study employed the area-weighted average U-values of the building envelope of the simulated buildings, including the exterior walls, windows, roof, and floor. The area-weighted average U-value can be calculated using Equation (3) [43]. Figure 10 presents the schematic image of the simulation model and the household locations that were used to analyze energy performances of residential units by locations. Since the prototype building used for energy simulations had no windows on the East and West side exterior walls, the solar effects on these orientations could be small and negligible, and thus this paper assumed that the two side locations would have same energy performances.
Uw . avg . = (   Uen . i   ×   Aen . i   ) / Aen , i ,
  • Uw.avg.: Area-weighted average U-value [m2]
  • Uen,i: U-value of building envelope element [m2]
  • Aen,i: Area of building envelope element [m2]
Figure 11, Figure 12 and Figure 13 show the correlations between the area-weighted average U-values and the predicted building-energy demand intensity for the three different climate regions for different residential unit locations, as indicated in Table 4. For each unit location, a regression analysis was conducted by considering both the different floor types and different periods, with a total case number of 63. As a result, shown in Figure 11 through Figure 13, the energy demand intensities of the simulated multifamily residential buildings mostly had a linear correlation with the area-weighted average U-value data of the building envelope. Thus, each data group for a residential unit location can be represented by a linear equation, as described in Equation (4). In other words, using the linear equation, the potential energy demand intensity can be predicted for any area-weighted average U-values for the simulated buildings.
According to the results in Figure 11 through Figure 13, as the U-value increased, the data deviated from the linear trend line for all regions, and thus, it created a low coefficient of determination (R2). This result is due to the fact that the building-envelope requirements during periods 1–4 were not well established in the building energy code. When considering the regions, it was predicted that Seoul had the highest energy demands owing to the climate characteristics, whereas Cheju Island had the lowest.
As shown in Figure 11 through Figure 13, in terms of household location, the middle unit on the middle floor was predicted to have the lowest energy demand intensity for all regions. This is because the space heating load is generally related to the exterior surface area, and the middle unit on the middle floor has the lowest exterior surface area compared with the units on the top and bottom floors and on the side.
Building   Energy   Demand   Intensity = a   ×   Uw . avg . + b   .
  • a: Slope of a linear regression model
  • b: Y-intercept of a linear regression model
However, the results shown in Figure 11 through Figure 13 could imply that there will be a limit to the effect of strengthening the building-envelope requirement by improving the thermal properties of the building-energy demands. To evaluate the limit of improving building-envelope requirements, this paper performed a case study with four options of reducing area-weighted average U-values as shown in Table 5. Table 6 shows the case studies and their results, indicating the limit in improving the building-envelope requirements for Korean multifamily residential buildings. The baseline thermal properties of the building envelope were based on Table 2 for Period 9. As shown in Table 6, although the area-weighted average U-values of the LH prototype buildings were reduced by up to 100%, the maximum potential energy demand intensity reductions could reach 25%–45% depending on the climate region and household location.

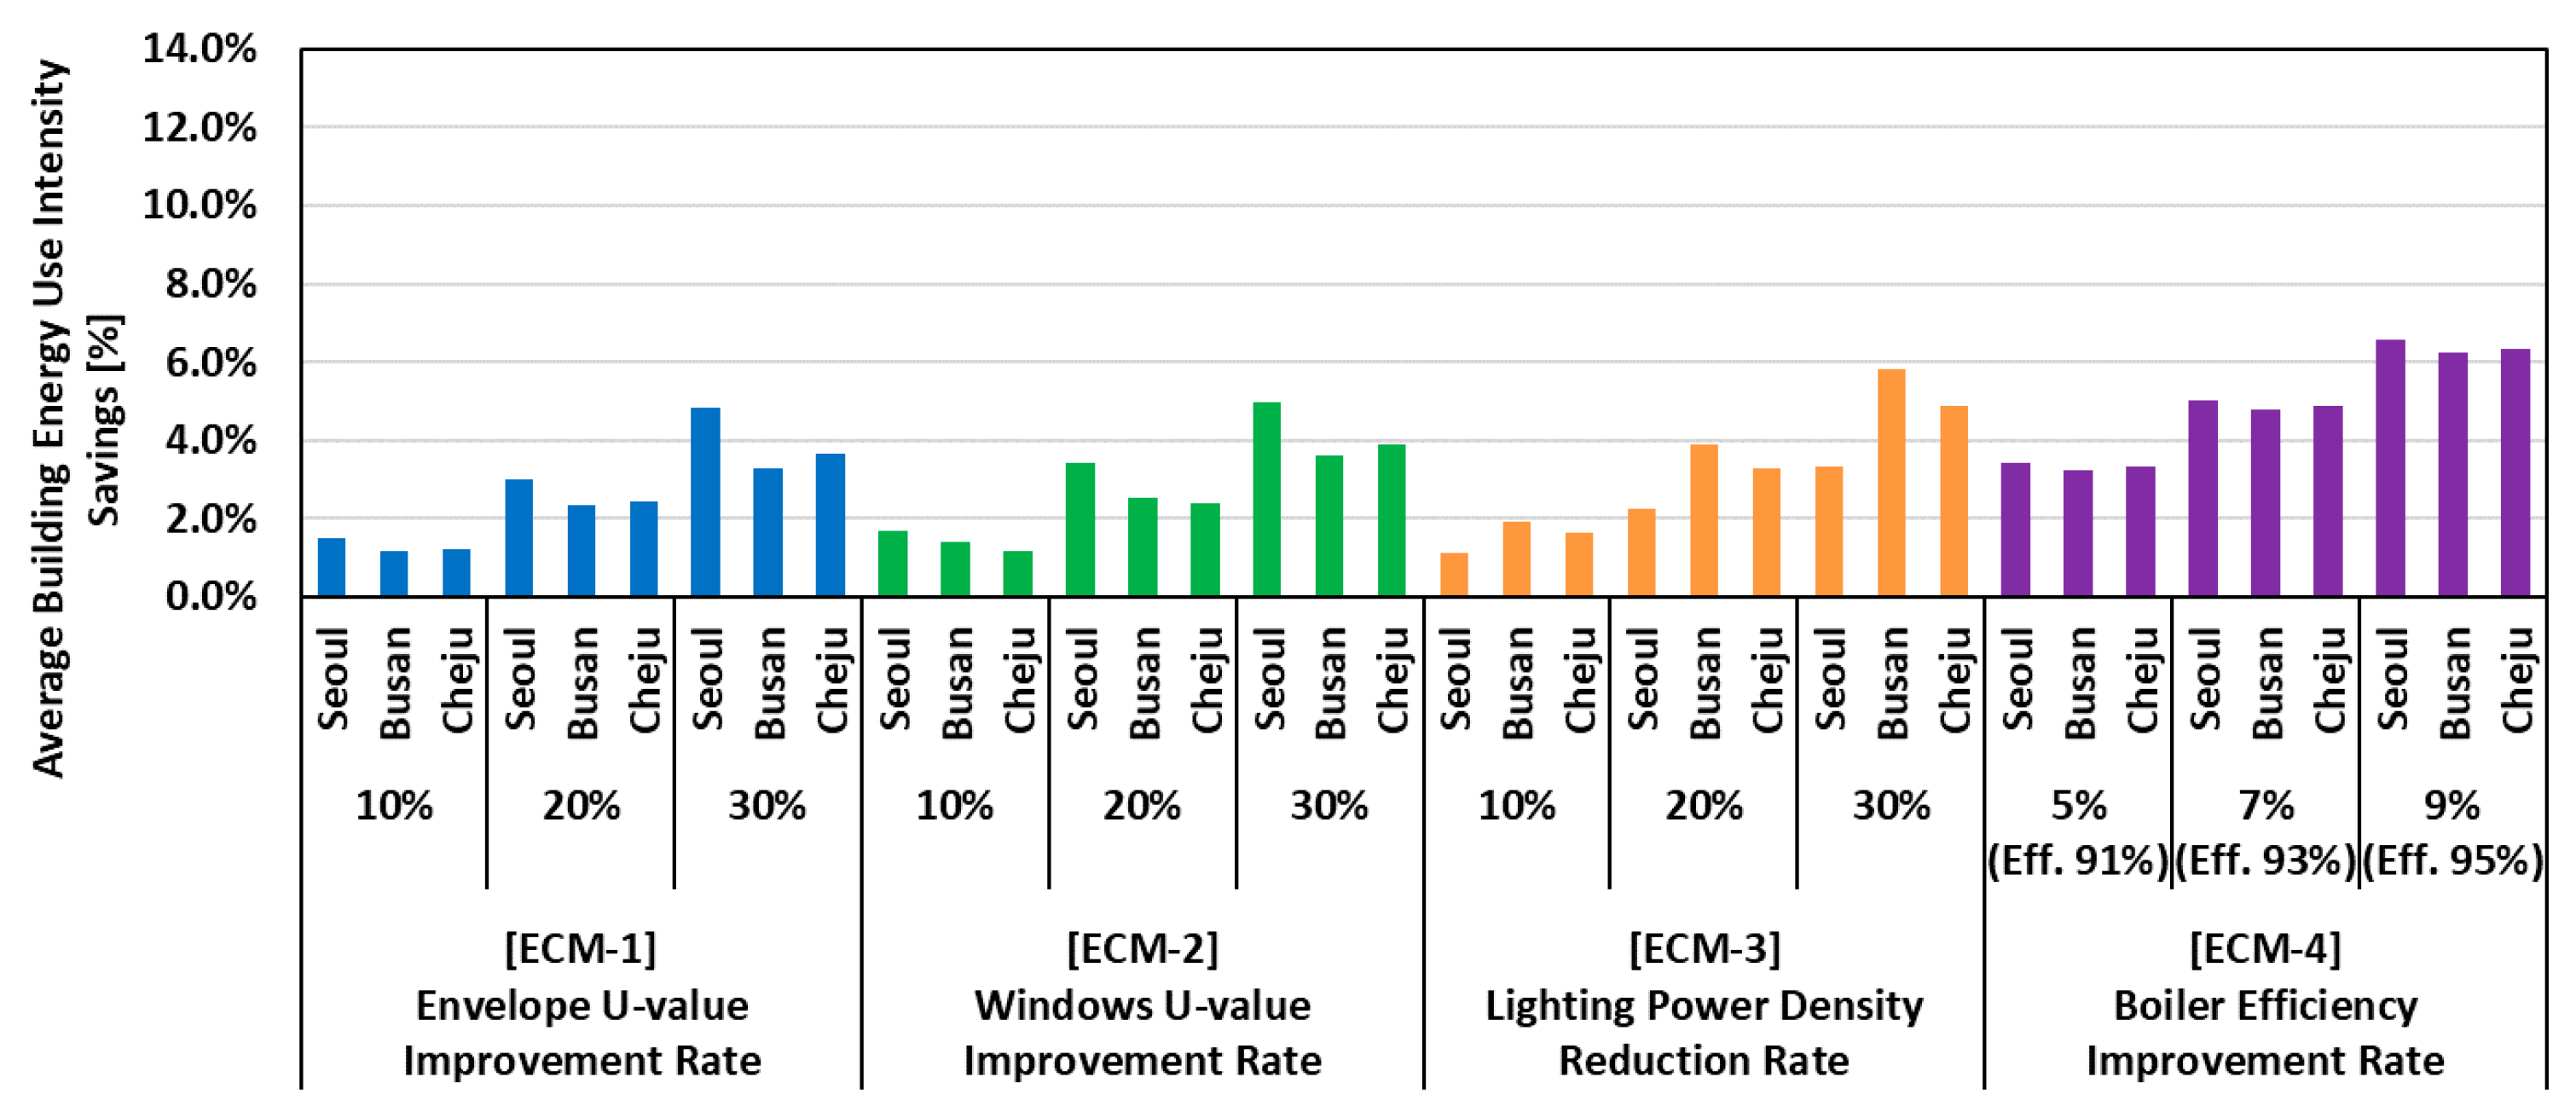
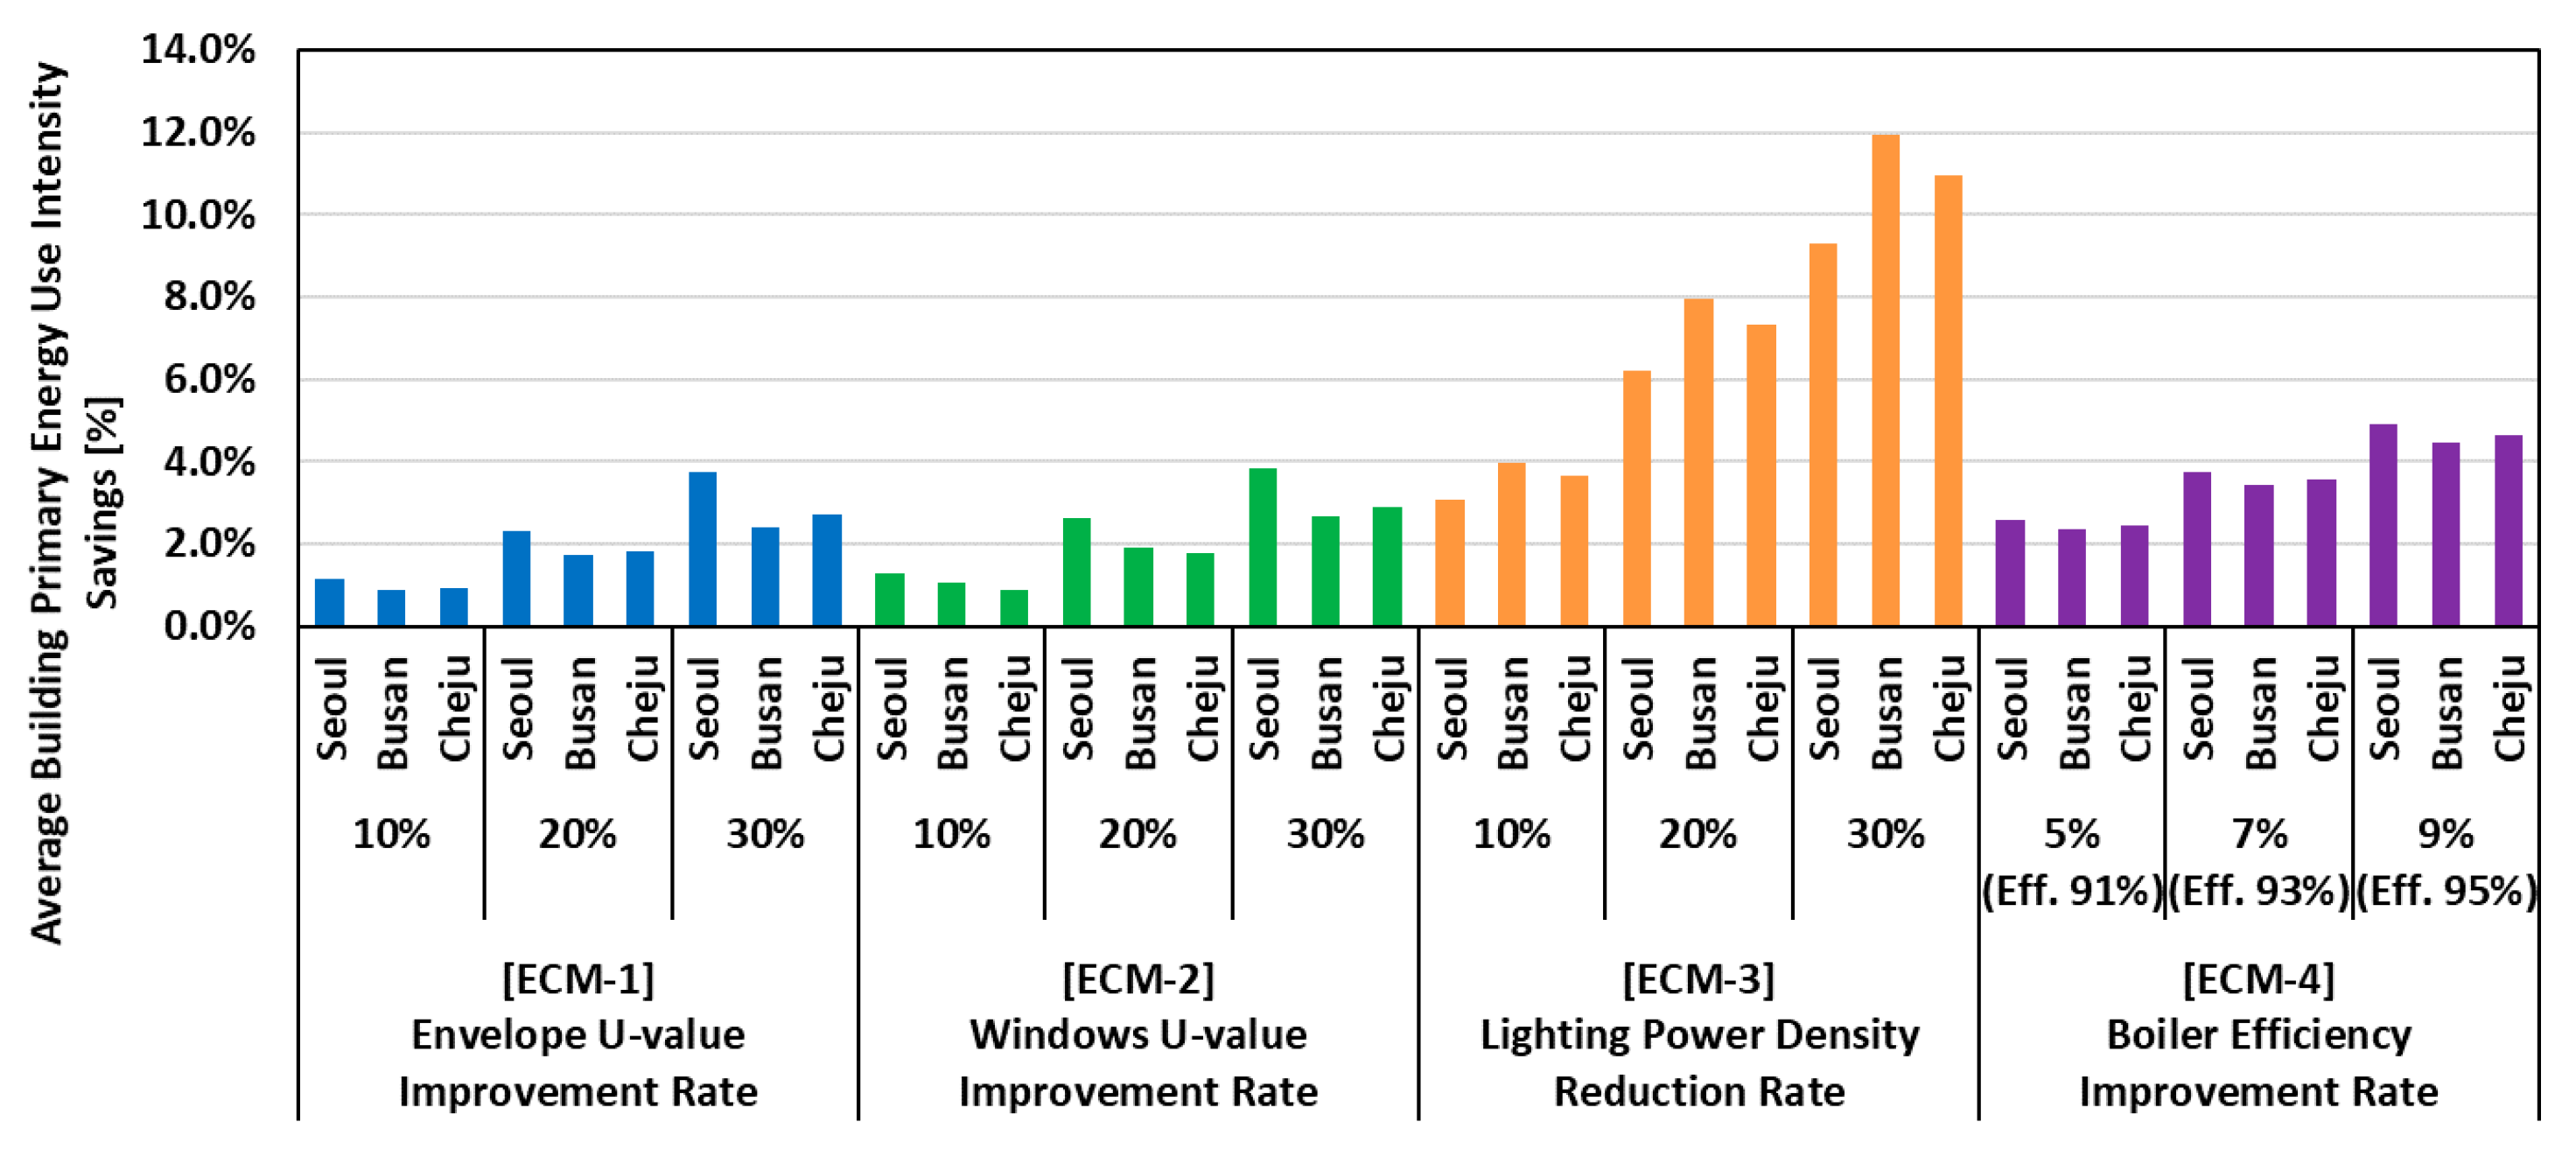
3.6. Potential Building Energy Use Savings

In this study, a series of simulations were carried out to evaluate the potential building energy use savings by individually employing building-energy conservation measures for Korean multifamily residential buildings, as shown in Table 7. The baseline settings are presented in Table 4, which are the building-envelope U-values of BDCES for Period 9 for the three different climate regions. Table 8 shows the percent difference in area-weighted average U-values between the baseline model and the cases of ECM-1 and ECM-2 that have reduced U-values of walls, roofs, and floors, and U-values of windows, respectively. Since ECM-1 and ECM-2 partly modified U-values of building envelope, the percent reductions in the area-weighted average U-value of a whole building envelope were lower than the intended reductions in U-values of ECM-1 and ECM-2.
Figure 14 and Figure 15 show the results of the simulations for various building-energy conservation measures for three different climate regions in South Korea for multifamily residential buildings, and Table 9 provides the detailed results of the simulations. As shown in Figure 14, for all climate regions, the ECM with a boiler efficiency of 95% showed the most potential savings in building energy use intensity compared to the other ECM cases. Because the U-value requirements for building envelopes for Korean residential buildings were already low in 2016, as provided in Table 2, the effects of strengthening building-envelope requirements on the energy consumptions were less than those of improving the boiler and lighting efficiencies.
However, as shown in Figure 15, for the average primary energy intensities of the Korean multifamily residential buildings within the three different climate zones, reducing the light power density by improving the lighting bulb efficiency had the greatest potential savings on the average primary building-energy use intensity in comparison to the other ECM cases. This is due to the conversion factors applied to the calculation of the primary building-energy consumptions based on the electricity and gas consumptions, as shown in Table 10 [44]. Indeed, as shown in Table 9, when improving the building-envelope requirements or the boiler efficiency, the energy used for space heating and/or domestic hot water consuming gas was mostly affected, whereas improving the lighting power density affected the electricity consumption for space lighting. This result implies that, for Korean multifamily residential buildings, reducing the electricity consumption by improving the efficiencies of the electrical equipment and lighting systems will be more efficient than improving the thermal properties of the building envelopes, including the exterior walls, roofs, floors, and windows, reducing not only building-energy use, but also the primary energy use.

4. Summary and Conclusions

The Korean government aimed to reduce carbon dioxide emissions by 32.7% compared to the BAU level by 2030 in the building sector. To achieve this goal, the government is implementing its Zero-Energy Building Roadmap policy. In accordance with this policy, all new multifamily residential buildings of over 30 households must be certified as zero-energy buildings. Currently, the BDCES prescriptive regulations are mandatory for residential buildings, whereas the performance-based BEEC and ZEBC regulations are voluntary. However, under this policy from 2025, these regulations will be mandatory for all new multifamily residential buildings.
Unlike commercial buildings, these regulations for multifamily residential buildings have mainly focused on the thermal performance of the building envelope, and have therefore lowered the U-values of the building envelope to reduce the building heating loads. The ECO2 building energy simulation program, which was officially used for BEEC and ZEBC, was applied to analyze the effects of improving the building envelope requirements on the building energy demands for each of the seven types of LH public multifamily residential buildings. The results of the analysis showed that the building-energy demand intensities decrease linearly as the U-values of the building envelope decrease, owing to a strengthening of the standards based on the period. That is, the energy performances of the simulated multifamily residential buildings improved based on the period according to the strengthening of the building envelope requirements.
However, from the case study analysis, it was found that the effects of improving the building envelope thermal requirements have a limit in reducing the energy demand intensities of the simulated building for all climate regions. According to the analysis, although the area-weighted average U-values of the LH prototype buildings were reduced by up to 100%, the maximum potential energy demand intensity reductions could reach 25%–45% depending on the climate region and household location.
Meanwhile, to improve the building-energy performance of multifamily residential buildings, particularly from 2025 following the zero-energy roadmap, various ECMs should be considered. Thus, this study analyzed the effects of improving the ECMs, including the thermal properties of the building envelope, the lighting power density, and the boiler efficiency. Improvement rates of 10%, 20%, and 30% were applied equally to all ECMs except the boiler efficiency. As a result of the investigation, it was found that, because the prescriptive building envelope requirements of 2016 were already low, the effects of strengthening the building envelope requirements were lower than those of the other building energy conservation measures studied in this paper. In addition, the effects of strengthening the boiler efficiency were found to have the greatest effect on reducing the site energy consumption of a building.
By the way, it is important to consider the primary building-energy use to achieve national energy and greenhouse gas reduction targets. From this perspective, it was found that lowering the lighting power density was most effective compared to increasing boiler efficiency based on the primary energy conversion factors. The results of the analysis show that it is important to not only improve the building-envelope requirements, but also strengthen the efficiencies of the mechanical systems of multifamily residential buildings, that is, the lighting and space heating systems, for future updates of the building-energy policy and regulations.
The Korean government has employed various policies and regulations to reduce its national greenhouse gas emissions. However, to derive optimum designs of multifamily residential buildings in Korea, a more detailed analysis with various combinations of ECMs will be required; however, the results of this study can show a direction for updating the policy and regulations, as well as the potential for implementing ECMs, to improve the energy performance of Korean multifamily residential buildings, which can be expected to help building owners, architects, and engineers develop energy-efficient residential buildings.

Author Contributions

Conceptualization, B.C.K. and J.Y.K.; methodology, B.C.K.; software, B.C.K. and S.H.; validation, B.C.K.; formal analysis, B.C.K.; investigation, B.C.K.; resources, S.H. and B.K.; data curation, B.C.K. and S.H.; writing—original draft preparation, B.C.K.; writing—review and editing, G.T.K. and J.Y.K.; visualization, B.C.K.; supervision, J.Y.K.; project administration, J.Y.K.; funding acquisition, J.Y.K. All authors have read and agreed to the published version of the manuscript.

Funding

This work was supported by the Korea Agency for Infrastructure Technology Advancement [19AUDP-B079104-06].

Acknowledgments

In this section you can acknowledge any support given which is not covered by the author contribution or funding sections. This may include administrative and technical support, or donations in kind (e.g., materials used for experiments).

Conflicts of Interest

The authors declare no conflict of interest.

References

  1. Ministry of Environment of the Republic of Korea. The Revised Plan of the National Roadmap for Greenhouse Gas Reductions by 2030 and the Plan for the National Greenhouse Gas Emission Permit Allocation from 2018 to 2020 are Finalized. Available online: http://eng.me.go.kr (accessed on 11 September 2019).
  2. National Law Information Center of the Korean Government. The Building Design Criteria for Energy Saving. Available online: http://www.law.go.kr/ (accessed on 11 September 2019).
  3. Korea Institute of Civil Engineering and Building Technology (KICT). Green Standard for Energy and Environmental Design (G-SEED). Available online: http://gseed.greentogether.go.kr (accessed on 11 September 2019).
  4. Korea Energy Agency, Building Energy Efficiency Certification. Available online: http://www.energy.or.kr (accessed on 11 September 2019).
  5. Statistics Korea (KOSTAT) of the Korean Government. 2017 Population and Housing Census. Available online: http://kostat.go.kr (accessed on 11 September 2019).
  6. Korea Energy Economics Institute. Yearbook of Energy Statistics; Korea Energy Economics Institute: Ulsan, Korea, 2018. [Google Scholar]
  7. Baek, C.; Park, S. Policy measures to overcome barriers to energy renovation of existing buildings. Renew. Sustain. Energy Rev. 2012, 16, 3939–3947. [Google Scholar]
  8. Tae, S.; Shin, S. Current work and future trends for sustainable buildings in South Korea. Renew. Sustain. Energy Rev. 2009, 13, 1910–1921. [Google Scholar]
  9. Evans, M.; Chon, H.; Shui, B.; Lee, S.-E. Country Report on Building Energy Codes in Republic of Korea; Pacific Northwest National Laboratory of the U.S. Department of Energy: Richland, WA, USA, 2009.
  10. Chandel, S.S.; Sharma, A.; Marwaha, B.M. Review of energy efficiency initiatives and regulations for residential buildings in India. Renew. Sustain. Energy Rev. 2016, 54, 1443–1458. [Google Scholar]
  11. Kwag, B.C.; Adamu, B.M.; Krarti, M. Analysis of high-energy performance residences in Nigeria. Energy Effic. 2018, 12, 681–695. [Google Scholar]
  12. Heravi, G.; Qaemi, M. Energy performance of buildings: The evaluation of design and construction measures concerning building energy efficiency in Iran. Energy Build. 2014, 75, 456–464. [Google Scholar]
  13. Ihm, P.; Krarti, M. Design optimization of energy efficient residential buildings in Tunisia. Build. Environ. 2012, 58, 81–90. [Google Scholar]
  14. Sadineni, S.; France, T.M.; Boehm, R.F. Economic feasibility of energy efficiency measures in residential buildings. Renew. Energy 2011, 36, 2925–2931. [Google Scholar]
  15. Ihm, P.; Park, L.; Krarti, M.; Seo, D. Impact of window selection on the energy performance of residential buildings in South Korea. Energy Policy 2012, 44, 1–9. [Google Scholar]
  16. Yoo, H.C.; Oh, Y.H.; Park, S.K. The optimal window system of office buildings considering energy efficiency. J. Korean Sol. Energy Soc. 2005, 25, 53–60. [Google Scholar]
  17. Han, S.H.; Kim, G.T.; Cho, G.H.; Kim, J.Y. A study on the Analysis of the Energy Saving Potential of Existing Apartment Houses Considering Insulation Performance and Construction Cost. J. Korean Inst. Archit. Sustain. Environ. Build. Syst. 2017, 11, 37–44. [Google Scholar]
  18. Park, D.J.; Yu, K.H.; Yoon, Y.S. Analysis of a Building Energy Efficiency Certification System in Korea. Sustainability 2015, 7, 16086–16107. [Google Scholar]
  19. Ministry of Land. Infrastructure and Transport, Zero Energy Construction, Now from Buildings to Cities! 2019. Available online: http://www.molit.go.kr/english/USR/BORD0201/m_28286 (accessed on 10 April 2020).
  20. Zero Energy Building, Zero Energy Building Certification. Available online: https://zeb.energy.or.kr (accessed on 10 April 2020).
  21. Korea Energy Agency. The Manual of the Building Design Criteria for Energy Saving; Building & Transportation Energy Management Division of Korea Energy Agency: Ulsan, Korea, 2017. [Google Scholar]
  22. Korea Energy Agency. The Operational Regulations of the Building Design Criteria for Energy Saving; Korea Energy Agency: Ulsan, Korea, 2016. [Google Scholar]
  23. The Building Codes Assistance Project. International Code Status: South Korea. Available online: http://bcapcodes.org/ (accessed on 11 September 2019).
  24. Lawrie, L.K.; Drury, B.C. Development of Global Typical Meteorological Years (TMYx). 2019. Available online: http://climate.onebuilding.or (accessed on 10 March 2020).
  25. Bae, C.H.; Kim, S.B.; Park, C.H.; Choo, S.Y. Studies on Effectiveness Proof of Green Building Certification through the Quantitative Analysis of Environmental Performance of Multi-residential Buildings. J. Archit. Inst. Korea Plan. Des. 2016, 32, 145–154. [Google Scholar]
  26. Roh, S.; Tae, S.; Kim, R. Developing a Green Building Index (GBI) Certification System to Effectively Reduce Carbon Emissions in South Korea’s Building Industry. Sustainability 2018, 10, 1872. [Google Scholar]
  27. Lim, H.; Tae, S.; Roh, S. Analysis of the Primary Building Materials in Support of G-SEED Life Cycle Assessment in South Korea. Sustainability 2018, 10, 2820. [Google Scholar]
  28. Oh, T.K.; Lee, D.; Park, M.; Cha, G.; Park, S. Three-Dimensional Visualization Solution to Building-Energy Diagnosis for Energy Feedback. Energies 2018, 11, 1736. [Google Scholar]
  29. Kim, C.S. The Influence of Unit Plan Shapes to the Energy Efficiency of Collective Housing Simulated by ECO2 Software. Korea Inst. Ecol. Archit. Environ. J. (KIEAE J.) 2015, 15, 89–94. [Google Scholar]
  30. Lee, A.R.; Kim, J.G.; Kim, J.H.; Jeong, H.G.; Jang, C.Y.; Song, K.D. Comparing the actual heating energy with calculated energy by the amended standard building energy rating system for apartment buildings. Korea Inst. Ecol. Archit. Environ. J. (KIEAE J.) 2015, 15, 103–107. [Google Scholar]
  31. Kwon, J.H.; Jang, H.I.; Kim, M.K.; Park, H.S.; Suh, S.J. Comparison on the Annual Energy Demand by Building Energy Assessment Tool and Dynamic Energy Simulation. In Proceedings of the 2012 Summer Conference of the Society of Air-Conditioning and Refrigerating Engineers of Korea, Pyeongchang, Korea, 27–29 June 2012; pp. 363–366. [Google Scholar]
  32. Kim, S.H.; Kwak, Y.H.; Kim, C.S. The Analysis on Energy Performance of Collective Housing using ECO2 and DesignBuilder Softwares. Korea Inst. Ecol. Archit. Environ. J. (KIEAE J.) 2018, 18, 47–54. [Google Scholar]
  33. Korea Land & Housing Corporation. Available online: https://www.lh.or.kr/eng/index.do (accessed on 10 March 2020).
  34. K-APT, Energy Use Information. The Korea Appraisal Board. Available online: http://www.k-apt.go.kr/apiinfo/openCost.do? (accessed on 10 March 2020).
  35. NHBC Foundation. The Challenge of Shape and form; Understanding the Benefits of Efficient Design; The NHBC Foundation: Milton Keynes, UK, 2016. [Google Scholar]
  36. Kim, H.G.; Kim, M.Y. Optimal Design Techniques for Energy Performances of Apartment Housing; Seoul Housing & Communities Corporation: Seoul, Korea, 2016. [Google Scholar]
  37. Korea Energy Agency. Design Guideline for Building Energy Saving. Available online: http://building.energy.or.kr/build/CS/CSDMPage.do?page=542 (accessed on 10 March 2020).
  38. Hwang, H.J.; Kim, G.T.; Yoo, J.H.; Lee, J.S.; Lim, H.J.; Chang, G.S. Design Criteria Establishment of Performance in LH Apartments for Government Energy Policy; Korea Land & Housing Institute: Daejeon, Korea, 2016. [Google Scholar]
  39. Bean, R.; Olesen, B.W.; Kim, K.W. History of Radiant Heating & Cooling Systems: Part 1. ASHRAE J. 2010, 52, 40–47. [Google Scholar]
  40. Bean, R.; Olesen, B.W.; Kim, K.W. History of Radiant Heating & Cooling Systems: Part 2. ASHRAE J. 2010, 52, 50–55. [Google Scholar]
  41. Rhee, K.N.; Kim, K.W. A 50 year review of basic and applied research in radiant heating and cooling systems for the built environment. Build. Environ. 2015, 91, 166–190. [Google Scholar]
  42. Olesen, B.W. Control of floor heating and cooling systems. In Proceedings of the Clima 2000/Napoli 2001 World Congress, Napoli, Italy, 15–18 September 2001. [Google Scholar]
  43. New York City Energy Conservation Code. 2016 Energy Conservation Code. Available online: https://www1.nyc.gov (accessed on 30 September 2019).
  44. Korea Energy Agency. The Regulations of Building Energy Efficiency Certification; Korea Energy Agency: Ulsan, Korea, 2016. [Google Scholar]
Figure 1. Stage-by-stage mandatory road map for zero-energy buildings.
Sustainability 12 03566 g001
Figure 2. Schematic description of the Korean building energy policy and regulations.
Sustainability 12 03566 g002
Figure 3. (a) Map of South Korea and (b) climate zones of South Korea.
Sustainability 12 03566 g003
Figure 4. Average outside air temperature and relative humidity data for the three major cities in Korea.
Sustainability 12 03566 g004
Figure 5. Flowchart of the analysis.
Sustainability 12 03566 g005
Figure 6. The standard floor plans of the LH public multifamily residential buildings: (a) 26 m2, (b) 39 m2, (c) 49 m2, and (d) 59 m2 through 84 m2 units.
Sustainability 12 03566 g006
Figure 7. Heat loss form factors (HLFF) and surface-to-volume ratios (SVR) of the prototype residential units.
Sustainability 12 03566 g007
Figure 8. The predicted energy demand intensity for the selected prototype multifamily residential buildings in (a) Seoul, (b) Busan, and (c) Cheju Island.
Sustainability 12 03566 g008aSustainability 12 03566 g008b
Figure 9. Average predicted energy demand intensities derived from various floor sizes for three different regions and for different periods.
Sustainability 12 03566 g009
Figure 10. The schematic image of the simulated building, and of the household locations.
Sustainability 12 03566 g010
Figure 11. Correlation between area-weighted average U-values and building energy demand intensity for Seoul. (a) Top-Middle; (b) Top-Side; (c) Middle-Middle; (d) Middle-Side; (e) Bottom-Middle; (f) Bottom-Side.
Sustainability 12 03566 g011aSustainability 12 03566 g011b
Figure 12. Correlation between area-weighted average U-values and building energy demand intensity for Busan. (a) Top-Middle; (b) Top-Side; (c) Middle-Middle; (d) Middle-Side; (e) Bottom-Middle; (f) Bottom-Side.
Sustainability 12 03566 g012
Figure 13. Correlation between area-weighted average U-values and building energy demand intensity for Cheju Island. (a) Top-Middle; (b) Top-Side; (c) Middle-Middle; (d) Middle-Side; (e) Bottom-Middle; (f) Bottom-Side.
Sustainability 12 03566 g013
Figure 14. Percent savings in average energy use intensity for various energy conservation measures for multifamily residential buildings for three different climate zones.
Sustainability 12 03566 g014
Figure 15. Percent savings in average primary energy use intensity for various energy conservation measures for multifamily residential buildings within the three different climate zones.
Sustainability 12 03566 g015
Table 1. Descriptions of BEEC and ZEBC.
Building Energy Efficiency CertificationZero Energy Building Certification
LevelPrimary Energy Use Intensity
(kWh/m2∙year)
LevelBuilding Energy Independence Rate (%)
1+++Less than 601More than 100%
1++60–90280–100%
1+90–120360–80%
1120–150440–60%
2150–190520–40%
3190–230
4230–270
5270–320
6320–370
7370–420
Table 2. History of building envelope requirements in South Korea.
TimeClimate ZoneThermal Conductivity (U-value) [W/m2·K]
Exterior WallRoofFloorWindow
DirectIndirectDirectIndirectDirectIndirectDirectIndirect
Period
1
May 1979–December 1980All1.05-1.05-1.05-2.56-
Period
2
January 1981–December 1984All0.58-0.58-1.16-3.49-
Period
3
January 1985–July 1987Inland0.58-0.58-0.58-3.49-
Cheju Island1.16-1.16-1.16-3.49-
Period
4
August 1987–January 2001Central0.58-0.41-0.58-3.37-
Southern0.76-0.52-0.76-3.60-
Cheju Island1.16-0.76-1.16-5.81-
Period
5
February 2001–July 2008Central0.470.640.290.410.350.413.845.47
Southern0.580.810.350.520.410.474.196.05
Cheju Island0.761.100.410.580.470.585.237.56
Period
6
August 2008–November 2010Central0.470.640.290.410.350.523.004.30
Southern0.580.810.350.520.410.583.304.70
Cheju Island0.761.100.410.580.470.644.206.00
Period
7
December 2010–September 2013Central0.360.490.200.290.300.432.102.80
Southern0.450.630.240.340.350.502.403.10
Cheju Island0.580.850.290.410.350.503.103.70
Period
8
October 2013–January 2016Central0.270.370.180.260.230.351.502.20
Southern0.340.480.220.310.280.401.802.50
Cheju Island0.440.640.280.400.330.472.603.30
Period
9
February 2016–PresentCentral0.210.300.150.220.180.261.201.60
Southern0.260.370.180.260.220.311.401.80
Cheju Island0.360.520.250.350.290.412.002.50
Table 3. Comparison analysis between actual building energy data and simulation data.
CategorySeoulBusan
Built Year20172016
Energy DataSpace HeatingSpace Heating
Unit Floor Area59 m2 (324 units)
74 m2 (160 units)
84 m2 (325 units)
33 m2 (174 units)
39 m2 (88 units)
46 m2 (190 units)
Actual Data77.1 kWh/m2/year46.1 kWh/m2/year
Simulation Data70.2 kWh/m2/year48.8 kWh/m2/year
Percent Difference9.8%5.5%
Table 4. Assumptions for the building energy simulations.
CategorySetting
Number of Residential Units9-unit (3 units per floor)
Number of Floors3-story
Building OrientationSouth
Floor-to-Ceiling Height2.3 m
Infiltration RateAir Change per Hour = 6 at 50Pa
Heating Set-point26.0 °C
Heating System TypeRadiant Heating Floor
Heating SourceCondensing Gas Hot-Water Boiler (Efficiency 87%)
Lighting Power Density13.0 W/m2
Solar Heat Gain CoefficientSHGC = 0.6
Table 5. Descriptions of the options for the case study.
CaseCase 1Case 2Case 3Case 4
% Reduction in Area-Weighted Average U-value [W/m2]10%30%50%100%
Table 6. Case studies for potential energy demand intensity (EDI) reduction.
Region HouseholdBaselineCalculated EDI
(kWh/m2∙year)
Potential EDI Reduction
(%)
Uw.avg.
[W/m2]
EDI
[kWh/m2∙year]
Case1Case2Case3Case4Case1Case2Case3Case4
SeoulTop-Middle0.33 77.38 73.5168.6963.8851.855%11%17%33%
Middle-Middle0.56 67.09 64.5661.3258.0849.984%9%13%25%
Bottom-Middle0.34 78.71 73.8568.5263.1849.836%13%20%37%
Top-Side0.31 82.19 79.0773.7368.4055.064%10%17%33%
Middle-Side0.45 71.42 70.8867.3163.7454.821%6%11%23%
Bottom-Side0.32 83.55 79.8073.9668.1353.554%11%18%36%
BusanTop-Middle0.37 62.52 56.9853.1549.3239.769%15%21%36%
Middle-Middle0.63 57.76 54.0751.7349.3943.556%10%14%25%
Bottom-Middle0.40 63.24 55.9151.4847.0535.9812%19%26%43%
Top-Side0.35 65.07 59.2354.8250.4239.419%16%23%39%
Middle-Side0.51 59.72 56.4353.6550.8743.926%10%15%26%
Bottom-Side0.37 65.83 58.4353.4448.4435.9611%19%26%45%
Cheju IslandTop-Middle0.50 63.18 60.2156.4452.6643.235%11%17%32%
Middle-Middle0.83 58.36 55.9953.5751.1545.094%8%12%23%
Bottom-Middle0.52 63.82 60.1255.9451.7741.346%12%19%35%
Top-Side0.47 65.63 63.0158.7854.5543.984%10%17%33%
Middle-Side0.68 60.35 58.1955.3252.4645.294%8%13%25%
Bottom-Side0.49 66.30 63.1658.5553.9442.405%12%19%36%
Table 7. The descriptions of energy conservation measures.
Energy Conservation MeasureBaselineOptions
ECM-1U-values of Walls, Roofs, Floors
(W/m2·K)
Requirements
in 2016
10% Reduced20% Reduced30% Reduced
ECM-2U-values of Windows
(W/m2·K)
Requirements
in 2016
10% Reduced20% Reduced30% Reduced
ECM-3Lighting Power Density (LPD)
(W/m2)
13 W/m210% Reduced
(11.7 W/m2)
20% Reduced
(10.4 W/m2)
30% Reduced
(9.1 W/m2)
ECM-4Boiler Efficiency
(%)
Eff. 87%5% Improved
(Eff. 91%)
7% Improved
(Eff. 93%)
9% Improved
(Eff. 95%)
Table 8. The percent difference in area-weighted average U-values of whole building envelope from those of the baseline models.
Climate ZonesArea-Weighted Average U-Value Reduction
% Reduction in U-Value
of Exterior Walls, Roofs, Floors
% Reduction in U-Value
of Windows
10%20%30%10%20%30%
Seoul5.0%10.1%15.1%5.0%9.9%14.9%
Busan5.4%10.7%16.1%4.6%9.3%13.9%
Cheju Island5.6%11.2%16.7%4.4%8.8%13.3%
Table 9. Details of the average building energy use intensities of ECMs for multifamily residential buildings.
ECM OptionSeoul [kWh/m2∙year]Busan [kWh/m2∙year]Cheju Island [kWh/m2∙year]
Space
Heating
Hot WaterInterior LightingSumSpace HeatingHot WaterInterior LightingSumSpace HeatingHot WaterInterior LightingSum
Baseline70.244.429.7144.348.844.429.7122.957.344.429.7131.4
ECM110% reduced68.244.429.7142.347.544.429.7121.655.844.429.7129.9
20% reduced66.344.429.7140.446.144.429.7120.254.344.429.7128.4
30% reduced64.144.429.7138.245.144.429.7119.252.844.429.7126.9
ECM210% reduced67.944.429.7142.047.244.429.7121.355.744.429.7129.8
20% reduced65.644.429.7139.745.444.429.7119.554.144.429.7128.2
30% reduced63.544.429.7137.644.244.429.7118.351.744.429.7125.8
ECM310% reduced71.944.426.7143.049.344.426.7120.458.144.426.7129.2
20% reduced73.344.423.7141.449.944.423.711858.944.423.7127.0
30% reduced74.844.420.8140.050.544.420.8115.759.744.420.8124.9
50% reduced78.144.414.8137.352.344.414.8111.561.444.414.8120.6
ECM4Eff. 91%67.342.529.7139.546.742.529.7118.954.942.529.7127.1
Eff. 93%65.941.629.7137.245.841.629.7117.153.841.629.7125.1
Eff. 95%64.540.729.7134.944.940.729.7115.352.740.729.7123.1
Table 10. Primary energy conversion factors used by the ECO2 building energy simulation tool.
FuelConversion Factor
Electricity2.75
Gas1.1

