Article

Dealing with Water Scarcity and Salinity: Adoption of Water Efficient Technologies and Management Practices by California Avocado Growers

1
Department of Environmental Sciences, University of California, Riverside, CA 92521, USA
2
School of Public Policy, University of California, Riverside, CA 92521, USA
*
Author to whom correspondence should be addressed.
Sustainability 2020, 12(9), 3555; https://doi.org/10.3390/su12093555
Submission received: 18 March 2020 / Revised: 17 April 2020 / Accepted: 20 April 2020 / Published: 27 April 2020
(This article belongs to the Special Issue Economic Impact of Water and Soil Salinity)

Abstract

:
The irrigated agriculture sector has been facing an increased scarcity of good quality water worldwide. Consequently, the sustainability of water intensive crops, such as avocado, is threatened when water becomes scarce and expensive, or when growers must use saline water supplies that reduce crop yields. A variety of irrigation technologies and water management practices are now recommended to help growers through times of limited water supplies and elevated salinity levels. To examine how growers adopt different practices and combinations of practices, we collected data from a sample of avocado growers in California. We used Kohonen self-organizing maps, and developed logit models to identify the most common bundles of technologies and management practices that growers are using to deal with water scarcity. We test the validity of the proposed bundles and factors affecting their adoption, using primary data obtained from a survey of California avocado growers at the height of the drought during 2012–2013. Results show that farm location, share of income from agricultural production, use of cooperative extension advice, and farmer characteristics, such as age and education, all play important roles in grower adoption of individual and bundled methods to adapt to water scarcity.

1. Introduction

Availability of good quality water for irrigated agriculture is significantly affected by climate change and increased urban and agricultural demands on fresh water supplies [1]. Extended periods of drought further exacerbate the already dwindling stocks and flows of existing ground and surface water [2]. Farmers may respond to lower water availability and reduced quality (e.g., higher salinity) by introducing various water conservation technologies and management practices with short- and long-term implications [3]. As water becomes increasingly scarce, farmers may alter their irrigation scheduling by using various soil water monitoring and irrigation scheduling programs that are available in the market, or they may fallow part of their land and adjust the irrigation area to the available water that they have been allocated. In the case of perennial orchards, such as avocado, long-term considerations involving removal of trees or replanting more drought tolerant crops, such as lemon, come into play. Growers may also prune the trees to reduce the canopy size and water requirement, or “stump” the trees to completely remove the canopy and hold production for one or more years until they can again receive regular quantities of irrigation water. During drought, farmers also intensify their consultation with experts, including agricultural extension agents and farm advisors. Lastly, farmers may invest in changes to their irrigation technologies by installing soil water monitoring equipment, or constructing new wells and pipelines for use of alternative water sources, such as treated wastewater [4]. All of these responses can be undertaken by growers either separately or jointly, as bundles of responses. Bundling, or combining technologies, takes place when growers use several technologies and management practices that support each other instead of adopting one technology or management practice independently. Adoption of bundles may provide growers more flexibility than adoption of individual technologies or management practices [5].
The existing literature has dealt with factors that affect decision making and adoption of agricultural technologies in many countries and under many different physical and institutional settings. While many factors have been studied individually [6,7,8,9,10,11], (and the literature they cite), relatively few studies have examined the extent to which different grower operations may “bundle” water efficient technologies and management practices [5,12,13]. Wang et al. [12] examined the strategy of using different cropping patterns (crop bundles) with different water requirements by Chinese farmers, and found that, depending on the region, certain crop bundles provide farmers flexibility in dealing with climate change impacts on water scarcity. Fleischer et al. [5] found that Israeli growers bundle their crop mix, and irrigation and crop cover technologies, in response to changes in long-term availability of water. Such flexibility in response may be needed for agricultural growers facing limiting climatic conditions, such as those faced by California avocado Hass growers located along the state coast and inland regions, from north to south, where significant differences in rainfall and temperature occur. Bundling water technologies and management practices in order to adapt to change in climate and water scarcity provide resiliency and results in higher profits, as was observed in [5,12].
So far, there are several gaps in research on agricultural technology adoption. Most studies such as [7,8,10,14] identify a single type of technology and determine its adoption likelihood and pattern by growers. Two examples are irrigation methods and precision agricultural technologies. But irrigation technologies themselves may not be sufficient for increasing water efficiency. Irrigation technology, such as drip irrigation and micro sprinklers, are typically treated as a separate decision from fertilization and precision agricultural technologies [8,9,10]. Scientific evidence [15] suggests that bundling drip or micro-sprinkler irrigation with fertilization (fertigation) leads to much more effective results.
Other aspects not considered in existing adoption studies include the use of water efficient technologies and management practices that can help growers guide irrigation practices. Soil moisture monitoring technologies have been shown to significantly increase the water use efficiency of avocado trees by improving irrigation uniformity and reducing overwatering while still applying sufficient water to manage soil salinity [16]. Growers also use irrigation calculators, deficit irrigation, and water shortage mitigation practices to save on-farm water use. These handful strategies, altogether known as ‘sustainable irrigation management practices’ or ‘irrigation best management practices’, include technologies and practices that are resource conserving and are presented as a variety of options available to growers [17,18].
We focus in this work on avocado Hass growers in California. Based on [19], avocado, mainly the Hass variety (99.4%), is grown in California on nearly 50,000 bearing acres (as of 2017) by nearly 5000 growers. Avocado is a water intensive crop that is especially sensitive to root rot, overwatering, and soil salinity. With a typical water consumption of 4 acre-feet (AF)/acre per year, the price of irrigation water largely determines profitability. In areas where avocados are grown in California, the price for water charged by water utilities typically ranges between $1200–1300 per AF [20]. During dry years, avocado growers in Southern California have to consider the costs and benefits of adopting new technologies or the suitability of different water supplies. During the 2010–2016 drought, many growers took the most drastic responses, including use of expensive desalinated groundwater by installing mobile treatment units to increase supply, and/or by stumping of entire orchards to temporarily reduce water demand.
Currently, there is no published work on avocado production and the determinants of adoption with respect to water efficient technologies and management practices in response to decreasing water supplies and qualities. What makes some growers adopt advanced water efficient technologies and management practices while other growers do not is an important policy question. The present study covers aspects of adoption that have not been addressed in previous research on adoption of water efficient technologies and management practices. The paper specifically aims to identify water technologies and management practices that are available to avocado growers in California for conservation of water; how those choices are bundled and how selected socioeconomic and farm characteristics contribute to adoption.
We start with our methodology, followed by the analytical model used along with the empirical approach. Then we describe the data collection process, and the bundle determination methodology. We then present results from the empirical models that were estimated. We finalize with a discussion of the results, and conclusions and policy implications of the findings. The paper includes auxiliary appendixes. We review water efficient technologies and management practices used by California avocado growers in Appendix A. The questionnaire used for data collection is presented in Appendix B.

2. Methodology

Based on existing research, we developed an analytical framework with expected effects of the key variables that can explain adoption of water conserving technologies and management practices. Once the basis for our framework was established, we move in two directions: First, we construct an analytical model, based on the framework, which will be used in the statistical estimates for examining our hypotheses on criteria that affect adoption of selected technologies and management practices alone, or when combined in bundles. Second, we developed and administered a questionnaire to collect primary data from a survey of avocado growers. Finally, we specify functional forms to be estimated in order to verify the hypotheses.

2.1. Analytical Framework

The analytical framework includes several factors that have been used in the literature to explain the extent of adoption of agricultural technologies in the context of irrigation water use. Based on the literature, economic factors such as cost of water, farmer characteristics (education, experience, and age); (As opposed to the a-priori belief, age and experience are not necessarily correlated. For example, a USDA-ERS study [21] found that 35 percent of beginning (unexperienced) farmers are over age 55, and nearly 13 percent are 65 or older. We found that among the avocado growers in our study in California, the correlation between years of age and years of experience is 0.323 and not significant.) farm characteristics such as farm location, soil properties, and landscape, farm size, share of farm income from agriculture, and farm management structure; and informational factors such as sources of know-how, all contribute to adoption of irrigation technologies. A detailed description is provided below for selected variables, and a summary of these variables and their associated expected effects on adoption of water technology and management practices is provided in Table 1.
Socio-economic Factors: Farmer Characteristics. Previous studies on adoption of technologies indicate that farmer characteristics are a critical factor in identifying adopters. Koundouri et al. [10] found that under production uncertainty in Crete (Greece), younger, more educated farmers were primary adopters of water efficient irrigation technologies. In studies estimating single technology and bundled technology adoption, education has been a common determinant for predicting adoption, where the higher the level of education, the greater is the extent of adoption [5,12,24,28].
Use of bundles doesn’t necessarily mean more complexity. In many cases, bundles actually imply simplicity and improved precision of the agronomic process. The case of combining irrigation and fertilization (fertigation) is an example for simplification and improvement of the precision in the combined process compared to the irrigation and fertilization when done separately. Education could be more or less important depending on the particular bundle type. For example, [5] (Table 2) and [12] (Table 1) find that education is not significant in explaining selection of certain bundles.
When compared to less educated farmers in precision fertilizer technologies, higher farmer education level also resulted in faster adoption by growers [9]. Genius et al. [22] found that the combination of age and education had an effect on adoption, where younger educated growers adopted drip technology. Grower’s age and formal education is considered in our paper as well (we do not measure speed of adoption in this paper).
Experience is an important factor in adapting to climate change. In a study that considered choice of crop and bundled technologies, growers who had more farming experience choose to grow a crop mix that includes an orchard crop, which is considered more profitable than row crops [5]. Hence, we can propose that years of experience may influence adoption in our context as well.
Agro-ecological Factors: Farm Characteristics. Regions with high aridity along with a sandy soil can be associated with increase of water inputs and consequently rise in crop production risks, especially in the event of drought [10]. Many studies have shown that local weather is an important factor in adoption, where farms with higher evapotranspiration (ETo) rates and high aridity indices adopt water efficient technologies [6,7,10].
Several studies have determined that farm size is important when considering technology adoption. Farm size can greatly influence adoption, as larger farms may have access to higher equity and monetary resources to invest in water efficient equipment [10,12,28].
Complexity in operating the irrigation system may be an important impediment to adoption. Soil water content and its availability to trees differs for different soils based on their texture (% sand, silt, and clay content) and organic matter content. These physical properties vary across the landscape with respect to soil parent material, slope, depth, and elevation [29,30]. For example, a soil type of a plot located on hill slopes may have different physical properties than a soil type of a plot located on level ground. This sub-field variability in soil properties, shape of the irrigation plot, and topography add to an orchard’s irrigation complexity, which represents the level of difficulty a farmer experiences in setting up and maintaining an irrigation system and delivering water with good irrigation uniformity. We propose that the higher the irrigation complexity a grower faces, the harder it is for the grower to manage water resources and make decisions about water management, and thus it will reduce the likelihood of adopting new technologies and practices.
Informational Factors. Recently, Genius et al. [22] investigated the role of information transmission in promoting agricultural adoption and diffusion through extension services and social learning with olive growers in Greece. They found that farmers are primarily informed about technologies by their interactions with agricultural extension services and other farmers. Chatterjee et al. [31] quantified the contribution of the University of California Cooperative Extension to water conservation in California and the interaction between extension and the age of the growers. Tiamiyu et al. [23] developed the notion of a technology score to measure technology advancement, and found that a farmer’s technology score was affected significantly by number of extension visits, in addition to years of formal education, farming experience, and land ownership status, when they examined adoption of technologies among rice farmers in Nigeria. Informational factors include both where growers seek information to manage their orchards and what topics are sought [14,22]. Not only where growers seek information is important, but the extent of use of that venue of information [22]; more adoption will occur among growers who see information collected from these sources as being useful [14]. In addition to extension, growers obtain information and knowhow from commercial providers, professional associations, neighbors, and others.

2.2. Analytical Model

Avocado growers can respond to water shortages and climate change in several ways. Assuming profit-maximizing behavior, and given that water is one of the highest cost components in avocado production in California, growers will choose as many technologies and management practices that will decrease water consumption while keeping a high profit. Therefore, we estimate a model that explains the selection of a technology and management practices (or a bundle of technologies and management practices) such that the profit of the grower is maximized, subject to the conditions the grower faces.
Based on the work reviewed in the previous section, we introduce two models to capture the behavioral relationship of choosing a bundle of irrigation technologies and water management practices in avocado production. First, we estimate a model where we look at adoption of either irrigation technology and/or management practices in a binary-choice framework as affected by a set of variables such as farm characteristics, farmer characteristics, informational variables, and fixed effects variables. (Fixed effect picks up any variation in the dependent variable that happen over time (for time/year fixed effects, for example) or over space/location (for country or city fixed effects, for example) and that is not attributed to the other explanatory variables. Fixed effects are estimated usually by introducing dummy variables that represent each year or each location (in the examples we used).) Second, we estimate a model of selection of bundles of technology and management practices also explained by the same set of independent variables as in the first model.
The fixed effects in our models include the county fixed effect, which captures characteristics that are associated with the county and have not been captured by the other variables. We use a cross section data to explain what affects at a given time period—the midst of the California drought—avocado growers’ choice of any single technology or management practice, or bundles of technologies and management practices in order to save water and maximize profits.
The profit function (we show only the multinomial bundle model because the logit and multinomial model are similar in notation), adapted from [5], for choosing a bundle is: (A logit model estimates the probability of dichotomous range for the dependent variable, such as yes/no, pass/fail, measured as 1/0 as a function of a set of explanatory variables. A multinomial logit model estimates the probabilities of more than two possible outcomes of a categorically distributed dependent variable, given a set of independent variables.)
Y j = f j   ( r , m , k ) + ε j ,     j = 1 , 2 , , J
where J is the total number of technologies and management bundles to control water use. Y j is a dichotomous function (0–1) indicating whether or not bundle j is selected. Y j is a function of a vector of farmer characteristics, r, a vector of farm characteristic, m, (including climatic effects embedded in location), and a vector of informational factors, k. A farmer will choose a bundle j if and only if Y j > Y i     j i , thus we can say that the probability of a farmer choosing bundle j is:
P j = Pr ( Y j > Y i )       j i
A critical assumption of the multinomial logit procedure is that the relative probability of any two alternative bundles is not affected by adding a third bundle.
Assuming that ϵ is independently Gumbel distributed and the profit function can be written linearly in its parameters, as Y j = α + β r j + γ m j + δ k j , where α ,   β ,   γ ,   a n d   δ   are the estimated coefficients, than the probability, P j , is calculated as follows:
P j = e α + β r j + γ m j + δ k j i = 1 J e α + β r i + γ m i + δ k i
where P j is the probability that a given bundle, comprising of technologies and management practices, will be selected.
The analytical framework will be tested using two model sets. The first model set is a logit model where a grower’s adoption of any technology or management practice with regards to water management in their orchard is analyzed as a binary decision. We developed two logit versions using two different sets of explanatory variables in each. We followed the methodology in [32], who referred to “modern irrigation technologies” that include any of the following: Solid-set sprinklers, micro-sprinklers, and drip. In our case, the set of irrigation technologies relevant for avocado is different than what was referred to in past work as “modern irrigation technologies”, and some technologies or management practices used at present in avocado production may need higher skills (such as more experience, higher education, more support from extension, and higher financial resources for purchasing and for operation of the technology) than others. By referring to “any technology or management practice” with assumed equal sophistication, we may have ended up with an over-estimation of some of the coefficients, such as of education and experience, which could limit the generalization of our results.
The second model set we use is a multinomial logit model that combines eight water efficient technologies and managements practices into bundles of likely technologies used in combination with management practices by the growers. Each grower in the analysis was assigned to a bundle based on their use of the technologies and management practices. Four bundles (0, 1, 2, 3) were used in a logit regression with base-users (zero bundle) being the benchmark to which all other coefficients are compared. The technology and management practices composition of the 0 Bundle of the base-users is explained in the next section.

3. Data and Variable Construction

Farmer and farm information is primary data that we obtained directly from avocado growers. Data was collected using a survey instrument comprised of 71 questions that was administered during 2012–2013 (See Appendix B). The survey was distributed to California avocado growers with the help of the California Avocado Commission (CAC), (CAC organizes all Avocado growers in California for advocacy, promotion, and knowledge creation. All producing acres are levied a tax per unit of yield to allow the operation of CAC.) using its database of growers. Surveys were distributed by email, mail, and in face-to-face interactions during growers’ meetings. All avocado growers were approached by mail and email. Responses were received from 128 growers. Five responses were not used due to data quality issues. Of the remaining 123 responses, 94, 17, and 12 were obtained by email, mail, and direct interviews in grower meetings, respectively.
The 123 observations represent a total of 3899 acres (1 acre = 0.4 hectares) of avocado orchards, nearly 7 percent of the avocado farmland in California. The total response accounts for nearly 2 percent of the number of avocado growers in California (distribution by county can be found in Table 2). Location of growers that responded in each county is presented in Figure 1.
One could argue that the dataset exhibits selection bias because it could be claimed that large growers may be more likely to volunteer their time in answering the survey questions. However, selection bias has been ruled out because the distribution of avocado farm size in the sample follows a similar distribution pattern as in actual avocado farms within each county where avocados are grown in California (Table 2).
Growers in our sample use different technologies to maintain or increase profits and address risk management due to water availability fluctuations. We identified [34] methods of water efficient technologies and management practices, and have used them as a starting point for categorizing the bundles.
The water efficient technologies and management practices reported by the growers are listed below:
Soil moisture measuring devices: (Allowing growers to monitor and maintain adequate soil moisture in real time, determine when irrigation is needed, and when sufficient water has been applied): (1) Soil auger, (2) tensiometer, (3) gypsum block, (4) dielectric sensors, (5) capacitance/dielectric sensors, (6) neutron probe, (7) gravimetric.
Irrigation calculators: (Designed to help growers determine site specific crop water requirements based on weather data and crop coefficients): (1) CIMIS—California Irrigation Management Information System that uses transpiration rates to determine crop specific water needs on a daily basis.
Water efficient techniques: (1) Pruning (2) stumping, (3) removing trees, (4) turning off water to trees to reduce on-farm water use, (5) any tree management to reduce water use.
Water management techniques: (1) Improving distribution uniformity with the use of water audits, (2) testing irrigation water for salinity management, (3) test soil moisture with sensors, (4) measure soil salinity, (5) irrigating by calendar (instead of using monitoring equipment or CIMIS).
Irrigation technologies: (1) Pressure compensating sprinklers, (2) micro-sprinklers, (3) drip irrigation.
Miscellaneous techniques: (1) Choose district water over groundwater, when possible, (2) use “By Feel” method to decide when to irrigate. The “By Feel” method is a simple way to assess the level of moisture in the soil using hand feel.

3.1. Setting the Bundles

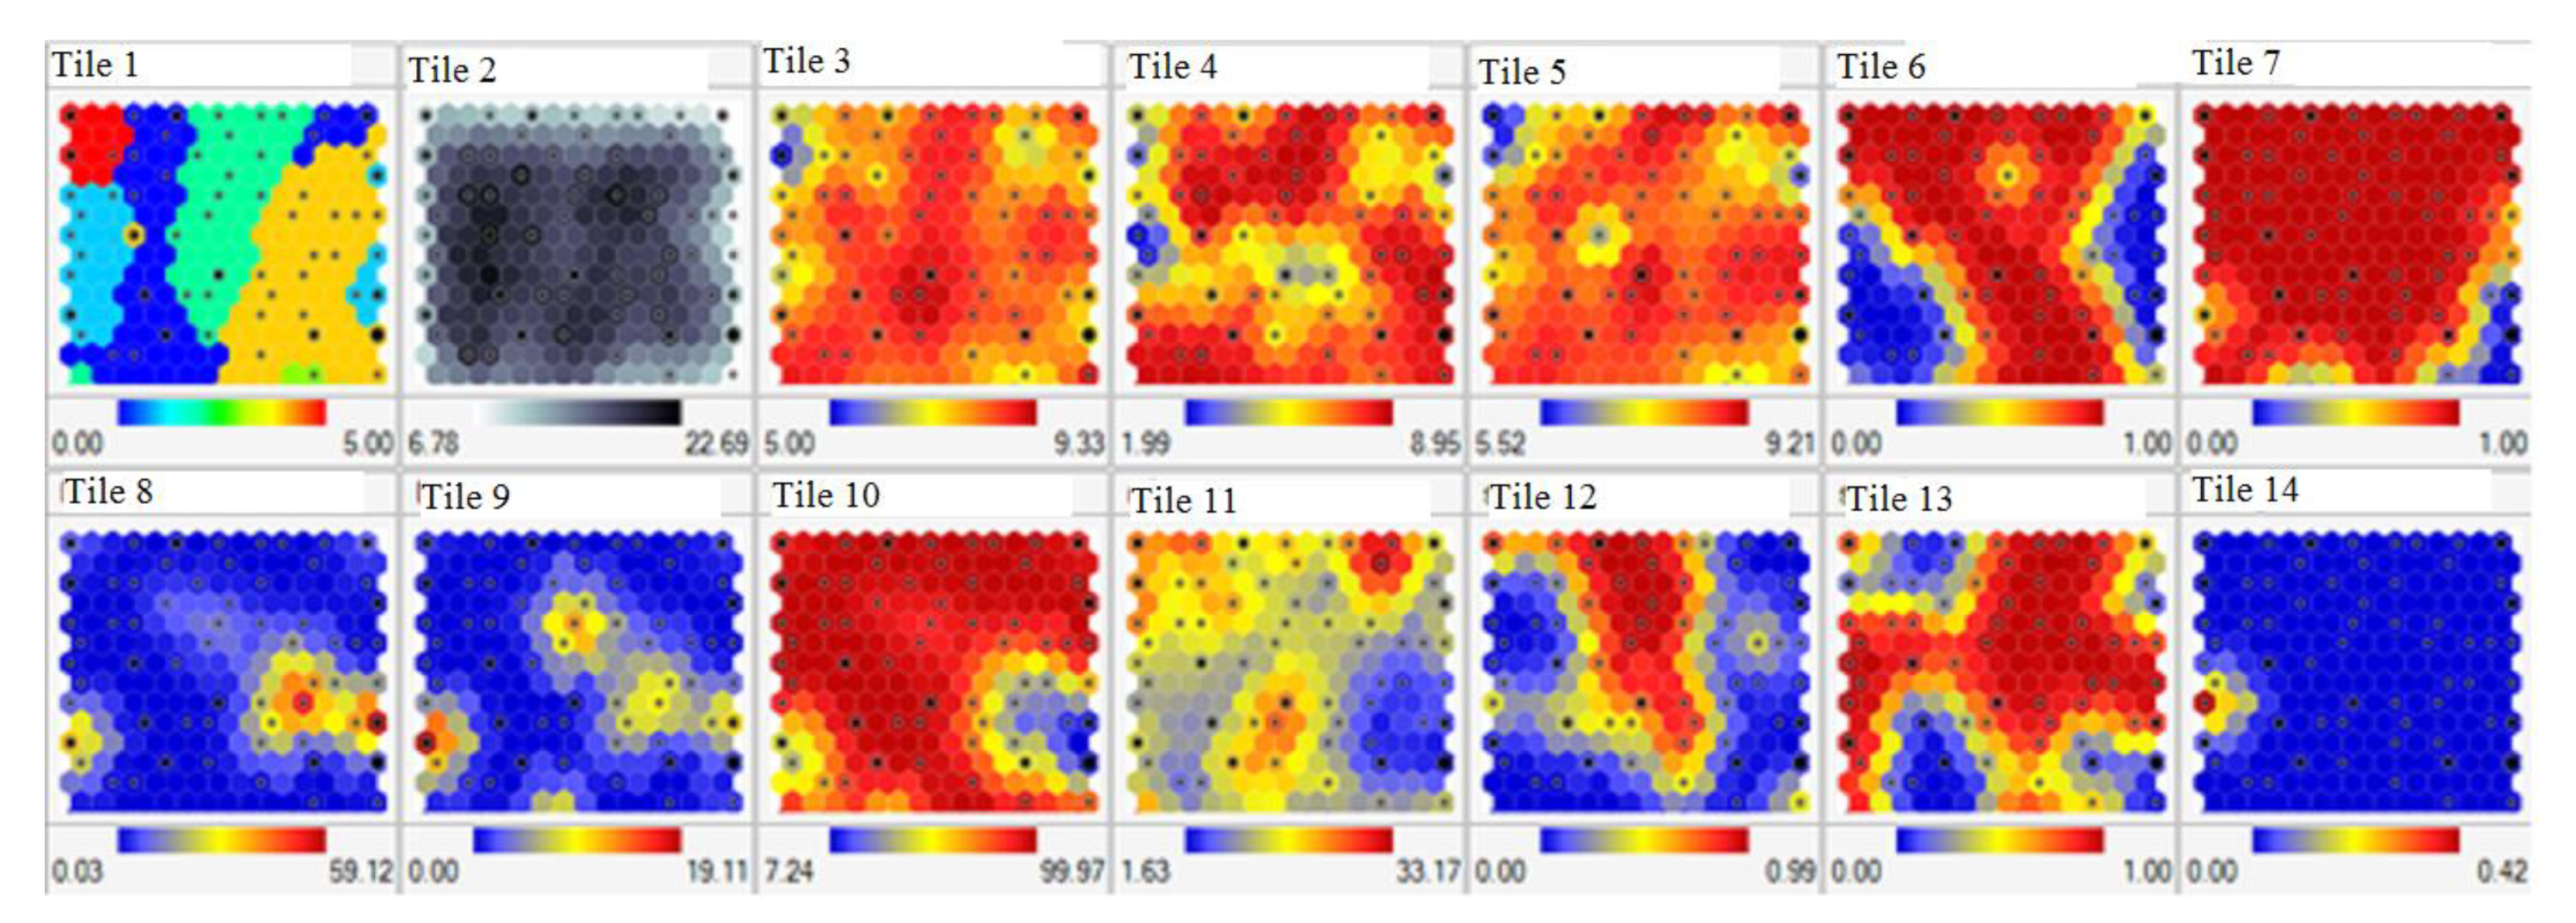
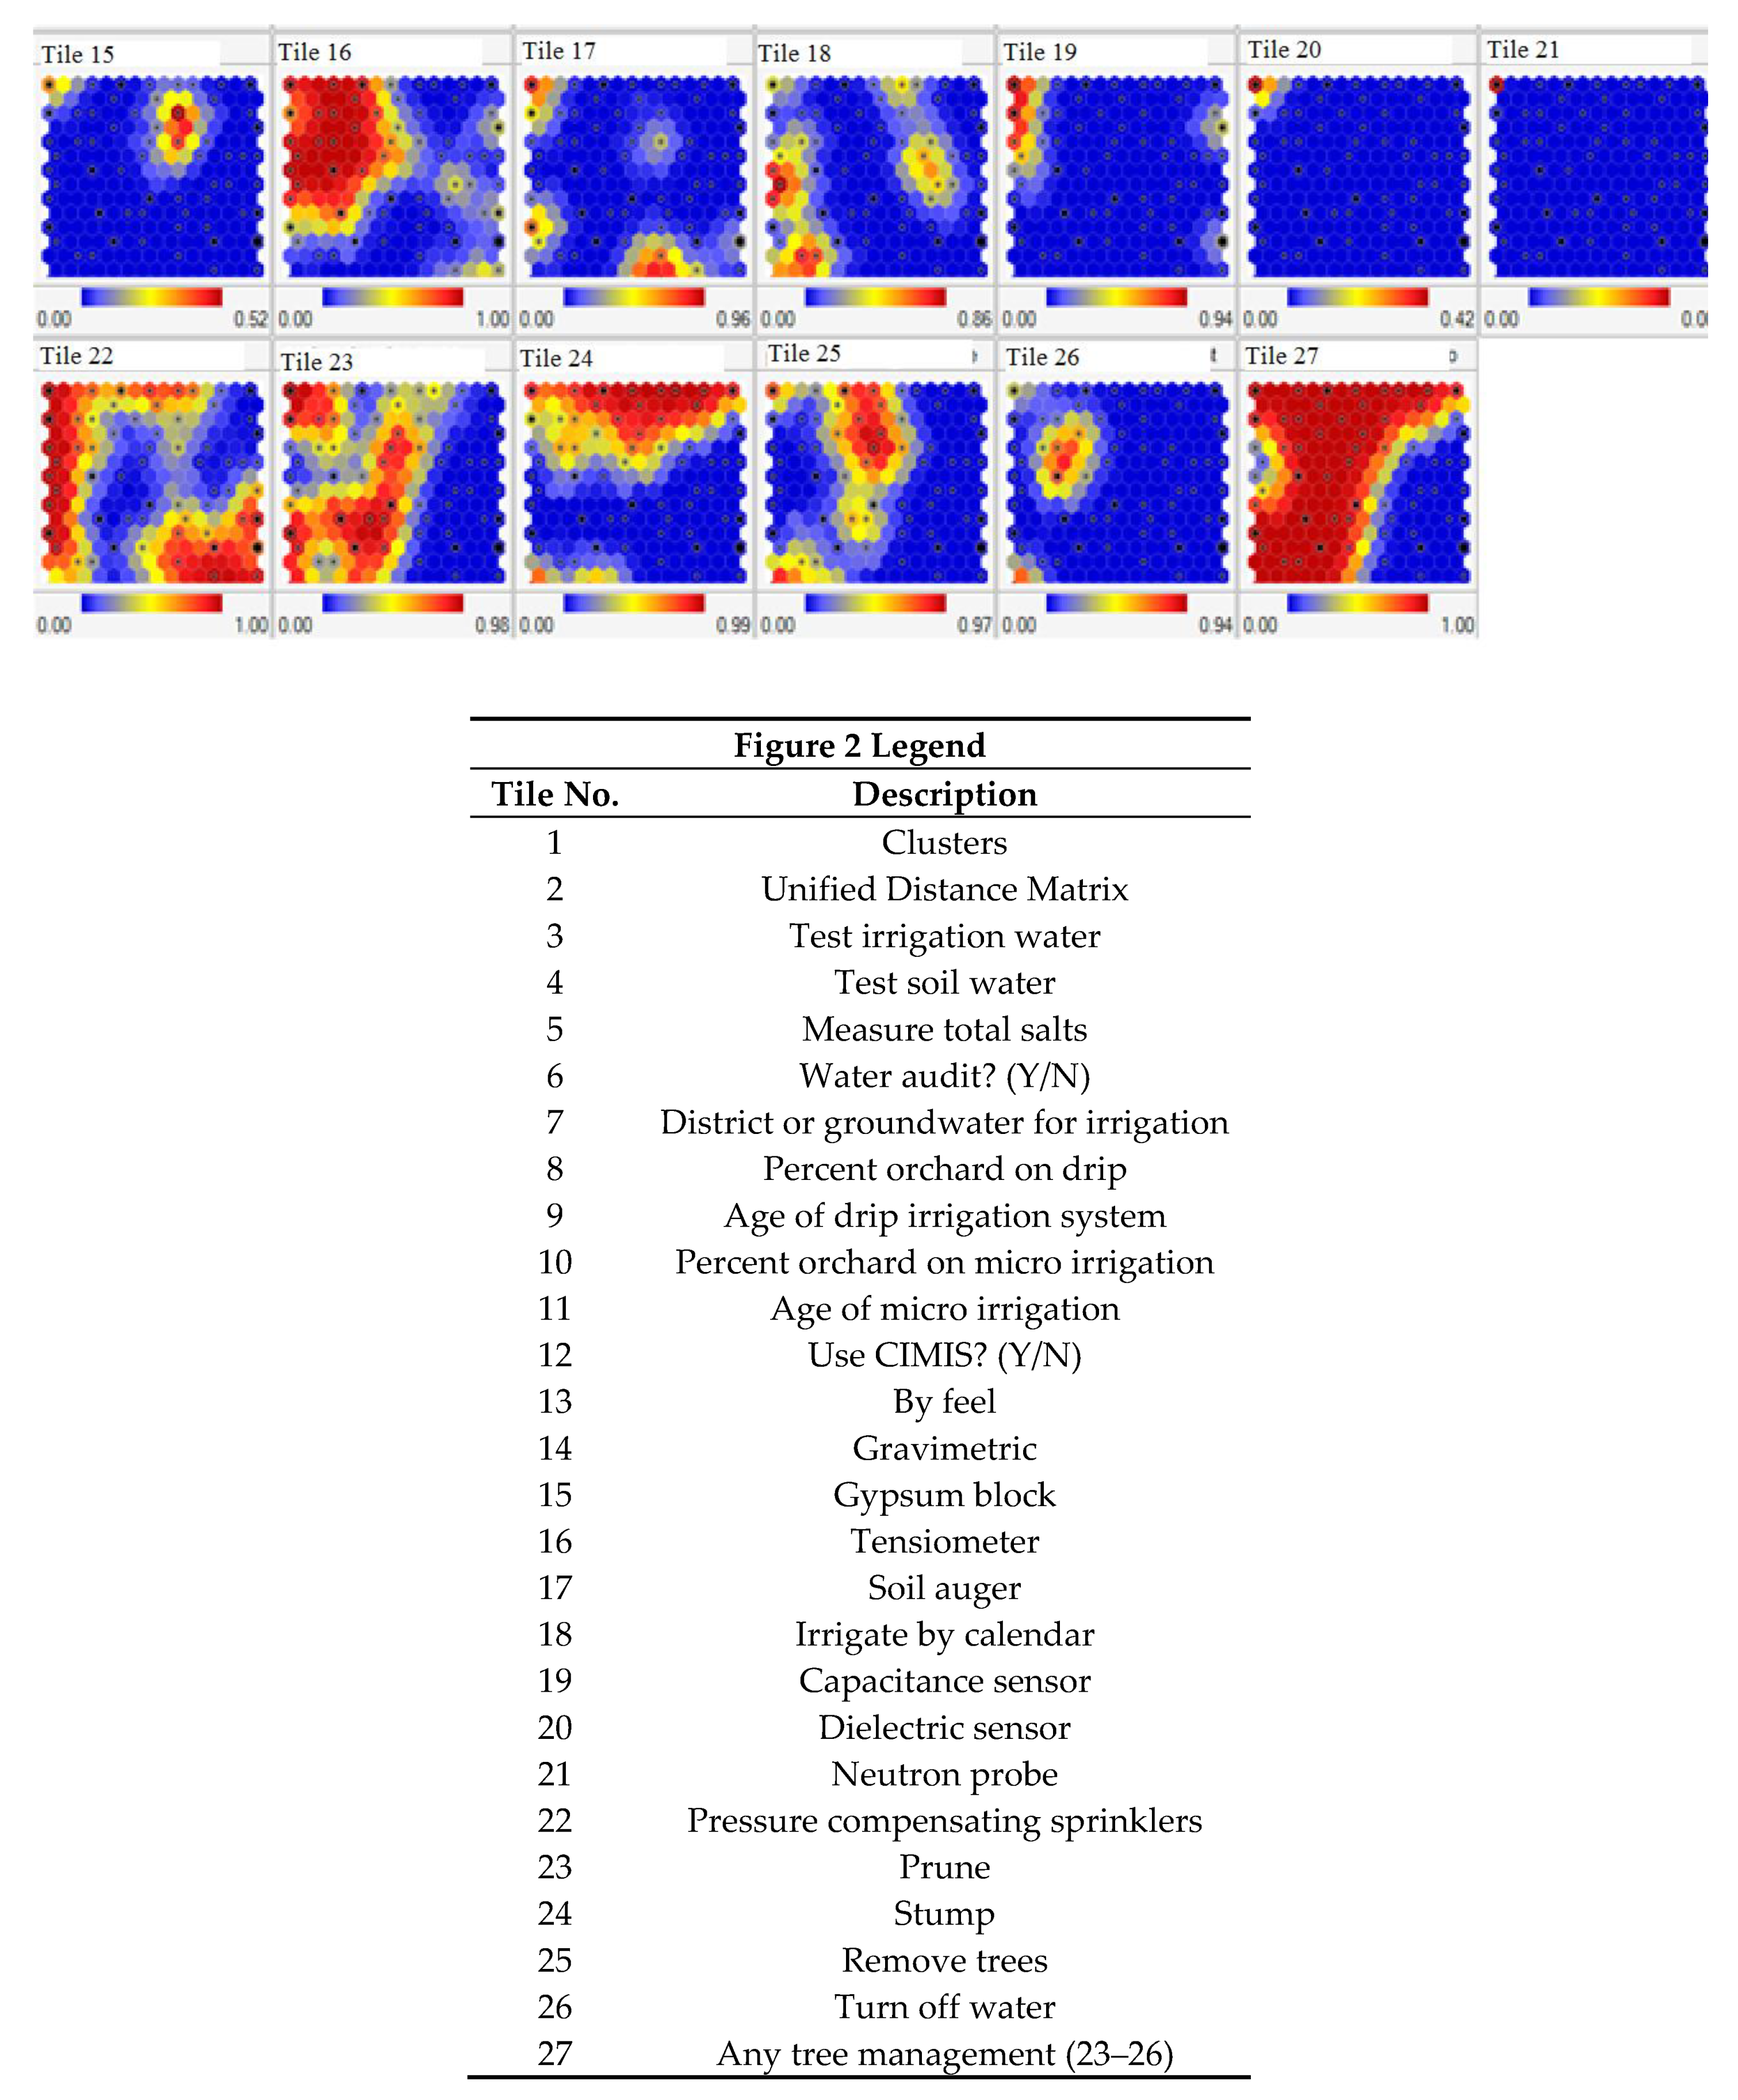
A total of 23 water efficient technologies and management practices were used by California avocado growers. In order to explore the relationships between the variables, the data was first analyzed using Kohonen Self-Organizing Maps (KSOM) [35] generated with the software program Synapse (Peltarion, Inc., Stockholm). KSOM analysis uses an artificial neural network to reduce the dimensionality of highly dimensional data sets into two dimensional arrays that allow visualization of the relationships between all of the variables of interest. In the map, each variable is assigned a grid or tile that is color coded as a heat map to illustrate the range of values that are observed in the data set [36]. The data are normalized and projected onto a grid in two dimensions that displays clusters in the variation for each variable. The individual heat maps are coded such that blue represents low values and red represents high values. Similarities in distributed color patterns across the tiles represent possible correlations, such that variables with similar patterns can be designated as potentially belonging to a cluster. KSOM methods are especially useful for comparing non-parametric data, and formulation of hypotheses regarding potential relationships between variables. While other statistical methods, such as principle components analysis and multiple correspondence analysis, provide similar information, KSOM provides an independent analytical method that uses an artificial neural network to reveal potential relationships between variables, and thus compliments other statistical methods such as correspondence analysis. Examples of prior applications related to agriculture include land use classification, examination of relationships between farm practices and water quality, and factors associated with farm profitability (see review in [37]). Here we applied this approach to identify individual variables that behaved similarly and that could thus be grouped into hypothetical bundles for further statistical analysis and modeling of factors affecting adoption of these technologies for dealing with water scarcity.
The concept of bundling is based on the idea that individual growers could use more than one technology and water management practice to respond to changes in water availability. Likewise, some technologies were little used or were sporadically adopted. For example, the KSOM shows no apparent relationship between variables describing grower characteristics and the use of the gravimetric methods, neutron probe, or dielectric and capacitance sensors for monitoring soil water availability. As a result, those technologies were eliminated from the analysis. We were also able to exclude drip and micro sprinkler irrigation technologies since almost all growers have these irrigation technologies. Additionally, since only some growers have both the choice of groundwater or district (surface) water, whereas other growers cannot select among these sources, we excluded whether the use of groundwater or district water affected adoption. We should also indicate that technological and management practices bundles are both location (country, region) specific and technology and managing practice specific (in [12], they are a combination of crops, and in [5], they are a combination of crops and technologies).
Based on the KSOM analysis (Figure 2), possible bundles of technologies and practices were narrowed down to fewer choices. Similar patterns shown in the KSOM tiles represent associations between particular dependent and independent variables in the dataset. Out of the original 23 water efficient technologies and management practices reported and answered by growers, 8 were selected as the basis for the bundles used in the estimation of the adoption models: (1) Water audit, (2) soil moisture by feel, (3) soil moisture by gypsum block, (4) soil moisture by tensiometer, (5) irrigation using calendar, (6) irrigation using CIMIS, (7) management of tree canopy, and (8) pressure compensating sprinklers. In this study, growers may bundle up to 8 discrete types of technologies or management practices to conserve water. More detailed background information on the technologies and management practices can be found in [38].

3.2. Bundle Zero Growers

Bundle Zero, the default, or the benchmark outcome, represents no adoption of practices or technologies, or a set of practices and technologies other than those reported in the questionnaire and identified by KSOM, that are used by a group of growers to determine when and how much to irrigate. For instance, growers adopting bundle Zero may have irrigation system infrastructure limits where avocado is irrigated along with other crops since they cannot separate the two. The orchard may be irrigated by a management company, and owners do not know when irrigation events take place or do not have control over how decisions are made with respect to water management. Additionally, part time growers who are able to only irrigate when they are physically present fall into this category, as they can turn on the water only when they can visit the orchard [39].

3.3. Development of other Bundles

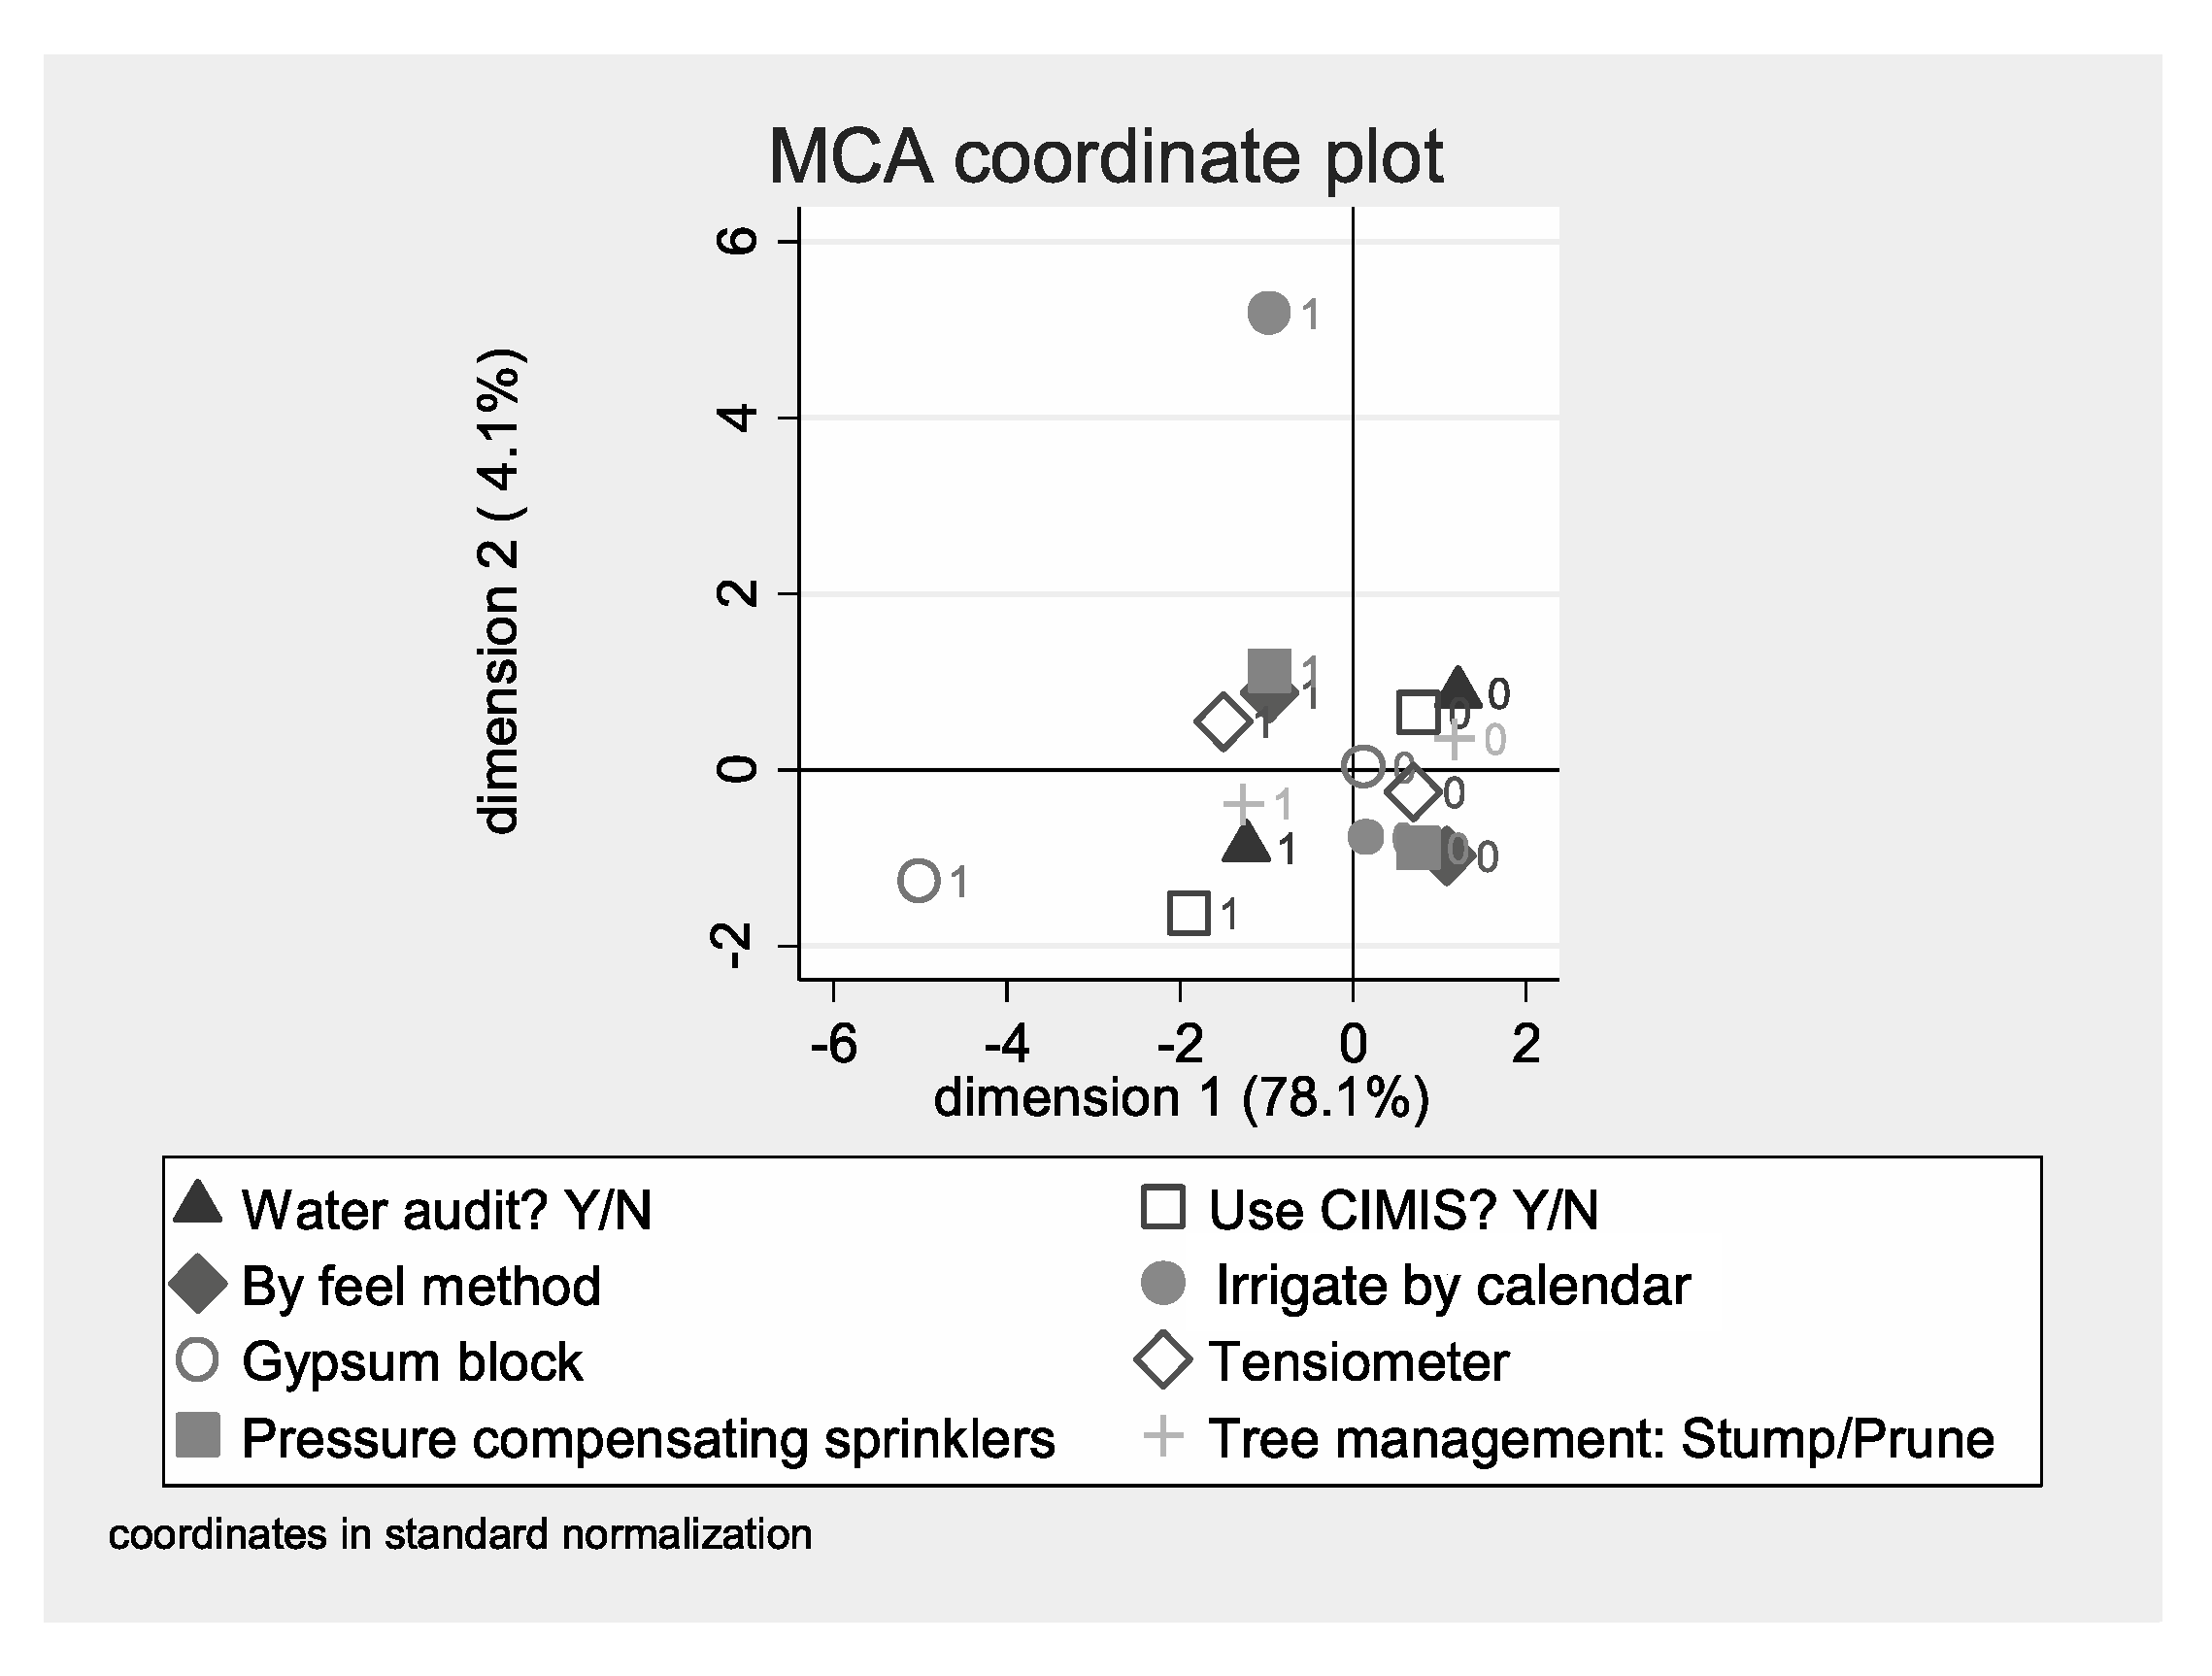
To determine the most likely combination of technologies and management practices used by the growers, a multiple correspondence analysis (MCA) was used to identify the most commonly grouped selections by growers (Figure 3). Since growers can choose up to 8 different methods, in any combination available, the MCA proved to be a useful tool to identify likely combinations that growers use in practice.
MCA is a multivariate analysis that conceptually is similar to Principal Component Analysis (PCA), but applies to categorical rather than continuous data [40]. PCA is a statistical procedure that uses an orthogonal transformation in order to convert a set of observations that could have correlated variables (and thus create a problem in residing in the right hand-side as explanatory variables in a regression) into a set of linearly uncorrelated variables that could be presented as one variable [41]. Both PCA and MCA provide a means of displaying or summarizing a set of data in, simpler, two-dimensional graphical form. This type of analysis can be used to detect underlying structures in the dataset.
Correlations between variables shown in the MCA coordinate graph (Figure 3) accounted for 72.5% of the inertia (extent) in the adoption of technologies/management practices. The higher the total inertia in the dimensions of the technologies, the better is the model fit. The first and second dimensions combined accounted for 79.5% variance in the dataset. The results of the MCA presented in Figure 2 show the first two dimensions plotted against each other and distributed in four quadrants that delineate a correlation between variables. Each variable is shown in four quadrants with the associated binary response, 1 = Yes, 0 = No.
The multiple correspondence graph shows that in the upper left quadrant, growers who answered ‘yes’ to: Irrigating by calendar, using pressure compensating sprinklers, tensiometers, and used “by feel” method are correlated with each other. In the upper right-hand quadrant, growers who answered ‘no’ to utilizing water audits, ‘no’ to using CIMIS, and ‘no’ to stumping or heavily pruning to conserve water were correlated with each other. In the lower left-hand quadrant, growers who answered ‘yes’ to having to stump or heavily prune to conserve water, ‘yes’ to getting water audit to improve water efficiency, ‘yes’ to using CIMIS, and ‘yes’ to using gypsum blocks were correlated with each other. In the lower right-hand quadrant, growers who answered ‘no’ to using tensiometers, ‘no’ to using “by feel”, ‘no’ to irrigating by calendar, and ‘no’ to using pressure compensating sprinklers were correlated with each other.

3.4. The Bundles in the Dataset

Bundle Zero: This bundle includes growers who do not use any of the 8 water management methods described earlier.
Bundle 1: This bundle represents growers who use pressure compensating sprinklers, by feel method, tensiometers, and irrigation by calendar. This bundle is the least advanced, as it requires the least amount of training, education, and funding to use. Although tensiometers require knowledge of water soil relations, they are inexpensive and easy to use.
Bundle 2: This bundle represents growers who have had to stump or heavily prune their trees to conserve water, use CIMIS, gypsum blocks, and utilize water audits to improve on-farm water use efficiency. This bundle is more sophisticated compared to bundle 1. Using CIMIS, although free, requires knowledge of evapotranspiration concepts and learning how to use the model with respect to seasons and type of crop. Utilizing water audits requires knowledge of irrigation systems, how to improve the water efficiency and willingness to pay for improvements after the audit is completed.
Bundle 3: This bundle represents growers who use a combination of technologies and management methods from Bundle 1 and Bundle 2 to include: Pressure compensating sprinklers, by feel, tensiometers, calendar-based irrigation, stump/prune trees, CIMIS, gypsum blocks, and water audits. This bundle is the most flexible in use, and may represent growers that need flexibility in how they approach water management. Bundle 3 is the most sophisticated bundle.
Table 3 presents the distribution of the bundles within the dataset of study growers. Sixteen percent of growers are associated with bundle 0. Bundle 1 and bundle 2, constitute 12 and 35% of the sample, respectively. Bundle 3 constitutes 37% of the sample, including growers that use a combination all eight of the technologies and management practices identified in the study. These growers did not fit into a single category as found in the MCA, and were assigned to bundle 3 so they could be represented in this study.
Based on the literature review, we can hypothesize that more sophisticated bundles, such as 2 and 3, will be adopted by growers that have higher education, that value cooperative extension, and have a high share income from avocado production.

3.5. Explanatory Variables

We used information collected in our survey to create the set of explanatory variables. We distinguish between Farm Acres and Avocado Acres where some growers may specialize only in avocado and some may have mixed cropping systems in which avocado is interplanted with other trees such as lemon or cherimoya. Of the 6 avocado growing counties in the sample, we found that the coastal locations are similar and different as a group than the inland counties. Therefore, we used Ventura, San Luis Obispo, Santa Barbara, and Orange counties (the coastal counties) as benchmark and created 2 dummy variables: Riverside County and San Diego County, that are contrasted to the coastal counties. Several variables are dichotomous (0/1), several are with real numbers measuring actual values, and several are index/ranking values ranging between a lower value and an upper value (see questionnaire in Appendix B). In particular, variables in our analysis are Irrigation Complexity (index between 0–8), Agricultural Water Rate ($/hcf), Age of owner (years), Formal Education (ranking between 1–6), Years’ Experience (years), Share Income from Avocado, Original Owner (0/1), Use of Cooperative Extension (ranking between 1–5), Leaf Sampling (0/1), Test Irrigation Water (0/1), Follow Lab Recommendation (0/1) [as some growers may conduct the tests but not follow the recommendation by the lab].
Avocados are grown on orchards having different soil textures (sandy, loam, clay), and may have various irrigation block shapes (rectangular, square, irregular shaped), and topography (% grade) on each irrigation block they manage. Growers manage anywhere from 1 to 20 (or more) irrigation blocks depending on the size of their orchard, age of trees, topography, or water delivery. Here, these variables were aggregated, using the MCA to represent the irrigation complexity. Typically, irregular shaped irrigation blocks are harder to manage with respect to irrigation systems, and blocks on steep slopes face non-uniform water delivery challenges. These variables were assigned categorical numbers from least complex to most complex with respect to water management, and then aggregated to calculate a variable that accounts for irrigation complexity. The higher the value of the aggregated variable, the more complex is the irrigation of the orchard.
Data on water source and quality were collected from the growers. Water quality data from the growers were checked against public records provided by water districts. Data on groundwater quality were provided by Groundwater Monitoring and Assessment Program (GAMA), Geotracker of USGS.
All of the explanatory variables fall into categories that represent farm characteristics, farmer characteristics, and informational factors as described in Table 1.

3.6. Empirical Models

We developed 2 sets of empirical models. The first set included 2 logit equations (f1 and f2) that explain the likelihood of selecting any technology or management practice by the farmers. The left hand-side of the equation is a dichotomous variable (0/1) having a value 1 if there is any use of a water efficient technology and or management practice, and a value of 0 otherwise. On the right hand-side of the estimated equations, we included two different sets of explanatory variables that were explained and justified in our Section 2.1. Model f1 includes farm-level, informational, and human capital variables. Model f2 includes, in addition, the regional fixed effects variables. The third model (gi) that we estimated is the multinomial logit regression model, where we explained, in a system of equations estimated simultaneously, the likelihood of selecting the 3 bundles with reference to bundle Zero (as a benchmark). The multinomial logit model includes all farm-level, human capital, informational, and fixed regional effects variables.
The specific empirical models we estimated and the dependent and independent variables included in each of the models are provided below:
Logit (dichotomous) regression: Selecting a technology/management practice = f1 (grow crops other than avocado, avocado acres, cost of irrigation water, owner age, education, share income from avocado, cooperative extension use).
Logit (dichotomous) regression: Selecting a technology/management practice = f2 (owner operated, farm acres, riverside county, San Diego county, irrigation complexity, owner age, education, share income from avocado, cooperative extension use).
Multinomial logit regression: Selecting bundle i = gi (owner operated, farm acres, Riverside county, San Diego county, irrigation complexity, owner age, education, share income from avocado, cooperative extension use).
Several variables are suspected of showing endogeneity: Bundle adoption decision could be expected to be jointly determined with share income from avocado, with level of education, and with use of extension. It could well happen that unobservable factors other than these regressors could affect the decision to select any of the bundles. To check for a possible endogeneity in our model we employed the Durbin–Wu–Hausman (DWH) test, or the augmented regression test for endogeneity [42]. The Hausman test for endogeneity result (6.90; 0.648) failed to be rejected, indicating that there is no endogeneity and no need for instrumentation.

4. Results

We start with descriptive results and then turn to the results of the econometric estimates.

4.1. Descriptive Statistics Results

The average grower manages over 3000 trees with a weighted average (depending on variety) of 137 trees per acre. Average chloride concentration for all surface water sources, districts, and groundwater sources, is 68.7 mg L−1, TDS is 552 mg L−1 and Electric Conductivity (EC) is 0.76 dS/m. (Long term irrigation with water having an EC > 1 dS m−1 is detrimental to avocado production. The ability of avocado roots to take up water from the soil via osmosis is reduced and leads to water stress and closure of the leaf stomata. Use of saline water also commonly leads to reductions in yield caused by chloride toxicity when chloride is present in the irrigation water at concentrations greater than 100 mg L−1. Avocado is considered to be one of the most sensitive of all crops to soil salinity, and requires very careful irrigation management to avoid soil salinization when using high EC irrigation water supplies [20].) Avocado is mainly irrigated with district water (82%), though some growers have access to both surface and groundwater sources and can irrigate the orchard by mixing water supplies in a pond or by using different water sources at different times during the growing season. Irrigation technology includes micro-sprinklers (87% of the orchards) or drip (7% of the orchards), with very few growers that use another type, such as overhead sprinklers (up to 3% of the orchards). The average age of the micro-sprinklers and drip irrigation was 15 years and 2.3 years, respectively.
An average avocado grower in our survey manages 93 acres of farmland, of which 31 acres are in avocado production. This suggests that the remaining acres are used for other crops, fallowed, or with buildings. Indeed, when asked if growers grow crops other than avocado, 65% responded that they grow another crop such as citrus, grapes, persimmons, olives, and ornamental crops. The average age of a grower in our sample was 62 years, and they were mostly male (80%). Farm management is mostly (64.4%) in sole proprietorship, and next, (21%) in partnerships. A high percent of growers had formal higher education, either (43.8%) graduate degrees, or (33.9%) Bachelor’s degrees. Growers had an average of 19.7 years of experience growing avocado, and 42 percent of the growers in the sample were original owners of the orchards they currently manage, suggesting that they know the peculiarities of their groves. Growers reported earning as much as 20 percent of their overall income from avocado production, which may reflect part-time farming and/or diversified farm activity (including other perennial crops).
Our sample suggests the following distribution (%) of growers among California counties: 41, 28, 12, 10, 6, and 3 in San Diego, Ventura, Riverside, San Luis Obispo, Santa Barbara, and Orange counties, respectively. Our sample suggests also land distribution among these counties to be 26, 41, 19, 4, 8, and 2, respectively (Table 2). The counties of San Diego and Riverside capture 69% and 67% of the growers and avocado land, respectively. Both the distribution of our sample growers and land across the counties reflect their actual distribution (Table 2).
While we use only Cooperative Extension as a source of information and know-how, avocado growers indicated that their sources include also the California Avocado Commission, journals, suppliers, and other growers.
Descriptive statistics of the variables that are included in our econometric analyses are presented in Table 4. Riverside and San Diego counties were used in the regressions as dummies, and Orange, San Luis Obispo, Santa Barbara, and Ventura were aggregated and used as a benchmark for several reasons. First, we found that Riverside and San Diego counties were the most arid avocado growing regions, and it could be inferred that these counties are more affected by droughts and lack of high-quality irrigation water. These preliminary observations are in line with previous work [5,22,32], suggesting that in our case, facing harsher climatic conditions, or higher levels of scarcity, would lead avocado growers in these regions to be more likely adopters of water efficient technologies and management practices. Second, when the models were run, we found collinearity between Orange, San Luis Obispo, Santa Barbara, and Ventura Counties, suggesting that there are similarities between these counties that should be considered in the empirical model.
We also tested for possible multi-collinearity among the variables that we use to explain the likelihood of selecting a technology or management practice in the 2 logit models f1 and f2, and the likelihood to select bundle i in the multinomial logit model gi. We found no correlation between pairs of variables that were used in the right hand-side of the same estimated equation (correlation values ranged between −0.0812 and 0.1202). Some of the variable pairs that were correlated were not included in the same regression. Therefore, we exclude the possibility of multicollinearity in our models.

4.2. Regression Results

Data were analyzed with both logit regression (Table 5) and multinomial logit regression (Table 6) models. The logit model predicts the likelihood of adopting any technology and management practice, and the multinomial logit predicts the likelihood of adopting a given bundle. Two discrete logit models (Table 5) were used to estimate adoption of any of the observed irrigation technology and/or any management practice as a dichotomous variable (0/1). A multinomial model was used when considering adoption as a bundled choice, with non-bundle-adopters (bundle Zero) used as benchmark and bundles 1–3, as explained earlier (Table 6).
Two logit regressions were chosen that consider adoption as a binary choice, adopter versus non-adopters, taking into account farm characteristics, farmer characteristics, and informational factors (Table 5). The difference between these two models are that exogenous factors, such as farm characteristics, that are modified to test the theory that farm location in arid counties has an effect on adoption while holding all other variables constant. The multinomial logit regression uses explanatory variables that are also used in the logit regression to compare between adopters and non-adopters.
Based on Model 1 (Table 5), the probability of being an adopter of irrigation management and/or irrigation technologies increases when orchards are located in Riverside County (compared to the benchmark coastal counties), when growers have a higher income share from avocado production, and when growers are provided information by cooperative extension. Riverside County has the highest aridity index in the sample, and is located in the inland desert region of the CIMIS evapotranspiration map. Regression results of Model 1 suggest that the probability of being an adopter decreases with irrigation complexity and owner’s age. The results of Model 1 are consistent with previous work [22] and with our expectations as stated in the Section 2.1.
We estimated the impact of additional exogenous farm factors in a second logit regression model (Model 2, Table 5) in which the farm characteristics included growing other crops, and also considered avocado acres and cost of water. In this model, we find that probability of choosing to adopt increases with share income from avocado and with cooperative extension support, and decreases with owner’s age. These results are consistent with previous work [31] and with our expectations as stated in the analytical framework.
For the multinomial logit regression, the most significant factors affecting the selection of bundle 1 (Table 6) were share income from avocado production (mean income was 16%) and informational factors such as use of cooperative extension. We did not find that farm characteristics, such as location, had an important contribution to selecting bundle 1.
We found that farm characteristics and location of orchard were important for growers to choose bundle 2, with Riverside County being statistically significant. Farmer characteristics such as age, education, and share of income from avocado explained the decision to select bundle 2. In addition, use of cooperative extension was significant in selecting bundle 2.
The probability of a grower using bundle 3, where growers could choose any combination and weren’t limited to a discrete selection, was increased by farm location in both San Diego and Riverside County, the most arid regions of California. Riverside and San Diego Counties are the most southern, warmer, and drier counties where avocado is grown in the state. Owner’s age decreased the probability of using bundles 2 and 3. This trend has been seen in previous related literature [20]. The probability of selecting bundle 3 was decreased by the farm’s irrigation complexity. Income share from avocado and use of cooperative extension were also important factors affecting a grower’s decision to select bundle 3 for irrigation management.
We can draw some comparisons between the results in Table 5 (Logit models) and in Table 6 (Multinomial logit). Both logit and multinomial logit estimated have their significant coefficients with similar signs, which suggest a robustness across these models. Among the fixed regional effects, Riverside county is positive and significant in the logit (model 1 where it appears) and in bundles 2 and 3 of the multinomial logit model. San Diego county is positive and significant only in bundle 3 of the multinomial logit model. As we know, the aridity index of Riverside county is much higher than that of San Diego county, which can explain its insignificance up to the level of sophistication of bundle 3. These coefficients measure the influence of water scarcity on the decision to adopt the water technologies and management practices. The variable irrigation complexity, measuring the difficulty facing growers in adopting new technologies, is negative and significant in the logit (model 1 where it appears) and in bundle 3 of the multinomial logit model, most likely due to the higher specifications imposed by bundle 3. The negative coefficient is interpreted as the inhibitive effect of complicated landscape on adoption. The coefficient of the age variable is negative and significant in all logit models and in bundles 2 and 3 of the multinomial logit model. The coefficient of age in the equation of bundle 1 is insignificant, suggesting that the adoption of a relatively simple bundle is not affected by age. Education is not significant in most estimates except in bundle 2 of the multinomial logit model. We do not have a good explanation for that finding and the fact it is not significant in our models (while in many previous works it was found to be positive and significant) except for speculating that we may have encountered measurement errors in the way education was recorded. Share income from avocado was found positive and significant in all models, and this is expected in our hypotheses and observed in previous studies. Finally, cooperative extension was found also highly significant and positive, which, again is expected and is in agreement with previous work. In summary, our findings of the two sets of models provide consistent results that are also consistent with previous findings in the literature.

5. Discussion of Main Results

While we discussed the individual findings in various parts of the results section, it would be useful to place a focused discussion under a special Discussion section.
We found that regional climates and water conditions matter. Regions facing harsher climatic conditions, or higher levels of scarcity, would lead growers in these regions to be more likely adopters of water efficient technologies and management practices, which is in line with previous work [5,22,32]. Regression results of Model 1 suggest that the probability of being an adopter decreases with irrigation complexity on farm and owner’s age, which are consistent with [22]. The probabilities of choosing to adopt water efficient technologies and management practices increase with share of income from avocado and with cooperative extension support, and decrease with owner’s age. These results are consistent with findings in [31]. Owner’s age decreased the probability of using bundles 2 and 3, which has been seen in [22] dealing with age and complex technologies.
In summary, the results of the two sets of models provide consistent results that are also consistent with previous findings in the literature.

6. Conclusions and Policy Implications

The research concluded in this paper identifies a set of variables that affect the adoption of water conservation technologies and management practices by avocado growers in California. One of the contributions of this research is the identification and adoption of bundles of technologies and management practices rather than adoption of a single technology or management practice. The results of the analysis in this study support previous attempts to look at adoption as a multi-faceted activity motivated by resource scarcity, economics factors, physical determinants, and information provision.
One of the most important findings implies that informational factors such as cooperative extension have an important role in adoption of water efficient technologies and management practices for California avocado growers. Cooperative extension agents are able to distribute research and tools necessary for growers to mitigate the impact of drought. Growers gain knowledge by meeting cooperative extension specialists in avocado tree management during visits to the farm, regional meetings, office hours, or phone calls, and obtain information via publications made available to the general public. Cooperative extension was found to be positive and significant in all estimated equations, concluding that it is an important source of information for growers.
The research also shows that human capital variables, in particular age, are important in predicting how a grower makes decisions about water management. Economics of avocado production, measured as share of income from avocado in the farm, was found to be an important factor influencing grower adoption of any individual technology or bundles. This implies that when facing water scarcity, and if avocado is an important source of farm income, a grower is more likely to adopt water management practices to sustain profitable production.
One important conclusion from our research, realized through the multinomial logit model, is that growers will need to have more flexibility in their approach to water management to mitigate climate change and reductions in irrigation water quantity and quality. Growers who were able to select from many different discrete management tools to manage water were located in Riverside and San Diego counties and had less complex irrigation systems. Riverside and San Diego Counties have higher aridity indexes and are predominantly on district water, typically a more expensive option for growers. In areas where there is less water available to growers, they may benefit from simplifying their irrigation systems in order to facilitate maintenance and improve water-use efficiency. The need for increased flexibility in technology adoption under increased water scarcity goes hand in hand with the role of cooperative extension. Therefore, future importance of cooperative extension services to the avocado production industry is amplified as future climate change impacts are expected to worsen.
There are a couple of caveats to our study that need to be considered. First, our sample size may have affected the ability to capture differences in responses of farmers to scarcity. While our sample was representative in terms of number and land distribution across the various counties, we may have not captured the actual number of technologies used. A second caveat is the possible bias from assuming that all technologies require a similar set of human capital skills when adopted separately (in the logit analyses). While we follow the practice used in the literature, attributing similar complexities and skill needs to a range of technologies and management practices (defined as “any technology or management practice”), still this may not be sufficient, and the adoption of each technology or management practice should be estimated specifically. With a larger number of observations, this could be performed in a more statistically significant manner.
There are several policy implications that emerge from this paper. First, we found that a combination of policy interventions should be considered to support farmers that face water scarcity and salinity, including creation information and making it available by extension agents, designing policies that address farms with different farm irrigation complexities, water sources, human capital levels (education, age, experience), and farm management structures.
We realize that there are differences among regions, and thus policy responses should take into account regional differences and provide a quilt, rather than an umbrella, policy. Regions with large urban centers could also take advantage of an additional source of water in the form of treated wastewater that may benefit farmers if properly treated and adequately priced. While the differences between the two counties San Diego and Riverside were said to be the result of the aridity, it can be also that differences in county services play an important role in enabling farmers adoption of single technologies and bundles. A policy that acknowledges these additional services could make a difference in farmers’ success when facing water scarcity and deteriorated quality (salinity).

Author Contributions

Conceptualization, J.R., A.D., and D.C.; formal analysis, J.R.; funding acquisition, A.D. and D.C.; investigation, J.R.; methodology, J.R. and A.D.; project administration, A.D. and D.C.; resources, A.D.; supervision, A.D. and D.C.; visualization, J.R.; writing—original draft, J.R.; writing—review and editing, A.D. and D.C. All authors have read and agreed to the published version of the manuscript.

Funding

The authors would like to acknowledge financial support from the California Avocado Commission via grant No. 12034311; and from the Giannini Foundation of Agricultural Economics, Mini Grant Fund. Julie Reints would like to acknowledge the support from the Graduate Student Dissertation Mentorship Fellowship, from the Herbert Kraft Scholarship, Campbell Research Fellowship Award, and from the Dean’s Distinguished Fellowship. Ariel Dinar would like to acknowledge support from the NIFA Multistate Project W3190 “Management and Policy Challenges in a Water-Scarce World.”

Conflicts of Interest

The authors declare no conflict of interest.

Appendix A. Water Efficient Technologies and Management Practices Used by California Avocado Growers

Avocado growers use a variety of irrigation technologies and water management practices. In the following, we provide a description of the various technologies and management practices we encountered in our survey of growers in California.

Appendix A.1. Soil Moisture Monitoring

Careful water management is critical in the productivity of an avocado crop, as overwatering or under-watering can significantly reduce yields [16,43,44,45]. Determining when and how much to irrigate is difficult for a grower by visual monitoring or by hand sample. In our study, nearly 53% of growers in the sample use a method we identify as “By Feel”, a tactile technique where growers take a sample of soil, and if the soil doesn’t appear moist by sight or feel, then they irrigate. It is impossible to determine the soil-water energy when a grower uses “By feel” techniques, since soil water potential and available water content can only be measured accurately with technology [29,46]. Another popular method used by growers is to irrigate by calendar date (13% of growers in this study), which does not consider weather, soil conditions, or water demand of the tree. Although, it’s important to note that irrigation by calendar date may be more likely in water districts where there are restricted allocations of water delivery and growers only have access to irrigation water on specific days.

Appendix A.2. Meteorological Data to Manage Water Applications

Weather stations are used in determining a crop’s water needs based on precipitation, temperature, wind, and radiation, combined with a crop coefficient to estimate evapotranspiration. In California, growers have access to a free web-based evapotranspiration estimator, the California Irrigation Management Information System (CIMIS) a system that was designed for irrigators to use their water resources more efficiently. CIMIS has 200 weather stations throughout California, so growers can access weather data from a station nearby and, when combined with a crop coefficient, it can be used to guide a specific crop’s needs. Twenty eight percent of the avocado growers in our sample use CIMIS as an irrigation calculator to determine when and how much water to apply. In general, irrigation calculators use daily values for evapotranspiration and rainfall to recommend weekly water inputs [47]. Though there are other types of irrigation software growers can use, in this study we only look at CIMIS, as it is free to all California growers.

Appendix A.3. Canopy Reduction

When faced with water shortages, growers can choose from several management decisions to mitigate permanent damage to the trees. One type of extreme management method growers can utilize is the decision to stump trees, aggressively pruning the tree down to 4 to 7 feet from the ground. Stumping is used in order to save orchard trees during periods of drought because trees can be rejuvenated when water supply levels are revamped. When trees are stumped, the water requirement is drastically lowered due to a significant reduction of leaf area, resulting in a lower loss of water from transpiration [48,49]. The drawback to this method is that the tree will not produce fruit for up to 5 years after rejuvenation, resulting in an economic hardship to the grower. Nearly 48% of the growers in our sample stump trees in their groves. Stumping, or canopy reduction, can also be used as a way to rejuvenate an aging orchard, however, in this survey we asked if they stumped due to water shortage only.

Appendix A.4. Water Audits

Another water saving management decision includes improving irrigation performance by increasing an existing irrigation system’s distribution uniformity (DU). DU, expressed as a percentage, is an indication of how evenly distributed is the water application delivered to the crop. It accounts for differences in pressure, topography, and discharge coefficients from sprinklers or nozzles where optimal values for DU are considered 80% and above [50]. The high uniformity of an irrigation system guarantees appropriate water delivery to the crop by reducing overwatering or under watering [51]. Pereira et al. [18] found that improving irrigation efficiency, by increasing DU, is an important tool in water resource management because it reduces non-consumptive use of water and undesired water runoff. In most areas of California, water audits (professional auditors) are offered for free by either the local water district or the resource conservation district. Nearly 50% of the growers in our sample used water audits.

Appendix A.5. Pressure Compensating Sprinkler

The aim of micro or drip irrigation systems are to minimize runoff and maximize water use to deliver water directly to the plant. However, it is important to consider distribution uniformity when designing an irrigation system to know how much water is being delivered to each tree. This is especially critical in orchards that have slopes or large areas of irrigation systems. Pressure compensating emitters are able to deliver a precise aliquot of water regardless of changes in pressure due to changes in terrain, such as slopes. Pressure compensating sprinklers are important in irrigation management because when used, a grower will know exactly how much water is being delivered to each plant. This results in a m ore uniform distribution where one tree isn’t being overwatered and another underwatered.

Appendix A.6. Tensiometer

The most basic instruments for measuring plant available water are tensiometers and gypsum blocks (next section), both of which measure the “soil water potential”. The tensiometers are installed to place the ceramic cup portion at a depth that matches with the root zone. PAW is the water fraction that over the range from field capacity (typically 12-18 centi-bars (cb)) up to 100 cb, where all plant available water has been depleted.

Appendix A.7. Gypsum Blocks

Another commonly used method for determining soil water potential is the gypsum blocks. These devices determine soil moisture by measuring the electrical resistance to current flow between electrodes that are embedded within a block of gypsum, or a similar material. The gypsum block allows moisture to move in and out as the soil becomes more saturated or dries out. When more moisture is absorbed by the block, it lowers the resistance reading, indicating a more saturated soil. The blocks are inexpensive and are easy to replace, but require a data logger in order to record the readings over time. In addition, the blocks eventually dissolve and need to be replaced. As with tensiometers, gypsum blocks are somewhat slow to respond to rapid changes in soil moisture. They are the most useful for measuring the slow dry-down of soil over time, and thus are used to guide when irrigation should begin. On the other hand, the slow response time limits their utility for determining when to turn off the water, which can lead to overwatering when irrigation valves are directly controlled.

Appendix B. The Survey Instrument—Adoption of Water Technologies and Management Practices by California Avocado Growers

FREE BOOK FOR YOUR PARTICIPATION IN THIS SURVEY! "Managing California’s Water, From Conflict to Reconciliation", 2011 (valued at $35).
1. Where would you like your free book sent? Address ____________________________________
2. Please enter your email address if you want an electronic copy of the survey results _____________________________________________________
3. Total farm acreage under your ownership ______________________________________________
4. How many acres of avocado ________________________________________________________
5. Total acres rented or leased for the 2012 year __________________________________________
6. Is avocado the only crop grown at your orchard?
( ) Yes    ( ) No
If no, what are the other types of crops are grown (please list top three)?
First crop: _________________________
Second crop: ______________________
Third crop: ________________________
Total acres of crops other than avocado grown at your orchard ___________________________
What county is the orchard located in?
( ) Los Angeles County   ( ) Orange    ( ) Riverside    ( ) San Diego    ( ) San Luis Obispo
( ) Santa Barbara    ( ) Ventura    ( ) Other
Ownership type (select from list or fill in type):
( ) Sole proprietorship: owned by one person
( ) Partnering: two or more people share ownership
( ) Corporations: Shareholders elect a board of directors to oversee the major policies and decisions
( ) LLC: Type of hybrid business structure where owners are members
( ) Other _________________________________________________
Primary owners/managers age _______________________________
Primary owners/managers Gender
( ) Male    ( ) Female
What was the highest level of education for the primary owner/manager?
 High SchoolSome CollegeA.A./A.S.B.A./B.S.Ma/PhDOther
Education      
Years of experience growing avocado? ____________________________________________
Years of experience growing crops other than avocado. _______________________________
Are you the original owner?
( ) Yes    ( ) No
What year did you take ownership of the orchard? _________________________________
Irrigation block acreage, shape, slope and soil texture. The factors that determine installation of irrigation technology.
Irrigation block acreage Block shapeSlope
None = 0%
Low = 0–5%
Med = 5–10
Mod = 10–15
Severe ≤ 15%
Soil texture:
Sand
Sandy loam
Loam
Clay loam
Clay
Square Sustainability 12 03555 i001
Rectangular Sustainability 12 03555 i002
Triangle Sustainability 12 03555 i003
Irregular Sustainability 12 03555 i004
    
    
Avocado tree characteristics such as variety, root stock, age, height, tree spacing, planting type.
# of TreesVariety and RootstockAvg. Age of Trees (yrs)Avg. Height of Trees (ft)Tree Spacing (ft)
Ex. 20 × 20
1 = Mound(berm) or
2 = Native Terrain


Orchard Management Characteristics
How often does a PCA visit the orchard?
( ) Monthly    ( ) Bi-annual    ( ) Annually    ( ) Not Applicable/Not using
How often do you treat for weed management (chemical or manual)?
( )Weekly   ( )Monthly   ( )Bi-annually   ( )Annually   ( )None
Fertilization strategy
( ) Nitrogen Fertilization–Fertigation
Frequency (circle months)
Dec   Jan   Feb   Mar   Apr   May   Jun   Jul   Aug   Sep   Oct   Nov
( ) Hand application: What type(s) _________________________________
Frequency (circle months)
Dec   Jan   Feb   Mar   Apr   May   Jun   Jul   Aug   Sep   Oct   Nov
( ) Aerial application: Material(s) ___________________________________
Frequency (circle months)
Dec   Jan   Feb   Mar   Apr   May   Jun   Jul   Aug   Sep   Oct   Nov
( ) Organic materials: Material(s) ___________________________________
Frequency (circle months)
Dec   Jan   Feb   Mar   Apr   May   Jun   Jul   Aug   Sep   Oct   Nov
Do you take leaf samples?
( ) Yes    ( ) No
How often do you send leaf samples to a lab to get tested for nutrients?
( ) Monthly    ( ) Bi-annually    ( ) Annually    ( ) Never
If you send samples to a lab, how often do you follow their fertilization recommendations?
( ) Always    ( ) Sometimes    ( ) Never    ( ) Not applicable
How often do you test your irrigation water for total salts?
( ) Monthly    ( ) Bi-annually    ( ) Annually    ( ) Never
How often do you test your soil water for irrigation purposes?
( ) Monthly    ( ) Bi-annually    ( ) Annually    ( ) Never
Do you use CIMIS for soil water management?
( ) Yes    ( ) No
How often do you measure your soil for total salt (EC)?
( ) Monthly    ( ) Bi-annually    ( ) Annually    ( ) Never
What is your average soil EC in dS/m? (If known)
____________________________________________
Environmental characteristics and Water delivery
Is there a privately owned weather station located at your orchard?
( ) Yes    ( ) No
How far away from your orchard is the nearest weather station that you are able to access?
( ) >1    ( ) 1–5    ( ) 5–10    ( ) 10–15    ( ) 15–20    ( ) <20
What year did you last get a water audit on your orchard?
_________________________________________________
What is the water district of the orchard? Please fill in the boxes below.
 Water District 1Water District 2
Water District Name  
Acres of your orchard serviced (ac)  
Annual water use for 2012 yr (ac/ft yr)  
Avg. Cost of water per month ($/ac ft)  
Is water delivery service from your district available all year?
( ) Yes    ( ) No
Water delivery availability (select which one best describes your access to water):
( ) On demand—can be accessed at all times
( ) Rotation/schedule—limited water access to specific times or days
( ) Other
What is the lead time for water in hours?
____________________________________________
Duration of Flows in hours?
____________________________________________
What is the size of your water meter in inches? (If known)
____________________________________________
Is there a restrictor on your water meter?
( ) Yes    ( ) No
Type of water used for irrigation:
 District WaterGround Water (Well)Recycled WaterTrucked in WaterOther
% used for irrigation     
If known fill in:     
ECw (dS/m)     
TDS (ppm)     
Chloride (ppm)     
Is there a water treatment system onsite?
( ) Yes    ( ) No
If there is a water treatment system onsite, what type do you use?
( ) Reverse osmosis    ( ) Ion exchange    ( ) Distillation    ( ) Other ____________________
Irrigation technologies and conservation practices
Fill in the percentage of each type of irrigation system installed and the average age of the system.
 Surface DripMicro SprinklersOther
% of grove with this type of system   
Age of system (yrs)   
How do you determine your orchard's soil-water status? Check all that apply.
( ) CIMIS    ( ) by feel (probe)    ( ) gravimetric    ( ) gypsum block    ( ) tensiometer
( ) auger method    ( ) calendar    ( ) capacitance probe    ( ) Dielectric permittivity probe
( ) neutron probe    ( ) none    ( ) other
Do you use pressure compensating emitters as part of your irrigation system?
( ) Yes    ( ) No
What is your typical irrigation schedule per season?
 FallWinterSpringSummer
Daily    
Weekly    
Bi-weekly    
Monthly    
Bi-monthly    
Other    
What is the application rate of your sprinklers in gallons per hour?
____________________________________________
Is there a full time or dedicated irrigator employed at your orchard?
( ) Yes    ( ) No
At what frequency do you leach?
( ) Daily    ( ) Weekly    ( )Monthly    ( )Other _______________    ( ) I don’t leach
What is your % leaching fraction? (If known) ________________________________
Orchard management structure
Is the orchard owner-operated? (If yes, skip next 3 questions)
( ) Yes    ( ) No
If No, who operates the orchards daily activities?
( ) Management Company    ( ) Farm Advisor    ( ) Other
How often do you communicate with them?
( ) Daily    ( ) Weekly    ( ) Monthly    ( ) Bi-annually    ( ) Annually
What method of communication do you use?
( ) Phone    ( ) Email    ( ) In person    ( ) Post mail    ( ) Other
Rate the level of involvement from the management company or farm advisor?
( ) Intense—makes all decisions
( ) Moderate—makes most of the decisions
( ) Medium—makes half the decisions
( ) Low—limited decision making
( ) Very low—makes very few decisions
Was there off farm employment by primary owner/manager in 2012?
( ) Yes    ( ) No
What was primary owners/managers % of income from avocado production in 2012?
____________________________________________
Select the organization type that best fits your orchard management by circling the diagram that represents your orchard. Adapted from [4]
1.Unified: Operated by a single individual who performs all
the tasks
Sustainability 12 03555 i005
2.Cooperative Market Organization: The simplest level of horizontal task specialization - the separation between workers and management
Sustainability 12 03555 i006
3.Primary Hierarchy: Workers are distinguished from management as well as from each other. Two units: management and labor
Sustainability 12 03555 i007
Sustainability 12 03555 i008
4. Functional Hierarchy: Similar to simple but managers are also organized according to tasks. Irrigation managers perform distinct tasks from those performed by the machine shop manager.
5.Coopoerative Market hierarchy: Similar to Type 2, Workers and managers form specialized units producing unique crops for particular markets
Sustainability 12 03555 i009
6.Market Hierarchy: Workers are organized by markets, clients and locations
Sustainability 12 03555 i010
Other: Please describe and draw diagram
Management practices that address water scarcity in your orchard.
What was your past management in response to a water shortage or low quality water at your orchard?
Type% of Orchard Treated#of Acres Treated
Selective Pruning  
Stumping  
Removal of trees  
Turned water off  
Other  
None  
How many months in advance do you make decisions about water conservation treatments?
___________________________________________
Information gathering and communication
Where and how often do you obtain information on avocado production?
 Cooperative ExtensionCACOnline SourcesJournals/BooksSupplier/Agents/LabsGrowersOther
Weekly       
Monthly       
Bi-annually       
Yearly       
Other       
What are the topics that you ask about from these sources?
 Cooperative ExtensionCACOnline SourcesJournals/BooksSupplier/Agents/LabsGrowersOther
Fertilizer       
Irrigation       
Pest/disease       
Harvest       
Pollination       
Water policy       
Other       
Rate the level of importance that you place on the information collected on issues related to avocado production.
 Rate Level of Importance 1–5
1 = Low 5 = High
Cooperative extension 
CAC 
Online sources 
Journals/books 
Supplier/Agents/labs 
Growers 
Other 
Harvest Procedures
When do harvest events occur? (Circle corresponding months for type of picking)
Size pick: Dec   Jan   Feb   Mar   Apr   May   Jun   Jul   Aug   Sep   Oct   Nov
Strip: Dec   Jan   Feb   Mar   Apr   May   Jun   Jul   Aug   Sep   Oct   Nov
What is the distance from your orchard to the packing house in miles?
____________________________________________
Almost done! One more page…
Yield for 2012 production.
Yield data for year 2012 entered in lbs per size picked for the entire orchard
Fruit SizeTotal Yield (lbs) for Entire Orchard
24 
28 
32 
36 
40 
48 
60 
70 
84 
96 
#2 
culls 
What was your number of theft events during the year 2012?
____________________________________________
What was your estimated amount of loss due to theft for 2012?
____________________________________________
Thank You!
Thank you for taking our survey. Your response is very important to us and our research

References

  1. Boretti, A.; Rosa, L. Reassessing the projections of the World Water Development Report. NPJ Clean Water 2019, 2, 15. [Google Scholar] [CrossRef]
  2. Clifton, C.; Evans, R.; Hayes, S.; Hirji, R.; Puz, G.; Pizarro, C. Water and Climate Change: Impacts on Groundwater Resources and Adaptation Options. In BNWPP Water Working Notes 25; World Bank: Washington DC, USA, 2010. [Google Scholar]
  3. Food and Agricultural Organization (FAO). Water for Sustainable Food and Agriculture; A report produced for the G20 Presidency of Germany; FAO: Rome, Italy, 2017. [Google Scholar]
  4. UCCE and CAS (University of California Cooperative Extension, San Diego County, and The California Avocado Society). Avocado Production in California—A Cultural Handbook for Growers, 2nd ed.; Book One-Background Information; UCCE and CAS: San Diego, CA, USA, 2012. [Google Scholar]
  5. Fleischer, A.; Mendelsohn, R.; Dinar, A. Bundling agricultural technologies to adapt to climate change. Technol. Forecast. Soc. Chang. 2011, 78, 982–990. [Google Scholar] [CrossRef]
  6. Campbell, M.B.; Dinar, A. Farm organization and resource use. Agribusiness 1993, 9, 465–480. [Google Scholar] [CrossRef]
  7. Dinar, A.; Yaron, D. Adoption and Abandonment of Irrigation Technologies. Agric. Econ. 1992, 6, 315–332. [Google Scholar] [CrossRef]
  8. Feder, G.; Just, R.E.; Zilberman, D. Adoption of Agricultural Innovations in Developing-Countries—A Survey. Econ. Dev. Cult. Chang. 1985, 33, 255–298. [Google Scholar] [CrossRef] [Green Version]
  9. Feder, G.; Umali, D.L. The Adoption of Agricultural Innovations—A Review. Technol. Forecast. Soc. Chang. 1993, 43, 215–239. [Google Scholar] [CrossRef]
  10. Koundouri, P.; Nauges, C.; Tzouvelekas, V. Technology adoption under production uncertainty: Theory and application to irrigation technology. Am. J. Agric. Econ. 2006, 88, 657–670. [Google Scholar] [CrossRef] [Green Version]
  11. Salazar, C.; Rand, J. Production risk and adoption of irrigation technology: Evidence from small-scale farmers in Chile. Lat. Am. Econ. Rev. 2016, 25, 2. [Google Scholar] [CrossRef] [Green Version]
  12. Wang, J.; Mendelsohn, R.; Dinar, A.; Huang, J. How Chinese Farmers Change Crop Choice to Adapt to Climate Change. Clim. Chang. Econ. 2010, 1, 167–185. [Google Scholar] [CrossRef]
  13. Lambert, D.M.; Paudel, K.P.; Larson, J.A. Bundled adoption of precision agriculture technologies by cotton producers. J. Agric. Resour. Econ. 2015, 40, 325–345. [Google Scholar]
  14. Tey, Y.S.; Brindal, M. Factors influencing the adoption of precision agricultural technologies: A review for policy implications. Precis. Agric. 2012, 13, 713–730. [Google Scholar] [CrossRef]
  15. Sureshkumar, P.; Geetha, M.C.; Narayanan Kutty, C.; Pradeepkumar, T. Fertigation—The key component of precision farming. J. Trop. Agric. 2017, 54, 103–114. [Google Scholar]
  16. Kiggundu, N.; Migliaccio, K.W.; Schaffer, B.; Crane, J.H. Water Savings, Nutrient Leaching, and Fruit Yield in a Young Avocado Orchard as Affected by Irrigation and Nutrient Management. Irrig. Sci. 2012, 30, 275–286. [Google Scholar] [CrossRef]
  17. Boland, A.M.; Bewsell, D.; Kaine, G. Adoption of sustainable irrigation management practices by stone and pome fruit growers in the Goulburn/Murray Valleys, Australia. Irrig. Sci. 2006, 24, 137–145. [Google Scholar] [CrossRef]
  18. Pereira, L.S.; Oweis, T.; Zairi, A. Irrigation management under water scarcity. Agric. Water Manag. 2002, 57, 175–206. [Google Scholar] [CrossRef]
  19. Carmen, H.F. The Story Behind Avocados’ Rise to Prominance in the United States. Agric. Resour. Econ. Update 2019, 22, 9–11. [Google Scholar]
  20. UCCE and CAS (University of California Cooperative Extension, San Diego County, and The California Avocado Society). Avocado Production in California—A Cultural Handbook for Growers, 2nd ed.; Book Two—Cultural Care; UCCE and CAS: San Diego, CA, USA, 2012. [Google Scholar]
  21. USDA-Economic Research Service. Beginning Farmers and Age Distribution of Farmers. 2012. Available online: https://www.ers.usda.gov/topics/farm-economy/beginning-disadvantaged-farmers/beginning-farmers-and-age-distribution-of-farmers/ (accessed on 2 July 2019).
  22. Genius, M.; Koundouri, P.; Nauges, C.; Tzouvelekas, V. Information Transmission in Irrigation Technology Adoption and Diffusion: Social Learning, Extension Services, and Spatial Effects. Am. J. Agric. Econ. 2011, 96, 328–344. [Google Scholar] [CrossRef] [Green Version]
  23. Tiamiyu, S.; Akintola, J.; Rahji, M. Technology Adoption and Productivity Difference among Growers of New Rice for Africa in Savanna Zone of Nigeria. Tropicultura 2009, 27, 193–197. [Google Scholar]
  24. Robertson, M.J.; Llewellyn, R.S.; Mandel, R.; Lawes, R.; Bramley, R.G.V.; Swift, L.; Metz, N.; O’Callaghan, C. Adoption of variable rate fertiliser application in the Australian grains industry: Status, issues and prospects. Precis. Agric. 2012, 13, 181–199. [Google Scholar] [CrossRef]
  25. Yaron, D.; Dinar, A.; Voet, H. Innovation on Family Farms: The Case of the Nazareth Region in Israel. Am. J. Agric. Econ. 1992, 74, 361–370. [Google Scholar] [CrossRef]
  26. Bryant, C.R.; Smit, B.; Brklacich, M.; Johnston, T.R.; Smithers, J.; Chjotti, Q.; Singh, B. Adaptation in Canadian Agriculture to Climatic Variability and Change. Clim. Chang. 2000, 45, 181–201. [Google Scholar] [CrossRef]
  27. Beal, G.M.; Rogers, E.V.; Bohlen, J.M. Validity of the Concept of Stages in the Adoption Process. Rural Soc. 1957, 22, 166–168. [Google Scholar]
  28. Dorfman, J.H. Modeling multiple adoption decisions in a joint framework. Am. J. Agric. Econ. 1996, 78, 547–557. [Google Scholar] [CrossRef]
  29. Saxton, K.E.; Rawls, W.J. Soil water characteristic estimates by texture and organic matter for hydrologic solutions. Soil Sci. Soc. Am. J. 2006, 70, 1569–1578. [Google Scholar] [CrossRef] [Green Version]
  30. Farmer, D.; Sivapalan, M.; Jothityangkoon, C. Climate, soil, and vegetation controls upon the variability of water balance in temperate and semiarid landscapes: Downward approach to water balance analysis. Water Resour. Res. 2003, 39, 21. [Google Scholar] [CrossRef]
  31. Chatterjee, D.; Dinar, A.; González-Rivera, G. Impact of Agricultural Extension on Irrigated Agriculture Production and Water Use in California. J. Am. Soc. Farm Manag. Rural Appraisers 2019, 1, 65–84. [Google Scholar]
  32. Dinar, A.; Campbell, M.B.; Zilberman, D. Adoption of Improved Irrigation and Drainage Reduction Technologies Under Limiting Environmental Conditions. Environ. Resour. Econ. 1992, 2, 373–398. [Google Scholar] [CrossRef]
  33. California Avocado Commission. Available online: https://www.californiaavocado.com/ (accessed on 23 April 2020).
  34. Escalera, J.; Dinar, A.; Crowley, D. Adoption of Water-Related Technology and Management Practices by the California Avocado Industry. Agric. Resour. Econ. Update 2015, 18, 58. [Google Scholar]
  35. Kohonen, T. Essentials of the self-organizing map. Neural Netw. 2013, 37, 52–65. [Google Scholar] [CrossRef]
  36. Kohonen, T. Self-Organizing Maps; Springer: Berlin, Germany, 2001. [Google Scholar]
  37. Kalteh, A.M.; Hjorth, P.; Berndtsson, R. Review of the Self-organizing Map (SOM) Approach in Water Resources: Analysis, Modelling and Application. Environ. Model. Softw. 2008, 23, 835–845. [Google Scholar] [CrossRef]
  38. Reints, J.; Dinar, A.; Crowley, D. Dealing with Water Scarcity: California Avocado Growers Adopting Water Saving Technologies and Management Practices. UCR SPP Working Paper Series, June, 2017 WP# 02-17. Available online: https://spp.ucr.edu/sites/g/files/rcwecm1611/files/2019-09/082619_Dealing%20with%20Water%20Scarcity_FINAL.pdf (accessed on 25 April 2002).
  39. Faber, B.; University of California, Cooperative Extension, San Diego, CA, USA. Personal Communications, 2015.
  40. Linting, M.; Meulan, J.J.; Groenen, P.J.F.; van der Kooij, A.J. Nonlinear Principal Components Analysis: Introduction and Application. Psychol. Methods 2007, 12, 336–358. [Google Scholar] [CrossRef] [PubMed] [Green Version]
  41. Jolliffe, I.T. Principal Component Analysis, 2nd ed.; Springer: Berlin, Germany, 2002. [Google Scholar]
  42. Hausman, J.A. Specification Tests in Econometrics. Econometrica 2010, 46, 1251–1271. [Google Scholar] [CrossRef] [Green Version]
  43. Ferreyra, R.; Maldonado, P.; Celedón, J.; Gil, P.M.; Torres, A.; Selles, G. Soil Air Content Effects on The Water Status of Avocado Trees. ISHS Acta Hortic. 2008, 792, 291–296. [Google Scholar] [CrossRef]
  44. Gil, P.M.; Bonomelli, C.; Schaffer, B.; Ferreyra, R.; Gentina, C. Effect of soil water-to-air ratio on biomass and mineral nutrition of avocado trees. J. Soil Sci. Plant. Nutr. 2012, 12, 609–630. [Google Scholar] [CrossRef] [Green Version]
  45. Kozlowski, T.T. Responses of Woody Plants to Flooding and Salinity. Tree Physiol. 1997, 17, 490. [Google Scholar] [CrossRef]
  46. Stagakis, S.; Gonzalez-Dugo, V.; Cid, P.; Guillen-Climent, M.L.; Zarco-Tejada, P.J. Monitoring Water Stress and Fruit Quality in an Orange Orchard under Regulated Deficit Irrigation Using Narrow-band Structural and Physiological Remote Sensing Indices. ISPRS J. Photogramm. Remote Sens. 2013, 71, 47–61. [Google Scholar] [CrossRef] [Green Version]
  47. Green, S.R.; Hodson, A.; Barley, M.; Benson, M.; Curtis, A. Crop IR Log—An Irrigation Calculator for Tree and Vine Crops. Viii Int. Symp. Sap Flow 2012, 951, 277–284. [Google Scholar] [CrossRef]
  48. Hofshi, R. Yearbook of the California Avocado Society for the Year 2010; California Avocado Society: Ventura, CA, USA, 2010; Volume 93, pp. 51–71. [Google Scholar]
  49. Schaffer, B.; Wolstenholme, B.N.; Whiley, A.W. The Avocado: Botany, Production and Uses; CABI Publishing: Cambridhe, MA, USA, 2013. [Google Scholar]
  50. Tarjuelo, J.M.; Montero, J.; Carrion, P.A.; Honrubia, F.T.; Calvo, M.A. Irrigation uniformity with medium size sprinklers part II: Influence of wind and other factors on water distribution. Trans. ASAE 1999, 42, 677–689. [Google Scholar] [CrossRef]
  51. Ascough, G.W.; Kiker, G.A. The effect of irrigation uniformity on irrigation water requirements. Water SA 2002, 28, 235–241. [Google Scholar] [CrossRef] [Green Version]
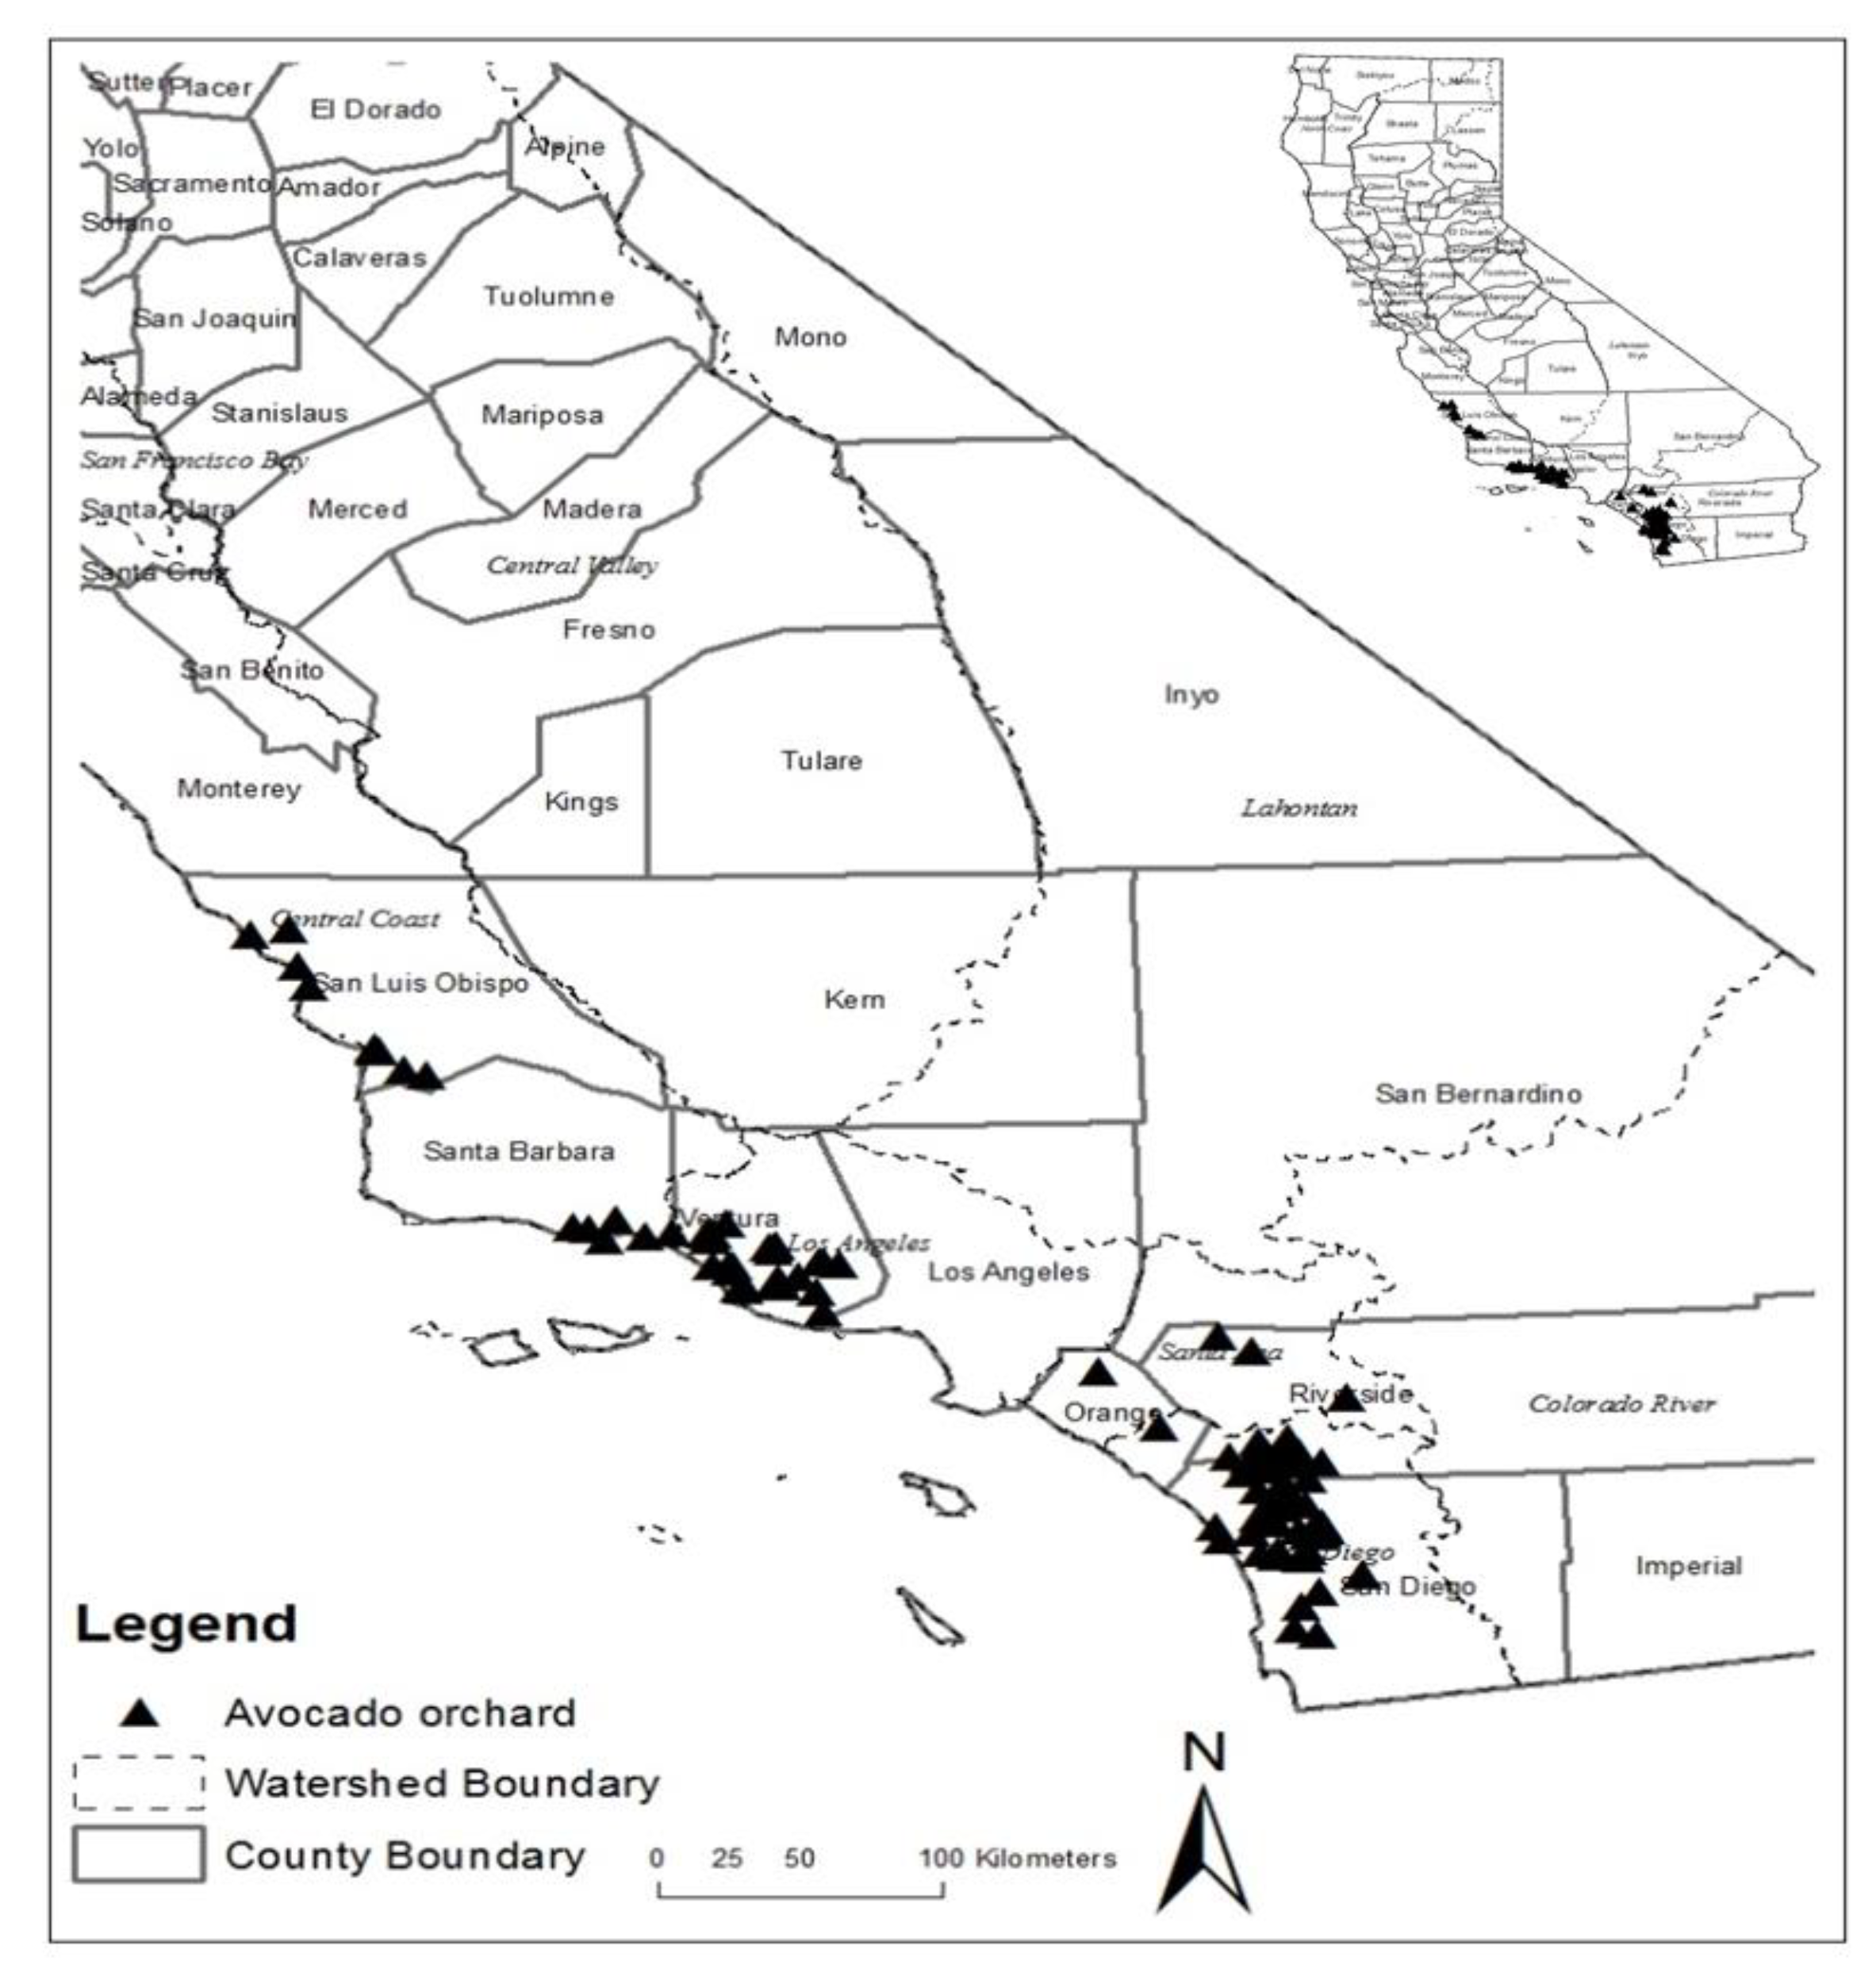
Figure 1. Distribution of Avocado Orchard Owners in California that Responded to the Survey. Watershed names are in italics. Counties are delineated. Each triangle on the map is the location of an orchard that responded to survey.
Sustainability 12 03555 g001
Figure 2. Kohonen Self-Organizing Maps (KSOM) of all adoption variables considered for use in the adoption bundles.
Sustainability 12 03555 g002aSustainability 12 03555 g002b
Figure 3. Multiple Correspondence Analysis (MCA) Coordinate Plot.
Sustainability 12 03555 g003
Table 1. Summary of Explanatory Variables.
Determinant of AdoptionPredictor Variables Used in This StudySourceHypotheses Regarding Impact on Adoption (Holding Everything Else Constant)
Socio-economic characteristicsOperator age[22]Older and full-time growers with more years of experience, higher formal education, higher share of income from agriculture or of a given crop that is analyzed, complex organization types, or original ownership and larger operations and with higher cost of water will be adopters of technologies.
Years of Experience[23]
Formal Education[24]
Ownership Type[6]
Cost of water[9]
Share of Income from Farm (or Avocado)[25]
Farm characteristicsLocation of farm[26]Growers in farms managing greater irrigation complexity will adopt technologies and management practices to help them cope with the difficulties of a more complex irrigation set up.
Soil type, soil quality, topography[26]
Land tenure, full time operators[5]
Farm size[27]
InformationalUse of cooperative extension[22,23,27]Growers who use cooperative extension and place a high level of importance on cooperative extension will adopt water conservation technologies.
Table 2. Distribution of Avocado Growers in the Sample.
SampleCalifornia *
California CountyNo. of GrowersTotal Avocado (Acres)Total Farm Land (Acres)No. of GrowersTotal Avocado (Acres)
Orange3 (3)94 (2)1002UnknownUnknown
Riverside15 (12)734 (19)836Unknown6127 (11)
San Diego51 (41)1036 (26)19052000 (38)20643 (38)
Santa Barbara12 (10)304 (8)1641000 (20)5707 (11)
San Luis Obispo7 (6)151 (4)2536135 (4)4214 (8)
Ventura35 (28)1580 (41)49972000 (38)17089 (32)
Total123 (100)3899 (100)114405135 (100)53780 (100)
* Approximately. California land and number of growers by county are from [33] and personal interviews with UC Cooperative Extension agents. In parenthesis are shares of county growers and total avocado acres of total California values. Water efficient Technologies and Management Practices Used in the Empirical Models.
Table 3. Distribution of Bundles in the Sample.
BundleNumber of GrowersPercent in Dataset
02016.26
11512.19
24334.95
34536.58
Total123 100
Table 4. Descriptive Statistics of Variables Included in the Analysis.
VariableObs.MeanStd. Dev.MinMaxDeterminants
of Adoption
Water Audit1230.4950.50201Technologies Adopted
Soil Moisture by Feel1230.5280.50101
CIMIS1230.2840.45301
Soil Moisture with Gypsum Block1230.0240.15401
Soil Moisture with Tensiometer1230.3170.46701
Calendar Irrigation1230.1300.33701
Management of Tree Canopy1230.4790.50101
Pressure Compensating Sprinkler1230.4390.49801
Farm Acres12393.007214.93911100Farm Characteristics
Avocado Acres12331.69972.5141550
Riverside County1230.1220.32901
San Diego County1230.4150.49501
Irrigation Complexity1230.4051.01308
Agricultural water rate ($/hcf) a1232.1900.29803.93
Age of owner12361.91011.5022788Farmer Characteristics
Formal education1234.0931.19216
Years’ experience12319.83014.223158
Share income from avocado1230.1620.27801
Original Owner1230.4220.49601
Use of Cooperative Extension1234.0981.19715Information Factors
Leaf Sampling1230.7960.40401
Follow lab recommendation1231.8611.14701
Test Irrigation Water1230.5280.50101
a Note: hcf = hundred cubic feet. A term typically found in a grower’s water bill. 1 cf = 0.0283 cubic meters.
Table 5. Logit Regression Models.
Dependent Variable = Adoption as a Binary Choice of Any Saving Technology or Management Practice
VariablesLogit Model 1Logit Model 2
Owner Operated0.259 (1.165)-
Grow crops other than avocado?-−1.188 * (0.739)
Farm Acres0.00381 (0.00440)-
Avocado acres-0.00248 (0.00635)
Riverside County2.128 ** (1.510)-
San Diego County1.321 (0.851)-
Cost of irrigation water-0.358 (0.339)
Irrigation Complexity−7.08 ** (0.332)-
Owner Age−0.0814 ** (0.0323)−0.068 ** (0.0297)
Education−0.222 (0.297)0.0163 (0.244)
Share income from avocado15.44 * (8.899)9.180 ** (4.595)
Cooperative Extension Use1.185 *** (0.392)1.454 *** (0.464)
Constant3.867 (2.513)2.794 (2.279)
LR chi2(9)58.5550.99 ***
Prob>chi20.000 ***0.000 ***
Pseudo R20.5360.467
Log likelihood−25.321−29.109
Observations123123
Note: Standard errors in parentheses. *** p < 0.01, ** p < 0.05, * p < 0.1.
Table 6. Multinomial Logit Regression.
Dependent Variable: Adoption of Water Efficient Technologies and Management Practices Bundles as Multinomial Logit Framework
VariablesBundle 1Bundle 2Bundle 3
Owner operated0.332
(1.340)
0.0745
(1.380)
0.249
(1.229)
Farm acres0.00368
(0.00530)
5.77 × 10⁻⁵
(0.00671)
0.00548
(0.00528)
Riverside County2.794
(2.427)
4.989 **
(2.462)
5.302 **
(2.322)
San Diego County0.0719
(1.042)
0.541
(1.202)
2.598 ***
(0.979)
Irrigation complexity−0.277
(0.345)
−0.802
(0.506)
−1.163 **
(0.518)
Owner age−0.0573
(0.0383)
−0.113 **
(0.0441)
−0.106 ***
(0.0363)
Education−0.146
(0.333)
0.804 **
(0.389)
0.131
(0.344)
Share income from avocado14.86 *
(8.938)
15.05 *
(9.005)
14.91 *
(8.914)
Cooperative extension use1.016 **
(0.418)
0.867 *
(0.469)
1.415 ***
(0.421)
Constant1.237
(3.031)
7.176 **
(3.338)
2.318
(2.773)
LR Chi2 (27)102.230
Prob>chi20.000 ***
Psuedo R20.378
Log likelihood−83.965
Number of observations (Bundle 0 with 20 Obs.)154345
Note: Standard errors in parentheses. *** p < 0.01, ** p < 0.05, * p < 0.1.