Article

Sustainable Causal Interpretation with Board Characteristics: Caveat Emptor

1
Statistics Discipline, University of Minnesota at Morris, Morris, MN 56267, USA
2
Department of Finance, Ziegler College of Business, Bloomsburg University, Bloomsburg, PA 17815, USA
3
School of Business Administration, Ulsan National Institute of Science and Technology (UNIST), Ulsan 44919, Korea
*
Author to whom correspondence should be addressed.
Sustainability 2020, 12(8), 3429; https://doi.org/10.3390/su12083429
Submission received: 31 March 2020 / Revised: 15 April 2020 / Accepted: 20 April 2020 / Published: 22 April 2020
(This article belongs to the Section Economic and Business Aspects of Sustainability)

Abstract

:
The study of a causal interpretation of board and firm characteristics, that is, a hidden dependence relationship on the causal inference among board and firm characteristics, is an important but unaddressed issue in the corporate governance literature. Using diverse advanced statistical methods and focusing on Tobin’s Q, we find that (i) not all board variables previously found to be significant are “robust” to latent variable data analysis, and (ii) those variables that are consistently significant differ markedly in latent structural equation analysis. Our analyses provide researchers interested in board issues with an important caveat: Focusing on the dependence structure of available board variables affected by latent factors may introduce a new horizon in corporate finance.

1. Introduction

In corporate governance literature, a wide range of research has been conducted in examining relations of board characteristics and firm performance, corporate events, or another firm governance structures. Authors investigate an impact of a specific board characteristic on an overall measure of firm performances, such as Tobin’s Q [1,2,3], those surrounding corporate events, such as CEO turnover [4,5,6], or another corporate governance structure, an executive compensation [7,8,9]. The most commonly used board characteristics are board size [1,2,3] and board independence [3,4,5,10,11,12,13]. Since late the 2000s, additional board characteristics have been introduced: Directors with different areas of expertise and experiences [10,14,15,16], foreign directorships [17,18], female director positions [19,20,21], and nominations of certain numbers of outside directors over 69 years [9].
However, the effect on firm value varies across studies with different board structures. Board independence, the presence of outside directors, is typically considered to strengthen director monitoring of managers and increase firm value [4,5,13,14]. On the other hand, Bhagat and Black [11] find no association between board independence and Tobin’s Q, which is a proxy for firm value, whereas Yermack [3] finds a negative association.
There are several explanations for the inconsistent findings mentioned above. First, different model specifications, including selection of variables and functional forms, are used. Second, measures of board characteristics are often constructed differently. Third, as new board variables are introduced, we may not fully appreciate how they interact with each other and with standard board characteristics.
On the assumption that board structures are truly important, this “author-based” omission of variables would distort the effect of the main variable [22] and result in conflicting evidence. In general, empirical evidence is sensitive to model specification, control variables, and sample size. Thus, it is important to understand the associations between different board variables and how those associations could influence what is observed.
This study addresses those issues by considering a comprehensive set of board characteristics from prior studies [3,8,14,17,19]. This paper provides an integrated view by investigating in higher dimensions of board characteristics suggested in the aforementioned prior work. We shed light on the hidden dependence relationship on the causal inference among board and firm characteristics.
We choose Tobin’s Q as a measure of firm performance among other candidates, return on assets (ROA) or return on equity (ROE), because Tobin’s Q is a measure commonly used in the literature [1,2,3]. Secondly, we control for ROA in regression analysis on Tobin’s Q. Finally, factor analysis includes Tobin’s Q and ROA as one factor indicating firm performance; Tobin’s Q has a larger factor loading. Thus, we select Tobin’s Q as a measure for firm performance.
Our study contributes to the corporate governance literature in several ways. First, we include eight well-known board characteristics and find which board variables remain significant to firm value. Second, we eliminate the endogeneity issue by including an overall set of board structures and firm characteristics with an advanced statistical method, the Gaussian copula marginal regression (GCMR). We suggest which board structures are robust and sustainable in the relationship between firm value and board structure. Third, we identify causal inferences among board structures and firm characteristics through latent variable analysis, including structural equation modeling (SEM) and a directed acyclic graph (DAG) with GCMR. We find that board structures have a significant negative relationship with the firm performance factor. With an error dependence structure through latent structural equation analysis, the significant relationship between firm performance and board structure is driven away into the opposite direction for the majority of board characteristics. We further find a dependent relationship between board characteristics.
This study is the first to analyze and investigate causal relationships within board-level and firm characteristics using advanced statistical methods. We also explain the controversial evidence of the association between board/director characteristics and firm value by considering eight main board/director characteristics from prior literature.

2. Literature Review

In a standard principal-agent framework, the presence of outside directors, that is, board independence, is essential for monitoring firms. However, empirical findings on board independence vary across studies. Borokhovich et al. [4], Byrd and Hickman [12], Cotter et al. [13], and Weisbach [5] find that independent boards are value-relevant under different conditions. Bhagat and Black [11] find no association between board independence and Tobin’s Q, while Yermack [3] finds a negative association.
In addition to board independence, researchers have studied the association between board size and firm value. Board size, the total number of directors sitting in an organization’s board at a particular time, is often said to be one of the most imperative elements in board structure [1,2,3]. As board size increases, directors are less likely to participate in board-level discussions, because the cost of not participating falls sharply and more effort is required to reach a conclusion. This leads to a greater control by the CEO and reduces board effectiveness. Jensen [23] argues that having fewer than eight or seven board members may likely be difficult to coordinate. On the contrary, Yermack [3] finds that board size is negatively related to firm value, or Tobin’s Q. Using industry-adjusted return on assets (ROA), Eisenberg et al. [1] argue that a large board has difficulty in enjoying the benefits of a higher level of monitoring due to poor decision making. In general, whether a small board alleviates the processing problems and effectively enhances the board monitoring function is more likely to be an empirical question.
More recently, studies have examined how directors with different professional backgrounds are associated with firm value. Fahlenbrach et al. [10], Zhu and Shen [6], and Faleye [8] analyze directors who are CEOs of other corporations, so-called outside-CEO directors—a board director is rarely the CEO of the company as well. Given the fact that large and well-known companies tend to invite active CEOs of other companies to their boardrooms, Fahlenbrach et al. [10] find that appointing outside CEO directors has no significant effect on a firm’s operating performance, while stock price reactions are more favorable to an appointment of an outside CEO director than they are to an appointment of an outside non-CEO director. Faleye [8] finds that firms with more outside CEO directors award a higher compensation to their CEO and that both turnover and turnover–performance sensitivity are lower.
Another professional background of boards studied in corporate governance is that of directors with financial expertise [14,15]. These directors are considered to perform better in management advising, as they have specific knowledge in key areas. Thus, directors with financial experience may have an influence on corporate governance. Guner et al. [14] examine how directors with financial expertise influence corporate policies, specifically on financing investment with bank loans. Faleye [8] finds that boards whose directors have financial expertise exhibit less CEO turnover than boards with other directors. When evaluating the structure of a board of directors, the variation in governance matters between professionally managed firms and family firms. It is likely that companies with family directors in their boards are less likely to include incentive-based plans, and are also less likely to have higher levels of compensation [7]. In addition, the presence of family directors is positively associated with corporate social responsibility (CSR) reporting [24].
While board independence and board size are traditional board characteristics that have been well studied, board diversity—age, nationality, and gender of directors—has emerged as another board characteristic. Yermack [16] addresses the relationship between director age and CEO departure, and shows that the chance of CEO departure is associated with the average age of the directors. Whether firms benefit from foreign directors on their boards, especially in situations of merger with and acquisition of a foreign firm, is interesting, and prior studies show the effectiveness of foreign directors in the role [17,18]. In the same manner, female directors are considered to provide efficiency in board monitoring: They have a strong tendency of hiring high-quality auditors to protect their reputation [19] and significantly lower turnover rates than male directors [21]. One area of effectiveness of female directors is that female directors could introduce diverse ideas and experiences, and could reduce the agency cost generated by information asymmetry [20].
We also present certain firm characteristics related to firm value. A related strand of literature, starting with Yermack [3], suggests that boards are chosen to maximize the provision of important resources, such as log(Sales), to the firm. Diversified firms operate in multiple segments, in other words, business segments. Mature firms or firms that have been listed earlier tend to be more complex in their board structure [9]. Firms with high capital expenditure, measured by capital expenditure to sales, could demand greater advising requirements from their board of directors [8,9].

3. Data and Variables

The sample consists of director and board information from RiskMetrics for the period 1998–2013. We obtain daily stock information from the Center for Research in Security Prices (CRSP) database and annual firm accounting information from the COMPUSTAT North America database. We exclude financial and utility firms, as well as missing observations. The resultant sample consists of 13,954 firm-year observations.
Table 1 displays summary statistics of the sample. Tobin’s Q for an average firm is 2.03, and firms have, on average, about nine directors on the board, of whom 72% are independent, 8.8% are outside CEOs, 10.4% are female, and 2% are foreign directors. The directors in our sample are, on average, aged about 60, and firms tend to have no directors with financial expertise. Lastly, our sample firms tend to be listed for, on average, more than 24 years, and have more than two business segments. Table A2 in Appendix A provides the Pearson correlation coefficients of 14 variables. From the correlation table, we observe that board size, log(Sales), and firm age are positively correlated with each other.

4. Research Methods

4.1. Gaussian Copula Marginal Regression

We employ a novel statistical methodology, GCMR [25], to investigate and compare current research results on the association between board characteristics and firm value. GCMR captures the relationship between marginal cumulative distributions, where the correlation matrix of an error term is estimated as an autoregressive moving-average (ARMA) time series model and the error dependence structure is expressed in the correlation matrix of a multivariate Gaussian distribution [25,26]. Let F(∙|xi) be a marginal cumulative distribution conditional to a vector of covariates xi. Considering a set of n dependent variables, Yi, the joint cumulative distribution function in the Gaussian copula regression is defined by
Pr(Y1y1, …, Ynyn) = Φn {ε1, …, εn;P},
where εi = Φ−1 {F(yixi)}. Φ(∙) and Φn(∙;P) indicate the univariate and multivariate standard normal cumulative distribution functions, respectively. P is the correlation matrix of the Gaussian copula. The following Gaussian copula model links each variable, Yi, to a vector of covariates, xi [27]:
Yi = h(xi,εi),
where εi indicates a stochastic error. The Gaussian copula regression model assumes that h(xii) = F−1{Φ(εi)|xi} and ε follows a multivariate standard normal distribution with the correlation matrix of P.

4.2. Structural Equation Modeling and Factor Analysis

We then apply the principal component analysis (PCA) to find a visual relationship between firm and board characteristics. We divide firm and board characteristics into two homogeneous groups (factors) in terms of eigenvalues and eigenvectors of the PCA with respect to those characteristics. Thus, we visualize the firm and board characteristics with the first two PCA components. In addition, we use SEM to identify the complex relationships between independent and dependent variables, or between observable and latent variables [27,28,29,30]. SEM is used to model the causal relationships between variables, between factors, or between variables and factors. To determine the SEM structure of our variables, we employ latent variable models for Factors 1 and 2, which show the regression coefficients between variables. We also compute both covariances and variances of factors and variables to examine their causal relationships (see Table A3 in Appendix A).
In addition, we employ factor analysis to find the causal interpretation of the variables. Factor analysis seeks the factors that explain the relations among observed variables using their covariance structures [31]. In the factor analysis model, most observed variables could be clustered by their covariance values. When the observed variable vector X has a mean vector μ and covariance matrix Σ, we define the factor analysis model as follows [31]:
X − μ = LF + ε(1),
where L is the factor loading matrix, F represents the factors, and ε represents the error. In our research, X is the firm and board characteristic (variable) vector, and F is the unobserved (latent) variable vector, which represents the abstract confounding variables of X. From the factor analysis, we compute the loadings of three factors to visualize their relationships with the variables.

4.3. Graphical Model

We use the PC (named after its authors, Peter and Clark) algorithm [32] function in the R package “pcalg” to find the causal structure for our variables. We assume that no variables are hidden and there are no feedback loops in the underlying causal system. The causal structure for such a system can be represented by a DAG, where each node represents a variable and each directed edge represents a direct cause [33,34]. Each linkage in the DAG means a linear regression model. That is, the independent variable (characteristic) is located at the origin, and the dependent variable (characteristic) is at the point of the direct arrow. In this paper, we evaluate the relationship by fitting the copula regression model to our data for a statistical test of the coefficients.

5. Empirical Analysis and Results

The general model we use is as follows:
Tobin’s Qj = αj + βx,j X + βa,j A + εj for j = 1,2,…T,
where Tobin’s Q represents firm value, computed annually, X is an explanatory variable representing board characteristics, and A is the control for firm accounting information. T is the total number of years in the sample period. We consider firm and year fixed effects throughout our analyses in this study.

5.1. Gaussian Copula Marginal Regression Results

We first consider a regression model incorporating all of the eight board characteristics (board size, independent directors, director age, family directors (1/0), outside CEO directors, directors with financial expertise, female directors, foreign directors) with controls for firm characteristics.
Tobin’s Q = Intercept + β1 Board Size + β2 Independent Directors + β3 Director Age + β4 Family Directors + β5 Outside CEO Directors + β6 Female Directors + β7 Foreign Directors
+ β8 Directors with Financial Expertise + β9 Log(Sales) + β10 Capital Expenditure to Sales + β11 Return on Assets + β12 Firm Age + β13 Business Segments + ε
Based on the Akaike information criterion (AIC), we select an optimal error correlation matrix model of ARMA (1, 1) for four different combinations of p and q: (0, 0), (0, 1), (1, 0), and (1, 1). Table 2 shows the result of the ARMA model selection and presents the GCMR model estimation of Tobin’s Q (c_q) with eight board characteristics and controls for firms with an error dependence structure of ARMA (1, 1).
Among the 13 board and firm characteristics, most variables, except independent directors (v_outsiderpct) and directors with financial expertise (v_financialoutpct), have a statistically significant association with firm value, or Tobin’s Q (c_q). We observe that board size (v_bsize), director age (v_age), foreign directors (v_foreignpct), log(Sales) (c_lnsale), firm age (c_firmage), and business segments (c_segment_bus) have a statistically significant negative association with firm value at the 1% level. Family directors (1/0) (v_relativeflag) and female directors (v_femalepct) are negatively related to firm value at the 10% significance level. Outside CEO directors (v_ceodirector), capital expenditure to sales (c_capx_sale), and ROA (c_fichroa) are positively associated with firm value at the 1% significance level.
Thus, after considering eight widely used board characteristics, we do not find much evidence that independent directors and directors with financial expertise affect firm value. However, we do confirm that an increase in board size decreases firm value, which is consistent with Eisenberg et al. [1] and Yermack [3]. We also observe that having outside CEO directors helps increase firm value, which is consistent with Faleye [8]. In addition, on average, having older directors, higher proportions of foreign directors, larger fractions of female directors, and directors with a family member who is a CEO of a company are likely to decrease the firm value.
After observing the overall effect of board/director characteristics on firm value, we analyze causal relationships among firm value, board characteristics, and firm characteristics using various statistical methods.

5.2. Structural Equation Modeling Results

In this section, we examine how board and firm characteristics (including firm value) are associated with each other. We consider all 14 of the variables (eight board variables and six firm variables) in the analysis.
We perform PCA and map all 14 of the variables onto a two-dimensional PCA plot (see Figure 1). After examining Figure 1 more closely, we split the variables into two groups based on the first principal component. Factor 1 contains variables on the right side of the domain: Female directors (v_femalepct), independent directors (v_outsiderpct), log(Sales) (c_lnsale), firm age (c_firmage), director age (v_age), foreign directors (v_foreignpct), board size (v_bsize), and business segments (c_segment_bus). These variables characterize large and experienced companies. We categorize all such variables as Factor 1. Factor 2 includes variables on the left side of the domain: Firm value, or Tobin’s Q (c_q), ROA (c_fichroa), outside CEO directors (v_ceodirector), and capital expenditures to sales (c_capx_sale). We categorize these variables, which characterize high-performance companies, as Factor 2.
Next, we incorporate Factors 1 and 2 into SEM. These two factors are used as latent variable models. Table 3 shows the performance results of SEM. The p-values of both the estimator model and test baseline model are less than 0, confirming the validity of our model. Table 3 reports the comparative fit index (CFI), the Tucker–Lewis index (TLI), AIC, Bayesian information criterion (BIC), the root mean square error of approximation (RMSEA), and the standardized root mean square residual (SRMR) of the model.
Table 4 presents latent variable model estimations for Factors 1 and 2. Parameter estimates, standard errors, and Z-values for statistical significance of the parameters are reported.
The Z-values of all parameters in Table 4, Panel A are larger than 2; thus, the association is statistically significant for all eight firm and board variables in the Factor 1 category. All firm and board characteristics have estimates larger than 0.1, and firm age (c_firmage), director age (v_age), and log (Sales) (c_lnsale) are the top three characteristics explaining for Factor 1. Variables in Factor 1 have traits of large seasoned companies. Thus, firms that are more seasoned in age and have larger sales with relatively older directors do play an important role.
Table 4, Panel B shows the latent modeling result for Factor 2. Similarly to Factor 1 in Table 4, Panel A, we find that all four firm and board variables are representatives of Factor 2. The top three characteristics are Tobin’s Q (c_q), ROA (c_fichroa), and outside CEO directors (v_ceodirector). These variables are traits of high-performance companies. Thus, we conclude that independent directors with outside CEO positions (v_ceodirector) play a significant role in high-performance companies.

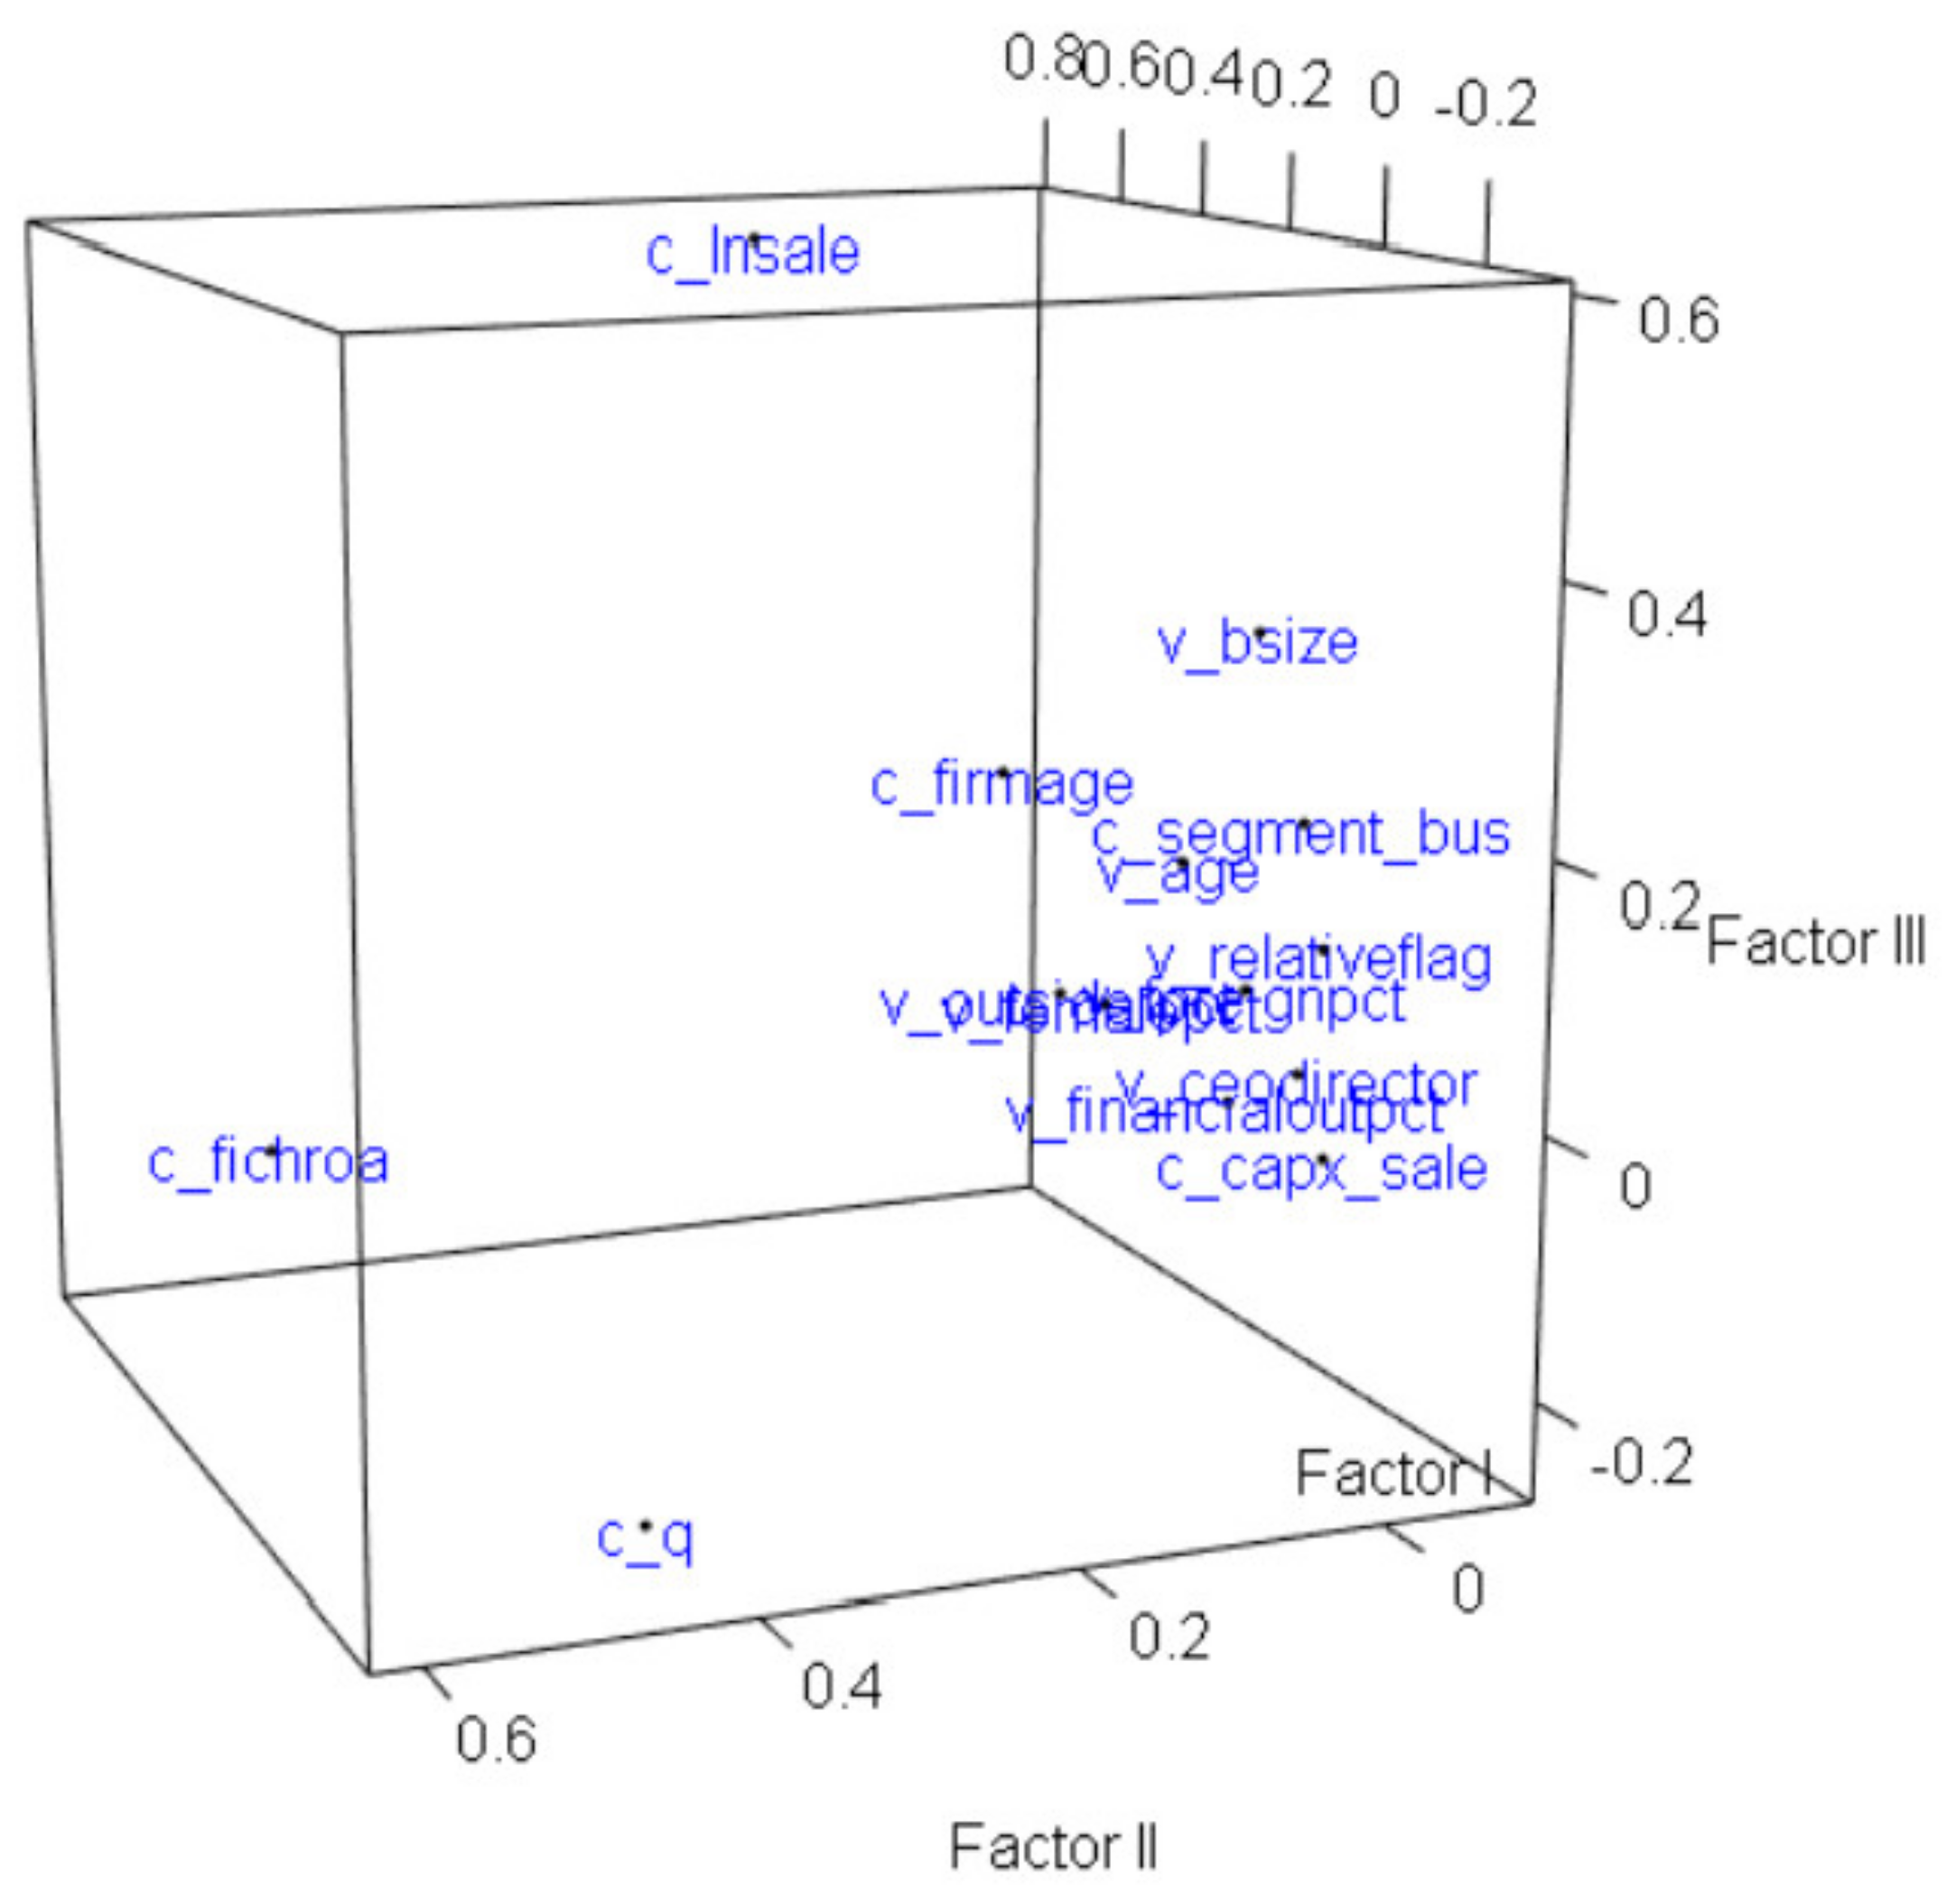
5.3. Factor Analysis Results

We cluster firm and board characteristics are into three factors, instead of two factors, based on their covariance. In this process, a characteristic or a variable is used to explain the factor with the largest factor loading. For example, log (Sales) explains Factor 3 because its factor loading (0.6) is the largest in Factor 3. Factor 1 is explained by four variables: Firm age (c_firmage), independent directors (v_outsiderpct), director age (v_age), and outside CEO directors (v_ceodirector). Factor 2 contains two variables: ROA (c_fichroa) and Tobin’s Q (c_q). Factor 3 includes two variables—log (Sales) (c_lnsale) and board size (v_bsize)—for its descriptions. Among the 14 variables, eight are used to explain three factors; the remaining six (family, female, and foreign directors, directors with financial expertise, capital expenditures to sales, and business segments) are not selected.
Factor 1 characterizes seasoned or experienced firms, which are likely to be listed earlier, have larger sales, have a higher proportion of independent directors, have directors who are aged, and have fewer directors with CEO positions in other companies. Factor 2 captures firm value and firm performance. Factor 3 characterizes large firms, as they tend to have higher sales and larger boards.
The factor analysis separates our variables in a more interpretable way compared to SEM in Section 5.2, such that Factor 1 and Factor 3 capture how board characteristics and firm characteristics are related to each other, whereas Factor 2 explains firm performance through ROA and Tobin’s Q.
Figure 2 shows a three-dimensional visualization of the association of the 14 board and firm variables based on the three factors.
Table 5 represents factor loadings of firm and board characteristics. We observe that the loadings for Factors 1 and 2 tend to have the opposite signs, especially for board-level variables. This implies that most of the board-level variables, except outside CEO directors and female directors, are negatively associated with the factor representing firm performance and firm value.
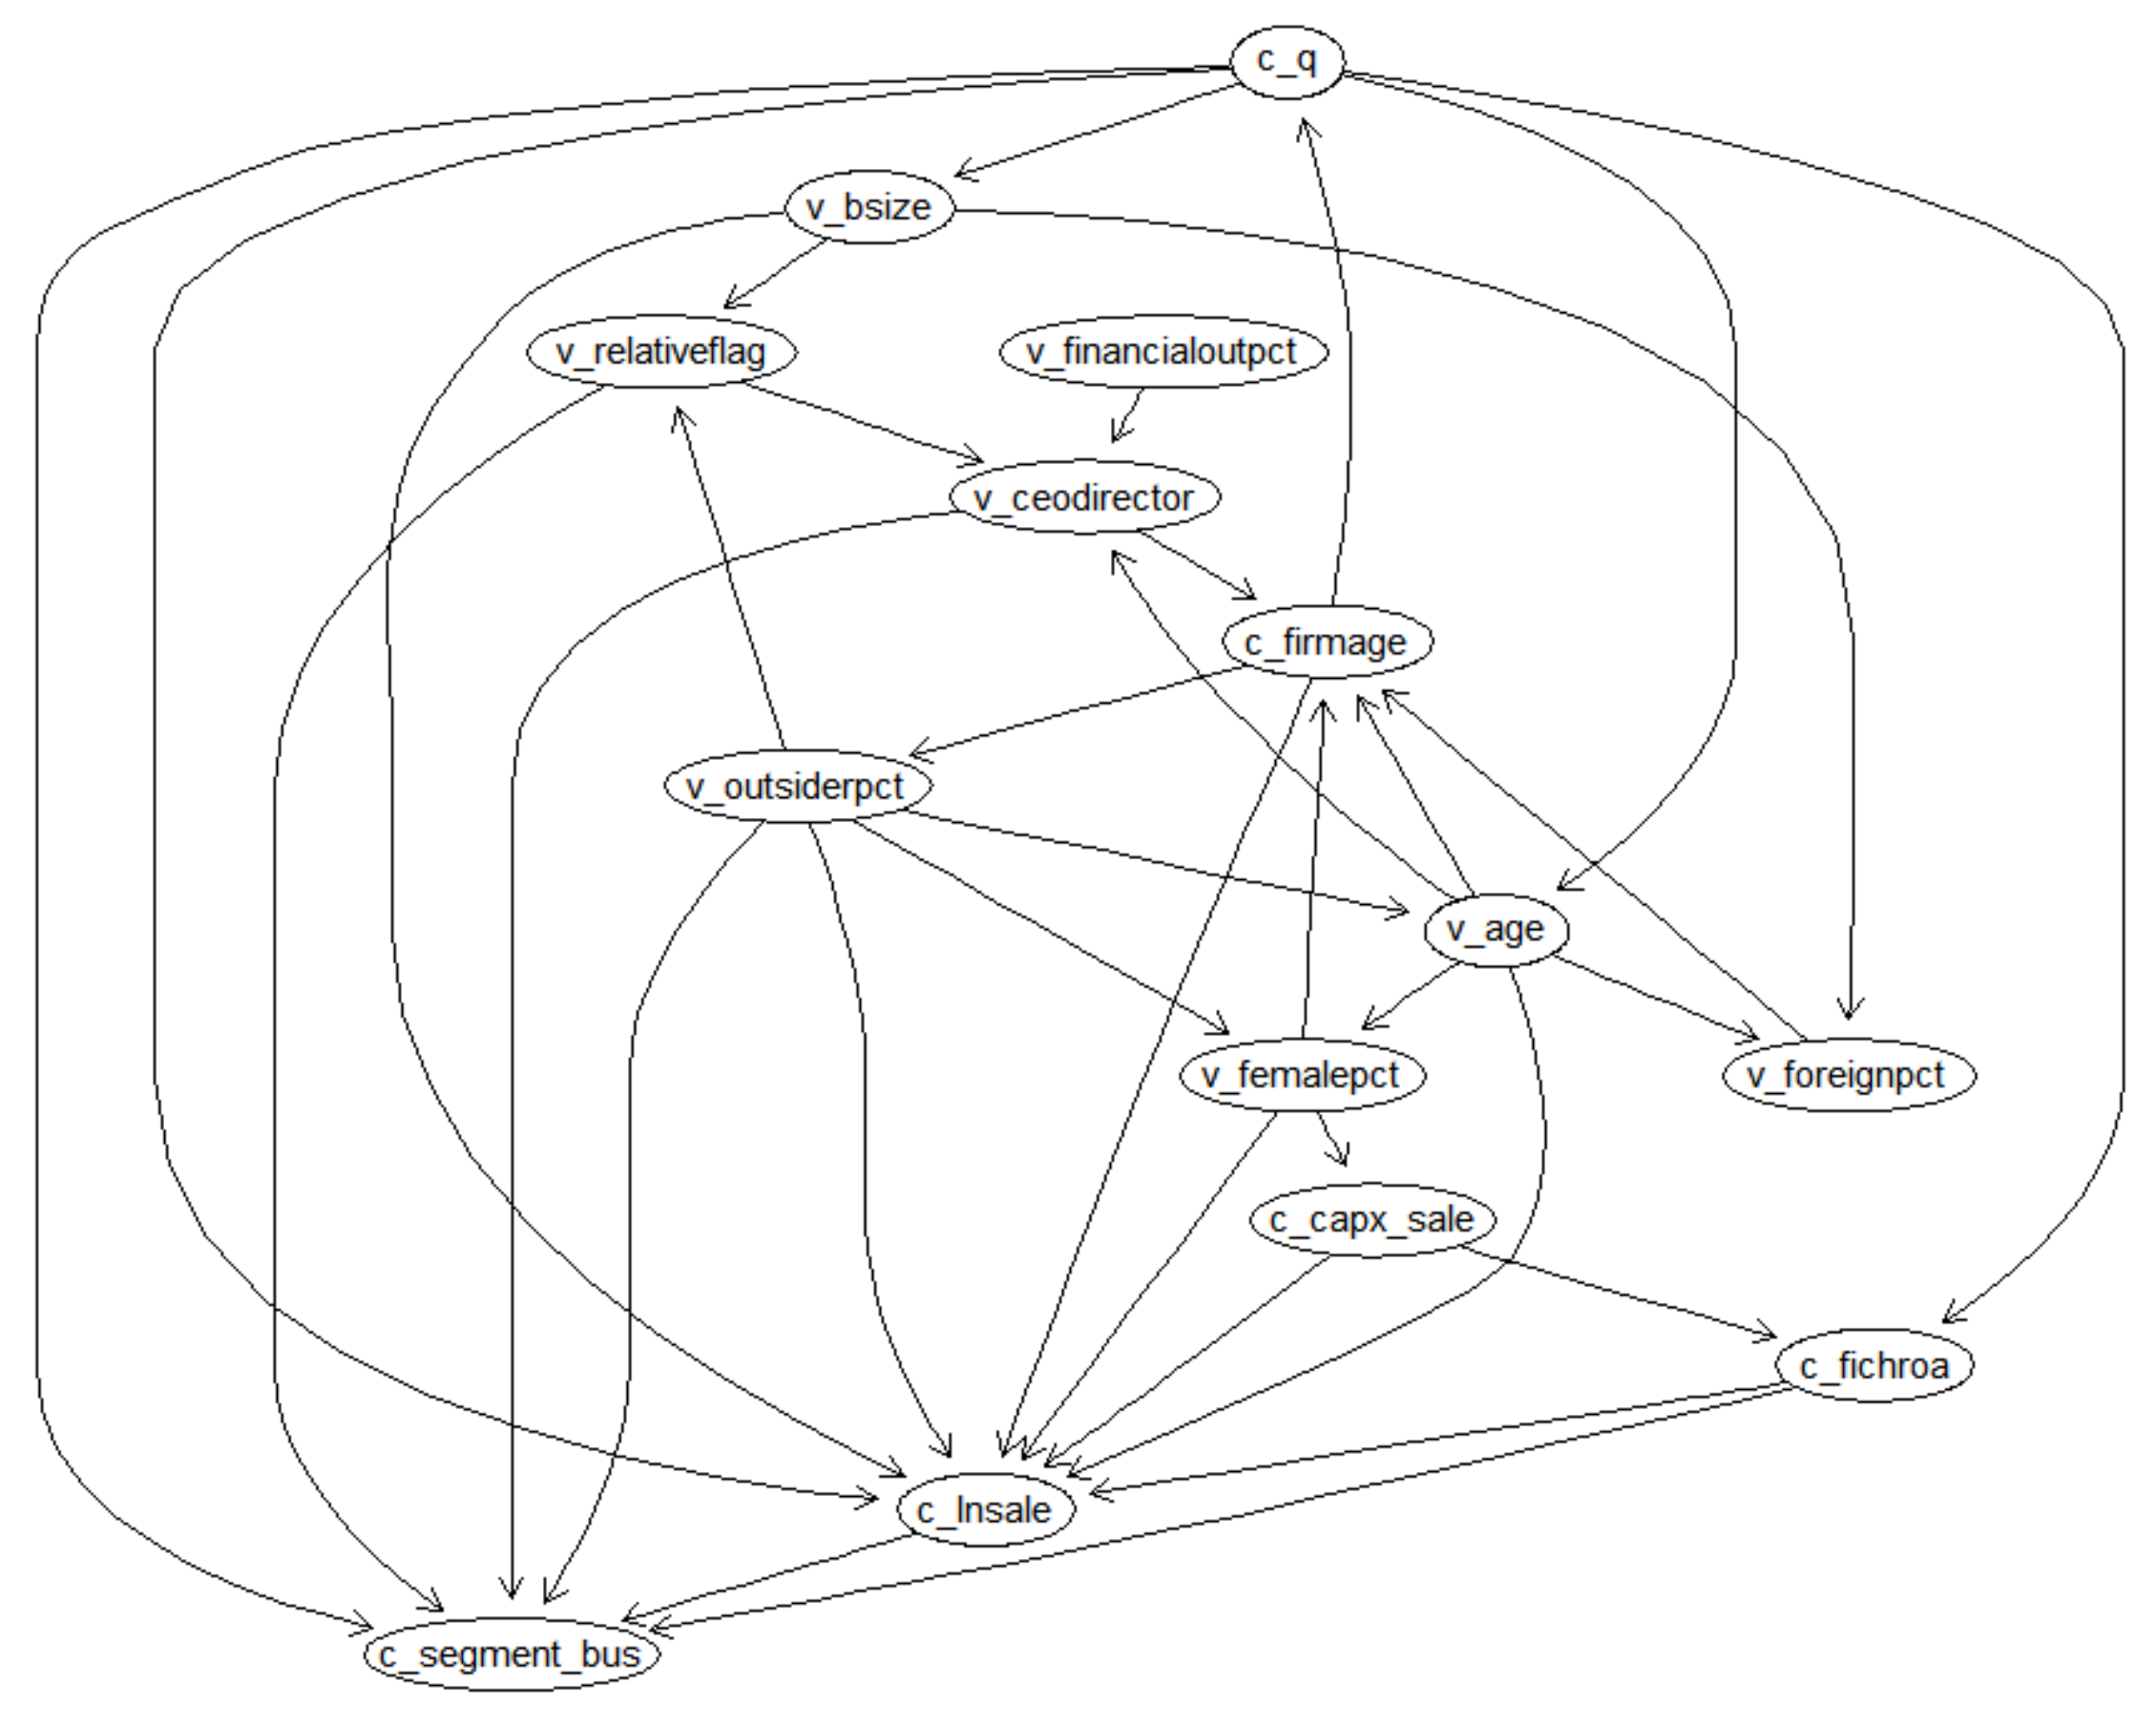
We move on to the graphical approach by constructing a DAG to examine causal inferences among firm value, board variables, and firm characteristics.

5.4. Graphical Model Results: DAG with GCMR

To further investigate the relationships among the eight board and six firm characteristics, including firm value, we construct a DAG. Figure 3 plots the DAG of the 14 variables. The explanatory variable is located at the origin and the dependent variable at the point of the arrows.
From Figure 3, we select three terminal nodes: Business segments (c_segment_bus), log (Sales) (c_lnsale), and firm age (c_firmage). We then construct three GCMR models by defining the terminal node as the response variable and the nodes with directed edges, each of which represents a direct cause, as predictor variables.
First, in Model 1, we construct a GCMR model where the business segment (c_segment_bus) is the dependent variable and Tobin’s Q (c_q), family directors (1/0) (v_relativeflag), outside CEO directors (v_ceodirector), independent directors (v_outsiderpct), log (Sales) (c_lnsale), and ROA (c_fichroa) are explanatory variables.
Model 1: Business Segments = Intercept + β1 Tobin’s Q + β2 Family Directors (1/0)
+ β3 Outside CEO Directors + β4 Independent Directors + β5 Log(Sales) + β6 Return on Assets + ε.
Table 6 shows the result of selecting p and q for an optimal ARMA model based on AIC criteria among four different combinations of p and q: (0, 0), (0, 1), (1, 0), and (1, 1). Both ARMA (0, 1) and ARMA (1, 0) turn out to be the best models with minimum AIC values.
Table 6 also presents the estimation results of the GCMR model of business segments (c_segment_bus) as a dependent variable with ARMA (0, 1) and ARMA (1, 0) error dependence structures. In both models, all variables—Tobin’s Q (c_q), family directors (1/0) (v_relativeflag), outside-CEO directors (v_ceodirector), independent directors (v_outsiderpct), log (Sales) (c_lnsale), and ROA (c_fichroa)—remain statistically significant at the 5% level. Tobin’s Q (c_q) and ROA (c_fichroa) are negatively related to business segments (c_segment_bus), and the other four variables are positively related to business segments (c_segment_bus). The sigma dispersion parameter is statistically significant at the 5% significance level. From Table 6, we observe a reverse-causal relationship for Tobin’s Q and business segments. Firms with larger firm value and ROA tend to have lower numbers of business segments. We also find that firms with greater fractions of independent directors, larger sales, greater proportions of outside CEO directors, and directors whose relatives are CEOs of the same company are likely to have a larger number of business segments on average.
In Model 2, we construct a GCMR model where log (Sales) (c_lnsale) is the dependent variable and Tobin’s Q (c_q), board size (v_bsize), independent directors (outsiderpct), firm age (v_firmage), female directors (v_femalepct), capital expenditures to sales (c_capx_sale), director age (v_age), and ROA (c_fichroa) are explanatory variables.
Model 2: Log(Sales) = Intercept + β1 Tobin’s Q + β2 Board Size + β3 Independent Directors + β4 Firm Age + β5 Female Directors + β6 Capital Expenditures to Sales + β7 Director Age + β8 Return on Assets + ε,
where Independent Directors and Female Directors represent proportions of outside directors and female directors, respectively.
Table 7 shows the results of selecting p and q for an optimal ARMA model based on AIC criteria for four different combinations of p and q: (0, 0), (0, 1), (1, 0), and (1, 1). ARMA (1, 1) is selected as the best model with the minimum AIC value.
Table 7 also presents the estimation results of the GCMR model of log (Sales) (c_lnsale) as a dependent variable with an error dependence structure of ARMA (1, 1). All variables—Tobin’s Q (c_q), board size (v_bsize), independent directors (outsiderpct), firm age (v_firmage), female directors (v_femalepct), capital expenditures to sales (c_capx_sale), director age (v_age), and ROA (c_fichroa)—remain statistically significant at the 5% level. Tobin’s Q (c_q) and capital expenditures to sales (c_capx_sale) are negatively related and the other six variables are positively related to log (Sales) (c_lnsale). The sigma dispersion parameter is statistically significant at the 5% significance level. Firms are likely to have lower sales for those with larger firm value and capital expenditures to sales, on average. Firms tend to have larger sales on average as they are listed earlier and have larger ROA. Also, a company with more directors, more fractions of outsiders and female directors, and older directors has larger sales on average.
In Model 3, we construct a GCMR model where firm age (c_firmage) is the dependent variable and outside-CEO directors (v_ceodirector), female directors (v_femalepct), director age (v_age), and foreign directors (v_foreignpct) are explanatory variables.
Model 3: Firm Age = β1 Outside CEO Directors + β2 Female Directors + β3 Director Age + β4 Foreign Directors + ε,
where Outside CEO, Female, and Foreign Directors represent the proportions of the respective directors.
Table 8 shows the result of selecting p and q for an optimal ARMA model based on AIC criteria among four different combinations of p and q: (0, 0), (0, 1), (1, 0), and (1, 1). ARMA (1, 1) is selected as the best model with the minimum AIC value.
Table 8 also presents the estimation results of the GCMR model of firm age (c_firmage) as a dependent variable with the ARMA (1, 1) error dependence structure. All variables—outside CEO directors (v_ceodirector), female directors (v_femalepct), director age (v_age), and foreign directors (v_foreignpct)—remain statistically significant at the 5% level. The outside CEO directors (v_ceodirector) variable is negatively related and the other three variables are positively related to firm age (c_firmage). The sigma dispersion parameter is statistically significant at the 5% significance level. An average firm tends to be listed earlier if the company has lower proportions of outside CEO directors, greater fractions of female and foreign directors, and directors who are aged.

6. Discussion and Conclusions

In this study, we investigate and find the causal relationships of board and firm characteristics, which have not been addressed in corporate governance. We further reconcile conflicting evidence from prior literature, especially on effectiveness of board size [1,2,3] and independent directors [3,5,11,13] in firm performance.
After considering eight widely used board characteristics in corporate governance, we find evidence (1) that the coefficient board size supports the ineffectiveness of large boards, consistent with Eisenberg et al. [1] and Yermack [3]; (2) that independent directors have no significant effect on firm value, consistent with Bhagat and Black [11]; (3) that outside CEO directors show a positive impact on firm value, supporting the advising and enhancing role of outside CEO directors [8]; (4) that there is no significant impact of directors with financial expertise on firm value; (5) that presence of a director with a CEO as a family member has a significant negative effect on firm value, consistent with prior studies [7,24]; (6) that on average, the more diversified the board is in terms of director age, nationality, and gender, firm value measured by Tobin’s Q is likely to decrease significantly. These results are different from the expectations of effectiveness of directors with financial experience [14,15], foreign directors [17,18], and female directors [19,20,21].
To observe the causal relationship in firm value, board characteristics, and firm characteristics, we use various methods, such as PCA, SEM, factor analysis, and graphical modeling with GCMR. We visualize the directional dependence of board and firm information and find that board information and firm information are related with each other in a more complex way.
First, factor analysis shows that loadings of Factor 1 and Factor 2 generally have opposite signs. Specifically, board-level variables, other than outside CEO directors and female directors, have a negative effect on the firm performance factor. This finding is different from what we observed in Section 5.1. We conclude that not all board variables remain robust in latent variable data analysis.
Second, the DAG with GCMR shows three main causal inferences among board- and firm-level variables. The number of business segments is dependent on existence of directors with CEOs in their family and proportions of outside CEOs and independent directors. The sales amount of a firm is dependent on size of the board, proportions of independent and female directors, and directors’ ages. Lastly, the age of a firm is dependent on proportions of outside CEO, female, and foreign directors. In conclusion, we find that identifying causal interpretations between board and firm information is important in corporate governance literature and specifically in studying the effectiveness of board structure on firm performance.

Author Contributions

J.-M.K. supervised, performed econometric analyses, and reviewed the draft. C.J. collected and analyzed the data and wrote original draft. H.H.H. analyzed data, wrote the original draft, and reviewed and edited the draft. The authors contributed equally to this work. All authors have read and agreed to the published version of the manuscript.

Funding

This research was funded by UNIST (Ulsan National Institute of Science and Technology) (Grant No. 1.190143.01).

Conflicts of Interest

The authors declare no conflict of interest.

Appendix A

Table A1. Variable Names.
VariablesVariable NameDescriptions (Sources)Selected Studies
Tobin’s Q (firm value)c_q(Book value of total assets – Book value of equity + Market value of equity)/Book value of total assets: (data6 − data60 + data25 *data199)/data6 (Compustat)Yermack (1996)
Board sizev_bsizeThe number of directors on the board (RiskMetrics)Yermack (1996)
Independent directorsv_outsiderpctA fraction of outside (independent) directors (RiskMetrics)Yermack (1996)
Outside CEO directorsv_ceodirectorA fraction of non-employee directors that are active CEOs (RiskMetrics)Ferris et al. (2003)
Director agev_ageAn average age of directors on the board (RiskMetrics)Faleye (2011)
Independent directors with financial expertisev_financialoutpctA fraction of independent directors whose profession types are in banking or insurance (RiskMetrics)Guner et al. (2008)
Foreign directorsv_foreignpctA fraction of directors whose primary employers’ country of origin is not the US (RiskMetrics)Masulis et al. (2012)
Female directorsv_femalepctA fraction of directors who are female (RiskMetrics)Adams and Ferreira (2009)
Family directorsv_relativeflagAn indicator equal to one if the company’s founding family is present in the board, and zero otherwise (RiskMetrics)Anderson and Reeb (2003)
Business segmentsc_segment_busThe number of business segments (Compustat)Fich and Shivdasani (2006)
Log(Sales)c_lnsaleThe natural logarithm of Sales (data12) (Compustat)Fich and Shivdasani (2006)
Return on assetsc_fichroaNet income/book value of total assets: data172/data6 (Compustat)Masulis et al. (2012)
Firm agec_firmageThe number of years that the firm has been listed in CRSP (CRSP)Fich and Shivdasani (2006)
Capital expenditure to salesc_capx_saleCapital expenditure/sales: data128/data12 (Compustat)Anderson and Reeb (2003)
Table A2. Correlation Matrix.
Tobin’s QBoard SizeIndependent DirectorsDirector AgeFamily DirectorsIndependent Directors with Financial ExpertiseFemale DirectorsForeign DirectorsOutside CEO DirectorsLog (Sales)Capital Expenditure to SalesReturn on AssetsFirm AgeBusiness Segments
Tobin’s Q1.000
Board size−0.0951.000
Independent directors−0.0710.1081.000
Director age−0.1290.1320.1931.000
Family directors−0.0240.101−0.2650.0681.000
Independent directors with financial expertise0.0350.128−0.025−0.238−0.0301.000
Female directors0.0010.3250.239−0.0330.0030.0181.000
Foreign directors0.0030.0910.0670.010−0.004−0.0360.0511.000
Outside CEO directors0.0090.0090.0160.0100.014−0.0250.0180.0411.000
Log(Sales)−0.0850.5890.2020.1400.0160.1160.3780.0910.0131.000
Capital expenditure to Sales−0.022−0.037−0.046−0.010−0.006−0.016−0.1240.030−0.008−0.1081.000
Return on assets0.3970.047−0.004−0.0200.0090.0190.089−0.0120.0030.1180.0171.000
Firm age−0.1030.4070.2410.2310.0050.1480.2220.0660.0160.446−0.0490.0241.000
Business segments−0.1340.1840.0880.1030.0090.0750.051−0.0040.0160.202−0.092−0.0600.2401.000
Table A3. Covariance and Variances of Factor 1, Factor 2, and 12 variables from SEM.
Panel A. Covariance between Two Factors
VariablesEstimateS.E.Z-Value
f1~f2−0.0000.000−10.211
Panel B. Variance of Factors and Characteristics
VariableEstimateS.E.Z-value
v_femalepct0.0020.00081.721
v_outsiderpct0.0070.00076.456
c_lnsale0.0690.00165.189
c_firmage2.5900.09427.647
v_age3.3510.04377.418
v_bsize0.9590.01282.937
v_foreignpct0.0010.00083.364
c_segment_bus0.7800.00983.320
v_ceodirector0.0060.00080.642
c_capx_sale0.0020.00083.313
c_q0.2840.01717.208
c_fichroa0.0040.00065.634
f10.0000.00012.085
f20.0000.0007.183
Note: S.E. indicates standard errors.

References

  1. Eisenberg, T.; Sundgren, S.; Wells, M.T. Larger board size and decreasing firm value in small firms. J. Financ. Econ. 1998, 48, 35–54. [Google Scholar] [CrossRef]
  2. Nguyen, P.; Rahman, N.; Tong, A.; Zhao, R. Board size and firm value: Evidence from Australia. J. Manag. Gov. 2016, 20, 851–873. [Google Scholar] [CrossRef] [Green Version]
  3. Yermack, D. Higher market valuation of companies with a small board of directors. J. Financ. Econ. 1996, 40, 185–211. [Google Scholar] [CrossRef]
  4. Borokhovich, K.A.; Parrino, R.; Trapani, T. Outside directors and CEO selection. J. Financ. Quant. Anal. 1996, 31, 337–355. [Google Scholar] [CrossRef]
  5. Weisbach, M.S. Outside directors and CEO turnover. J. Financ. Econ. 1988, 20, 431–460. [Google Scholar] [CrossRef]
  6. Zhu, D.H.; Shen, W. Why do some outside successions fare better than others? The role of outside CEOs’ prior experience with board diversity. Strateg. Manag. J. 2016, 37, 2695–2708. [Google Scholar] [CrossRef]
  7. Adams, R.B.; Hermalin, B.E.; Weisbach, M.S. The role of boards of directors in corporate governance: A conceptual framework and survey. J. Econ. Lit. 2010, 48, 58–107. [Google Scholar] [CrossRef] [Green Version]
  8. Faleye, O. CEO directors, executive incentives, and corporate strategic initiatives. J. Financ. Res. 2011, 34, 241–277. [Google Scholar] [CrossRef]
  9. Core, J.E.; Holthausen, R.W.; Larcker, D.F. Corporate governance, chief executive officer compensation, and firm performance. J. Financ. Econ. 1999, 51, 371–406. [Google Scholar] [CrossRef]
  10. Fahlenbrach, R.; Low, A.; Stulz, R.M. Why do firms appoint CEOs as outside directors? J. Financ. Econ. 2010, 97, 12–32. [Google Scholar] [CrossRef]
  11. Bhagat, S.; Black, B. The non-correlation between board independence and long-term firm performance. J. Corp. Law 2002, 27, 231–273. [Google Scholar] [CrossRef]
  12. Byrd, J.W.; Hickman, K.A. Do outside directors monitor managers? Evidence from tender offer bids. J. Financ. Econ. 1992, 32, 195–221. [Google Scholar] [CrossRef]
  13. Cotter, J.F.; Shivdasani, A.; Zenner, M. Do independent directors enhance target shareholder wealth during tender offers? J. Financ. Econ. 1997, 43, 195–218. [Google Scholar] [CrossRef]
  14. Guner, A.B.; Malmendier, U.; Tate, G. Financial expertise of directors. J. Financ. Econ. 2008, 88, 323–354. [Google Scholar] [CrossRef] [Green Version]
  15. Vafeas, N.; Vlittis, A. Board executive committees, board decisions, and firm value. J. Corp. Financ. 2019, 58, 43–63. [Google Scholar] [CrossRef]
  16. Yermack, D. Remuneration, retention, and reputation incentives for outside directors. J. Financ. 2004, 59, 2281–2308. [Google Scholar] [CrossRef] [Green Version]
  17. Masulis, R.W.; Wang, C.; Xie, F. Globalizing the boardroom—The effects of foreign directors on corporate governance and firm performance. J. Account. Econ. 2012, 53, 527–554. [Google Scholar] [CrossRef]
  18. Chintrakarn, P.; Tong, S.; Jiraporn, P.; Kim, Y.S. Using geographic density of firms to identify the effect of board size on firm value and corporate policies. SSRN Electron. J. 2019. [Google Scholar] [CrossRef]
  19. Adams, R.B.; Ferreira, D. Women in the boardroom and their impact on governance and performance. J. Financ. Econ. 2009, 94, 291–309. [Google Scholar] [CrossRef] [Green Version]
  20. Pucheta-Martínez, M.C.; Bel-Oms, I.; Olcina-Sempere, G. Female institutional directors on boards and firm value. J. Bus. Ethics 2018, 152, 343–363. [Google Scholar] [CrossRef] [Green Version]
  21. Bennouri, M.; Chtioui, T.; Nagati, H.; Nekhili, M. Female board directorship and firm performance: What really matters? J. Bank. Financ. 2018, 88, 267–291. [Google Scholar] [CrossRef]
  22. Welch, M. The evolution of the employee engagement concept: Communication implications. Corp. Commun. 2011, 16, 328–346. [Google Scholar] [CrossRef]
  23. Jensen, M.C. The modern industrial revolution, exit, and the failure of internal control systems. J. Financ. 1993, 48, 831–880. [Google Scholar] [CrossRef]
  24. Alazzani, A.; Aljanadi, Y.; Shreim, O. The impact of existence of royal family directors on corporate social responsibility reporting: A servant leadership perspective. Soc. Res. J. 2019, 15, 120–136. [Google Scholar] [CrossRef]
  25. Masarotto, G.; Varin, C. Gaussian copula marginal regression. Electron. J. Stat. 2012, 6, 1517–1549. [Google Scholar] [CrossRef]
  26. Song, P.X.-K. Multivariate dispersion models generated from Gaussian copula. Scand. J. Stat. 2000, 27, 305–320. [Google Scholar] [CrossRef]
  27. Fox, J. Teacher’s corner: Structural equation modeling with the SEM package in R. Struct. Equ. Model. 2006, 13, 465–486. [Google Scholar] [CrossRef] [Green Version]
  28. Loehlin, J.C. Latent Variable Models: An Introduction to Factor, Path, and Structural Equation Analysis, 4th ed.; Lawrence Erlbaum: Mahwah, NJ, USA, 2004. [Google Scholar]
  29. Rosseel, Y. lavaan: An R package for structural equation modeling. J. Stat. Softw. 2012, 48, 1–36. [Google Scholar] [CrossRef] [Green Version]
  30. Suhr, D.D. Exploratory or confirmatory factor analysis? In SAS Users Group International Conference 31 Proceedings Paper 200-31; SAS Institute, Inc.: Cary, NC, USA, 2006. [Google Scholar]
  31. Johnson, R.A.; Wichern, D.W. Applied Multivariate Statistical Analysis, 6th ed.; Prentice Hall: Upper Saddle River, NJ, USA, 2017. [Google Scholar] [CrossRef]
  32. Spirtes, P.; Glymour, C.; Scheines, R. Causation, Prediction, and Search, 2nd ed.; MIT Press: Cambridge, MA, USA, 2001. [Google Scholar] [CrossRef] [Green Version]
  33. Harris, N.; Drton, M. PC algorithm for nonparanormal graphical models. J. Mach. Learn. Res. 2013, 14, 3365–3383. [Google Scholar]
  34. Kalisch, M.; Buhlmann, P. Estimating high-dimensional directed acyclic graphs with the PC-algorithm. J. Mach. Learn. Res. 2007, 8, 613–636. [Google Scholar]
Figure 1. Two-dimensional principal component analysis (PCA) plots with all 14 variables. The first principal component explains 15.71% and the second principal component explains 9.15% of the sample. Variable definitions are available in Appendix A, Table A1.
Sustainability 12 03429 g001
Figure 2. Three-dimensional scatter plot of the 14 board and firm variables based on the three factors (Factor 1, Factor 2, and Factor 3). Variable definitions are available in Appendix A, Table A1.
Sustainability 12 03429 g002
Figure 3. Directed acyclic graph (DAG) with the 14 variables. Variable definitions are available in Appendix A, Table A1.
Sustainability 12 03429 g003
Table 1. Summary statistics (1998–2013).
VariablesNMeanSDMinQ1MedianQ3Max
Tobin’s Q13,9542.0261.2550.7481.2431.6272.3387.917
Board size13,9549.0032.2583791021
Independent directors13,9540.7200.15800.6250.750.8571
Director age13,95460.5014.11140.3335860.66763.18278
Family directors (1/0)13,9540.0880.28400001
Outside-CEO directors13,9540.0880.1170000.1430.714
Female directors13,9540.1040.097000.10.1670.667
Foreign directors13,9540.0200.05400000.714
Independent directors with financial expertise13,9540.0000.00500000.167
Log(Sales)13,9547.4221.5124.0126.3737.3178.38711.333
Capital expenditure to Sales13,9540.0720.1260.0020.0220.0370.0660.926
Return on assets13,9540.1400.102−0.1880.0840.1380.1950.455
Firm age13,95424.54619.163111183488
Business segments13,9542.3491.789012412
Note: Director and board information are from RiskMetrics, daily stock information are from the Center for Research in Security Prices (CRSP), and annual firm accounting information is from the COMPUSTAT. N indicates number of observations and SD indicates standard deviation. Variable definitions are available in Appendix A, Table A1.
Table 2. Gaussian copula marginal regression (GCMR) approach for the firm value with all 13 variables.
Model: c_q = Intercept + β1 v_b size + β2 v_outsiderpct + β3 v_age + β4 v_relativeflag + β5 v_ceodirector + β6 v_femalepct + β7 v_foreignpct + β8 v_financialoutpct + β9 c_lnsale + β10 c_capx_sale + β11 c_fichroa + β12 c_firmage + β13 c_segment_bus + ε
ARMA(p, q)ARMA(0, 0)ARMA(0, 1)ARMA(1, 0)ARMA(1, 1)
AIC28,72428,70328,70128,393
ARMA(1, 1)
VariableEstimateS.E.Z-Valuep-Value
Intercept5.9610.21128.2880.000
v_bsize−0.0440.006−7.5920.000
v_outsiderpct−0.0870.069−1.2580.208
v_age−0.0230.003−7.5910.000
v_relativeflag−0.0570.031−1.8320.067
v_ceodirector0.2230.0772.9040.004
v_femalepct−0.2190.124−1.7680.077
v_foreignpct−0.4120.158−2.6040.009
v_financialoutpct1.5931.5691.0150.310
c_lnsale−0.2730.021−12.9310.000
c_capx_sale0.3030.1162.6100.009
c_fichroa2.8180.08632.9400.000
c_firmage−0.0130.003−5.0990.000
c_segment_bus−0.0370.006−5.7930.000
AR(1)0.9790.004242.2000.000
MA(1)−0.9440.006−153.2000.000
sigma0.6780.004154.3980.000
Log-likelihood14,179
Note: Autoregressive moving-average (ARMA) (1, 1) is selected based on Akaike information criteria (AIC). Bolded AIC indicates the one with lowest AIC value. S.E. indicates standard errors. Variable definitions are available in Appendix A, Table A1.
Table 3. Structural equation modeling (SEM) evaluation results.
SEMEvaluation Measure
EstimatorTest statistic = 3602.445
p-value = 0.000
Model test baseline modelTest statistic = 12,791.390
p-value = 0.000
User model vs. baseline modelCFI = 0.721
TLI = 0.653
Log-likelihood and information criteriaNumber of free parameters = 25
AIC = −8048.529
BIC = −7859.941
RMSEARMSEA = 0.069
Confidence interval (90%) = (0.067, 0.071)
SRMRSRMR = 0.056
Table 4. Results for latent variable models.
Panel A. Factor 1
VariableEstimateS.E.Z-Value
v_femalepct1.000
v_outsiderpct3.3190.15421.585
c_lnsale16.1040.70222.937
c_firmage193.5528.40623.026
v_age70.4223.31121.271
v_bsize12.3251.00012.319
v_foreignpct0.2380.0337.220
c_segment_bus6.6210.8248.030
Panel B. Factor 2
VariableEstimateS.E.Z-Value
v_ceodirector1.000
c_capx_sale0.1920.0444.314
c_q35.8283.10511.540
c_fichroa1.7040.12813.333
Note: S.E. indicates standard errors. Variable definitions are available in Appendix A, Table A1.
Table 5. Factor loadings and statistical results.
VariableFactor 1Factor 2Factor 3
c_q−0.1450.421−0.264
v_bsize0.040−0.0340.321
v_outsiderpct0.432−0.014−0.022
v_age0.388−0.0910.085
v_relativeflag−0.072−0.0470.095
v_ceodirector−0.3410.0580.062
v_femalepct0.2390.0110.006
v_foreignpct0.056−0.0340.044
v_financialoutpct0.029−0.015−0.038
c_lnsale0.5060.1920.596
c_capx_sale−0.085−0.045−0.064
c_fichroa−0.0100.6210.011
c_firmage0.797−0.0720.105
c_segment_bus0.025−0.0640.174
Note: The hypothesis tested is that three factors are sufficient for the model. The chi-square statistic is 1373.2 with 52 degrees of freedom. The p-value is 0.000. Variable definitions are available in Appendix A, Table A1.
Table 6. GCMR approach with seven variables (Model 1). Dependent variable: c_segment_bus.
Modelc_segment_bus = Intercept + β1 * c_q + β2 * v_relativeflag + β3 * v_ceodirector + β4 * v_outsiderpct + β5 * c_lnsale + β6 * c_fichroa + ε
ARMA(p,q)ARMA(0, 0)ARMA(0, 1)ARMA(1, 0)ARMA(1, 1)
AIC35,91535,91335,91335,915
ARMA(0, 1)
VariableEstimateS.E.Z-Valuep-Value
Intercept−0.0080.185−0.0420.967
c_q−0.0620.011−5.7420.000
v_relativeflag0.1630.0413.9620.000
v_ceodirector0.5310.0975.4650.000
v_outsiderpct0.4660.0865.4180.000
c_lnsale0.2920.02411.9490.000
c_fichroa−0.5900.116−5.1070.000
MA(1)0.0160.0091.8260.068
Sigma0.8760.005167.0240.000
Log-likelihood17,948
ARMA(1, 0)
VariableEstimateS.E.Z-Valuep-Value
Intercept−0.0080.185−0.0420.967
c_q−0.0620.011−5.7420.000
v_relativeflag0.1630.0413.9620.000
v_ceodirector0.5310.0975.4660.000
v_outsiderpct0.4660.0865.4180.000
c_lnsale0.2920.02411.9500.000
c_fichroa−0.5900.116−5.1070.000
AR(1)0.0160.0091.8200.069
sigma0.8760.005167.0480.000
Log-likelihood17,948
Note: ARMA (0, 1) and ARMA (1, 0) are selected based on AIC criteria. Bolded AICs indicate those with the lowest AIC values. S.E. indicates standard errors. Variable definitions are available in Appendix A, Table A1.
Table 7. GCMR approach with 9 variables (Model 2). Dependent variable: c_lnsale.
Modelc_lnsale = Intercept + β1 * c_q + β2 * v_bsize + β3 * v_outsiderpct + β4 * c_firmage + β5 * v_femalepct + β6 * c_capx_sale + β7 * v_age + β8 * c_fichroa + ε
ARMA(p, q)ARMA(0, 0)ARMA(0, 1)ARMA(1, 0)ARMA(1, 1)
AIC3161.33105.43098.62789.9
ARMA(1, 1)
VariableEstimateS.E.Z-Valuep-Value
Intercept4.9040.07466.2560.000
c_q−0.0450.003−13.5450.000
v_bsize0.0520.00222.5580.000
v_outsiderpct0.1400.0275.4910.000
c_firmage0.0460.00148.1740.000
v_femalepct0.2210.0504.4630.000
c_capx_sale−0.3420.046−7.3640.000
v_age0.0130.00110.8150.000
c_fichroa0.7870.03522.6110.000
AR(1)0.9590.006162.00.000
MA(1)−0.9100.008−108.60.000
sigma0.2710.003156.5580.000
Log-likelihood1382.9
Note: ARMA (1, 1) is selected based on AIC criteria. Bolded AIC indicates the one with lowest AIC value. S.E. indicates standard errors. Variable definitions are available in Appendix A, Table A1.
Table 8. GCMR approach with five variables (Model 3). Dependent variable: c_firmage.
Modelc_firmage = β1 * v_ceodirector + β2 * v_femalepct + β3 * v_age + β4 * v_foreignpct + ε
ARMA(p, q)ARMA(0, 0)ARMA(0, 1)ARMA(1, 0)ARMA(1, 1)
AIC64,18864,18164,18164,030
ARMA(1, 1)
VariableEstimateS.E.Z-Valuep-Value
Intercept−0.3860.619−0.6240.533
v_ceodirector−6.9250.256−27.0340.000
v_femalepct12.0690.40829.6130.000
v_age0.3990.01040.2410.000
v_foreignpct5.9160.53811.0000.000
AR(1)0.9890.002441.3000.000
MA(1)−0.9380.006−156.0000.000
sigma2.4320.018134.7240.000
Log-likelihood32,007
Note: ARMA (1, 1) is selected based on AIC criteria. Bolded AIC indicates the one with the lowest AIC value. S.E. indicates standard errors. Variable definitions are available in Appendix A, Table A1.

