Article

Environmental and Socioeconomic Impacts of Urban Waste Recycling as Part of Circular Economy. The Case of Cuenca (Ecuador)

1
Faculty of Economic and Business/Department of Economic Analysis and Political Economy, Universidad de Sevilla, Avda. Ramón y Cajal 1, 41.005 Sevilla, Spain
2
Faculty of Business and Administration, Universidad Autónoma de Chile, Avda. Pedro de Valdivia, 425, Providencia, Santiago 7500912, Chile
*
Author to whom correspondence should be addressed.
Sustainability 2020, 12(8), 3406; https://doi.org/10.3390/su12083406
Submission received: 4 March 2020 / Revised: 14 April 2020 / Accepted: 15 April 2020 / Published: 22 April 2020

Abstract

:
Urban mining by recyclers represents a positive environmental impact as well as being part of the waste management chain. This paper analyzes the contribution of waste pickers in the city of Cuenca in Ecuador and the conditions of their activity. This research has a two-fold objective. First, it calculates the reduction of greenhouse gas emissions resulting from the substitution of virgin raw material in the production process by using recycled urban waste. The second objective is to conduct a socioeconomic analysis of the workers involved in the urban waste sector. Cuenca (Ecuador) is the main city used for this case study, thanks to the accessibility of a rich database built from the survey conducted by the NGO Alliance for Development. The information contained in this survey facilitates the identification of potential consumers of the waste industry. This study uses Clean Development Mechanism methodology. Finally, this work proposes a theoretical model for solid waste management, applied to the city, following the principles of the circular economy.

1. Introduction

According to the literature, circular economy (CE) encompasses three main activities: the reduction of the use of virgin raw materials, the reuse of already processed materials, and the recycling of waste [1]. This definition is known as the 3R concept. Some researchers include the redesign of products as a fourth CE activity; however its use is limited [2]. This paper adopts the CE concept based on the 3R principles, understood as an alternative to linear economy at a micro and macro level [3].
Through CE, the production of waste is reduced by extending the life of components and their reinsertion into the production process. CE impacts on the environment, labor relations, and the profitability of certain industries.
CE has a direct relationship with the Sustainable Development Goals of the United Nations [4] by helping to reduce greenhouse gases (GHGs) [5,6,7,8]. This is due to a decreased use of virgin raw materials and their replacement with recycled elements. Also, CE replaces fossil fuels with alternative ones.
Latin America is a region with many possibilities to evolve towards a CE [9,10]. Ecuador is a unique case due to a 2008 constitutional reform that included Sumak Kwsay as a reference development model [11,12]. However, the literature reveals a controversy in the realization of this constitutional principle and the real impact of CE on the nation’s economic activity [13,14,15].
Ecuador has a population of 16.8 million people. According to the World International Bank [16], the country also has a Gross Domestic Product per capita (GDP pc) of $5920. The administrative structure includes the Central Government, 24 Provincial Administrations, 221 Municipalities and 1149 Parishes with political, economic, and administrative autonomy. Waste management is an exclusive competence of municipal administrations. Solid waste management includes the prevention of residue production, the classification of organic and inorganic waste, the organization of collection and transport, the recycling and final disposal of materials.
According to the Ecuadorian National Institute of Statistics (INEC, from the Spanish acronyms), every Ecuadorian produces, on average, 0.58 kg of residues per day. Until 2015, municipalities collected an average of 12,829.21 tons of waste per day with 59% corresponding to organic waste. The remaining 41% was from inorganic materials including plastics (11.44%), paper and cardboard (10.25%), non- hazardous sanitary residues (4.83%), and others (14.81%) [17].
Until 2015, 38% of municipalities incorporated a selective collection system that differentiated between organic and inorganic wastes. In urban areas the collection range is 90.4%, while it is 57.4% in rural areas [17,18]. Waste is collected by the Municipality of Cuenca through a public company known as Empresa Municipal Ambiental de Cuenca (EMAC EP). The collected material goes to the Pichacay landfill for a final disposal [19].
Urban mining is a special contribution to the waste collection system. Cossu and Williams [20] define urban mining as the recollection of waste materials from any type of anthropogenic reserves. This paper focuses on citizens who are engaged in waste collection as an economic activity; this task is commonly known as recyclers or waste pickers. Their activities impact on the environment by helping to reduce greenhouse gas (GHG) emissions. The Clean Development Mechanism (CDM) is a vehicle to calculate GHG emissions avoided as a result of the return of recyclable materials into the production system as a replacement for virgin raw materials. Due to economic interests, the most collected materials by the waste pickers are plastic, glass, metal, and paper. Table 1 shows data for Ecuador’s three main cities.
This paper has a double objective. The first is to assess the abatement of GHG emissions resulting from the replacement of virgin raw material with recycled material from urban waste in the production process through the last upgrade of the CDM [22,23,24,25]. The second objective is to conduct a socioeconomic analysis of the workers involved in the urban waste sector of Cuenca (Ecuador), estimating whether or not it represents their main livelihood. As not a similar paper was found focusing on these topics for the case of Ecuador, the paper contributes to filling a gap in the literature. Based on the results and discussion, this paper proposes a model for solid waste management following the principles of CE. The city of Cuenca was chosen due to the opportunity to access the rich database built from the survey carried out by the NGO Alianza Para el Desarrollo for the Plan de Reciclaje Inclusivo (PRI) as part of the Regional Recycling Initiative (IRR from the Spanish acronym) financed by the Inter-American Development Bank (IDB). The information contained in that survey allowed us to identify potential industries that demand material waste.
The rest of the paper is organized as follows: Section 2 provides a literature review. Section 3 is devoted to the methodology and materials, while Section 4 presents the results obtained, including the discussion, with Section 5 providing the conclusions.

2. Review of the Literature

Kirchherr et al. and Parchomenko et al. [1,26] define the concept of CE from the 3R principles. Geissdoerfer et al. [27] highlight CE business models. These models have both environmental and social impacts that involve changes in the productive and administrative process. Circular Economy activities influence at a number of levels, including microeconomic [28], mesoeconomic [2], and macroeconomic levels [3]. Furthermore, the CE is an economic development approach designed to benefit business, society, and the environment [29].
CE has been widely discussed in recent literature [1,30,31,32,33,34] focusing on Latin America and the Caribbean; it is present in many CE research articles [35,36,37,38,39]. However, in the case of Ecuador only two CE studies were found [29,40]. The first paper studied a circular economy strategy for bioenergy production and the systemic design of solutions for E-waste management, which was also addressed in a second article.
The World Bank estimates that waste generation will increase from 2.01 billion tons (tns) in 2016 to 3.40 billion tns in 2050. Latin America and the Caribbean generated 0.23 billion tns of waste in 2016, at an average of 0.99 kg per person each day; 0.88 Kilogram/Person/Day for Ecuador, according to Karak et al. [41]. These authors detail waste management from a global perspective. Ferronato et al. [42] analyze opportunities for developing countries through solid waste processing and recognize recyclers, municipalities, and private sectors as agents involved in this process. Useful analysis of waste management in various Ecuadorian cities are found in Jara-Samaniego et al.; Moya et al.; and Stern et al. [43,44,45]. More specifically, Reference [43] focused on municipal composting of waste streams from the region of Chimborazo (Ecuador). Being that composting is a biological process in which the organic portion of refuse is allowed to decompose under carefully controlled conditions (microbes metabolize the organic waste material and reduce its volume by as much as 50%), this practice constitutes not only a feasible strategy for the suitable management of the municipal waste streams, but also a way to obtain composts with stabilized and humidified organic matter and with a high fertilizer value. Moya et al. [44] take the city of Quito as study case to explore the energy generation potential from municipal solid waste (MSW). They find that Quito´s MSW has a high potential for producing biogas and heat energy. The poverty perspective is included in the study by [45], who takes Machala (Ecuador) as his/her case study to explore the possibilities of large tricycles equipped with 1-m3 boxes. These lend themselves well to garbage collection in areas where motorized vehicles do not have easy access. INEC and Ministerio del Ambiente (MAE) [17,18,46] provided official statistics data for Ecuador.
Botello-Álvarez et al. [47] use the life-cycle assessment (LCA) methodology to determine the environmental impact that recycling valuable solid waste from informal collection has on the Mexican system, finding that it was positive.
Several studies about urban mining analyze it from productive and social perspectives [48,49,50]. They also detail the advantages and barriers for acknowledging waste pickers in developing countries. Fidelis and Colmenero [51] see cooperative organization as a tool to strengthen and dignify recyclers. Guerrero et al. [52] show the importance of public policies to improve waste management and the involvement of social agents. Calderon-Márquez et al. [35] propose the use of landfill mining as a tool for social inclusion to comply with Agenda 2030 Sustainable Development Goals for social development in Latin America. Urban mining could provide social benefits for the social inclusion of waste pickers.
Likewise, a number of studies assess the social impact of waste systems, including [53] for oil waste in Spain; [54] for municipal solid waste in Turkey, and [55] for incineration waste in Taiwan. There are few studies assessing the social impact of waste management systems for Latin America countries, but [56] in Peru and [57] in Brazil must be highlighted.
Some authors [25,58,59] apply CDM to estimate the reduction of CO2 and CH4 for waste collection and the work of the recyclers in different parts of the world. The IRR [21] together with the information from local recycling cooperatives and the NGO allied to the recyclers’ sector detail the socioeconomic reality of waste pickers. There are quite a few studies on this topic stemming from Latin America [40,60,61,62,63]. So far, however, there are no scientific studies regarding the contribution of urban mining to the reduction of emissions in Ecuador.

3. Materials and Methods
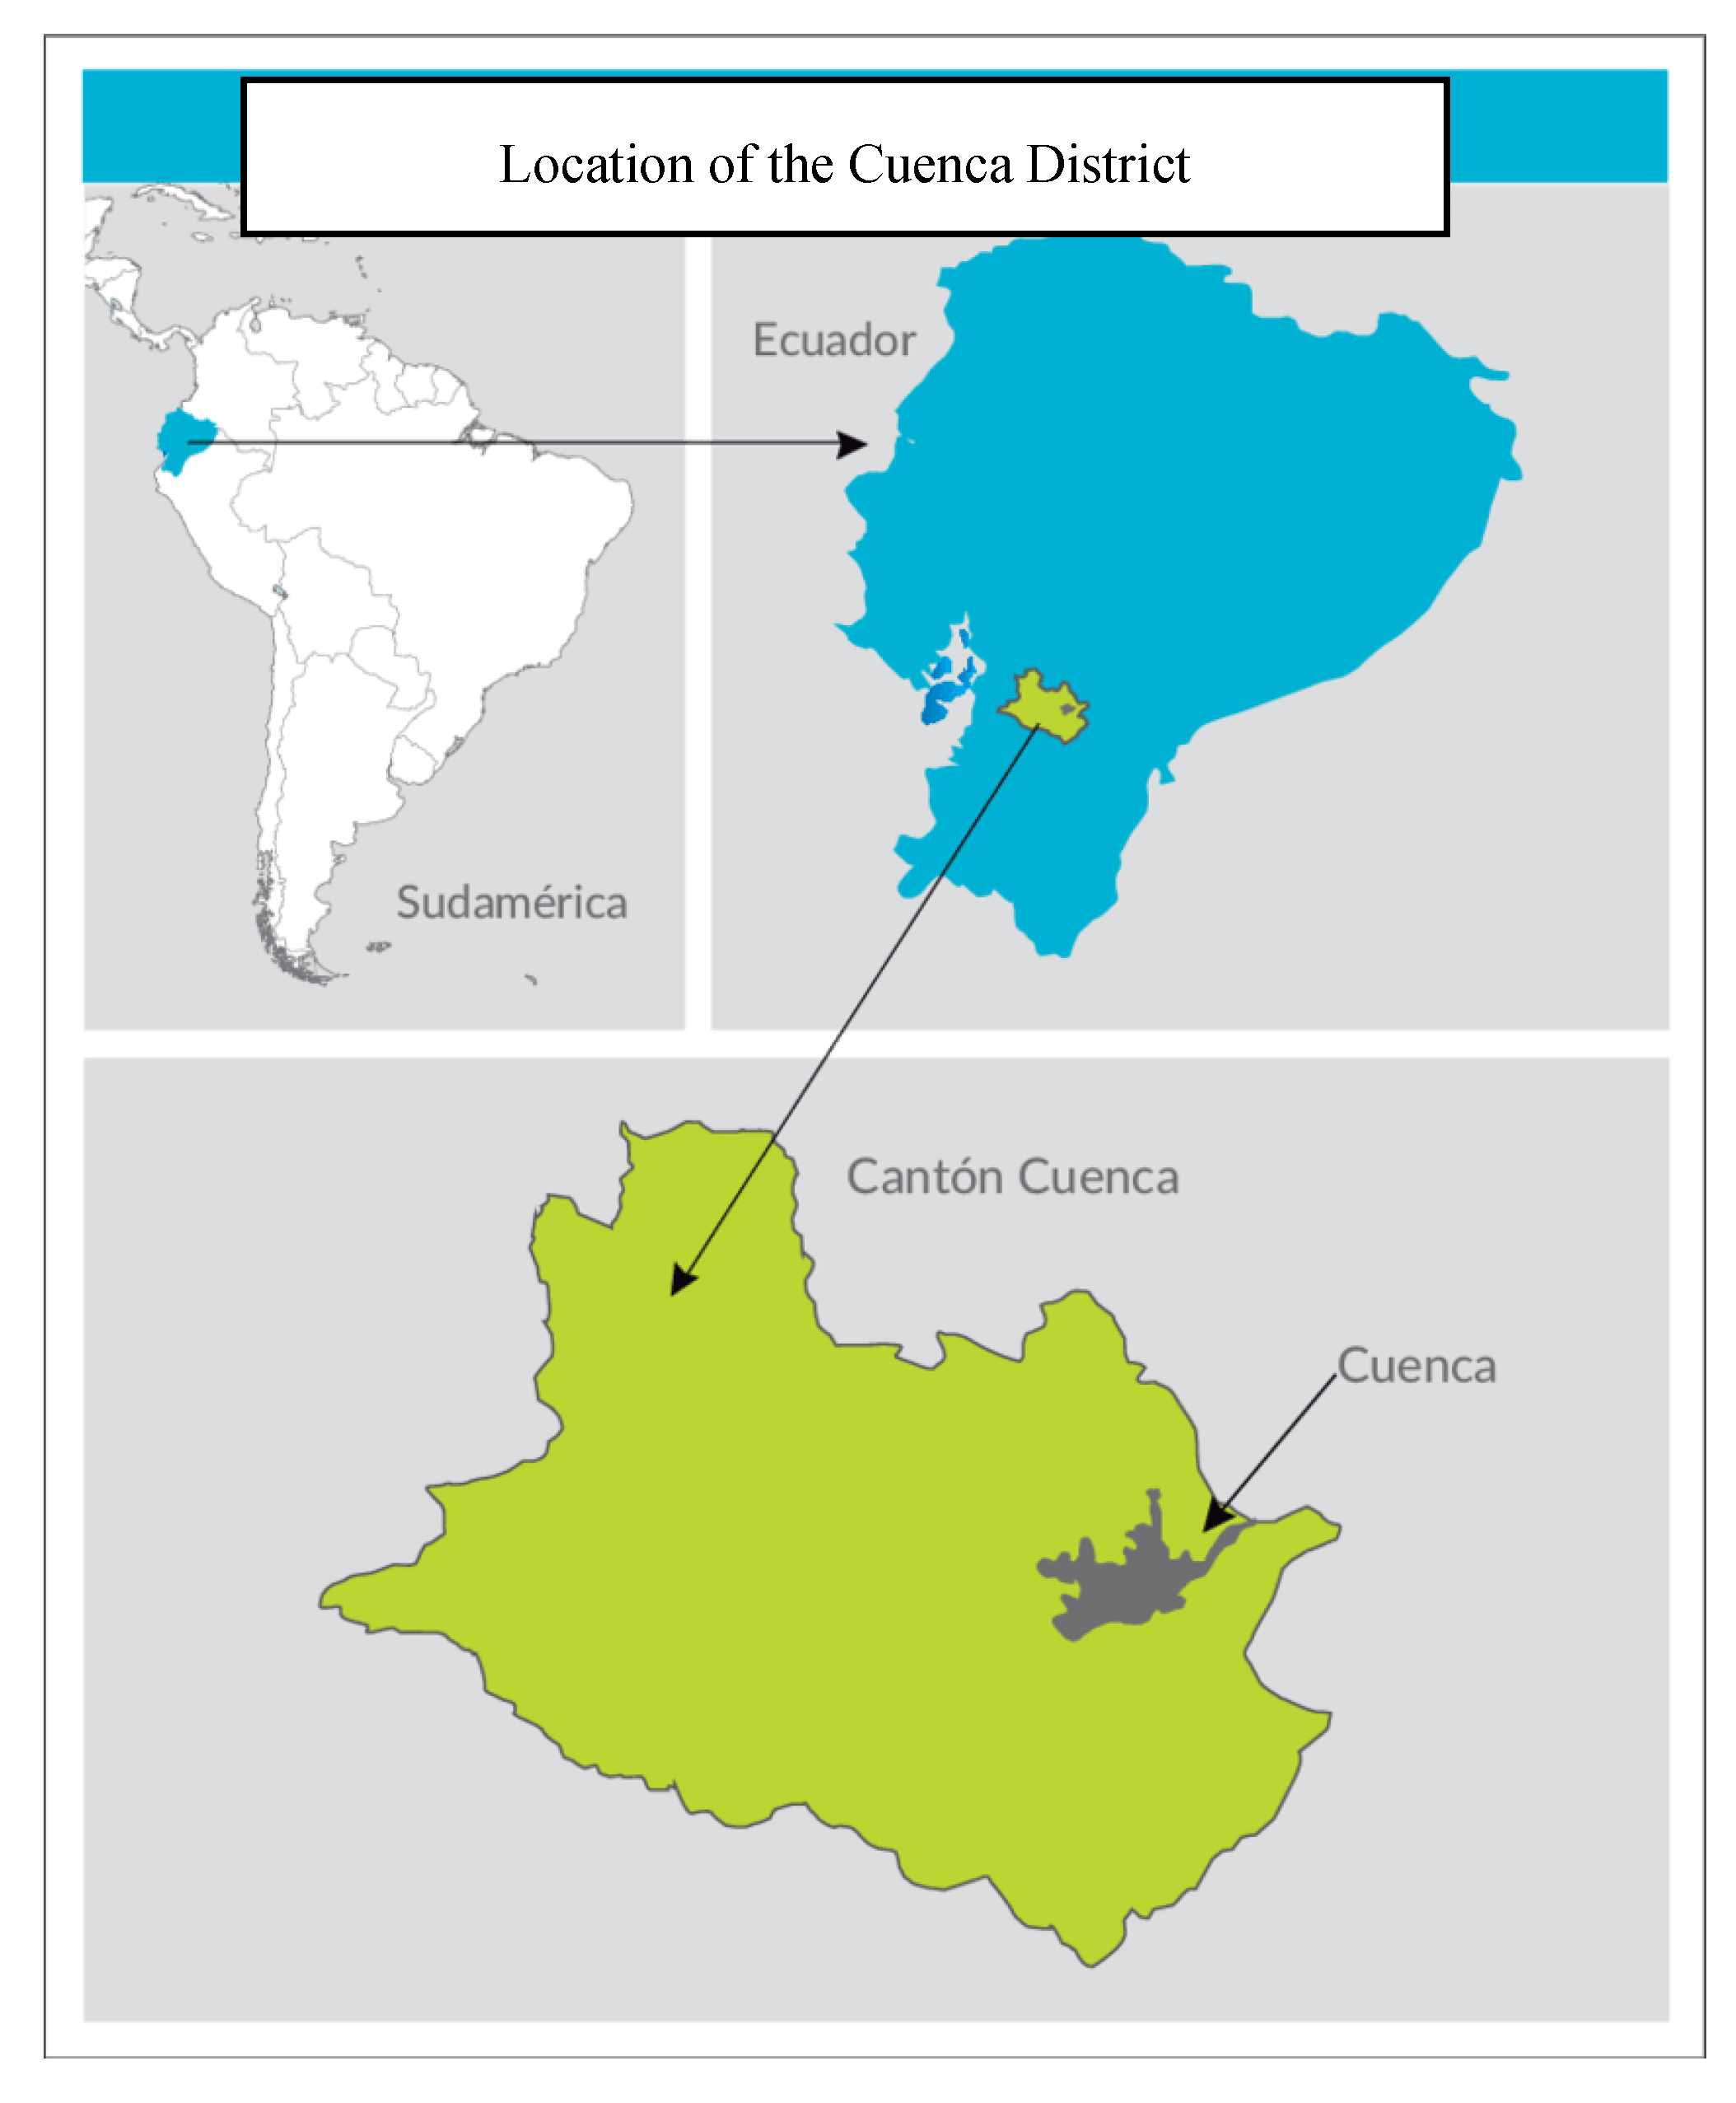
3.1. Study Area

Cuenca is the capital of the Province of Azuay and is located in the southern center of Ecuador (Figure 1). With a total area of 3200 km2, it represents 38.2% of the province and is the third most populous city in the country, with 603,269 inhabitants [64,65]. The poverty rate per salary is 2.8% with $84.72 [66]. Commerce accounts for 55% of Cuenca’s main economic activity, followed by industry and manufacturing (28%), transport (3%), construction (3%), financial activities (3%), and others (5%) [67].
In all, 50.7% of households in Cuenca classify their residues, compared to 47.2% in Guayaquil and 32.4% in Quito. The composition of urban waste in Cuenca is: organic residues (54%), inert matter (13%), plastics (11%), paper and cardboard (7%), glass (3%), textile (3%), and metal (2%) [64].
Following the legal framework establishing the requirements to obtain an authorization to perform recycling work of inorganic solid waste in Cuenca, the city wastes are owned by EMAC-EP and unauthorized persons are prohibited from collecting and selecting residues. If any person or private institution requests participation in the mining activity, it needs a permit from the authority. EMAC-EP registers 600 people as formal recyclers [69], but IRR [21] indicates that 3472 people are involved in the urban mining activities in Cuenca, with most of them being informal recyclers.
Some of recyclers are members of a cooperative. The recyclers’ cooperative is an organizational model that seeks to improve working conditions and represent them before both the authorities and society [49]. The main cooperatives in Cuenca are Asociación de Recicladores El Valle (AREV), Asociación de Recicladores Urbanos (ARUC), El Chorro, San Alfonso-Centro Histórico and Asociación Solidaria del Sur-Feria Libre.
According to IRR [21], recyclers sell the collected material to small and medium-sized entrepreneurs, commonly known as brokers, with the capacity to transport, process, store, and trade with local industries. It is the broker who establishes the purchase price for recyclers based on the volume and quality of the materials.

3.2. Waste Management System

According to EMAC-EP, [70] municipal governments are responsible for waste management. This mandate also regulates the waste classification (differentiating between organic or inorganic) as the responsibility of each individual household before depositing it at the collection points. These collection points also represent the main source of inorganic waste material for waste pickers or urban miners. The organic waste generated and deposited at collection points and all inorganic material rejected by informal recyclers are later collected by municipal employees according to an established schedule. Said waste is later transport to the Pichacay landfill. An alternative channel for waste management starts with the collection and classification of inorganic waste on behalf of urban miners. Industry using recycled materials concludes the channels.
Inorganic waste is one of the most important stocks of material for waste pickers. Formal and informal recyclers are assigned an established route or collection points, depending on their self-organization. The material is sold through cooperatives or directly to the broker. Waste depends upon industry requirements. Figure 2 shows how waste is managed in Cuenca, including recyclers within the system.

3.3. Market Demand

According to MAE [46], Ecuador shows important growth in waste generation. On the other hand, the application of public policies aimed at reducing pollution and increasing environmental sustainability has led to an increase in the import of recycled raw materials for the production of goods and services. This represents an opportunity for those who carry out waste transformation activities for new inputs that return to the market. It might be highlighted that there is a significant increase in potentially recycled solid waste. For example, in 2014 the recovery of PET registered an increase of 170% over 2012, metals increased to 122%, and paper to 300%.
In Ecuador, four companies are responsible for using 92% of recycled paper and cardboard. The industry registered a 62.5% annual deficit in its supply. By 2015, 29.36% of the demand for recycled paper and cardboard was recovered by recyclers from the four main cities of the country [21].
The MAE promotes the PET recycling process as part of its efforts to reduce pollution levels. The legal framework provides support to recyclers through an economic subsidy for storage and bottling centers, which they subsequently sell to recycling plants. IRR [21] estimates that the annual demand for raw materials is 49,200 tons per year, to which recycling contributes 31%. On the other hand, Dal Lago et al. [72] point out that plastic´s value-added are opening emerging markets in growth.
The demand for metallic scrap shows growth due to a program that regulates the importation of iron unless there is a deficit. The legal framework encourages the investment of companies in the collection, processing, and marketing of ferrous scrap. The IRR [21] stipulates a demand of 408,000 tons per year, with a deficit close to 30%.
The costs of recycled materials vary according to factors such as volume, quality, and distance. Material collected through urban mining is sold daily to brokers and agents who, due to their supply capacity and payment credits, become the main suppliers for the industrial sector. Brokers may manage volumes between 1000 and 2000 tons per month. Recyclers contribute 6722 tons of material annually [21].

3.4. Methodology

3.4.1. Assessment of Avoided Emissions

The calculation of the emissions avoided from the CDM methodology is supported by the United Nations Framework Convention on Climate Change (UNFCCC) [22,23,24]. The baseline scenario assumes that all raw materials used in industrial production processes are virgin. A comparison scenario is also defined in which 100% of the material recycled is reinserted into the productive chain in replacement of virgin raw material to obtain new products [25].
From the above, the calculation of GHG emissions avoided by the recyclers of Cuenca-Ecuador is the result of the difference between the emissions resulting from the processing of virgin raw materials (baseline scenario) and the emissions that result from using recycled material (comparison scenario). The above difference is increased by adding methane (CH4) emissions as a result of the reduction in the amount of paper and cardboard that is not poured into landfills because it has been recycled and reused. CH4 emissions are calculated following UNFCCC [24] indications. This methodology considers eight reference scenarios. We take into account the first one—BECH4,SWDS,y—to determine the baseline emissions from the landfill (solid waste disposal site: SWDS) in a specific period y. This UNFCCC methodology [24] specifies the global warming potential of CH4 (GWPCH4) measured in t CO2-eq/t CH4. The specific value applied in the paper—21—comes from the Intergovernmental Panel on Climate Change (IPCC) database. The calculation is detailed in Equation (1).
E R y = ( B E y P E y ) + B E CH 4 , swds   y ,
where ERy is the reduction of emissions in year y measured in tCO2-eq. BEy represents the baseline emissions in years and measured in tCO2-eq. PEy is the projected emissions in years and measured in tCO2-eq, while BECH4,SWDS y is the CH4 emissions avoided from avoiding landfilling paper and cardboard, measured in tCO2-eq.
The assessment of emissions resulting from the processing of virgin raw materials (BEy) is carried out according to the following assumptions:
  • For the production of plastic, the emissions associated with energy consumption for the production of virgin plastic pellets are considered;
  • For paper and cardboard, the emissions associated with anaerobic decomposition into the landfill are taken into account;
  • For glass, emissions associated with energy consumption for the production of virgin glass containers corresponding to the preparation and mixing of raw materials during the melting stage are considered;
  • For metal, emissions associated with energy consumption for the production of virgin iron are taken into consideration.
B E y is defined in Equation (2):
B E y = B E plastic , y + B E glass , y + B E paper , y + B E Metal , y .
BEy is the baseline emissions in years y measured in tCO2-eq. BEplastic,y is the baseline emissions associated with the production of plastic measured in tCO2-eq. BEglass,y is the baseline emissions associated with the production of glass, measured in tCO2-eq. BEpaper,y is the baseline emissions associated with the production of paper and cardboard, measured in tCO2-eq, and BEmetal,y is the baseline emissions associated with the production of iron, measured in tCO2-eq.
For calculations, it is essential to know the emission factor for the generation of electricity. This factor was estimated in accordance with the last three publications of Agencia de Regulación y Control de la Electricidad [73,74,75]. The calculation selected is the simple operating margin (OM simple) option 1 of the UNFCCC [23], indicated in Equations (3) and (4).
E F el , Y = E F grid , y 1 + E F grid , y 2 + E F grid , y 3 E F grid   ,
E F grid , OMsimple , y = i   F C i , y × NC V i , y × E F CO 2 , i , y E G y .
EFel,Y is the grid emissions for years 2015, 2016, and 2017. EFgrid,OMsimple,y represents the simple operating margin of CO2 emission factor in year y measured in tCO2/MWh. i corresponds to fuel type, while FCi,y is the amount of fuel consumed in year y measured in m3. NCVi,y shows the net calorific value of fuel measured in GJ/m3, with EFCO2,i,y indicating the emission factor for fuel type measured in tCO2/GJ, and EGy being the net electricity generated in year y.
The baseline emissions for the production of plastic are detailed in Equation (5).
B E plastic , y = i [ Q i , y × L i × ( S E C B l , i × E F e l , y + S F C B l , i × E F F F , C O 2 ) ] ,
where i denotes the material type (HDPE, LDPE, PET). Qi,y is the quantity of resource type i recycled per year y measured in tons. Li is the net-to-gross adjustment factor to cover degradation in resource quality and material loss in the production process of the final product using the recycled resource. SECBl,i is the specific electricity consumption for the production of virgin resource types (MWh/t). EFel,y corresponds to the emission factor for the grid electricity generation measured in tCO2/MWh. SFCBl,i is the specific fuel consumption for the production of virgin resource plastic-type i measured in GJ/t, and EFFF,CO2 is the emission factor for fossil fuel measured in tCO2/GJ.
The methodology considers that the remaining steps for the production of virgin pellets require relatively negligible amounts of energy, therefore they are ignored.
The baseline emissions for the production of paper and cardboard are detailed in Equation (6).
B E paper , y = i [ Q i , y × L paper × E F el , y ] .
Lpaper is the adjustment factor to cover the degradation in resource quality and material loss in the production process for the final product using recycled resources. EFel,y is the emission factor for the grid electricity generation measured in tCO2/MWh.
The baseline emissions for the production of glass are detailed in Equation (7).
B E glass , y = i [ Q glass , y × L glass × SE C Bl , glass × E F el , y ] .
SECBl,glass is the specific electrical consumption for the production of virgin material measured in MWh/t. EFel,y is the emission factor for the grid electricity generation measured in tCO2/MWh.
In the case of glass, the methodology establishes the following assumptions:
  • Glass waste only replaces the preparation and mixing of raw materials prior to the melting stage;
  • The only source of energy consumed is electricity. Fossil fuels are not used;
  • The remaining steps of glass production in containers are not considered.
The baseline emissions for the production of iron are detailed in Equation (8).
B E metal , y = i [ Q i , y × L iron × E F el , y ] .
Liron is the baseline correction factor for iron, and EFel,y is the emission factor for the grid electricity generation in the year.
Emissions from the processing of recycled material are obtained from Equation (9).
P E y = i ( Q i , y × SE C rec × E F el , y ) .
PEy is the emissions from recycled products, measured in tCO2. Qi,y is the quantity of recycled material during the period y measured in tons, while SECrec corresponds to the electricity consumption of recycled material measured in MWh/t.
The quantitative data used in the calculations and their explanations are available as complementary material.
The Pichacay landfill is located in the Santa Ana parish, 21 km from the city of Cuenca and is managed by the municipal authority. Since 2001, it has been the main receiver of solid waste from the city. It has a mixed sealing system covered by a layer of compacted clay with a thickness of 20 cm and 150 mm high-density polyethylene geomembrane. The average volume of leachate generation is 100 m3/day. Its leachate storage capacity is divided into 2 phases, with a total volume of 4976 m3. It maintains an integrated management system based on international standards. According to EMAC-EP [19] its useful life is foreseen until 2021.
Landfill gas is a product from the anaerobic digestion of biodegradable organic waste matter, which is generally formed by CH4 and CO2 [76]. GHG emissions from the degradation of paper and cardboard are calculated using the UNFCCC methodology [24], complemented with data obtained from Parra [68]. The methodology proposes to determine the possible CH4 emissions generated within the landfill in the absence of recycling. All emissions factors are described in Table A1 in the Appendix A. The calculation is obtained from Equation (10).
BE CH   4 , SWDS ,   y = φ y × ( 1 fy ) × GWP CH 4 × ( 1 OX ) × 16 12 × F × DOC f , y   × MCF y × x = 1 y j (   W j , x ×   DOC j × e kj   × ( y x ) × ( 1 e kj ) ) .
BECH4,SWDS,y is the CH4 emissions avoided by removing paper and cardboard from the landfill, measured in tCO2–eq. j denotes the waste type (paper and cardboard) while Y is the year of analysis. φ is the correction factor for model uncertainties, using 1, with f being the fraction of CH4 captured at the landfill, using 0.9. GWPCH4 is the global warming potential of CH4 for the first commitment period, using 21, with OX being the oxidation factor, reflecting the amount of CH4 from SWDS that is oxidized in the soil or other material covering the waste, using 0.1 [77]. F is the volume fraction of CH4 from the landfill that is oxidized in the soil of covering material, using 0.55, while DOCf is the fraction of degradable organic carbon that can decompose, using 0.5. MCFy is the CH4 correction factor in an anaerobic scenario, using 1, with Wj,x being the amount of paper and cardboard avoided from disposal, using 306 (t) from the survey data. DOCj is the fraction of degradable organic carbon by weight of paper and cardboard, using 0.4, and kj, is the decay rate for waste type j, using 0.04 (dry temperate climate, with an average annual temperature of 15 °C).

3.4.2. Socioeconomic Analysis

The second objective is to determine whether or not urban mining can be considered a major economic activity for recyclers. For this, the minimum wage in Ecuador will be compared with the average per capita income of the recycler calculated from the survey data. The calculation is made based on the average volume of the collection of different materials and income per sale obtained through a personal survey of recyclers in 2015. This result will determine whether or not this activity can be considered a main economic activity for their livelihood. Additionally, Section 4.2 shows the monthly average income based on the socio-descriptive variables of the recycler.

3.5. Survey Data

The database for this research was provided by the NGO Alianza Para el Desarrollo. This NGO is part of the national team responsible for collecting information regarding the socioeconomic profiles of the informal recyclers in Ecuador. In 2015, this NGO participated in the IRR [21].
The process of socialization, surveys, and information processing was carried out during three quarters. Interviews consisted of an in-depth, 30–40 min interview with recyclers. In the city of Cuenca, the sample size included 82 recyclers, 14 of whom belong to the associations AREV, ARUC, El Chorro, San Alfonso-Centro Histórico, and Solidaria del Sur-Feria Libre, and 68 were independent recyclers, with a 95% level of confidence and a 5% margin of possible error. In parallel, other cooperation organizations applied the same methodology in other municipalities of Ecuador to include a total sample of 422 recyclers. According to the national network of waste pickers of Ecuador (RENAREC), there are an estimated 3400 in Cuenca and more than 20,000 nationwide [21].
The database offers information regarding the personal profile, marketing conditions of the recycled material (frequency and volume of collection), socioeconomic status, level of satisfaction, characterization of their work environment, and occupational health. The data obtained correspond to the total sample, without differentiating between associated and non-associated recyclers. Survey results are summarized as complementary material.
Market prices are fixed by brokers. The value of materials fluctuates continually and is subject to industrial demand, volume, quality, and the transport of the materials. Recyclers report that the stockpiling of material has become an unfavorable option due to ignorance of the accumulated volume and inability to obtain a fair price, which is why they mostly opt for daily trade. The values used in Table 2 correspond to the moment of the survey in 2015.

4. Results and Discussion

4.1. Emissions Avoided

Throughout 2016, a total of 594 tons of recycled material were collected; of this amount, 51% corresponded to paper and cardboard, 25.08% to plastics, 12.12% to glass, and 11.28% to scrap metal. To calculate the emissions avoided, it is assumed that 100% of the recycled material was used by the final industry to replace virgin raw materials.
As a result of the recycled material collection activity among 82 recyclers, 288.70 tCO2-eq was avoided due to the replacement of virgin raw material. The abatement of CH4 emissions due to avoiding the inclusion of paper and cardboard waste from the Pichacay landfill was 2738 tCO2-eq. We did not consider emissions from transport and non-energy processes. Paper and cardboard represented 90.5% of the total emissions avoided, mainly due to the deviation of material in landfills. The remaining 9.5% of emissions were produced from the use of recycled material.
Table 3 shows the results, and these are consistent with the literature of [25,78,79], which establish the reduction of 0.57–0.78 tCO2-eq per ton of paper, 0.45–1.83 tCO2-eq per ton of plastic, 0.03–0.5 tCO2-eq per ton of glass, and 0.6–2.6 tCO2-eq per ton of metal. Only the glass had values below the reference values. Comparing these results with the paper of King and Gutberlet [25], the Cooperpires cooperative contributed to a reduction of 1443–2720 tCO2-eq, of which approximately 276 tCO2-eq was avoided through recycling, and around 1277–2444 tCO2-eq by the diversion of paper and cardboard.
There is a wide difference between the number of miners who count on municipal sources and recycler associations. The difference is that in the first case, only formal recyclers were taken into account, while in the second case also included informal ones. Table 4 present the results scaled according to both sources.

4.2. Socio-Descriptive Analysis of Recyclers in Cuenca

The average per capita salary of recyclers in Cuenca was obtained from the survey data summarized in Table A2 in the Appendix A. Potential customers of the recycler were mainly brokers and agents who supplied the recycled material to the industry. Recyclers were limited to classification of the material, being the agent who generated added value through the process of collection, cleaning, compaction, crushing, packaging, and others. Table 2 averages the monthly per capita income.
The survey data allowed us to calculate a per capita average income of $123.40 per month (1.1 tons per month, in a workday of 6.7 h per day and 4.5 days of work per week). This value is close to the results of the IRR [21], which establishes income at $167.31 per month. The results are in line with other papers for developing countries, such as that of Ferronato et al. [42] for Mexico and King and Gutberlet [25] for Brazil.
Thus, this salary places recyclers out of 2.8% of the population of Cuenca in poverty due to income below $84.72 per month according to INEC [66]. The average income represents 31.3% of the Ecuadorian minimum wage, which is $394 per month, and 17.3% of the cost of the family shopping basket, which is $713.05 per month, as of March 2019 [66]. Some of the recyclers increase their income through complementary trades, government subsidies, and the revenue from other household members. The average household income reaches $220 per month, which represents 30.8% of the cost of the family shopping basket.
When recyclers do not find sufficient incentives, they resort to working informally. These incentives could increase with further development of CE.
Data from Table A2 in the Appendix A allow a socioeconomic analysis beyond average revenue. In particular, urban mining activities are very feminized (74% of recyclers are women) and of mature age (55 years old, as an average). Most of them have consolidated recycling as part of their work activity. On average they have been working as recyclers almost 10 years. However this activity does not satisfy them enough. When asked about their work satisfaction, most of them chose “Regular” (32%) or “Discontent” (27%). These answers are in line with their responses when asked if their lives improved, compared with the previous year (45% of recyclers say it got worse).
Finally, benefits from belonging to an association or to a cooperative organization are not valued; 61% of those interviewed answered they were not interested in it. This in concert with the fact that almost 80% declared themselves not to be a member of a recyclers’ association. In fact, literature focused on cooperatives indicated that they are heterogeneous, with different levels of management performance and administrative organisation creating disparities in the rent paid by the collection centers for the collection trucks [51].
Although the simple only included 82 respondents, the sample information was compared to information available from surveys undertaken in other major cities and smaller towns by IRR (10 locations and 422 respondents at the national level). Profiles were similar in all cases.
The rest of the surveys were not taken into consideration for the research because the city of Cuenca survey offered more complete information regarding market prices. Likewise, information provided by the Foundation for Development allowed the authors to learn more about the organization levels of the main recycling associations and the sales dynamics of the brokers. This information was not available for other municipalities.

4.3. CE Model and Discussion

Ferronato et al. [42] establish the conditions for waste management within the principles of Circular Economy applied to developing countries. Botello et al. [47] point out that recycling based on informal waste collection cannot be considered part of clean production. The first step would be the formalization of the recycler; in other words, the legal recognition of those performing this activity by public administration. This implies economic and social benefits [80]. Institutional support may be channeled through subsidies and tax benefits. Being part of a formalized sector implies the acquisition of rights and obligations. Urban miners join together within a planned collection system that establishes schedules and collection points to achieve full and organized coverage. The link between the collector and the citizenry is of fundamental importance. Miners must wear a distinctive uniform, personal protective equipment, and be trained in safety measures. Additionally, local commerce may be stimulated by means of recognition through social and environmental responsibility certifications to industries that incorporate recycled materials into their processes.
Pichacay landfill is recognized for its management model and has international certifications in-process for quality and safety, being suitable for the establishment of strategies that complement a CE system. Waste collection must distinguish between organic, recyclable (differentiated), non-recyclable, hazardous, and highly polluting materials (sanitary waste, batteries, electronic components, tires, and others). Organic matter may be used as combustible raw material in parallel to the production of biogas. The optimization in the final disposal centers transcends a prolongation of life and aims at acquiring new technologies and strengthening know-how.
Citizens are directly involved through responsible consumption according to the 3R. The public sector may develop awareness campaigns, continuous surveillance, installation of properly classified waste deposits around the city, and citizen incentives to promote an environmental culture.
The strengthening of a cooperative model provides confidence to its members, ensures their rights, remunerates members equally and acts as a representative institution between recyclers and those who use their activity [49,50]
The previous discussion allowed us to design a scheme for proper waste management in the city of Cuenca as part of a CE model. Figure 3 summarizes it.

5. Conclusions

The recycling sector plays a key role in local waste management. It contributes not only to the correct classification of waste, but also dampens the effects of a resident culture that is not sufficiently sensitive to environmental care. It generates savings for the public sector by prolonging landfill lifespan while providing the industrial sector with raw materials and reducing the level of GHG emissions.
Through the CDM, accreditation of carbon emissions is permitted for those who perform urban mining. These calculations serve as a tool of added value to the work of the recycler, allowing for the revaluation of work from an economic as well as a social perspective. On average, a recycler contributes to the prevention of 0.48 tCO2-eq per ton of recycled material and is responsible for 4.61 tCO2-eq per ton of paper and cardboard diverted from landfills. This figure increases if avoided emissions due to transport and non-energy processes are included. However, the methodology applied in this paper does not take into consideration the calculation for the generation of leached, as it is limited in the results obtained [81]. A second limit derives from the fact that the methodology used does not consider fuel consumption for the production of recycled materials.
Its environmental contribution contrasts with its low economic revenue. This creates vulnerability in the form of job insecurity. The average income is above the wage index for poverty, but below the basic Ecuadorian salary, thus making it necessary for many of these workers to complement their activity with other trades and sources of income. The socioeconomic profile shows limitations of basic services, education, health, food, and housing. Resources for this activity are scarce, in addition to a lack of training that restricts the processing of the material and the generation of added value.
Waste pickers do not maintain a solid organization. The associations operate below their operational capacity, which weakens their organizational structure. A significant percentage of collectors are not part of the associations or have an interest in associating. The collected material is marketed daily under the conditions fixed by a broker, who influences the sale price of the materials, creates added value and commerce with the industrial sector.
The proposal for waste management within the framework of the CE for the city of Cuenca incorporates the principle of the 3Rs in accordance with the United Nations and the fulfillment of the Sumak Kawsay indicated in the Ecuadorian Constitution [11]. The municipality, citizens, private sector, and urban miners are considered as involved agents.
The application of the scheme faces barriers and opportunities, typical of the city, that have yet to be analyzed. On the one hand, the deficit of raw materials at the national level represents a commercial opportunity for those who have an infrastructure for the processing of recyclable materials. Waste pickers should seek to strengthen their organization to take advantage of a potential market. As the third most important city in the country, Cuenca is an ideal scenario to formalize recyclers within waste management. Optimization in waste collection, environmental responsibility, social impact, and innovation of municipal waste management facilities serve as a boost for government investment and create a potential interest in the manufacturing industries involved. On the other hand, the scarce literature and official information of the population dedicated to this activity limits the scope of future research. Likewise, it is necessary to develop campaigns that join recyclers together, encourage citizen participation, and strengthen their culture environmental. The commitment to new technologies for the optimization of the material collection and processing system represents a high-risk economic investment.
An update of the database would serve as a basis for a regression analysis between recycled material and sociodemographic aspects, as well as an economic feasibility study. The realization of this work serves as a starting point within a series of areas for studies to be explored as far as recycling in Ecuador is concerned.

Author Contributions

Conceptualization, J.M.C.; Data curation, D.B.; Formal analysis, D.B.; Investigation, J.M.C.; Validation, D.B. and R.Y.; Writing—original draft, D.B., J.M.C. and R.Y.; Writing—review & editing, R.Y. The second author conceived the idea, discussed the results obtained, and co-authored the manuscript. The first obtained the results. All authors have read and agreed to the published version of the manuscript.

Funding

Spain’s Ministerio de Ciencia, Innovación y Universidades research project RTI2018-096725-B-I00.

Acknowledgments

Authors acknowledge the NGO Alianza Para el Desarrollo for accessing its survey data. The second and third authors are grateful for the financial support received from Spain’s Ministerio de Ciencia, Innovación y Universidades research project (RTI2018-096725-B-I00). They also thank the Chair of Energy and Environmental Economics for its support, sponsored by Red Eléctrica España (REE) at the University of Seville. The second author acknowledges support from the Universidad Autónoma de Chile (Chile).

Conflicts of Interest

The authors declare no conflict of interest.

Appendix A

Table A1. Quantitative data applied in the CDM methodology.
Material (i)VolumeVirgin Resources (1,2,3,4)Recycled Resources (1,2,3,4)Adjustment FactorEmission Factor (5)CH4 Emission Factor (6)
(Qi)SECBl,iSFCBl,iSEC recLi (7)EF el,yEF FF,CO2BECH4,SWDS
PET441.114.160.830.750.180.2-
HDPE520.834.160.830.750.180.2-
LDPE531.674.160.830.750.180.2-
PP-0.563.20.830.750.18--
Glass720.026-0.02 (10)0.880.18--
Paper/cardboard3064.98-1.470.82 (8)0.18-8.95
Iron676.84-0.90.68 (9)0.18--
Complementary data corresponding to energy emission and consumption factors were obtained from the literature review.
(1)
Gomes and Nóbrega [82]
(2)
Pimenteira et al. [83]
(3)
King and Gutberlet [25]
(4)
UNFCCC [22]
(5)
Calculated in lines 268–271. Specific heat data came from Parra [76]
(6)
Calculated from line 327 onwards.
(7)
Rigamonti et al. [84]
(8)
Merrild et al. [85]
(9)
Damgaard et al. [86]
(10)
Colling et al. [81]
i, in Table A1 shows type of material; Qi, material volume (t); SEC BLi, specific consumption of electricity for the production of virgin materials (MWh/t); SFCBLi, fuel consumption for virgin material production (MWh/t); SECrec, specific consumption of electricity for the production of recycled materials (MWh/t); Li; adjustment factor due to degradation or loss of virgin material versus recycled material; EFel,y, average emission factor of Ecuador’s electricity grid (tCO2/MWh); EFFF,CO2, fossil fuel emission factor used in the production of virgin plastic materials (tCO2/MWh).
Table A2. Socioeconomic characterization of the recycler in Cuenca.
Recycler Profile
SexAge
Woman74%Dispersion14–77
Men26%Average55
Social Characterization
Education LevelLiving place
LiteratePrimaryHomeownershipHabitants per homeRoomsServicesGeneral condition
Yes78%Yes60%Yes45%Dispersion1–10Average2Drinking water93%Swerage74%Good29%
No22%No40%No65%Population4Pepople per room2Telephone27%Internet9%Medium57%
Electricity96%School77%Bad10%
Sanitary facilities88%Health center61%
Carbage collection84%
Labor Condition
Year as recyclerSocail SecurityWorking hoursAssociation MemberInternet in associatingInitial interest in the activityPrecious work
Dispersion0.1–40State18%Week days4.5Yes21%Yes39%Curiosity13%Lake of moner70%yes98%
Average9.9None82%Daily hours6.7No79%No61%Family tradition1%Extra time12%No2%
Motor vehicleDo another activityFamily recyclersCollection VolumeMaterial processingMuniciplal support
Yes1%Yes41%Yes21%Volume (t/month)1.1Selection and classification69%Torn55Others0%Yes33%
No99%No59%No79% Cleaning5%Trituration0% No16%
Compaction4%Reuse2%
Economic Profile
Monthly income from recyclingFamily contributionDepartdent relativesFamily income
0$–100$94%Yes21%Dispersion1–10Dispesion50$–700$
100$–200$6%No79%Family member2Money income220$
Occupational health
Work satisfactionQuality of lifeLife improvementActual problemsFeel valuedHealthy foodHabitsPPE
Happy26%Good4%Got better5%Money54%Yes54%Yes73%Alcohol7%Yes61%
Regular32%Medium49%Same34%Health32%No26%No27%Smoke11%No39%
Discontent-compliant27%Bad34%Got worse45%Public support57%Doesn’t work20%
Nonconforming6% Security39%
Work accidents15%
Problems between recyclers6%

References

  1. Kirchherr, J.; Reike, D.; Hekkert, M. Conceptualizing the circular economy: An analysis of 114 definitions. Resour. Conserv. Recycl. 2017, 127, 221–232. [Google Scholar] [CrossRef]
  2. Van Buren, N.; Demmers, M.; van der Heijden, R.; Witlox, F. Towards a circular economy: The role of Dutch logistics industries and governments. Sustainability 2016, 8, 647. [Google Scholar] [CrossRef] [Green Version]
  3. Ellen, M.; Company, M. Towards the Circular Economy: Accelerating the scale-up across global supply chains. World Econ. Forum 2014, 3, 1–64. [Google Scholar]
  4. Johnston, R.B. Arsenic and the 2030 Agenda for sustainable development. In Proceedings of the 6th International Congress on Arsenic in the Environment (As2016), Stockholm, Sweden, 19–23 June 2016; pp. 12–14. [Google Scholar]
  5. Feldman, L.; Hart, P.S. Climate change as a polarizing cue: Framing e ff ects on public support for low-carbon energy policies. Glob. Environ. Chang. 2018, 51, 54–66. [Google Scholar] [CrossRef]
  6. Mccright, A.M.; Charters, M.; Dentzman, K. Examining the Effectiveness of Climate Change Frames in the Face of a Climate Change Denial Counter-Frame. Top. Cogn. Sci. 2016, 8, 76–97. [Google Scholar] [CrossRef]
  7. Walker, J.A.; Kurz, T.; Russel, D. University of Bath Towards an understanding of when non-climate frames can generate public support for climate change policy University of Exeter, United Kingdom NOTE. Environ. Behav. 2018, 50, 781–806. [Google Scholar]
  8. Petrovic, N.; Madrigano, J.; Zaval, L. Motivating mitigation: When health matters more than climate change. Clim. Chang. 2014, 245–254. [Google Scholar] [CrossRef] [Green Version]
  9. Bianchi, C.; Mingo, S.; Fernandez, V. Strategic management in Latin America: Challenges in a changing world. J. Bus. Res. 2019, 105, 306–309. [Google Scholar] [CrossRef]
  10. Desarrollo, B.I. De Creciendo con Productividad: Una Agenda Para la Región Andina; Creciendo con Product: Andalusia, Spain, 2018. [Google Scholar]
  11. Constitución de la Republica del Ecuador Publicación del Registro Oficial 449 de 20 de octubre de. 2008. Available online: https://www.oas.org/juridico/pdfs/mesicic4_ecu_const.pdf (accessed on 14 April 2020).
  12. Gudynas, E. Value, Growth, Development: South American Lessons for a New Ecopolitics. Capital. Nat. Social. 2019, 30, 234–243. [Google Scholar] [CrossRef]
  13. Latorre, S.; Malo-Larrea, A. Policy-making Related Actors’ Understandings About Nature-society Relationship: Beyond Modern Ontologies? The Case of Cuenca, Ecuador. Ecol. Econ. 2019, 156, 387–396. [Google Scholar] [CrossRef]
  14. Vallejo, M.C. Biophysical structure of the Ecuadorian economy, foreign trade, and policy implications. Ecol. Econ. 2010, 70, 159–169. [Google Scholar] [CrossRef]
  15. Latorre, S.; Farrell, K.N.; Martínez-Alier, J. The commodification of nature and socio-environmental resistance in Ecuador: An inventory of accumulation by dispossession cases, 1980-2013. Ecol. Econ. 2015, 116, 58–69. [Google Scholar] [CrossRef]
  16. WorldBank Ecuador. Available online: https://data.worldbank.org/country/ecuador (accessed on 29 February 2020).
  17. Instituto Nacional Ecuatoriano de Cifras Estadística de Información Ambiental Económica en Gobiernos Autónomos Descentralizados Municipales 2015, Gestión Integral de Residuos Sólidos. Available online: https://anda.inec.gob.ec/anda/index.php/catalog/639 (accessed on 1 April 2020).
  18. Instituto Nacional Ecuatoriano de Cifras Información Ambiental en hogares. 2014. Available online: https://www.ecuadorencifras.gob.ec/documentos/web-inec/Encuestas_Ambientales/Hogares_2014/Modulo_ECV/Resultados Principales ECV Ambiental.pdf (accessed on 1 April 2020).
  19. EMAC-EP Relleno sanitario Pichacay. Available online: https://www.emac.gob.ec/?q=content/relleno-sanitario-de-pichacay. (accessed on 4 January 2020).
  20. Cossu, R.; Williams, I.D. Urban mining: Concepts, terminology, challenges. Waste Manag. 2015, 45, 1–3. [Google Scholar] [CrossRef] [PubMed]
  21. Iniciativa Regional del Reciclaje Reciclaje inclusivo y recicladores de base en Ecuador. Available online: https://www.yumpu.com/en/document/read/54482978/libro-reciclaje-inclusivo-y-recicladores-de-base-en-ecuador (accessed on 5 April 2020).
  22. United Nation Framework Convention on Climate Change Recovery and recycling of materials from solid wastes. Available online: https://cdm.unfccc.int/filestorage/2/P/Y/2PYNW9CMSL14D8JH3BZAVF7QOKTE6G/EB100_repan07_AMS-III.AJ.pdf?t=UVl8cTh3aHVxfDAStbVkXp4Otys00yexMEf1 (accessed on 14 April 2020).
  23. United Nation Framework Convention on Climate Change Tool to calculate the emission factor for an electricity system. Available online: https://cdm.unfccc.int/methodologies/PAmethodologies/tools/am-tool-07-v7.0.pdf (accessed on 5 April 2020).
  24. United Nation Framework Convention on Climate Change Emissions from Solid Waste Disposal Sites. Available online: https://cdm.unfccc.int/methodologies/PAmethodologies/tools/am-tool-04-v8.0.pdf (accessed on 5 April 2020).
  25. King, M.F.; Gutberlet, J. Contribution of cooperative sector recycling to greenhouse gas emissions reduction: A case study of Ribeirão Pires, Brazil. Waste Manag. 2013, 33, 2771–2780. [Google Scholar] [CrossRef] [PubMed]
  26. Parchomenko, A.; Nelen, D.; Gillabel, J.; Rechberger, H. Measuring the circular economy - A Multiple Correspondence Analysis of 63 metrics. J. Clean. Prod. 2019, 210, 200–216. [Google Scholar] [CrossRef]
  27. Geissdoerfer, M.; Morioka, S.N.; de Carvalho, M.M.; Evans, S. Business models and supply chains for the circular economy. J. Clean. Prod. 2018, 190, 712–721. [Google Scholar] [CrossRef]
  28. Stewart, R.; Niero, M. Circular economy in corporate sustainability strategies: A review of corporate sustainability reports in the fast-moving consumer goods sector. Bus. Strateg. Environ. 2018, 27, 1005–1022. [Google Scholar] [CrossRef] [Green Version]
  29. Ellen MacArthur Completing the Picture. How the Circular Economy Tackles Climate Change. Available online: https://www.ellenmacarthurfoundation.org/assets/downloads/Completing_The_Picture_How_The_Circular_Economy-_Tackles_Climate_Change_V3_26_September.pdf (accessed on 15 April 2020).
  30. Kyriakopoulos, G.L.; Kapsalis, V.C.; Aravossis, K.G.; Zamparas, M.; Mitsikas, A. Evaluating circular economy under a multi-parametric approach: A technological review. Sustainability 2019, 11, 6139. [Google Scholar] [CrossRef] [Green Version]
  31. Morseletto, P. Targets for a circular economy. Resour. Conserv. Recycl. 2020, 153, 104553. [Google Scholar] [CrossRef]
  32. Sassanelli, C.; Rosa, P.; Rocca, R.; Terzi, S. Circular economy performance assessment methods: A systematic literature review. J. Clean. Prod. 2019, 229, 440–453. [Google Scholar] [CrossRef]
  33. Walmsley, T.G.; Ong, B.H.Y.; Klemeš, J.J.; Tan, R.R.; Varbanov, P.S. Circular Integration of processes, industries, and economies. Renew. Sustain. Energy Rev. 2019, 107, 507–515. [Google Scholar] [CrossRef]
  34. Winans, K.; Kendall, A.; Deng, H. The history and current applications of the circular economy concept. Renew. Sustain. Energy Rev. 2017, 68, 825–833. [Google Scholar] [CrossRef]
  35. Calderón Márquez, A.J.; Cassettari Filho, P.C.; Rutkowski, E.W.; de Lima Isaac, R. Landfill mining as a strategic tool towards global sustainable development. J. Clean. Prod. 2019, 226, 1102–1115. [Google Scholar] [CrossRef]
  36. Gusukuma, M.; Kahhat, R. Electronic waste after a digital TV transition: Material flows and stocks. Resour. Conserv. Recycl. 2018, 138, 142–150. [Google Scholar] [CrossRef]
  37. Park, J.; Díaz-Posada, N.; Mejía-Dugand, S. Challenges in implementing the extended producer responsibility in an emerging economy: The end-of-life tire management in Colombia. J. Clean. Prod. 2018, 189, 754–762. [Google Scholar] [CrossRef]
  38. Margallo, M.; Ziegler-Rodriguez, K.; Vázquez-Rowe, I.; Aldaco, R.; Irabien, Á.; Kahhat, R. Enhancing waste management strategies in Latin America under a holistic environmental assessment perspective: A review for policy support. Sci. Total Environ. 2019, 689, 1255–1275. [Google Scholar] [CrossRef] [PubMed]
  39. Mikulčić, H.; Baleta, J.; Klemeš, J.J. Sustainability through combined development of energy, water and environment systems. J. Clean. Prod. 2020, 251. [Google Scholar] [CrossRef]
  40. Méndez-Fajardo, S.; Böni, H.; Vanegas, P.; Sucozhañay, D. Improving Sustainability of E-waste Management Through the Systemic Design of Solutions: The Cases of Colombia and Ecuador; Butterworth-Heinemann: Oxford, UK, 2020; ISBN 9780128170304. [Google Scholar]
  41. Karak, T.; Bhagat, R.M.; Bhattacharyya, P. Municipal solid waste generation, composition, and management: The world scenario. Crit. Rev. Environ. Sci. Technol. 2012, 42, 1509–1630. [Google Scholar] [CrossRef]
  42. Ferronato, N.; Rada, E.C.; Gorritty Portillo, M.A.; Cioca, L.I.; Ragazzi, M.; Torretta, V. Introduction of the circular economy within developing regions: A comparative analysis of advantages and opportunities for waste valorization. J. Environ. Manag. 2019, 230, 366–378. [Google Scholar] [CrossRef]
  43. Jara-Samaniego, J.; Pérez-Murcia, M.D.; Bustamante, M.A.; Pérez-Espinosa, A.; Paredes, C.; López, M.; López-Lluch, D.B.; Gavilanes-Terán, I.; Moral, R. Composting as sustainable strategy for municipal solid waste management in the Chimborazo Region, Ecuador: Suitability of the obtained composts for seedling production. J. Clean. Prod. 2017, 141, 1349–1358. [Google Scholar] [CrossRef]
  44. Moya, D.; Aldás, C.; Jaramillo, D.; Játiva, E.; Kaparaju, P. Waste-To-Energy Technologies: An opportunity of energy recovery from Municipal Solid Waste, using Quito - Ecuador as case study. Energy Procedia 2017, 134, 327–336. [Google Scholar] [CrossRef]
  45. Stern, J.; Southgate, D.; Strasma, J. Improving garbage collection in Latin America’s slums: Some lessons from Machala, Ecuador. Resour. Conserv. Recycl. 1997, 20, 219–224. [Google Scholar] [CrossRef]
  46. Ministerio del Ambiente Ecuador Programa Nacional para la Gestión Integral de Desechos Sólidos. Available online: https://www.ambiente.gob.ec/wp-content/uploads/downloads/2016/02/PNGIDS.pdf (accessed on 8 April 2020).
  47. Botello-Álvarez, J.E.; Rivas-García, P.; Fausto-Castro, L.; Estrada-Baltazar, A.; Gomez-Gonzalez, R. Informal collection, recycling and export of valuable waste as transcendent factor in the municipal solid waste management: A Latin-American reality. J. Clean. Prod. 2018, 182, 485–495. [Google Scholar] [CrossRef]
  48. Brunner, P.H. Urban Mining A Contribution to Reindustrializing the City. Ind. Ecol. 2011, 15. [Google Scholar] [CrossRef]
  49. Gutberlet, J. Cooperative urban mining in Brazil: Collective practices in selective household waste collection and recycling. Waste Manag. 2015, 45, 22–31. [Google Scholar] [CrossRef]
  50. Aparcana, S. Approaches to formalization of the informal waste sector into municipal solid waste management systems in low- and middle-income countries: Review of barriers and success factors. Waste Manag. 2017, 61, 593–607. [Google Scholar] [CrossRef] [Green Version]
  51. Fidelis, R.; Colmenero, J.C. Evaluating the performance of recycling cooperatives in their operational activities in the recycling chain. Resour. Conserv. Recycl. 2018, 130, 152–163. [Google Scholar] [CrossRef]
  52. Guerrero, L.A.; Maas, G.; Hogland, W. Solid waste management challenges for cities in developing countries. Waste Manag. 2013, 33, 220–232. [Google Scholar] [CrossRef]
  53. Vinyes, E.; Oliver-Solà, J.; Ugaya, C.; Rieradevall, J.; Gasol, C.M. Application of LCSA to used cooking oil waste management. Int. J. Life Cycle Assess. 2013, 18, 445–455. [Google Scholar] [CrossRef]
  54. Hacer Ak, W.B. Sustainable Municipal Solid Waste Management Decision Making: Development and Implementation of a Single Score Sustainability Index. Available online: https://www.emerald.com/insight/content/doi/10.1108/MEQ-03-2015-0028/full/pdf?title=sustainable-municipal-solid-waste-management-decision-making-development-and-implementation-of-a-single-score-sustainability-index (accessed on 15 April 2020).
  55. Lu, Y.T.; Lee, Y.M.; Hong, C.Y. Inventory analysis and social life cycle assessment of greenhouse gas emissions from waste-to-energy incineration in Taiwan. Sustainability 2017, 9, 1959. [Google Scholar] [CrossRef] [Green Version]
  56. Aparcana, S.; Salhofer, S. Application of a methodology for the social life cycle assessment of recycling systems in low income countries: Three Peruvian case studies. Int. J. Life Cycle Assess. 2013, 18, 1116–1128. [Google Scholar] [CrossRef]
  57. Ibáñez-Forés, V.; Bovea, M.D.; Coutinho-Nóbrega, C.; de Medeiros, H.R. Assessing the social performance of municipal solid waste management systems in developing countries: Proposal of indicators and a case study. Ecol. Indic. 2019, 98, 164–178. [Google Scholar] [CrossRef]
  58. Qu, S.; Guan, D.; Ma, Z.; Yi, X. A study on the optimal path of methane emissions reductions in a municipal solid waste landfill treatment based on the IPCC-SD model. J. Clean. Prod. 2019, 222, 252–266. [Google Scholar] [CrossRef]
  59. Potdar, A.; Singh, A.; Unnnikrishnan, S.; Naik, N.; Naik, M.; Nimkar, I. Innovation in solid waste management through Clean Development Mechanism in India and other countries. Process Saf. Environ. Prot. 2016, 101, 160–169. [Google Scholar] [CrossRef]
  60. John, B.; Luederitz, C.; Lang, D.J.; von Wehrden, H. Toward Sustainable Urban Metabolisms. From System Understanding to System Transformation. Ecol. Econ. 2019, 157, 402–414. [Google Scholar] [CrossRef]
  61. Sasson, A.; Malpica, C. Bioeconomy in Latin America. New Biotechnol. 2018, 40, 40–45. [Google Scholar] [CrossRef] [PubMed]
  62. Velvizhi, G.; Shanthakumar, S.; Das, B.; Pugazhendhi, A.; Priya, T.S.; Ashok, B.; Nanthagopal, K.; Vignesh, R.; Karthick, C. Jo ur of. Sci. Total Environ. 2020, 138049. [Google Scholar] [CrossRef]
  63. Xavier, L.H.; Giese, E.C.; Ribeiro-Duthie, A.C.; Lins, F.A.F. Sustainability and the circular economy: A theoretical approach focused on e-waste urban mining. Resour. Policy 2019, 101467. [Google Scholar] [CrossRef]
  64. Instituto Nacional Ecuatoriano de Cifras Conozcamos Cuenca a través de sus cifras. Available online: http://www.ecuadorencifras.gob.ec/conozcamos-cuenca-a-traves-de-sus-cifras/ (accessed on 8 April 2020).
  65. Instituto Nacional Ecuatoriano de Cifras Censo de población y vivienda Ecuador 2010- Azuay. Available online: https://www.ecuadorencifras.gob.ec/censo-de-poblacion-y-vivienda/ (accessed on 8 April 2020).
  66. Instituto Nacional Ecuatoriano de Cifras Encuesta nacional de empleo,desempleo y subempleo. Available online: https://www.ecuadorencifras.gob.ec/pobreza-diciembre-2019/ (accessed on 4 April 2020).
  67. Azuay una provincia con buenos niveles de actividad económica. Available online: https://www.ekosnegocios.com/articulo/azuay-una-provincia-con-buenos-niveles-de-actividad-economica (accessed on 4 April 2020).
  68. Parra, R. Inventario de Emisiones Atmosféricas del Cantón Cuenca. 2014. Available online: https://www.researchgate.net/publication/311789933_Inventario_de_Emisiones_Atmosfericas_del_Canton_Cuenca_2014 (accessed on 4 April 2020).
  69. EMAC-EP Sitema integral de reciclaje de la ciudad de Cuenca. Available online: https://www.emac.gob.ec. (accessed on 10 April 2020).
  70. EMAC-EP Reforma al Reglamento que Establece los Requisitos Para Obtener la Autorización Para Realizar Labores de Reciclaje de Residuos Sólidos Inorgánicos en el Cantón Cuenca. Available online: http://www.emac.gob.ec/sites/default/files/REGLAMENTODERECICLAJE.pdf (accessed on 10 April 2020).
  71. Jimbo, E.; Cajamarca, S. De cero a Dinero. Ciencias la Adm. y Econ. 2019, 9–67. [Google Scholar]
  72. Lago, E.D.; Boaretti, C.; Piovesan, F.; Roso, M.; Lorenzetti, A.; Modesti, M. The effect of different compatibilizers on the properties of a post-industrial PC/PET blend. Materials (Basel) 2018, 12, 1–14. [Google Scholar]
  73. Agencia de Regulación y Control de Electricidad Ecuador Estadística anual y multianual del sector eléctrico ecuatoriano. Available online: https://www.regulacionelectrica.gob.ec/wp-content/uploads/downloads/2018/10/estadistica reducida.pdf (accessed on 8 February 2020).
  74. Agencia de Regulación y Control de Electricidad Estadística anual y multianual del sector eléctrico ecuatoriano. Available online: https://www.regulacionelectrica.gob.ec/wp-content/uploads/downloads/2017/04/Est_2016_Anexos.pdf (accessed on 8 February 2020).
  75. Agencia de Regulación y Control de Electricidad Ecuador Estadística Anual y Multianual del Sector Eléctrico Ecuatoriano. Available online: https://www.regulacionelectrica.gob.ec/wp-content/plugins/download-monitor/download.php?id=1652&force=0 (accessed on 8 February 2020).
  76. Parra Narváez, R. Factor de emisión de CO2 debido a la generación de electricidad en el Ecuador durante el periodo 2001-2014. ACI Av. en Ciencias e Ing. 2015, 7. [Google Scholar]
  77. Intergovernmental Panel on Climate Change Revised 1996 IPCC Guidelines for National Greenhouse Gas Inventories. Available online: https://www.ipcc-nggip.iges.or.jp/public/gl/invs1.html (accessed on 8 February 2020).
  78. Chen, T.C.; Lin, C.F. Greenhouse gases emissions from waste management practices using Life Cycle Inventory model. J. Hazard. Mater. 2008, 155, 23–31. [Google Scholar] [CrossRef] [PubMed]
  79. Friedrich, E.; Trois, C. GHG emission factors developed for the recycling and composting of municipal waste in South African municipalities. Waste Manag. 2013, 33, 2520–2531. [Google Scholar] [CrossRef] [PubMed]
  80. Wilson, D.C.; Araba, A.O.; Chinwah, K.; Cheeseman, C.R. Building recycling rates through the informal sector. Waste Manag. 2009, 29, 629–635. [Google Scholar] [CrossRef]
  81. Colling, A.V.; Oliveira, L.B.; Reis, M.M.; Da Cruz, N.T.; Hunt, J.D. Brazilian recycling potential: Energy consumption and Green House Gases reduction. Renew. Sustain. Energy Rev. 2016, 59, 544–549. [Google Scholar] [CrossRef]
  82. Gomes, H.P.; Nóbrega, C.C. Economic viability study of a separate household waste collection in a developing country. J. Mater. Cycles Waste Manag. 2005, 7, 116–123. [Google Scholar] [CrossRef]
  83. Pimenteira, C.A.P.; Pereira, A.S.; Oliveira, L.B.; Rosa, L.P.; Reis, M.M.; Henriques, R.M. Energy conservation and CO 2 emission reductions due to recycling in Brazil. Waste Manag. 2004, 24, 889–897. [Google Scholar] [CrossRef]
  84. Rigamonti, L.; Grosso, M.; Giugliano, M. Life cycle assessment for optimising the level of separated collection in integrated MSW management systems. Waste Manag. 2009, 29, 934–944. [Google Scholar] [CrossRef]
  85. Merrild, H.; Damgaard, A.; Christensen, T.H. Life cycle assessment of waste paper management: The importance of technology data and system boundaries in assessing recycling and incineration. Resour. Conserv. Recycl. 2008, 52, 1391–1398. [Google Scholar] [CrossRef]
  86. Damgaard, A.; Larsen, A.W.; Christensen, T.H. Recycling of metals: Accounting of greenhouse gases and global warming contributions. Waste Manag. Res. 2009, 27, 773–780. [Google Scholar] [CrossRef] [PubMed] [Green Version]
Figure 1. Cuenca-Ecuador Location. Source: [68].
Sustainability 12 03406 g001
Figure 2. Urban waste management diagram. (1). The information provided in Table A2 shows that only a reduced percentage of recyclers (less than 10%) actually process their material (cleaning, compacting or crushing) [71]. However, those who do carry out this process do so by means of the equipment available at two of the five recycling cooperatives. Cooperatives may supply industry directly but in practice, most supply their material to agents or brokers. In general, this is usually due to the fact that they are unable to support the payment conditions dictated by industry as well as the requirements regarding minimal order volume. (2) Jimbo and Cajamarca [71] point out that it is the broker who has the necessary capacity to stockpile and process the material, in keeping with industry requirements for acquisition. Included in the main processing tasks are washing, cleaning, centrifuging, crushing, compacting, and transporting.
Sustainability 12 03406 g002
Figure 3. Waste management scheme in CE.
Sustainability 12 03406 g003
Table 1. Main residues collected in Ecuador.
MaterialCuencaQuitoGuayaquil
White paper15%10%12%
Economic paper12%7%14%
Cardboard15%17%16%
Soft plastic (LDPE)13%10%13%
Hard plastic (HDPE)11%8%9%
Polyethylene terephthalate PET13%24%20%
Glass6%3%11%
Metals12%19%5%
Electronic waste3%2%0%
Source: IRR [21].
Table 2. Per capita income of the informal recycler in Cuenca.
CUENCA
MaterialPrice (USD/kg)Collection Volume (Kg/day)Sales Volume (USD/day)
Paperboard0.077.380.52
White paper0.096.040.54
Economic role0.082.370.19
Soft plastic0.143.510.49
Hard plastic0.113.590.39
Iron0.063.940.24
Glass0.134.40.57
Electronic equipment0.052.650.13
PET0.352.991.05
Total374.12
Monthly per capita income123.4
Table 3. Summary of baseline emissions, recycling, and contribution per capita.
Material (i)Volume
(t)
Baseline Emissions (tCO2-eq)Recycled Material Emissions (tCO2-eq)Emissions Reduction (tCO2-eq)CH4 Emissions from Landfill Deviation (tCO2-eq)Emissions Reduction per ton of Recycled Material (tCO2-eq)
HDPE5238.277.7630.51-0.59
LDPE5347.677.9139.76-0.75
PET4434.046.5727.47-0.62
Paper and cardboard306224.9280.96143.962738.7 (b)0.047-9.42 (c)
Glass720.0360.000.036-0.005 (d)
Iron (a)67581147.00-0.70
Total594402,933.14114.2288,739.032738.70.48-4.61
Notes: 1. 100% of the scrap metal collected is iron. 2. The total reduction of emissions per ton of recycled paper and cardboard is equivalent to the sum of tCO2-eq for material processing and diversion from landfills. 3. The energy consumption emission factor of recycled glass is near 0, so the emission reduction can be estimated as 100%. 4. The results correspond to the replacement of virgin raw material by recycling and diversion of landfill material, respectively.
Table 4. A: Total emissions avoided, 600 recyclers [69]. B: Total emissions avoided, 3472 recyclers [21].
Material (i)Volume
(t)
Baseline Emissions (tCO2-eq)Recycled Material Emissions (tCO2-eq)Emissions Reduction (tCO2-eq)CH4 Emissions from Landfill Deviation (tCO2-eq)Emissions Reduction per ton of Recycled Material (tCO2-eq)
A: Total emissions avoided, 600 recyclers [69]HDPE380.4279.5456.68222.91-0.59
LDPE387.6348.857.75291.08-0.75
PET318245.8147.38198.43-0.62
Paper and cardboard22981689.3606.671082.3520,567.10.047–9.42
Glass526.80.26300.262-0.005
Iron490.2424.0280.393343,62-0.70
Total44012987.56848.8792138.6820,567.10.48-4.61
B: Total emissions avoided, 3472 recyclers [21]HDPE2201.241617.9327.981289.9-0.59
LDPE2242.92018.61334.191684.41-0.75
PET1840.161422.44274.181148.25-0.62
Paper and cardboard13,297.769773.853510.66263.24119,014.950.047–9.42
Glass3048.4152401.524-0.005
Iron2836.62453.65465,2021988.46-0.70
Total22,630.4617,288.034912.1712,375.82119,014.950.48-4.61

