Article

Determinants of Guest Experience in Airbnb: A Topic Modeling Approach Using LDA

Tourism Industry Data Analytics Lab (TIDAL), Department of Hospitality and Tourism Management, Sejong University, Seoul 05006, Korea
*
Author to whom correspondence should be addressed.
Sustainability 2020, 12(8), 3402; https://doi.org/10.3390/su12083402
Submission received: 5 April 2020 / Revised: 14 April 2020 / Accepted: 21 April 2020 / Published: 22 April 2020
(This article belongs to the Special Issue Web 2.0 in Tourism and Hospitality Industries)

Abstract

:
This study inductively analyzes the topics of interest that drive customer experience and satisfaction within the sharing economy of the accommodation sector. Using a dataset of 1,086,800 Airbnb reviews across New York City, the text is preprocessed and latent Dirichlet allocation is utilized in order to extract 43 topics of interest from the user-generated content. The topics fall into one of several categories, including the general evaluation of guests, centralized or decentralized location attributes of the accommodation, tangible and intangible characteristics of the listed units, management of the listing or unit, and service quality of the host. The deeper complex relationships between topics are explored in detail using hierarchical Ward Clustering.

1. Introduction

Due to the subjective nature of guest satisfaction in the hospitality industry, determining the antecedents of guest satisfaction and dissatisfaction is elusive, particularly for industry players [1]. Since the sharing economy within the hospitality sector is, as of yet, still short-lived and accommodation is decentralized, understanding which aspects are of importance to customer experience is even more difficult [2]. Despite a wealth of information being available on the subject in the form of user-generated content (UGC), there is surprisingly little research in the area related to its importance. Instead, much research adapts previous models and conceptions of guest satisfaction and customer experience to the new paradigm of peer-to-peer (P2P) accommodation, despite these conceptions being wholly unfit for the new environments of P2P accommodation such as Airbnb. As Rauch et al. [3] correctly point out, there is an over-saturation of academic focus on 4 and 5-star hotels, and more research is needed in other accommodation segments. The blossoming area of research that is exploring the new paradigm of P2P accommodation is still relatively immature, and the dimensions affecting guests in the P2P accommodation space should be seen as unique to those of traditional accommodation markets.
Sharing economies in the accommodation market are considerably different than those for traditional accommodation, such as hotels and motels, in several notable ways. Overnight guests are often staying in a broader range of accommodation unit types, such as on a couch in an apartment, in shared houses, and even in mansions [4]. Customers have distinctly different interactions with hosts than with employees [5]. There is much more variety in service and experience quality in the shared accommodation market compared to in the traditional accommodation market, and there is also less standardization of the units available [6]. Furthermore, there is also significantly less brand recognition, if any, compared to with traditional accommodation. Therefore, customers put a higher emphasis on user-generated reviews in order to judge the quality of a property, since they are often the most reliable information available.
Despite the critical importance of reviews and the substantial wealth of knowledge available, academic research is still struggling to fully utilize the breadth of user feedback that is accessible. Secondly, online user-generated content is not restricted by the same limitations as reviews of traditional hotels and the survey methods that are ubiquitous among extant research in hospitality. Instead, UGC sample sizes tend to be magnitudes larger, and the data generated are largely unstructured, meaning that they are not restricted by the prior existing constructs of topics of interest, although they are more difficult to extract meaning from. Thirdly, recent innovations in information technologies, computing, and big data analysis techniques have made it easier for researchers to analyze and gain meaningful insight from the plethora of information offered by UGC; however, due to the recency of such technological innovations in text analytics such as sentiment analysis and topic modeling techniques, the extant research regarding UGC of the sharing economy within the hospitality industry is likely still in its infancy. Therefore, this study aims to utilize cutting-edge text analytics methodologies on UGC in order to contribute to filling these research gaps.
Of the new methodologies in text analytics, sentiment analysis alone has limited effectiveness for gaining insight from large datasets of aggregated reviews, despite being common in the hospitality literature [7,8]. Furthermore, since sentiments reflect personal and subjective satisfaction levels, aggregating these preferences over a large number of reviews fails to capture the individual nature of these sentiments, wherein one individual’s preferences may be countered by another. Therefore, we place greater emphasis on the importance of the topics of discussion, rather than the sentiment of each individual. Topic modeling techniques are of particular utility for breaking down the latent topics of interest in UGC. Latent Dirichlet allocation (LDA), a stochastic admixture model proposed by Blei, Ng, and Jordan [9,10], allows for words to belong to multiple topics and documents to consist of multiple topics, thereby representing a practical semantic modeling tool for extracting meaningful insight from large corpora of user-generated text reviews.
The aim of this study is to extract meaningful and actionable insight from the UGC of Airbnb customers in New York City, in order to inform researchers and industry practitioners on the topics of interest, the relative proportional importance of those topics of interest, and the relationship between different topics of interest. New York City was chosen due to the large size of data availability, the diversity in guests and hosts, and the high concentration of diverse neighborhoods. In order to achieve the goals of this research, three objectives are established. (1) To extract the latent topics that compose the areas of interest in customers’ minds represented by topics of discussion in the UGC. (2) To validate the topics extracted and organize them into meaningful groupings. (3) To compare the relative similarities and dissimilarities in order to better conceptualize the relationships between topics.
In this study, extant literature on customer experience in more traditional accommodation, such as hotels and motels, is reviewed. Then, the importance of peer-to-peer accommodation is outlined, followed by a review of studies analyzing the drivers of customer experience in the peer-to-peer accommodation segment. This study uses latent Dirichlet allocation in order to extract the latent topics to fulfill the first goal of the research. Secondly, the extracted topics are validated in several ways, mainly by analyzing the documents with the correspondingly highest proportions of each topic. Furthermore, validation of the location-specific topics is achieved by mapping the locations of accommodation units in accordance with the proportion of the topics represented by reviews at those locations. The authors then loosely categorize these topics into four types (i.e., evaluation, location, unit, and management) based on previous literature, for ease of interpretation. Finally, the topics are analyzed via Ward hierarchical clustering in order to empirically establish the relationships between topics, thereby showing which topics are more closely or distantly related.

2. Literature Review

2.1. Customer Experience in the Traditional Accommodation Sector

Customer experience in the traditional accommodation sector (e.g., hotels, motels, and resorts) has typically been defined using relatively antiquated measurement tools such as SERVQUAL [11], LODGQUAL [12], HOLSERV [13], SERVPERF [14], and Customer Experience Quality (EXQ) [15,16]. These measurement tools identify several important dimensions, most notably the physical characteristics of the service encounter (tangibility), the proper execution of services (reliability), staff’s willingness to help (responsiveness), staff’s knowledge and manners (assurance), staff’s capacity to care for guests (empathy), the customer’s contact experience with staff (contact), and variations in these dimensions [11,12,13,14]. However, more recent studies have built upon the foundation laid out by these tools and elucidate the dimensions of customer experience in the hospitality industry using modern methodologies and big data.
User-generated content in the form of online reviews is an important factor in guests’ purchase decisions [17], and is a valuable source of information and insight into customer experience that hotels can utilize to improve customer satisfaction [18]. A large body of research has mined UGC for information via content analysis in order to determine which topics of interest are of importance to customers [19,20,21,22]. The content analysis of 42,668 Chinese reviews in Beijing revealed six factors of interest, including logistics (distance to tourist destinations, convenience of transportation access), facilities, reception services, foods and beverages, cleanliness and maintenance, and value for money [19]. A study of 919 English TripAdvisor reviews in New York City similarly found six factors including location, neighborhood, room size, beds, staff, and breakfast [22]. Among these six factors, the quality of staff was found to be most important among both highly ranked and lowly ranked hotels, and for both full-service and limited-service hotels [22]. Another study used latent Dirichlet allocation on 266,544 English reviews of hotels across 16 countries on TripAdvisor to identify 30 topics of interest [23]. Another study used LDA on 104,161 English reviews of Korean accommodation across South Korea and found differences in the prevalence of 14 topics between accommodation types and accommodation locations [24], indicating that topics change for different accommodation types and contexts.

2.2. Sharing Economy of the Accommodation Sector

In 2008, Lessig introduced the term “sharing economy”, defined as “the collaborative consumption made by the activities of sharing, exchanging, and rental of resources without owning the goods” [25,26]. Other terms have also been coined to describe the same phenomenon, such as the “gig economy”, “on-demand economy”, “peer economy”, and “collaborative economy” [27,28]. The sharing economy has upended several mature industries due to the convenience and accessibility that the sharing economy offers [29]. One such industry upended by the sharing economy is the hotel industry and that of traditional accommodation [27]. Most notably, the sharing economy in the accommodation sector is dominated by Airbnb.
The importance of Airbnb in the hospitality industry cannot be understated in its size or growth. For instance, as of 2017, Airbnb was valued at nearly twice the value of Hilton Worldwide Holdings, at $31 billion USD, operating across over 191 countries [30]. Studies have found that a 1% increase in Airbnb listings is associated with a 0.05% decrease in quarterly hotel revenues [31]. Another study noted that a 1% increase in Airbnb listings led to a decrease of 0.02% in revenue per available room (RevPAR) among hotels within the same market [32]. For New York City in particular, in 2016, Airbnb accounted for 9.7% of accommodation demand [33]. One critical success factor for Airbnb in outcompeting hotels is in the ability to personalize the accommodation experience for customers via micro-segmentation, in which customers can find the perfect match with a host or place of accommodation that fits their needs [34].

2.3. Customer Experience in Peer-to-Peer Accommodation

Due to the growing importance of the peer-to-peer accommodation market, the focus of many researchers and industry practitioners has turned to factors affecting consumer behavior and to their purchasing decision-making processes. By identifying which topics are of most interest to Airbnb guests, researchers and industry practitioners can gain insight into the factors that determine guest satisfaction. Using questionnaires on 202 international tourists to Phuket, one study identified the importance of several factors, including tangibles, convenience, assurance, understanding and caring, the supply of adequate service, general satisfaction, and loyalty [35]. A mixed method analysis of 16,430 Airbnb reviews followed by 322 online surveys found that service quality attributes could be broken down into those regarding the website, host, and facility [36]. An analysis of customer experience factors across several countries found wide agreement rather than divergence regarding the factors, including the stay, host, place, location, apartment, room, and city [37].
Topic modeling has been applied to Airbnb reviews in order to gain insight into the aspects of customer experience that drive customer satisfaction. One experimental study used LDA on the listing information of Airbnb properties to extract topics in order to match guests with listings, finding that the method performed as a better recommender system than TF-IDF and that guest reviews allowed for the best matches over metadata [38]. Thereby, the study supports the utilization of LDA on guest reviews as a suitable method for understanding guest satisfaction dimensions. A large-scale application of LDA on 2,799,420 reviews of 64,464 Airbnb listings across 10 US cities identified 16 topics, including praise and recommendation, homey and warm feeling, beautiful view/garden, nice and clean room, late check-in, help from host, public transportation, general experience, cleanliness and comfort, host response, first Airbnb experience, parking and location, amenities in the room, room in the night, restaurants and shopping, and general recommendation [39]. Another study of 1,026,988 reviews of 50,933 listings across seven US cities extracted 15 topics, including general recommendation, late/evening check-in, room cleanliness/apartment, patio and deck view, food in kitchen, transportation/location, help from host, homey, door lock/key, sleep condition/bed, car parking, restaurant/shopping, bathroom/shower, hosts’ response, and room experience [40]. A limitation of using LDA over multiple countries or multiple cities is that while the results are more generalizable, local attractions in the destinations are under-represented in the results due to the nature of word co-occurrences. Therefore, we suggest that deeper insight can actually be obtained by using a more limited number of cities.

3. Materials and Methods

3.1. Research Context

While using a singular city for the sample may limit the generalization of results, it offers a purer analysis of the topics of interest with algorithmic efficiency due to the limited set of location-based keywords, without being confounded by location-based differences, differences in subsample size by city, and the contextualization of neighborhoods or landmarks. New York City (NYC) was chosen as the sample for several reasons. (1) The city’s diversity offers a rich insight into a wide variety of types of attraction, types and backgrounds of guests/hosts, and differing motivations for guests/hosts to engage in the sharing economy. (2) The sample size is extremely large, allowing for clear convergences of topics. (3) Stark contrasts in location characteristics from neighborhood to neighborhood allow for a high density of reviews with diverse traits.
New York City is divided into five boroughs: Manhattan, Queens, Brooklyn, Staten Island, and the Bronx. While Manhattan continues to be the most popular tourist destination, travel and tourism are increasing in all boroughs, according to the 2019 Travel and Tourism Trend Report from the city’s tourism board [41]. For 2018, the value of lodging in New York City hotels alone was $13.5 billion USD, which represents a massive spike from the previous five-year trend [41]. Spending among visitors in Queens and Brooklyn means that they represent the second and third most popular boroughs for direct visitor spending after Manhattan [41]. The peer-to-peer accommodation market available in NYC offers a wide range of types of property and location, such as riverfront properties, park-adjacent properties, urban dwellings, apartments, houses, and brownstones. Figure 1a depicts a hybrid satellite map of New York City along with some of the surrounding area. Figure 1b maps the positions of the finalized sample of Airbnb property locations included in this study as black points along the same latitude and longitude plane of Figure 1a.

3.2. Data Collection and Sample

Data were collected via Inside Airbnb (insideairbnb.com), which is an open-source and independent organization that offers aggregated publicly available data from Airbnb on dozens of locations worldwide and other tools for research purposes. Inside Airbnb uses open-source technologies for crawling, mainly Python code, to retrieve publicly available data from Airbnb directly. For the present study, only the user-generated reviews and geo-location information of the accommodation listings were used. A dataset of 1,086,800 Airbnb reviews of 49,056 listings was compiled from Inside Airbnb, and all subsequent analyses and data handling were executed by the authors. Reviews containing four words or less were screened out of the dataset, along with non-English reviews. After the full screening procedures, a finalized sample of 919,297 Airbnb reviews of 38,149 listed properties were used for modeling and analysis, leaving an average of approximately 24 reviews per listing.

3.3. Analysis Tools and Techniques

All data handling, preprocessing, modeling, analysis, and visualization was executed via the R programming language. Text was preprocessed by eliminating short reviews of four words or less, as were non-English reviews that were detected through the implementation of Google’s Compact Language Detector 3 in R. A standard list of stopwords was deleted, along with punctuation, numbers, and a short list of non-traditional stopwords unique to the dataset, such as programming cues and emoticons including ‘xD’, ‘\\t’ and ‘\\n’. Stemming is necessary in LDA in order to match word stems. We used the hunspell stemming dictionary via the hunspell R package, because it performs better than algorithmic stemmers, such as SnowballC in our modeling tests, due to the fact that it eliminates most proper nouns, thereby avoiding the confounding effects of names.
The ldatuning and topicmodels packages were used to find the optimal number of topics and to perform the latent Dirichlet allocation. The LDA modeling used the Gibbs Sampling algorithm set at 2000 iterations, and the LDA processing alone took 37.2 h on a 2.6 GHz Intel i7 6-Core 2018 MacBook Pro with 32 GB of RAM. Mapping was executed via the ggmap package by retrieving Google Map data [42]. Statistical distances were calculated via the textmineR package, and squared distances were used properly according to the classic Ward1 implementation of the algorithm [43,44] in terms of the Lance-Williams update formula [45] for Ward Clustering. Base R coding was preferred wherever applicable.

4. Results

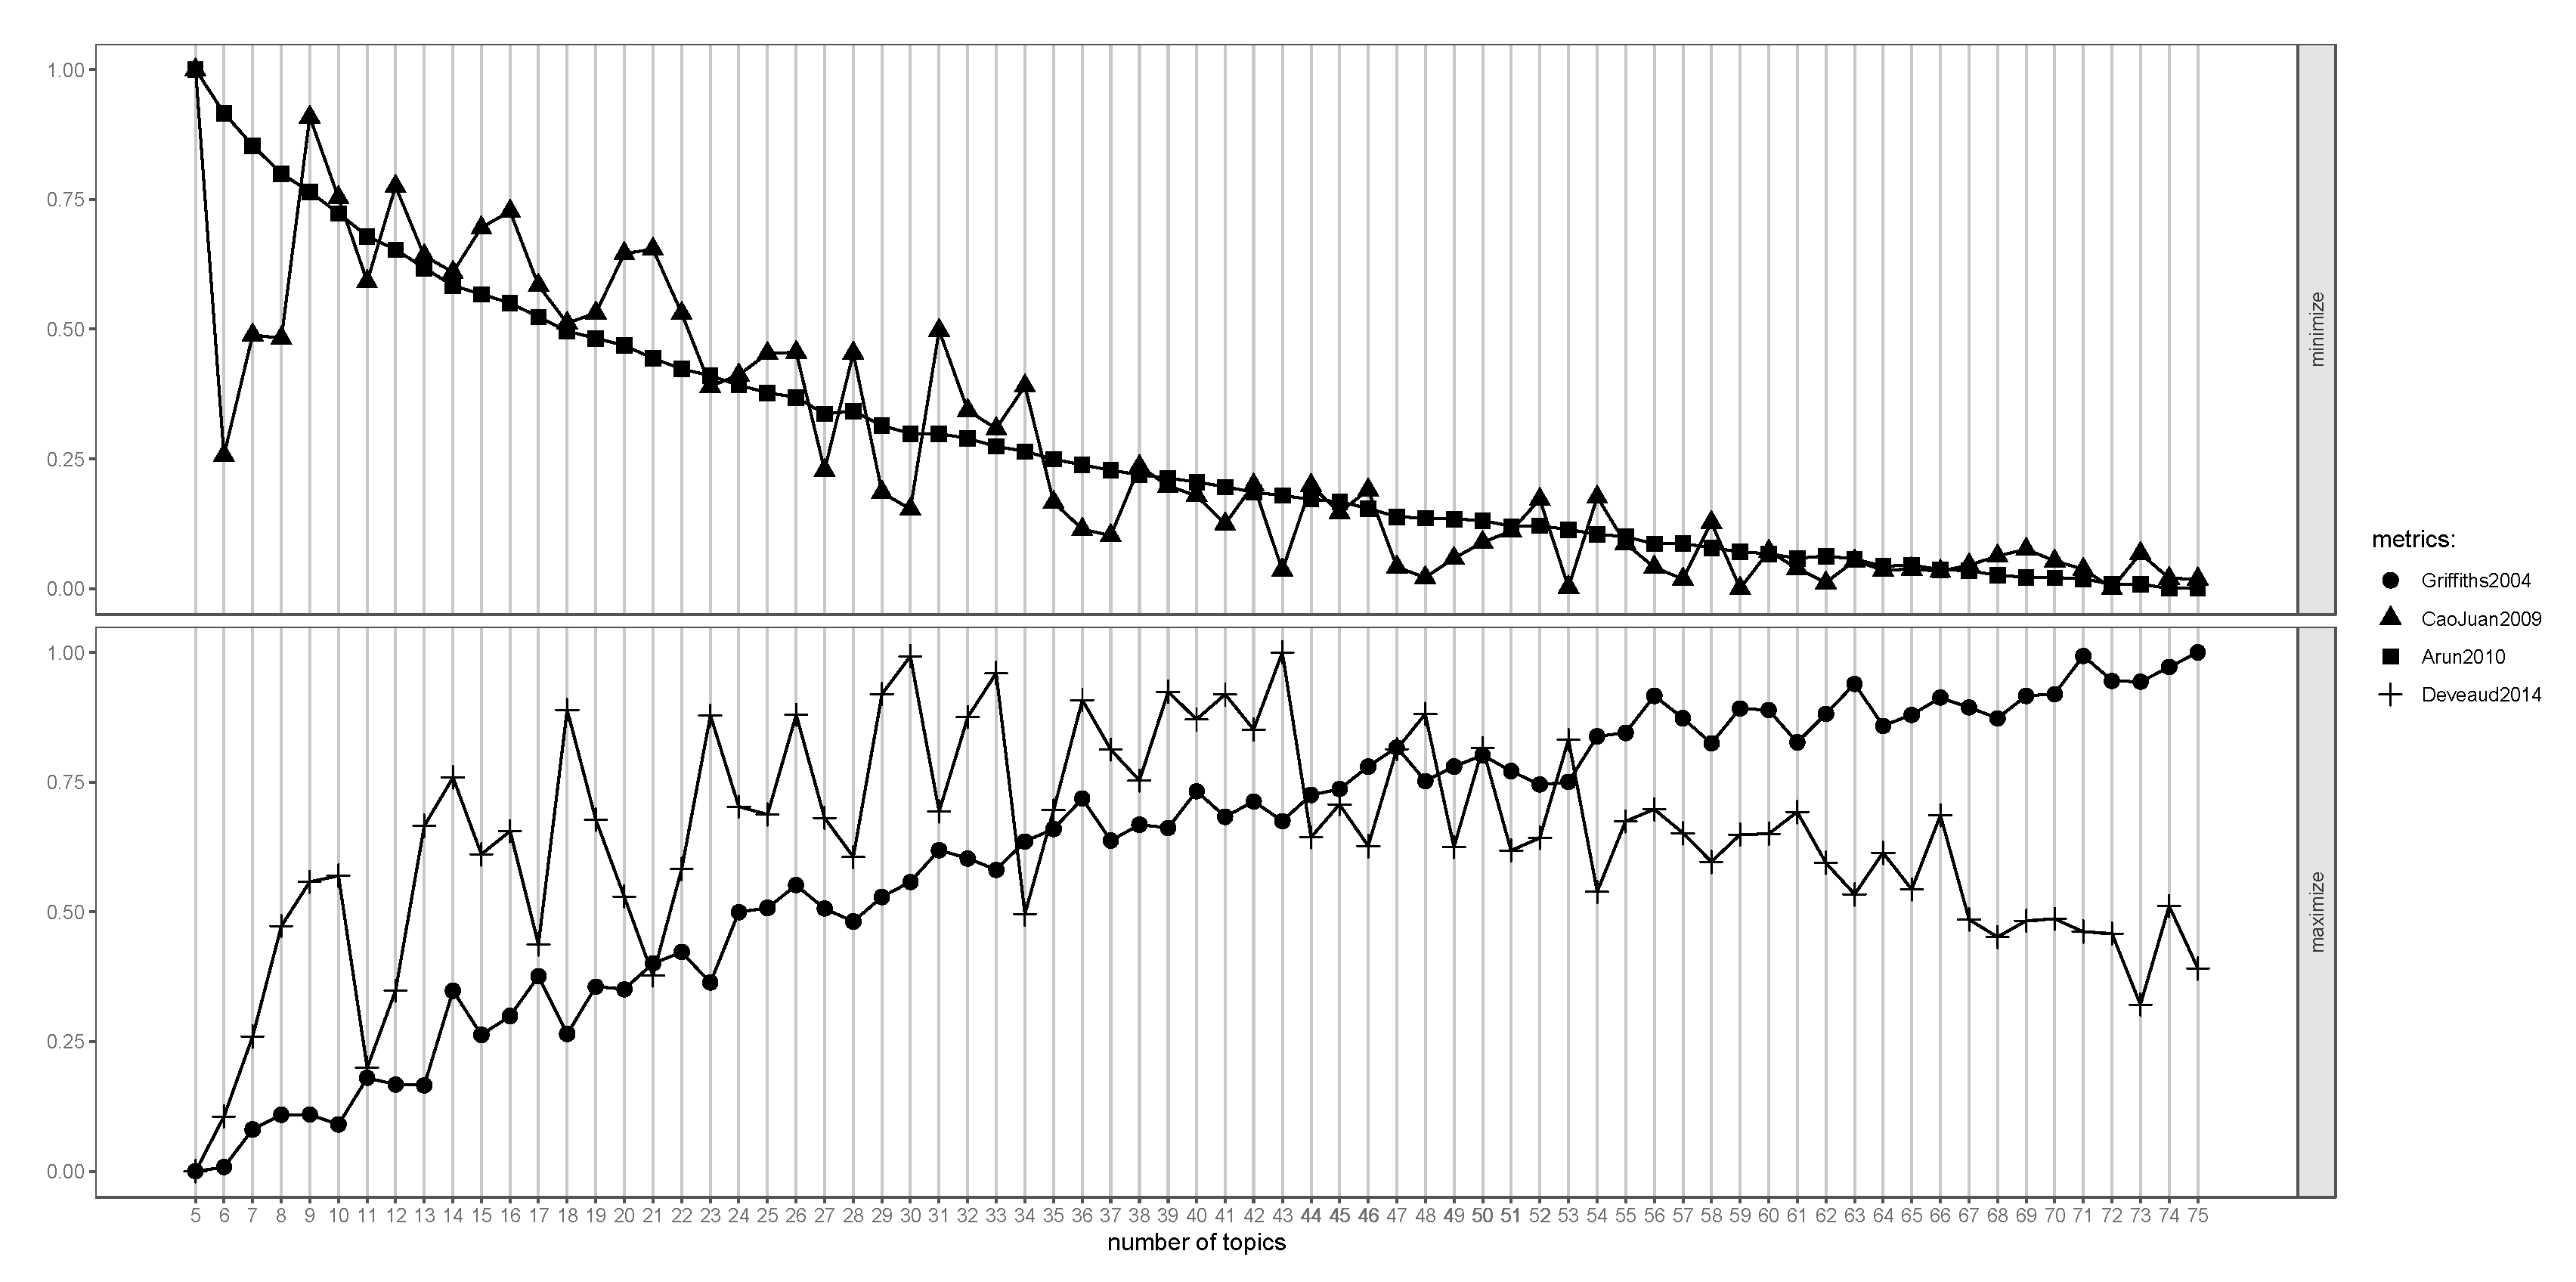
4.1. Topic Extraction

The number of latent topics is identified via the maximization of the information divergence of all topic pairs [46]. While several different heuristics have been proposed to identify the optimal number of topics being represented by the data, the fundamental approach is to iterate on different values of K to identify the K ^ that maximizes differences between the topics [46,47,48]. Based on the human-interpretations of topics, we found the best results from the method proposed by Deveaud et al. [46], which maximizes the sum of divergences between each topic pair, defined in Equation (1) as follows:
K ^ = argmax K 1 K ( K 1 ) ( k , k ) T K D ( k k )
where K is the number of topics used in the LDA model, k is a particular topic of the model, and TK is the set of K topics modeled. The use of the symmetric Jensen-Shannon divergence measure in Equation (2), as opposed to the more commonly used asymmetric Kullback-Leibler divergence measure, makes the following information divergence measure suitable for finding the number of LDA topics [46]. The divergence measure is therefore defined in Equation (2):
D ( k k ) = 1 2 w W k W k P T M ( w | k ) log P T M ( w | k ) P T M ( w | k ) + 1 2 w W k W k P T M ( w | k ) log P T M ( w | k ) P T M ( w | k )
where D is the divergence between topics and Wk represents the set of all w words considered in topic k.
Figure 2 illustrates the relative fit for each value of K topics measured over several comparative measures [46,47,48,49]. The optimal fit for the upper portion of the plot is the minimum value [47,48], while the optimal fit for the bottom portion of the plot is the maximum value of K [46,49]. While K ^ varies between methods, we use the optimal fit of K ^ = 43 provided by Deveaud, et al.’s method [46], due to its sensitivity to change in K and the suitability of the model.

4.2. Topic Identification

The conditional probability of words given a specific topic in the topic model, i.e., PTM(w|k), are referred to as phi-values since phi, Φ, refers to the distribution of words over topics. Typically, the top n words in each topic ranked by phi-values are used in order for the human-interpretation of the words to understand what the underlying concept that the words of highest phi-values in a particular topic are depicting. Whereas other research often observes the top n = 10 keywords [46,50], we analyzed the top n = 50 keywords, due to the size and complexity of the data, along with the subtleties in differences between topics’ keywords. For the sake of readability and space limitations, we report only the most relevant 15 keywords that are most representative of each topic. Topics are arranged into groupings of similar topics in no particular order for ease of interpretation. It should be noted that the topic groupings are informed by marketing and hospitality literature, but do not represent strict or crisp classifications. Rather, the topic groupings are a rough approximation of topics with similar characteristics based on the authors’ analysis of the topics, but there exists much overlap between the topic groups of evaluation, location, unit, and management characteristics.

4.2.1. Evaluation

Eight out of the 43 topics regard guests’ expressions of overall judgements of the holistic peer-to-peer accommodation experience. Out of these topics, four out of eight reflect very shallow reviews that may mention a general concept, but give no specifics about it. For example, “the location is perfect” gives no context of why the location was of interest to the particular reviewer, but the review is clearly about the topic of the location of the unit. For such topics, the phrase word-of-mouth is indicated, since these topics generally recommend or warn others against the property based on the context of the specific review.
Overall word-of-mouth is the general evaluation and recommendation of the holistic accommodation experience but does not focus on any particular characteristic. Location word-of-mouth, unit word-of-mouth, and management word-of-mouth are general evaluations and recommendations of the property based on location, unit characteristics, and management, respectively. Revisit intention consists of customer expressions of their intention to return, or not to return, to the same unit. Perceived value is the expression of the price relative to the value expected by the guest. Affective experience is the general affective and emotional response of the guests. Complaints are expressions of dissatisfaction and issues. The most relevant 15 keywords of each overall evaluation-related topic are listed in Table 1.

4.2.2. Location

Twelve out of 43 topics regard the spatial relationship between the unit, its location, and the surrounding area. Out of the twelve topics about location, about half of the topics focus on location characteristics and the surrounding neighborhood. The other half focus on the distance to different tourism resources or access to specific areas-of-interest from the property. Topics 9 to 17 are generally decentralized in that there are few, if any, “hot zones” when mapped, indicating that the topic is de-coupled from specific spatial regions or neighborhoods. However, Topics 18 to 20 are centralized to specific areas of New York City. Refer to Section 4.3 for mapping visualizations of the centralized location topics. The most relevant 15 keywords for location-based topics are identified in Table 2.
The view from unit topic pertains to the view of outside scenery and surroundings from the unit. Safety and security refers to the safety and security of the neighborhood that the property is located in. The trendiness of neighborhood is related to descriptions of the neighborhood’s trendy characteristics, and it generally contains informal language. Directions to unit are directions for navigating to the unit’s location. Navigation information is navigation and directions to points of interest near to the unit. Accessibility to points-of-interest (POI) is the ease of access to and proximity from the unit of the guests’ points-of-interest.
Proximity to subway stations is the relative distance from the unit to metro transport options. Proximity to bars and restaurants is the relative distance to entertainment, nightlife, restaurants, and bars. Proximity to local eateries is the relative distance from the unit to restaurants, cafes, diners, and grocery stores. Proximity to parks is the relative distance to parks, gardens, and green spaces. Uptown/Downtown Manhattan area is the focus on establishments in lower Manhattan, except for the Financial District, with a particular focus on the Lower East and West Village. Midtown Manhattan area is the focus on the landmarks in Midtown Manhattan, particularly in Times Square and the Theater District area. The three topics representing centralized locations, i.e., Midtown Manhattan, Uptown/Downtown Manhattan, and proximity to parks, are mapped in Section 4.3 for validation.

4.2.3. Accommodation Unit

There are 15 topics pertaining to the tangible and intangible aspects of the accommodation unit or building which are summarized in Table 3. Topics discussing tangible aspects, referring to any physical attributes, of the unit include roughly half of the unit-related topics, including Topics 21 to 27. Feature description refers to the description of rooms, size, and other unit characteristics. Furnishings and equipment are the furniture, appliances, and equipment supplied in the unit. Unit security is the access to and security of the unit and belongings inside the unit. Sleeping capacity is the carrying capacity of the number of guests that can sleep in the unit. Cleanliness is the cleanliness and organization of the accommodation unit. Complimentary F&B refers to any complimentary food and beverages available to guests from the host. Residential pets are animals residing in the unit or building, which are typically the host’s pets.
Topics discussing intangible traits of the unit include Topics 28 to 35. House sharing encompasses the experience of sharing a house with other guests. Family friendliness is the family-orientation of the stay experience in the unit. Home away from home refers to the ability of a unit and host to make the guest feel at home. Comfort describes a comfortable interior ambiance. Sleep quality is the ability of the unit to offer a place for rejuvenating rest after city touring. Sleep disturbance pertains to disturbances to sleep due to noise and light pollution. Thermal management relates to temperature management, primarily with regard to air, water, and bedding. Interior design is the artistic stylings and décor of the unit.

4.2.4. Management

Topics related to management pertain to the handling of unit listings, reservations, and guest interactions and are reported in Table 4. Therefore, there is an emphasis on host service quality in several of the topics. Informativeness involves the host providing local tourist information and guidance to guests. Friendliness is the friendly impression of the host on the guest. Empathy is the host’s understanding and willingness to fulfill guest needs. Arrival and departure convenience is the flexibility of the host in accommodating checking-in and checking-out. Communication responsiveness is the responsiveness of the host to communication from the guest.
The final three topics relate to unit listing and reservation management. Communication channels refers to the channels of communication for sharing information and communicating information to the host or prospective guests. Host cancelation relates to cancelations and amendments to booking reservations by the host. Listing accuracy involves the accuracy of unit descriptions and images.

4.3. Topic Validation

In the first step, topics were named by each author independently by analyzing the top 50 keywords per given topic, i.e., the highest PTM(w|k) for all k, and then discussion for the initial topic names commenced until unanimous agreement for all 43 topics was reached. After preliminary topic analysis and the attribution of names to each topic, the validation of topics occurred iteratively, wherein the naming process was repeated from the beginning if a unanimous decision could not be reached by the authors.
After initial naming, the topic names were validated against the top 20 documents per given topic, i.e., the highest PTM(k|d). For example, the comment with the highest PTM(k|d) for the topic Midtown Manhattan began with “You can’t beat the location if you’re planning to spend time in the theater district or Time Square…” and continued to describe the unit and location from there. If the document supported the topic name’s concept, then the next document for topic k was evaluated until the top 20 documents were analyzed.
If the initial naming and conceptualization remained consistent across the top documents for each topic, then the proportions of the topic were mapped by location and analyzed for location-specific patterns. Figure 3 maps the three topics pertaining to centralized locations. Points on the map indicate the specific spatial locations of the unit, and the colors of the points are graduated based on the topic’s prominence. Higher values of theta, Θ, mean a higher probability of a document corresponding to that topic, PTM(k|d). Therefore, the color gradients are based on the theta values, wherein darker colors correspond to higher proportions of a topic in reviews at the unit’s location. Since each review has some probability for all topics, only the highest relative probabilities are of importance for validation, which is why low proportions of the topics appear across the map. Therefore, the low probabilities at properties further away are negligible and only those with higher relative probabilities should be considered. Furthermore, for some properties further away from the centralized hot zones represented in Figure 3, a high proportion in these properties are inconsequential, since, for example, some reviews are commenting on the distance or about their experience visiting these hot zones. Thereby, hot zones indicate where a large conglomeration of reviews discussing a particular topic is located, and any geo-spatial patterns detected are of relevance to the validation of those topics.
By mapping the proportions of Topic 20 (Midtown Manhattan) by review location in Figure 3a, a hotspot appears over the Theater District and Times Square region of the map, indicating a strong relationship between the topic and properties located near the corresponding landmarks. Mapping of proportions of Topic 19 (Uptown/Downtown Manhattan) in Figure 3b indicates the strongest relationship with the Lower East Side, followed by a slightly weaker relationship with the West Village and Upper East Side. The visualization of Topic 18 (proximity to parks) in Figure 3c reveals a strong correspondence to properties surrounding both Central and Prospect Parks.

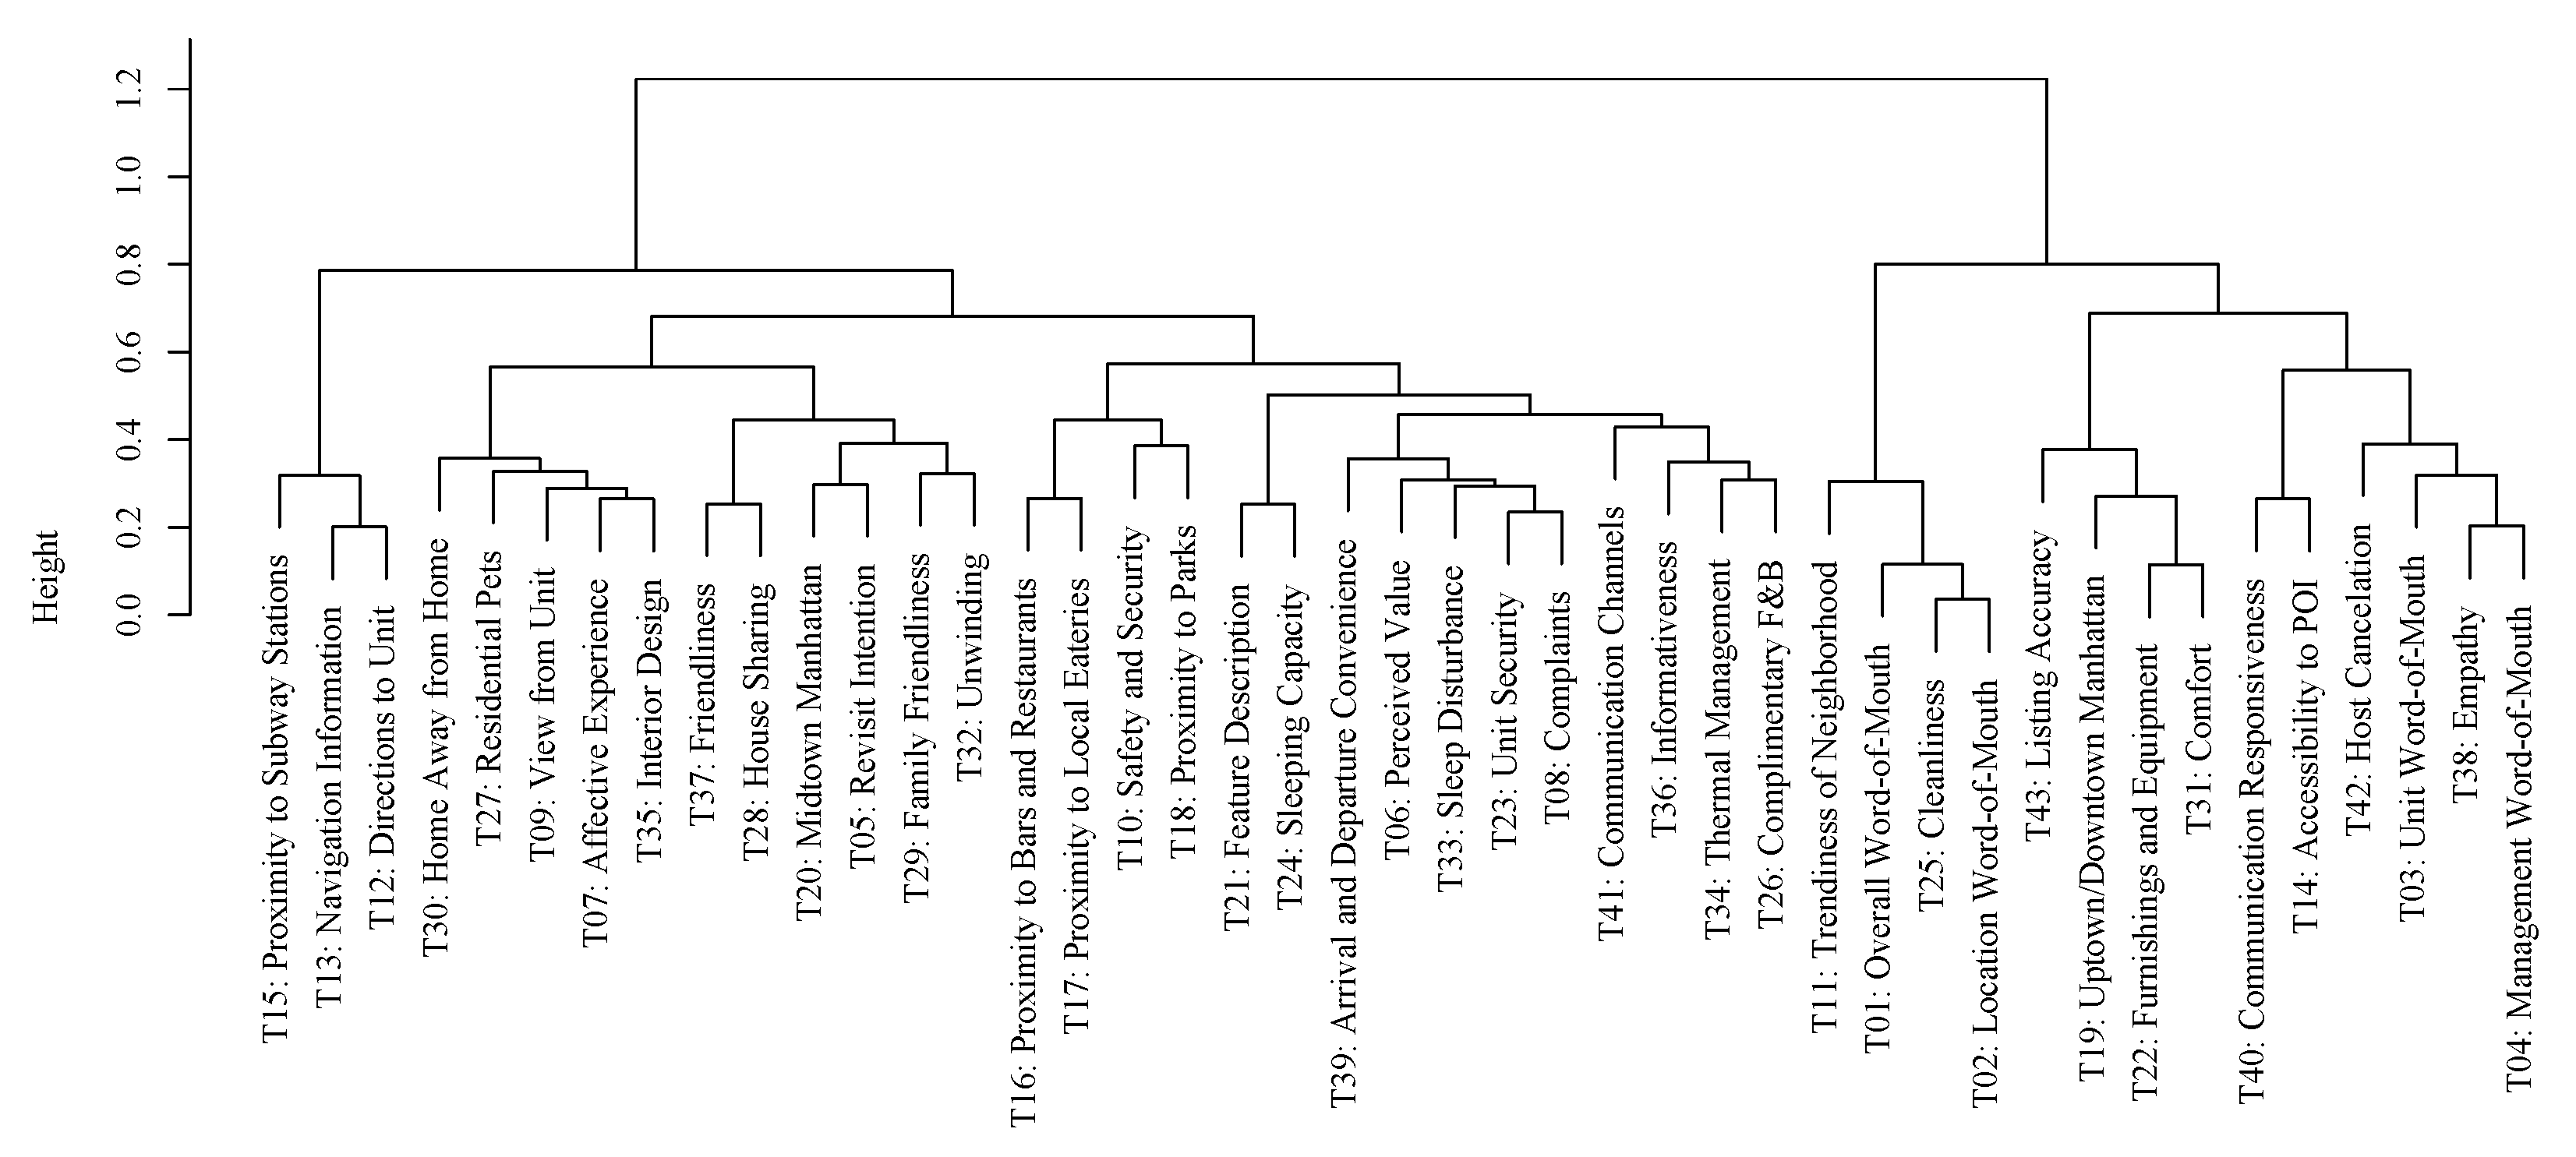
4.4. Statistical Distance Clustering of Topics

The dendrogram in Figure 4 depicts the results of hierarchical Ward Clustering, as described in more detail in Section 3.3. Using the phi-values for all words under each topic, minimum Hellinger distances [51] are calculated for all pairs of topics, and Ward hierarchical clustering [44] is used in order to show the relationships between topics. The dendrogram presents the relationships between topics, wherein the dissimilarity between topics is relative to the height of the merger between the topics or groups of topics. Dendrograms are a useful tool in exploratory analysis, wherein clusters of similar topics represent higher-level abstract concepts. In this section, the abstract concepts are loosely explored to gain a deeper understanding of how topics relate to one another.
The hierarchical clustering shows a more intuitive mapping of the relationships between similar and dissimilar topics. Based on the relationships mapped out in the dendrogram, it can be interpreted that the emotive experience is reflected by the nodes of Topics 30, 27, 9, 7, and 35, which is relatively similar to the social experience reflected in Topics 37 and 28. Revisit intention, Topic 5, appears to be closely related to the topic pertaining to the location of the popular tourist areas in Midtown, Topic 20. Similarly, the close relationship of Topics 5 and 20 to Topics 29 and 32 is not surprising in that family tourist trips tend to focus on landmark areas, with a need for unwinding after a long day of touring.
The location and proximity of the listed property to points of interest in the neighborhood are reflected in Topics 16, 17, 10, and 18. Both of the unit attributes in Topics 21, 24, 39, 6, 33, 23, and 8 are related in that they generally depict physical attributes of the unit and facility. Guests’ perception of the physical unit is also related to how the host manages that unit in terms of his or her hospitality, reflected in Topics 41, 36, 34, and 26. There exists a relationship between all of the prior mentioned nodes in the dendrogram and the navigation information of Topics 15, 13, and 12.
On the right-hand side of the dendrogram, the comfort and convenience of the listed unit in terms of Topics 22, 31, 19, and 43 are clustered together. Relative to this cluster, the general recommendations and listing efficiency for the host are similarly related. Finally, we see that the clusters on the right side of the dendrogram are adjacent to general aspects of the location, such as Topics 11, 2, and 3.

5. Discussion

5.1. Conclusions

The topics extracted via latent Dirichlet allocation give an insight into which topics Airbnb guests find worth discussing and represent the aspects of customer experience that drive customer satisfaction. It is observed that topics tend to fall into one of several broad categories regarding the overall evaluation of the stay, the location of the unit, the physical accommodation unit and building itself, or the hosts’ management of the listed accommodation. When compared to the customer experience dimensions of traditional accommodation [19,20,21,23,24], several notable similarities and differences appear. While similarities are more straightforward, they include value for money, the location in relation to transportation options and the neighborhood, the décor and cleanliness of the room, the friendliness of the employee/host of the unit, the facility’s characteristics, and the view from the accommodation.
The differences between the traditional accommodation experience dimensions and Airbnb experience dimensions highlight the differences between the customer experience between the two. The safety and security of both the location and the unit are an important concern for the decentralized nature of Airbnb listings, whereas the safety issues are not as major a concern for guests of traditional accommodation. Furthermore, more focus on different aspects of location exists, such as the difficulty of navigating to the unit (Topics 12 and 13), and access to different points or areas of interest (Topics 14, 16, 17, and 18), reflecting the decentralized aspect of Airbnb listings and the resulting importance of location-specific characteristics. Due to the more direct guest–host relationship compared to that between guests and employees, there is also a greater emphasis on the different ways that guests interact with hosts (Topics 36, 37, 38, 39, 40, 41, and 42). Another difference is the presence of listing accuracy (Topic 43) as a discussion topic for Airbnb guests, wherein regulations against false advertising and greater standardization within traditional accommodation make this a far less prevalent issue.
This study differs from similar studies using latent Dirichlet allocation on Airbnb reviews [39,40] in that it focuses on a single research context, New York City, and also has more than double the number of topics. The focus on New York City alone allows for context-specific topics that are location-based specifically for NYC (Topics 19, 20). This entails that any location-specific study or application of the results should consider location-specific factors in its implementation. The use of a large number of topics allows for much more precision and finer detail in the topics of interest. For example, while other studies may include a topic such as “general recommendation” [39,40], our study includes a more detailed breakdown of general recommendation into not only “overall word-of-mouth” (topic 1) but also general word-of-mouth recommendations with regard to the location, unit, and management practices of the host (Topics 2, 3, and 4). A similar phenomenon exists for the topics “transportation/location” [40] and “public transport” [39], in that by utilizing more topics, our study distinguishes between the proximity to transportation (Topic 15) and using the transportation to access other locations of interest (Topic 14) or directions for how to navigate to specific places using transportation (Topics 12, 13). The deeper insight gained by numerous yet still distinctly different topics allows for a better understanding of the customer experience and customer satisfaction dimensions.
While the 43 extracted topics show distinctly different topics, a set of complex relationships between all sets of topics exists. Through analyzing these relationships between topics via Ward hierarchical clustering, several clusters are shown to represent more abstract concepts, such as the emotive experience (Topics 7, 9, 27, and 30), social experience (Topics 28 and 37), navigation information (Topics 12, 13, and 15), location of the neighborhood (Topics 10, 16, 17, and 18), unit attributes (Topics 6, 8, 21, 23, 24, 33, and 39), hospitality of the host (Topics 26, 34, 36, and 41), convenience and comfort (Topics 19, 22, 31, and 43), and host’s communication and listing management (Topics 3, 4, 38, 40, and 42). These relationships help both industry players and researchers to more precisely conceptualize and measure the dimensions of customer experience.

5.2. Implications

The topics reported in this research should be used to inform both researchers and industry practitioners of the issues most important to guests in the shared accommodation market. Due to the importance of the sharing economy, particularly in the accommodation market, the topics of interest represent which aspects most contribute to customer satisfaction. However, due to the individualized nature of peer-to-peer accommodation, some topics may be more or less relevant to different guests. This is the basic principle behind micro-segmentation, and the topics extracted offer insight into which topics might be utilized for promotional purposes, depending on the topics that may be of most relevance to a specific place of accommodation.
There are several theoretical implications from this research. There is a clear distinction between peer-to-peer accommodation guest experiences and traditional accommodation experiences. This study corroborates other research showing that Airbnb guests seek to interact with the local community through information from hosts and by going to local restaurants and shopping [40]. However, this study goes one step further and identifies other points-of-interest (Topic 14), including the ease of access to jazz and comedy clubs (Topic 16), grocery stores (Topic 17), and parks or gardens (Topic 18). This extended understanding of which points of interest in the local neighborhood may be of interest to guests helps to identify which points researchers and managers may want to focus on in customer satisfaction research and for providing information to consumers.
Another implication of this study for other researchers using latent Dirichlet allocation regards the utilization of statistical distance for the hierarchical clustering of topics. The relationships between topics are often not assessed directly in hospitality and tourism literature [23,40], or are analyzed via simple correlation matrices [39]. However, omitting the relationships between topics fails to acknowledge the overlap of concepts between topics. As pointed out by Blei and Lafferty [52], LDA is unable to properly estimate correlations between topics because of the nature of the Dirichlet distribution, and therefore, correlation matrices are not the right approach to assess these relationships. However, this study presents an empirical approach to analyzing the relationships between topics through Ward clustering. The hierarchical clusters indicated by the analysis allow researchers to develop higher level concepts of the semantic environment in order to better understand the topography the full customer experience.
This points to some of the managerial implications of this research. Airbnb hosts can utilize the insight gained from this research in order to better target their listings to customers that might be most satisfied and therefore boost the host’s online reputation. Sharing accommodation should use the methods and insight from this research in order to develop more sustainable strategies that use stronger recommender systems to optimize customer experience and, ultimately, customer satisfaction. Competing players in the traditional accommodation space can use the information to strategize how to best serve their customers by providing more efficient information that leverages the topics of interest for accommodation guests.

5.3. Limitations and Future Research

While the benefits of limiting the research context to only New York City allows a much deeper understanding of the mechanics driving guests within that research context, it also limits the generalizability of the results. Furthermore, the same problem exists for using only one website, Airbnb. While Airbnb represents the largest player in the peer-to-peer accommodation market, the idiosyncrasies of the platform itself may skew the dimensions that its customers find most relevant and should be considered as a factor in the interpretation of these results. The authors hope that further research will delve more deeply into the dimensions that drive customer experience in the shared accommodation space, and that the relationship between those dimensions can be better understood through analyzing other research contexts in different cities and countries to help validate and generalize the results of this research.

Author Contributions

Conceptualization, I.S. and K.K.; Methods, I.S.; Visualization, I.S.; Analysis, I.S. and K.K.; Writing, I.S.; Editing, I.S. and K.K.; All authors have read and agreed to the published version of the manuscript.

Funding

This research received no external funding

Conflicts of Interest

The authors declare no conflict of interest.

References

  1. Douglas, L.; Connor, R. Attitudes to service quality-the expectation gap. Nutr. Food Sci. 2003, 33, 165–172. [Google Scholar] [CrossRef]
  2. Jaffe, S.; Coles, P.; Levitt, S.; Popov, I. Quality Externalities on Platforms: The Case of Airbnb. 2017. Available online: https://soniajaffe.com/articles/Jaffe_JMP_Quality_Externalities.pdf (accessed on 1 April 2020).
  3. Rauch, D.A.; Collins, M.D.; Nale, R.D.; Barr, P.B. Measuring service quality in mid-scale hotels. Int. J. Contemp. Hosp. Manag. 2015, 29, 111–125. [Google Scholar] [CrossRef]
  4. Mody, M.A.; Suess, C.; Lehto, X. The accommodation experiencescape: A comparative assessment of hotels and Airbnb. Int. J. Contemp. Hosp. Manag. 2017, 9, 2377–2404. [Google Scholar] [CrossRef]
  5. Moon, H.; Miao, L.; Hanks, L.; Line, N.D. Peer-to-peer interactions: Perspectives of airbnb guests and hosts. Int. J. Hosp. Manag. 2019, 77, 405–414. [Google Scholar] [CrossRef]
  6. Lutz, C.; Newlands, G. Consumer segmentation within the sharing economy: The case of airbnb. J. Bus. Res. 2018, 88, 187–196. [Google Scholar] [CrossRef]
  7. Shayaa, S.; Jaafar, N.I.; Bahri, S.; Sulaiman, A.; Wai, P.S.; Chung, Y.W.; Piprani, A.Z.; Al-Garadi, M.A. Sentiment analysis of big data: Methods, applications, and open challenges. IEEE Access 2018, 6, 37807–37827. [Google Scholar] [CrossRef]
  8. Alaei, A.R.; Becken, S.; Stantic, B. Sentiment analysis in tourism: Capitalizing on big data. J. Travel Res. 2019, 58, 175–191. [Google Scholar] [CrossRef]
  9. Blei, D.M.; Ng, A.Y.; Jordan, M.I. Latent dirichlet allocation. J. Mach. Learn. Res. 2003, 3, 993–1022. [Google Scholar]
  10. Blei, D.M.; Ng, A.Y.; Jordan, M.I. Latent dirichlet allocation. In Advances in Neural Information Processing Systems; University of California: Berkeley, CA, USA, 2002; pp. 601–608. [Google Scholar]
  11. Parasuraman, A.; Zeithaml, V.A.; Berry, L.L. Servqual: A multiple-item scale for measuring consumer perc. J. Retail. 1988, 64, 12. [Google Scholar]
  12. Getty, J.M.; Thompson, K.N. A procedure for scaling perceptions of lodging quality. Hosp. Res. J. 1994, 18, 75–96. [Google Scholar] [CrossRef]
  13. Mei, A.W.O.; Dean, A.M.; White, C.J. Analysing service quality in the hospitality industry. Manag. Serv. Qual. Int. J. 1999, 9, 136–143. [Google Scholar] [CrossRef]
  14. Cronin Jr, J.J.; Taylor, S.A. Measuring service quality: A reexamination and extension. J. Mark. 1992, 56, 55–68. [Google Scholar] [CrossRef]
  15. Maklan, S.; Klaus, P. Customer experience: Are we measuring the right things? Int. J. Mark. Res. 2011, 53, 771–772. [Google Scholar] [CrossRef]
  16. Klaus, P.P.; Maklan, S. Towards a better measure of customer experience. Int. J. Mark. Res. 2013, 55, 227–246. [Google Scholar] [CrossRef] [Green Version]
  17. Panda, R.; Verma, S.; Mehta, B. Emergence and acceptance of sharing economy in India: Understanding through the case of Airbnb. Int. J. Online Mark. IJOM 2015, 5, 1–17. [Google Scholar] [CrossRef]
  18. Anderson, C.K.; Han, S. Hotel performance impact of socially engaging with consumers. Center Hosp. Res. 2016, 16, 3–9. [Google Scholar]
  19. Li, H.; Ye, Q.; Law, R. Determinants of customer satisfaction in the hotel industry: An application of online review analysis. Asia Pac. J. Tour. Res. 2013, 18, 784–802. [Google Scholar] [CrossRef]
  20. Alrawadieh, Z.; Law, R. Determinants of hotel guests’ satisfaction from the perspective of online hotel reviewers. Int. J. Cult. Tour. Hosp. Res. 2019, 13, 84–97. [Google Scholar] [CrossRef]
  21. Zhou, L.; Ye, S.; Pearce, P.L.; Wu, M.-Y. Refreshing hotel satisfaction studies by reconfiguring customer review data. Int. J. Hosp. Manag. 2014, 38, 1–10. [Google Scholar] [CrossRef]
  22. Kim, B.; Kim, S.; Heo, C.Y. Analysis of satisfiers and dissatisfiers in online hotel reviews on social media. Int. J. Contemp. Hosp. Manag. 2016, 28, 1915–1936. [Google Scholar] [CrossRef] [Green Version]
  23. Guo, Y.; Barnes, S.J.; Jia, Q. Mining meaning from online ratings and reviews: Tourist satisfaction analysis using latent dirichlet allocation. Tour. Manag. 2017, 59, 467–483. [Google Scholar] [CrossRef] [Green Version]
  24. Sutherland, I.; Sim, Y.; Lee, S.K.; Byun, J.; Kiatkawsin, K. Topic modeling of online accommodation reviews via latent dirichlet allocation. Sustainability 2020, 12, 1821. [Google Scholar] [CrossRef] [Green Version]
  25. Lessig, L. Remix: Making Art and Commerce Thrive in the Hybrid Economy; Penguin: London, UK, 2008. [Google Scholar]
  26. Andreu, L.; Bigne, E.; Amaro, S.; Palomo, J. Airbnb research: An analysis in tourism and hospitality journals. Int. J. Cult. Tour. Hosp. Res. 2020, 14, 2–20. [Google Scholar] [CrossRef]
  27. Petropoulos, G. An Economic Review of the Collaborative Economy; Bruegel Policy Contribution: Brussels, Belgium, 2017. [Google Scholar]
  28. Maselli, I.; Lenaerts, K.; Beblavỳ, M. Five things we need to know about the collaborative economy. Ceps Essay 2016, 21, 1–10. [Google Scholar]
  29. Eckhardt, G.M.; Bardhi, F. The sharing economy isn’t about sharing at all. Harv. Bus. Rev. 2015, 28, 2015. [Google Scholar]
  30. Kosoff, M. Vanity Fair; Harper & Brothers: New York, NY, USA, 2017. [Google Scholar]
  31. Zervas, G.; Proserpio, D.; Byers, J.W. The rise of the sharing economy: Estimating the impact of airbnb on the hotel industry. J. Mark. Res. 2017, 54, 687–705. [Google Scholar] [CrossRef] [Green Version]
  32. Dogru, T.; Mody, M.; Suess, C. Adding evidence to the debate: Quantifying airbnb’s disruptive impact on ten key hotel markets. Tour. Manag. 2019, 72, 27–38. [Google Scholar] [CrossRef]
  33. Lane, J.; Woodworth, R.M. The sharing economy checks in: An analysis of airbnb in the United States. Cbre Hotel. Am. Res. 2016. [Google Scholar] [CrossRef] [Green Version]
  34. Dolnicar, S. Unique features of peer-to-peer accommodation networks. In Peer—Peer Accommod. Netw. Push. Boundaries; Goodfellow Publishers: Oxford, UK, 2018; pp. 1–14. [Google Scholar]
  35. Priporas, C.-V.; Stylos, N.; Vedanthachari, L.N.; Santiwatana, P. Service quality, satisfaction, and customer loyalty in Airbnb accommodation in Thailand. Int. J. Tour. Res. 2017, 19, 693–704. [Google Scholar] [CrossRef]
  36. Ju, Y.; Back, K.-J.; Choi, Y.; Lee, J.-S. Exploring Airbnb service quality attributes and their asymmetric effects on customer satisfaction. Int. J. Hosp. Manag. 2019, 77, 342–352. [Google Scholar] [CrossRef]
  37. Brochado, A.; Troilo, M.; Aditya, S. Airbnb customer experience: Evidence of convergence across three countries. Ann. Tour. Res. 2017, 63, 210–212. [Google Scholar] [CrossRef]
  38. Huang, Y. LDA-Based Personalized Recommendation for Airbnb. Master’s Thesis, Information Management, Kaohsiung, Taiwan, 2017. [Google Scholar]
  39. Zhang, J. Listening to the consumer: Exploring review topics on Airbnb and their impact on listing performance. J. Mark. Theory Pr. 2019, 27, 371–389. [Google Scholar] [CrossRef]
  40. Zhang, J. What’s yours is mine: Exploring customer voice on Airbnb using text-mining approaches. J. Consum. Mark. 2019, 36, 655–665. [Google Scholar] [CrossRef]
  41. Travel & Tourism Trend Report; NYC & Company: New York, NY, USA, 2019.
  42. Kahle, D.; Wickham, H. Ggmap: Spatial visualization with ggplot2. R J. 2013, 5, 144–161. [Google Scholar] [CrossRef] [Green Version]
  43. Murtagh, F.; Legendre, P. Ward’s hierarchical agglomerative clustering method: Which algorithms implement Ward’s criterion? J. Classif. 2014, 31, 274–295. [Google Scholar] [CrossRef] [Green Version]
  44. Murtagh, F. Multidimensional Clustering Algorithms; Compstat Lectures; Physika Verlag: Heidelberg, Germany, 1985. [Google Scholar]
  45. Wishart, D. 256. Note: An algorithm for hierarchical classifications. Biometrics 1969, 25, 165–170. [Google Scholar] [CrossRef]
  46. Deveaud, R.; SanJuan, E.; Bellot, P. Accurate and effective latent concept modeling for ad hoc information retrieval. Doc. Numér. 2014, 17, 61–84. [Google Scholar] [CrossRef] [Green Version]
  47. Cao, J.; Xia, T.; Li, J.; Zhang, Y.; Tang, S. A density-based method for adaptive LDA model selection. Neurocomputing 2009, 72, 1775–1781. [Google Scholar] [CrossRef]
  48. Arun, R.; Suresh, V.; Madhavan, C.V.; Murthy, M.N. On finding the natural number of topics with latent dirichlet allocation: Some observations. In Proceedings of the Pacific-Asia Conference on Knowledge Discovery and Data Mining, Melbourne, Australia, 15–17 April 1998; Springer: Berlin/Heidelberg, Germany, 2010; pp. 391–402. [Google Scholar]
  49. Griffiths, T.L.; Steyvers, M. Finding scientific topics. Proc. Natl. Acad. Sci. USA 2004, 101, 5228–5235. [Google Scholar] [CrossRef] [Green Version]
  50. Newman, D.; Lau, J.H.; Grieser, K.; Baldwin, T. Automatic evaluation of topic coherence. In Proceedings of the Human language technologies: The 2010 Annual Conference of the North American Chapter of the Association for Computational Linguistics; Association for Linguistics, Los Angeles, CA, USA, 2–4 June 2010; pp. 100–108. [Google Scholar]
  51. Beran, R. Minimum Hellinger distance estimates for parametric models. Ann. Stat. 1977, 5, 445–463. [Google Scholar] [CrossRef]
  52. Blei, D.; Lafferty, J. Correlated topic models. Adv. Neural Inf. Process. Syst. 2006, 18, 147. [Google Scholar]
Figure 1. Map of New York City (NYC) with the surrounding area and sampled Airbnb listing locations. (a) satellite image of NYC with labels; (b) sample locations.
Sustainability 12 03402 g001
Figure 2. Grid-search for the optimal number of topics ( K ^ ).
Sustainability 12 03402 g002
Figure 3. Spatial distribution of centralized location topics. (a) Midtown Manhattan; (b) Uptown/Downtown Manhattan; (c) Proximity to parks.
Sustainability 12 03402 g003
Figure 4. Dendrogram of topics using Ward hierarchical clustering.
Sustainability 12 03402 g004
Table 1. Latent topics regarding Evaluation.
TopicRelevant Keywords
1. Overall Word-of-Mouthplace, recommendation, visit, enjoy, comfortable, kind, comeback, cooperate, available, specious, conform, thankful, sight, vacation, select
2. Location Word-of-Mouthplace, recommendation, location, convenient, enjoy, close, anytime, perfect, pleasant, vivid, travel, impress, beautiful, hype, outstanding
3. Unit Word-of-Mouthhigh, recommendation, place, fantastic, wonderful, clean, accommodate, spacious, stylish, hospitable, brilliant, amenity, pleasant, impeccable, comfortable
4. Management Word-of-Mouthhost, excellent, communicate, accommodate, responsive, fantastic, attentive, amenity, helpful, communicator, outstanding, maintain, gracious, advertise, recommendation
5. Revisit Intentionback, book, visit, time, return, hope, future, forward, hesitate, plan, regret, choice, wait, repeat, decision
6. Perceived Valueprice, expect, money, worth, deal, afford, cheap, basic, fair, budget, expensive, cost, compare, rate, pay
7. Affective Experiencebeautiful, love, thoughtful, touch, gracious, hospitality, immaculate, gorgeous, exceptional, heartbeat, gem, generous, delightful, tasteful, charm
Table 2. Latent topics regarding Location.
TopicRelevant Keywords
9. View from Unitview, beautiful, building, city, rooftop, roof, balcony, patio, terrace, watch, deck, outdoor, skyline, spectacular, stunning
10. Safety and Securityneighborhood, safe, quiet, felt, night, secure, residential, unsafe, diverse, sketchy, rough, worry, police, women, gentrify
11. Trendiness of Neighborhoodplace, awesome, cool, spot, eat, drink, neighborhood, chill, vibe, hip, blast, crazy, hangout, pad, buddy
12. Directions to Unittrain, minute, station, stop, bus, subway, walk, metro, line, close, avenue, airport, block, straight, route
13. Navigation Informationwalk, minute, subway, distance, short, restaurant, ride, bridge, supermarket, attraction, stadium, landmark, farther, direction, approximate
14. Accessibility to Points-of-Interesteasy, access, location, subway, easily, accessible, reach, find, neighborhood, commute, navigate, simple, fast, accessibility, breezy
15. Proximity to Subway Stationsclose, subway, location, station, convenient, line, metro, proximity, station, stop, direct, hub, train, distant, underground
16. Proximity to Bars and Restaurantsrestaurant, close, bar, cafe, nearby, coffee, club, nightlife, pub, venue, jazz, comedy, proximity, popular, vicinity
17. Proximity to Local Eateriesrestaurant, food, grocery, nearby, deli, convenience, supermarket, pizza, bar, cafe, local, bodega, bagel, eatery, organic, brunch
18. Proximity to Parkspark, central, quiet, prospect, walk, garden, close, neighborhood, fort, green, tree, botanical, stroll, running, riverside
19. Uptown/Downtown Manhattanlocation, east, studio, side, village, heart, town, lower, upper, situate, explore, china, nightlife, touristy, uptown
20. Midtown Manhattantime, square, location, city, visit, district, theater, tourist, port, attraction, vacation, authority, hell, site, empire
Table 3. Latent topics regarding Accommodation Unit.
TopicRelevant Keywords
21. Feature Descriptionbathroom, bedroom, kitchen, private, space, shower, closet, hanger, bath, entrance, common, desk, chair, storage, drawer
22. Furnishings and Equipmentapartment, equipped, furnish, modern, renovate, functional, maintain, facility, practical, appliance, brand, equipment, fitted, refurbish, utility
23. Unit Securitydoor, building, issue, stairs, key, problem, open, lock, elevator, luggage, inside, secure, code, box, security
24. Sleeping Capacityspace, bed, people, large, small, size, group, couch, sleep, sofa, mattress, futon, cramp, ample, roomy
25. Cleanlinessplace, clean, cozy, tidy, neat, convenient, organize, quiet, sparkle, orderly, maintain, disposal, freak, peaceful, attentive
26. Complimentary F&Bcoffee, breakfast, stock, fresh, food, snack, provide, tea, wine, water, bottle, include, prepare, available, thoughtful
27. Residential Petslove, friendly, cute, sweet, cat, dog, host, adore, pet, fun, happy, kitty, partner, sweetheart, behave
28. House Sharinghouse, kind, big, people, experience, person, problem, friendly, host, owner, connection, guest, rule, polite, live
29. Family Friendlinessfamily, husband, kid, daughter, son, wife, weekend, parent, young, children, play, mom, sister, baby, teenage
30. Home Away from Homehome, feel, warm, experience, hospitality, cozy, comfort, homey, ease, relax, safe, atmosphere, peaceful, environment, energy
31. Comfortapartment, comfortable, spacious, convenient, bright, stylish, modern, pleasant, roomy, sunny, airy, cheerful, cheery, accommodate, ideal
32. Unwindingcity, day, explore, trip, busy, relax, sightseeing, getaway, adventure, crash, unwind, tired, crazy, break, hectic
33. Sleep Disturbancenight, sleep, noise, light, loud, hear, neighbor, sound, traffic, earplug, music, dark, construction, wake, disturb
34. Thermal Managementair, shower, hot, water, air_conditioning, cold, summer, fan, sheets, warm, heater, blanket, weather, temperature, winter
35. Interior Designbeautiful, loft, charm, art, decorate, decor, style, brownstone, unique, vibe, modern, taste, interior, furniture, atmosphere
Table 4. Latent topics regarding Management.
TopicRelevant Keywords
36. Informativenessprovide, local, tip, information, helpful, instruction, suggestion, directions, advice, map, guide, tour, explain, personal, assistance
37. Friendlinessfriendly, kind, talk, care, conversation, interesting, respectful, share, personal, chat, pleasant, considerate, genuine, generous, polite, interact
38. Empathyhost, gracious, attentive, courteous, professional, considerate, polite, personable, intrusive, cordial, punctual, patient, overbear, obtrusive, understand
39. Arrival and Departure Conveniencelate, arrive, night, flight, leave, key, wait, luggage, airport, early, delay, arrange, understand, greet, checkout
40. Communication Responsivenesseasy, communicate, flexible, smooth, process, simple, responsive, seamless, schedule, fast, efficient, clear, straightforward, coordinate, hassle
41. Communication Channelsquestion, answer, message, text, hidden, email, website, phone, host, call, inquiry, communicate, mail, contact, address
42. Host Cancelationhost, day, arrival, reservation, post, cancel, automate, departure, prior, accept, ensure, understand, insure, forget, book
43. Listing Accuracyexact, apartment, picture, describe, list, photo, description, accurate, advertise, surprise, actual, online, depict, match, image

