Article

Environmental Impacts of a Pet Dog: An LCA Case Study

by
Kim Maya Yavor
,
Annekatrin Lehmann
and
Matthias Finkbeiner
*
Institute of Environmental Technology, Technische Universität Berlin, 10623 Berlin, Germany
*
Author to whom correspondence should be addressed.
first authors, equal contribution.
Sustainability 2020, 12(8), 3394; https://doi.org/10.3390/su12083394
Submission received: 24 March 2020 / Revised: 15 April 2020 / Accepted: 16 April 2020 / Published: 22 April 2020
(This article belongs to the Section Environmental Sustainability and Applications)

Abstract

:
The number of pet animals in the European Union is increasing over the last decades. Few studies with a limited focus in terms of impacts and life cycle stages exist that assess the environmental impacts of dogs. This paper addresses the entire life cycle of a dog. An LCA study on an average dog was conducted considering the pet food and dog excrements, i.e., urine and feces. Fifteen impact categories were analyzed. An average dog has a climate change and freshwater eutrophication potential of around 8200 kg CO2eq and 5.0 kg Peq., respectively. The main contribution to most impact categories over the dog’s life is caused by pet food. Freshwater eutrophication is mainly determined by the dog´s urine and feces. Feces also have a significant contribution to the category of freshwater ecotoxicity. Impacts increase significantly with increasing weight and a longer lifetime of the dog as well as low collection rates of the feces. This LCA study reveals that pet dogs can have a significant environmental impact, e.g., around 7% of the annual climate change impact of an average EU citizen. Optimizing pet food and increasing the feces´ collection rate can reduce the impacts.

1. Introduction

The number of pet animals in the European Union (EU) is increasing. Pet dogs (in the following, referred to as dogs) are growing in popularity with 66.4 million dogs in the EU in 2017 compared to 63.7 million in 2016 [1]. In Germany, for example, the number of dogs increased from 5.5 million in 2005 to 9.2 million in 2017 [2]. Naturally, a higher number of dogs also leads to a rising amount of consumed pet food, and a higher total volume of urine and feces. Particularly, the latter may lead to direct environmental impacts. For example, the urban and rural flora is affected by urine, making trees become more prone to diseases, etc. [3]. Often, this is visible in big cities, where the density of population and pet animals is high and (green) space is limited.
A few LCA studies assessing potential environmental impacts related to pets and dogs are already available. However, they focus only on specific environmental impacts or on specific life cycle stages or processes, such as pet food [4,5,6,7,8,9]. Moreover, within the Product Environmental Footprint (PEF) initiative [10,11] a PEF pilot study was conducted aiming at analyzing potential environmental impacts of pet food for dogs (and cats) and developing product environmental footprint category rules (PEFCR). The PEFCR provide guidance on how to conduct a PEF study (basically an LCA based study) for pet food [12]. They considered the production and transportation of pet food, as well as the end-of-life (EoL) of the packaging and food waste. Not addressed, i.e., out of the scope of this PEF study, is the EoL of the pet food after its consumption. The full life cycle of pet food is, hence, not considered. To the knowledge of the authors, there is no LCA study available, which comprehensively addresses potential environmental impacts related to dogs from a total life cycle perspective.
The goal of this paper is, therefore, to conduct an LCA case study of a dog, to comprehensively analyze potential environmental impacts, identifying hotspots and improvement potential. This study is of interest to the LCA community, because it connects to and complements existing studies, focusing on parts of the dog´s life cycle, particularly the PEF study for pet food.

2. Materials and Methods

This chapter describes how the LCA study was conducted, following the four phases of LCA according to ISO 14040 and ISO 14044. The goal and scope phase are described in Section 2.1, followed by a description of the inventory phase in Section 2.2. The phases of life cycle impact assessment (LCIA) and interpretation are covered in Section 3 under results and discussion.

2.1. Goal & Scope

The goal of this study is to identify the potential environmental impacts related to a dog. For the study, an average dog of 15 kg was assumed. This assumption was taken from the PEF pilot study for pet food [11]. Moreover, an average lifetime of 13 years was assumed [13,14]. In the following subsections, the functional unit and the reference flow, the product system and the selected impact categories and LCIA methods are described. In addition, the scenarios considered in the scenario analysis are outlined.

2.1.1. Functional Unit/ Reporting Unit and Reference Flow

An LCA requires defining a functional unit. For this study, it was suggested to use the term reporting unit, which was also proposed by [15] for the Life-LCA approach and following the proposal made for organizational LCA [16]. The reason is that it is not intended to compare functionally equivalent dogs or even dogs with other products. Therefore, a reporting unit approach based on simple reference flow was chosen. Hence, the reporting unit here is defined as one average dog. The reference flow is expressed as the life of an average dog assuming an average weight of 15 kg and an average life expectancy of 13 years.

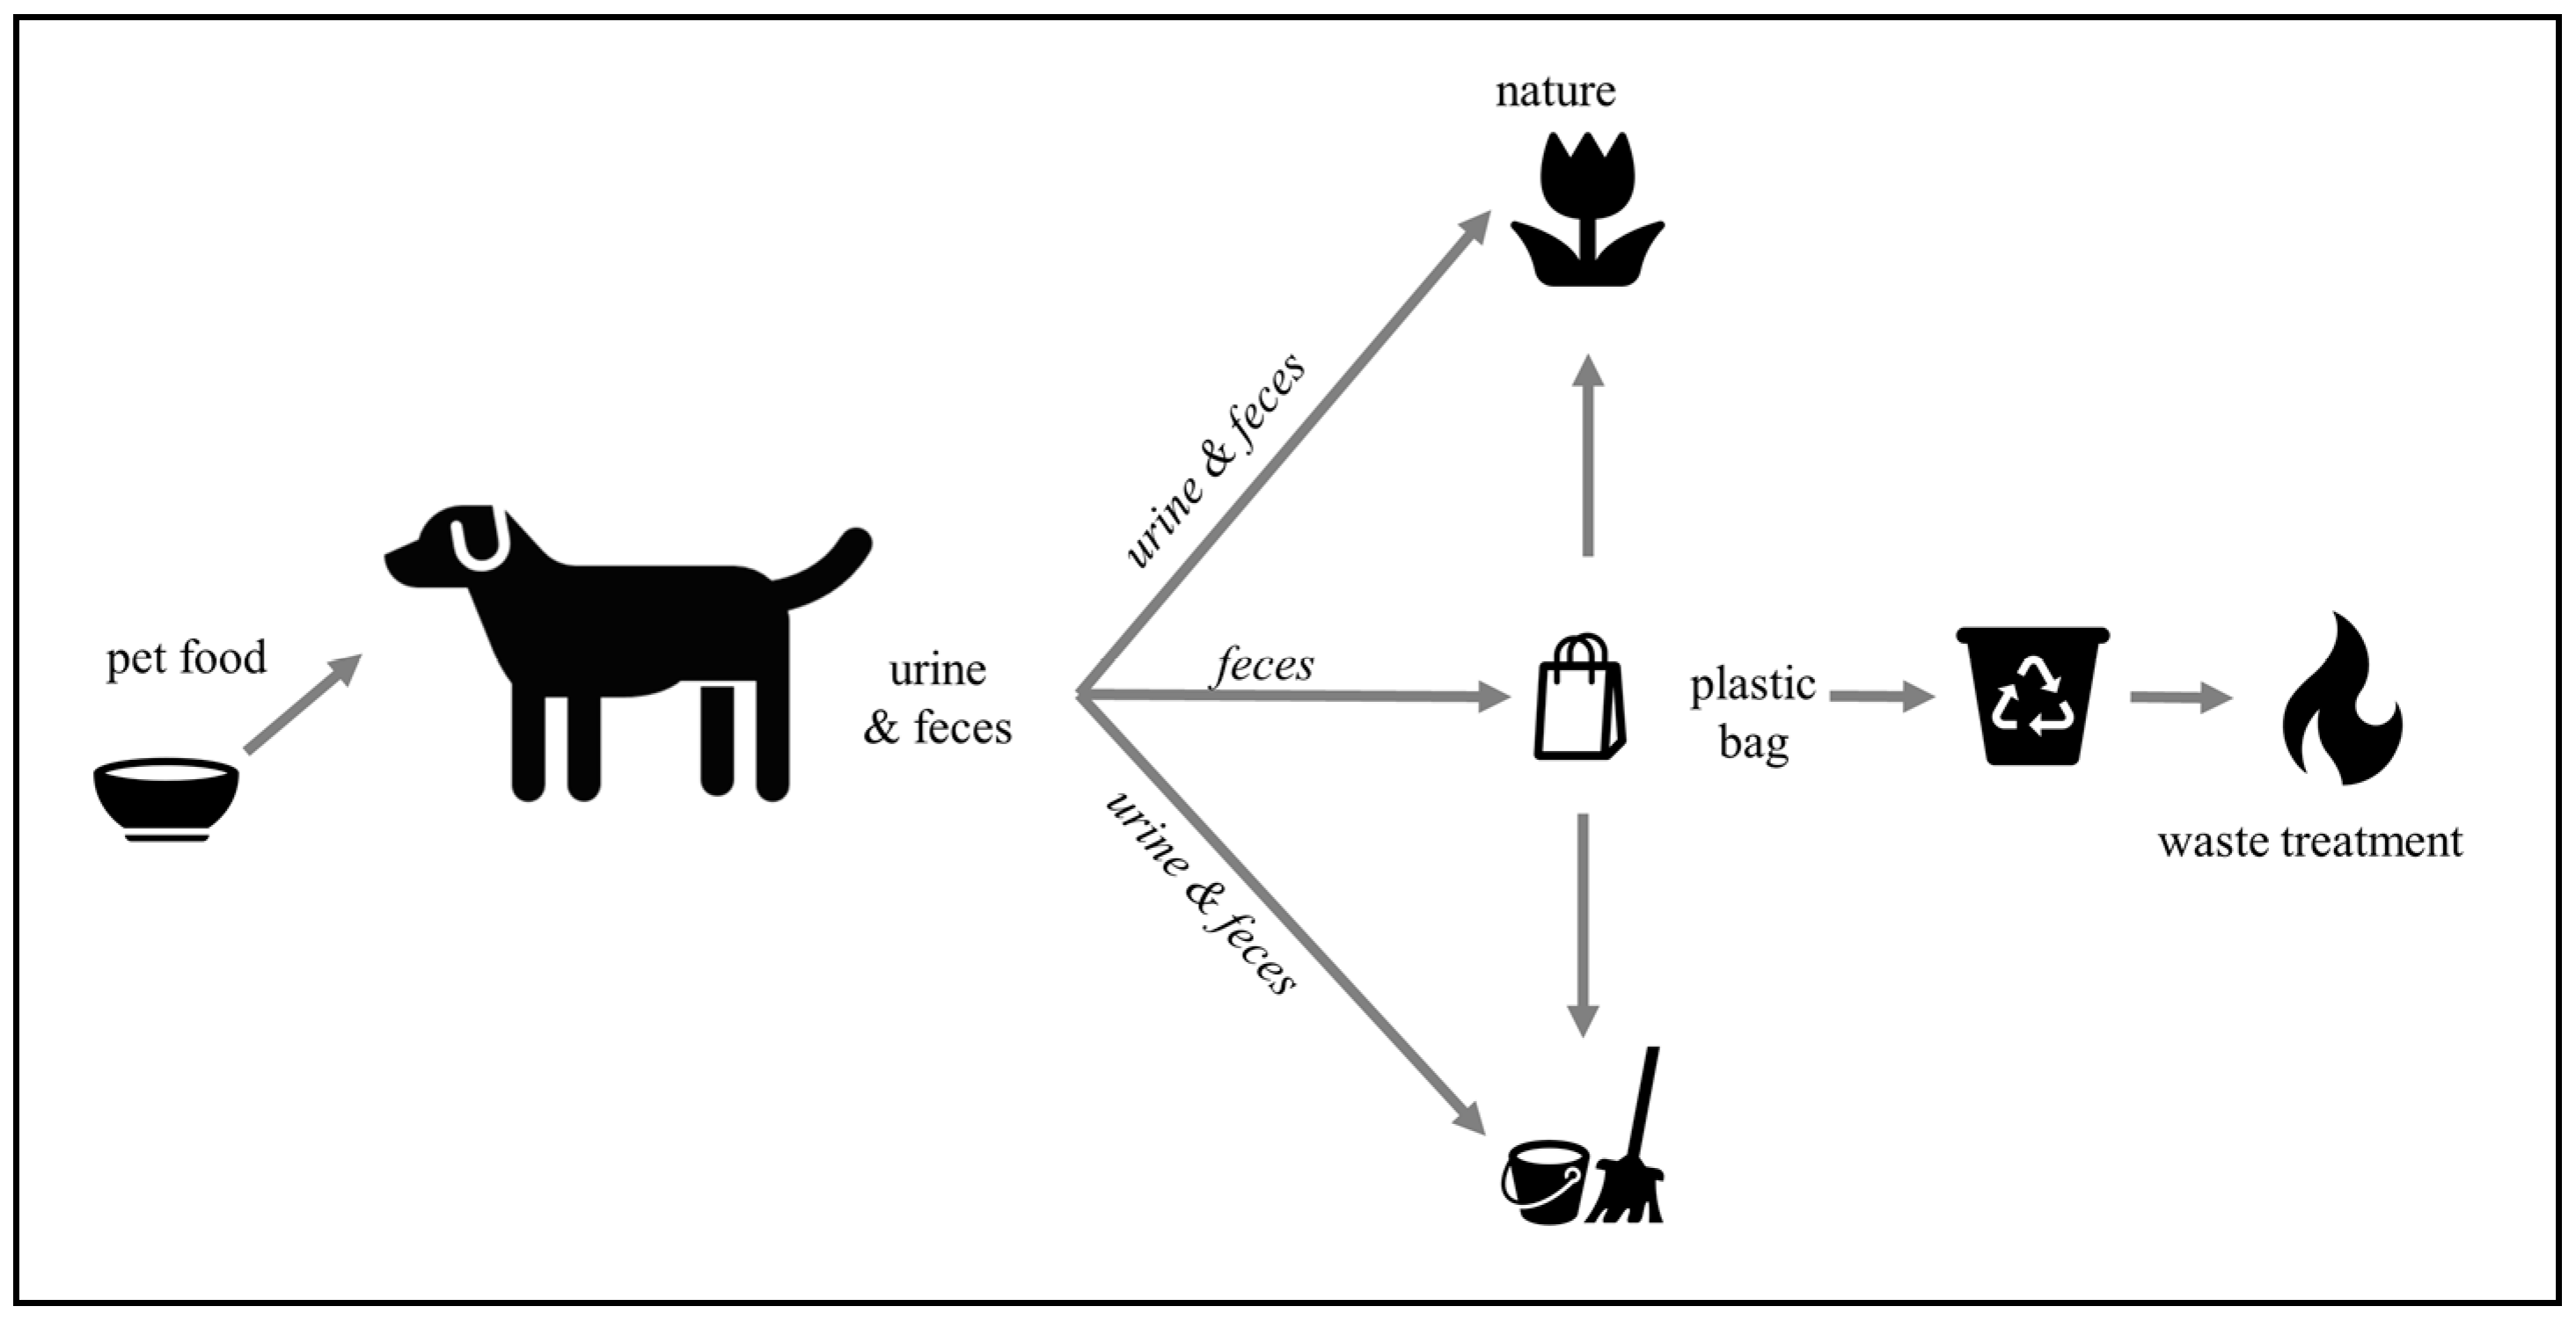
2.1.2. Product System

The product system is illustrated in Figure 1 and includes the following two main parts:
(1)
dog food, including the food’s production, transport, and EoL
(2)
dog excrements, i.e., feces and urine
Part 1, dog food, was addressed in the PEF pilot study. Information on the modeling, as well as the results, can be found in the PEFCR for pet [12] and the related PEF study [17]. The LCIA results of this PEF study were used as a ´module´ in this case study to model the process (life cycle stage) food for the dog. What happens after the pet food has been consumed by the dog, namely that it (or parts of it) enters the environment as urine and feces are not considered in the PEFCR and PEF study on pet food. This part (part 2) is investigated and modeled in this case study considering the different ways feces and urine can take: They can be directly emitted into nature or collected in bags and subsequently disposed of in waste bins.
A detailed description of the processes included in the product system is provided in Table 1. Further information (quantitative description and data sources) are provided in the inventory part in Section 2.2. Not included in this study are veterinary checks and treatments of the pet, as well as care (e.g., washing of the pet), toys, and accessories. Moreover, processes related to the creation and death of pets are not considered. According to the study of Annaheim et al. [4], as well as own estimations, these processes only contribute small shares to the overall environmental profile of the dog, i.e., their exclusion does not significantly affect the results.

2.1.3. Life Cycle Impact Assessment (LCIA) Categories and Methods

For the impact assessment, the same impact categories and LCIA methods (ILCD/PEF recommendation v1.09) were selected as in the PEFCR for pet food [12], which also contains the documentation of the specific characterization models and versions used. This allowed us to use the LCIA results obtained in the PEF study on pet food for modeling the process of pet food in this case study. In total, the following 15 impact categories were considered: Climate change, ozone depletion, human toxicity (cancer and non-cancer), particulate matter, ionizing radiation (human health effects), photochemical ozone formation, acidification, terrestrial eutrophication, freshwater and marine eutrophication, freshwater ecotoxicity, land use, water depletion, and MFR (mineral, fossil and renewable) resource depletion.

2.1.4. Scenario Analysis

A scenario analysis was conducted to assess the influence of the following parameters on the overall results:
  • lifetime of the dog
  • weight of the dog (weight is used here to express different sizes of a dog)
  • type of collecting the dog´s feces and collecting rate
Further details (data used and data sources) are presented in Section 2.2.

2.2. Inventory

Input and output data were collected for the processes described in Table 1 using the PEFR for pet food and the related PEF study, as well as literature and assumptions, for instance, on the dog´s owner´s behavior. In addition, we also analyzed direct emissions to the environment coming from the excrements, i.e., nutrients and heavy metals. The following three subsections provide information on how the processes (life cycle stages) of pet food and excretions (feces and urine) were modeled, and how these processes varied in the scenario analysis. For the modeling, the LCA software GaBi and the databases of the thinkstep AG (thinkstep 2017) and ecoinvent 3.5 were used (ecoinvent 2018).

2.2.1. Pet food

As described in Section 2.1, the weight of an average dog was assumed to be 15 kg. This assumption, as well as information on its daily energy requirements and daily consumed pet food (i.e., 883 g wet pet food), was taken from the PEFCR for pet food [12]. All data related to the pet food (production, use and EoL) were taken from the PEFCR for pet food as well and the related PEF study [17].

2.2.2. Excrements (Feces and Urine)

The environmental impacts related to the excrements of a dog and different collection and treatment procedures have not yet been analyzed comprehensively in LCA but are modeled in this case study. First, information on the amount and composition of the excrements is provided. Then, the EoL of the excrements is described, which here includes the emission of excrements into nature, as well as the collection of feces and their treatment/disposal.

Amount and Composition of Excrements

An average dog produces around 0.2 kg feces and 0.4 l urine per day. These values were calculated by Schaepe [18] using data observations of three dogs on five days. Assuming an average lifetime of 13 years, this equals to almost 1000 kg of feces and almost 2000 l of urine per dog. In this study, a constant amount of feces and urine is assumed over the whole lifetime of the dog. This simplification is suitable as the consumed amount of proteins of a young dog (younger than six months) is lower than the consumption of an adult dog, but at the same time, young dogs have a higher need of fat than their senior fellows [19,20]. As this shift in nutrition only applies to the first six months, we chose to regard the consumed food, and thus the resulting excrements, as constant over the life of the dog.
For modeling environmental impacts related to the emission of urine, average data for its composition provided by Schaepe [18] were used. Regarding the composition of feces, no data were found. Therefore, we conducted our own analyses on samples of feces we took from three different dogs. All dogs were between five to six years old, one dog was small (9 kg), one medium (13 kg), and one big (18 kg). One dog ate special salt-free pet food, while the other two ate normal pet (wet) food. The samples were analyzed with regard to the following elements: Arsenic, boron, cadmium, calcium, chrome, cobalt, copper, iron, lead, manganese, molybdenum, nitrogen, organic substance, phosphate, potassium, selenium, sodium, sulphur, and zinc. A detailed list of the composition of the dog´s feces and urine is included in the Supplementary Materials Table S1.
It should be noted that the sample size for determining the feces data was relatively small. As shown by Meyer et al. [19], different breeds of dogs and different diets have obviously an influence on the composition of excrements. However, no comprehensive feces composition with such a high resolution is available. Therefore, the data used are the best available, but future studies should check the representativity for a range of dogs with different types of food.

EoL of Excrements

The EoL of excrements was considered as follows: Regarding the urine, it was assumed to be completely emitted to soil, as the urine cannot easily be collected or disposed of differently. Hence, urine was considered as direct emission into nature and calculated in this case study based on the composition listed in the Supplementary Materials Table S1.
Regarding the feces, the following differentiation was made (see also Figure 1):
  • feces are picked up in plastic bags by the dog´s owner and disposed of in municipal waste bins (and are then subject to municipal waste collection and treatment)
  • feces are cleaned up from the street by local cleaning departments (both with normal municipal waste collection trucks and special small cars for collecting feces and dirt)
  • feces are not cleaned up, i.e., they represent a direct emission to the environment.
It was assumed that a certain share of feces was picked up by the dog owners and disposed of either in public bins on the street or at home (on average 15% in Berlin, Germany). This waste is then picked up by the municipal waste cleaning on their normal routes. Further, it was assumed, that half of the remaining share of the feces, which are left on the streets (i.e., in our example of Berlin, 42.5% of the total amount of feces) are picked up by special feces´ collection cars by the municipal waste cleaning, while the other half stays in the street/park and decomposes there.
An overview of the inventory data, data sources, and assumptions made are presented in Table 2. The assumptions made for the collection of feces was done based on the estimations for the city of Berlin in Germany and were tested in a scenario analysis (see Section 2.2.3).

2.2.3. Scenarios

Naturally, smaller or taller dogs, respectively lighter or heavier dogs, require less or more pet food and also produce different amounts of excrements. Moreover, other factors like the age of the dog, the activity level, the state of the health, and others can influence the amount of pet food required and the amount of excrements produced by the dog. Therefore, the influence of both the amount of pet food and excrements (i.e., parameters related to the dog´s weight) on the overall environmental impacts was analyzed in a scenario analysis. For this study, we only considered different weights of a dog to estimate the related different amount of pet food consumed and feces produced. We selected two scenarios: A 7.5 kg dog and a 30 kg dog to represent a small and a big dog. Moreover, we analyzed how the LCIA results changed depending on different life expectancies of a dog and chose 8 years and 18 years as examples to represent a dog with a rather low and a dog with a rather high life expectancy.
The pick-up-rate of the feces varies depending on the structure of the region (rural or urban), city, country, age of the owner, and his/her behavior, etc. Therefore, the environmental impacts related to different pick-up rates of the feces (i.e., parameter related to the EoL of excrements) were examined. For the analysis of the two extremes, i.e., that 1) either all of the feces (100%) produced by a dog are picked up in plastics bags by the dog´s owners and disposed to municipal waste bins or that 2) no feces (0%) are picked up in plastic bags. Hence, the key differences between the two scenarios are:
  • 100% pick-up scenario: Need for plastic bags, collection of bags by municipal cleaning company with normal collection trucks during their normal routes, no use of special small cars.
  • 0% pick-up scenario: No plastic bags, use of special small cars to collect a share of the feces from the streets (here: 50% of the total amount), the remaining share enters the environment as a direct emission.
The scenarios considered, the data used, and the data sources are summarized in Table 3.

3. Results and Discussion

In the following, the results of the case study on a dog are presented and discussed. Shown are: The absolute values of the LCIA per impact category (Section 3.1), the relative contributions of life cycle stages/ and processes to the impact categories (Section 3.2), the LCIA results normalized to the EU domestic market (Section 3.3), and the results of the scenario analysis (Section 3.4).

3.1. LCIA Results: Absolute Values

The absolute values of the LCIA results for the impact categories can be seen in Table 4. The results are shown for an average dog of 15 kg, a life expectancy of 13 years, and an assumed average pick-up rate of feces of 15%.
To evaluate the results shown in Table 4 and to illustrate their significance, in the following, some examples are provided which compare the impacts caused by a dog with impacts caused by common products or activities or an average German citizen.
Over the whole lifetime of 13 years an average dog causes around 8.2 t CO2 eq. This almost equals the amount needed to produce Mercedes C250 middle-class luxury car [24]. In one year, a dog emits around 630 kg CO2 eq, which equals around 7% of the annual greenhouse gas (GHG) emissions of an average German citizen (in 2016 around 11.1 tons CO2 eq were emitted per capita in Germany [25]). Moreover, the total amount of GHG emissions caused by a dog are similar to the amount of GHG emissions caused by driving around 72,800 km with a car (assuming that the car emits around 120 g CO2 eq. per km) or by 13 return flights from Berlin to Barcelona [26]. The freshwater ecotoxicity potential caused by a dog is around 18,000 CTUe. That is more than freshwater ecotoxicity potential caused by treating 6.5 ha arable land for one year with the herbicide glyphosate (according to [27] around 2.8 kg of glyphosate are used per ha per year, which equals a freshwater ecotoxicity potential of around 1500 CTUe). The total freshwater eutrophication potential of a dog is around 5.0 kg P eq., which would equal the eutrophication potential caused by producing 21,900 l of beer [28]. These examples obviously do not intend any comparison between these rather different products, they just serve the purpose of providing a reference for an understanding of the orders of magnitude of the impacts of a dog.

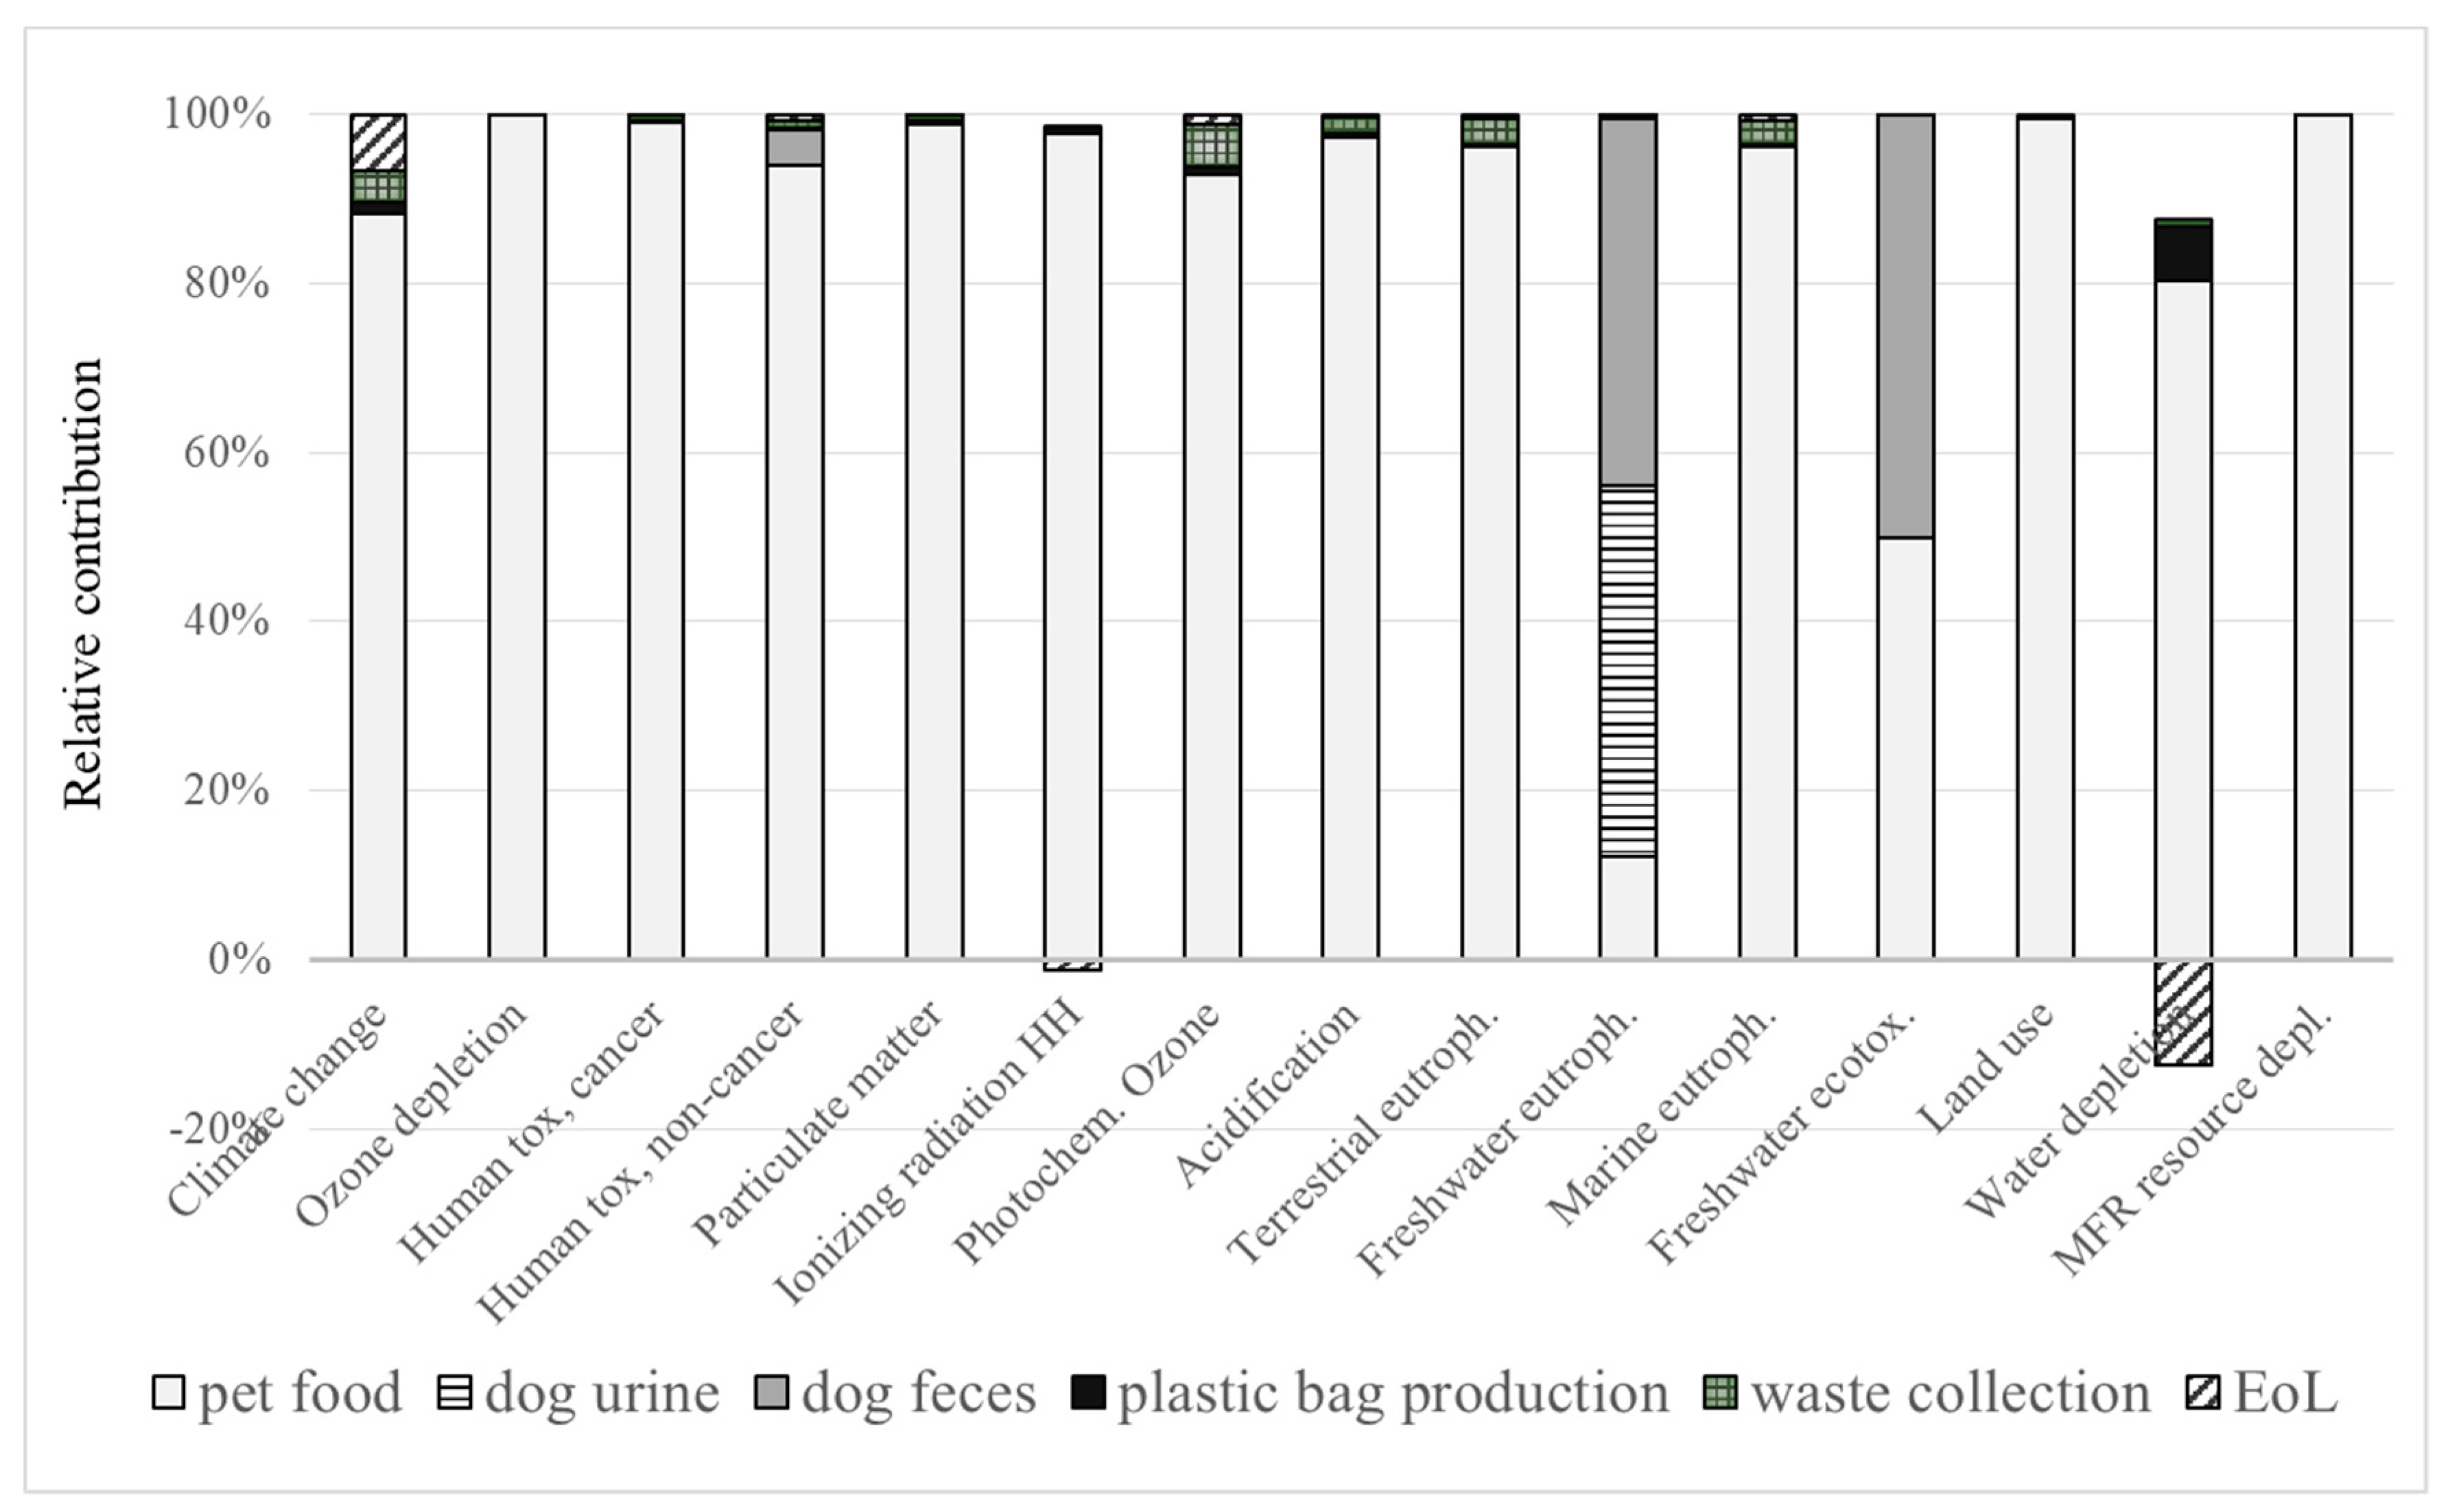
3.2. Relative Contribution of Life Cycle Stages

The contribution of the different life cycle stages/processes within the product system of a dog to the total result is displayed in Figure 2. Except for the impact categories of freshwater eutrophication potential and freshwater ecotoxicity potential, the main contribution to all the impact categories comes from the life cycle stage pet food. Here, the impact in most categories is mainly caused by the processes ´ingredients´ and ´packaging production’ [12]. The category of freshwater eutrophication is mainly determined by the dog´s urine (around 44%) and the dog´s feces (around 43%). This is mainly caused by phosphorous contained in the excrements. Urine does not contribute significantly to any other category, while feces have a significant contribution (around 50%) also to the category of freshwater ecotoxicity potential. Impacts related to the plastic bag production are visible in the category of water depletion potential (around 9%). Impacts related to the waste collection step are not visible in several categories but never exceed 5%. Relevant contributions of the EoL stage, which, in Figure 2, include the incineration and landfill of municipal waste, can be seen only for the category of climate change potential (around 7%). The negative values in the impact category water depletion result from credits provided for waste treatment/incineration in the EoL stage due to energy recovery.

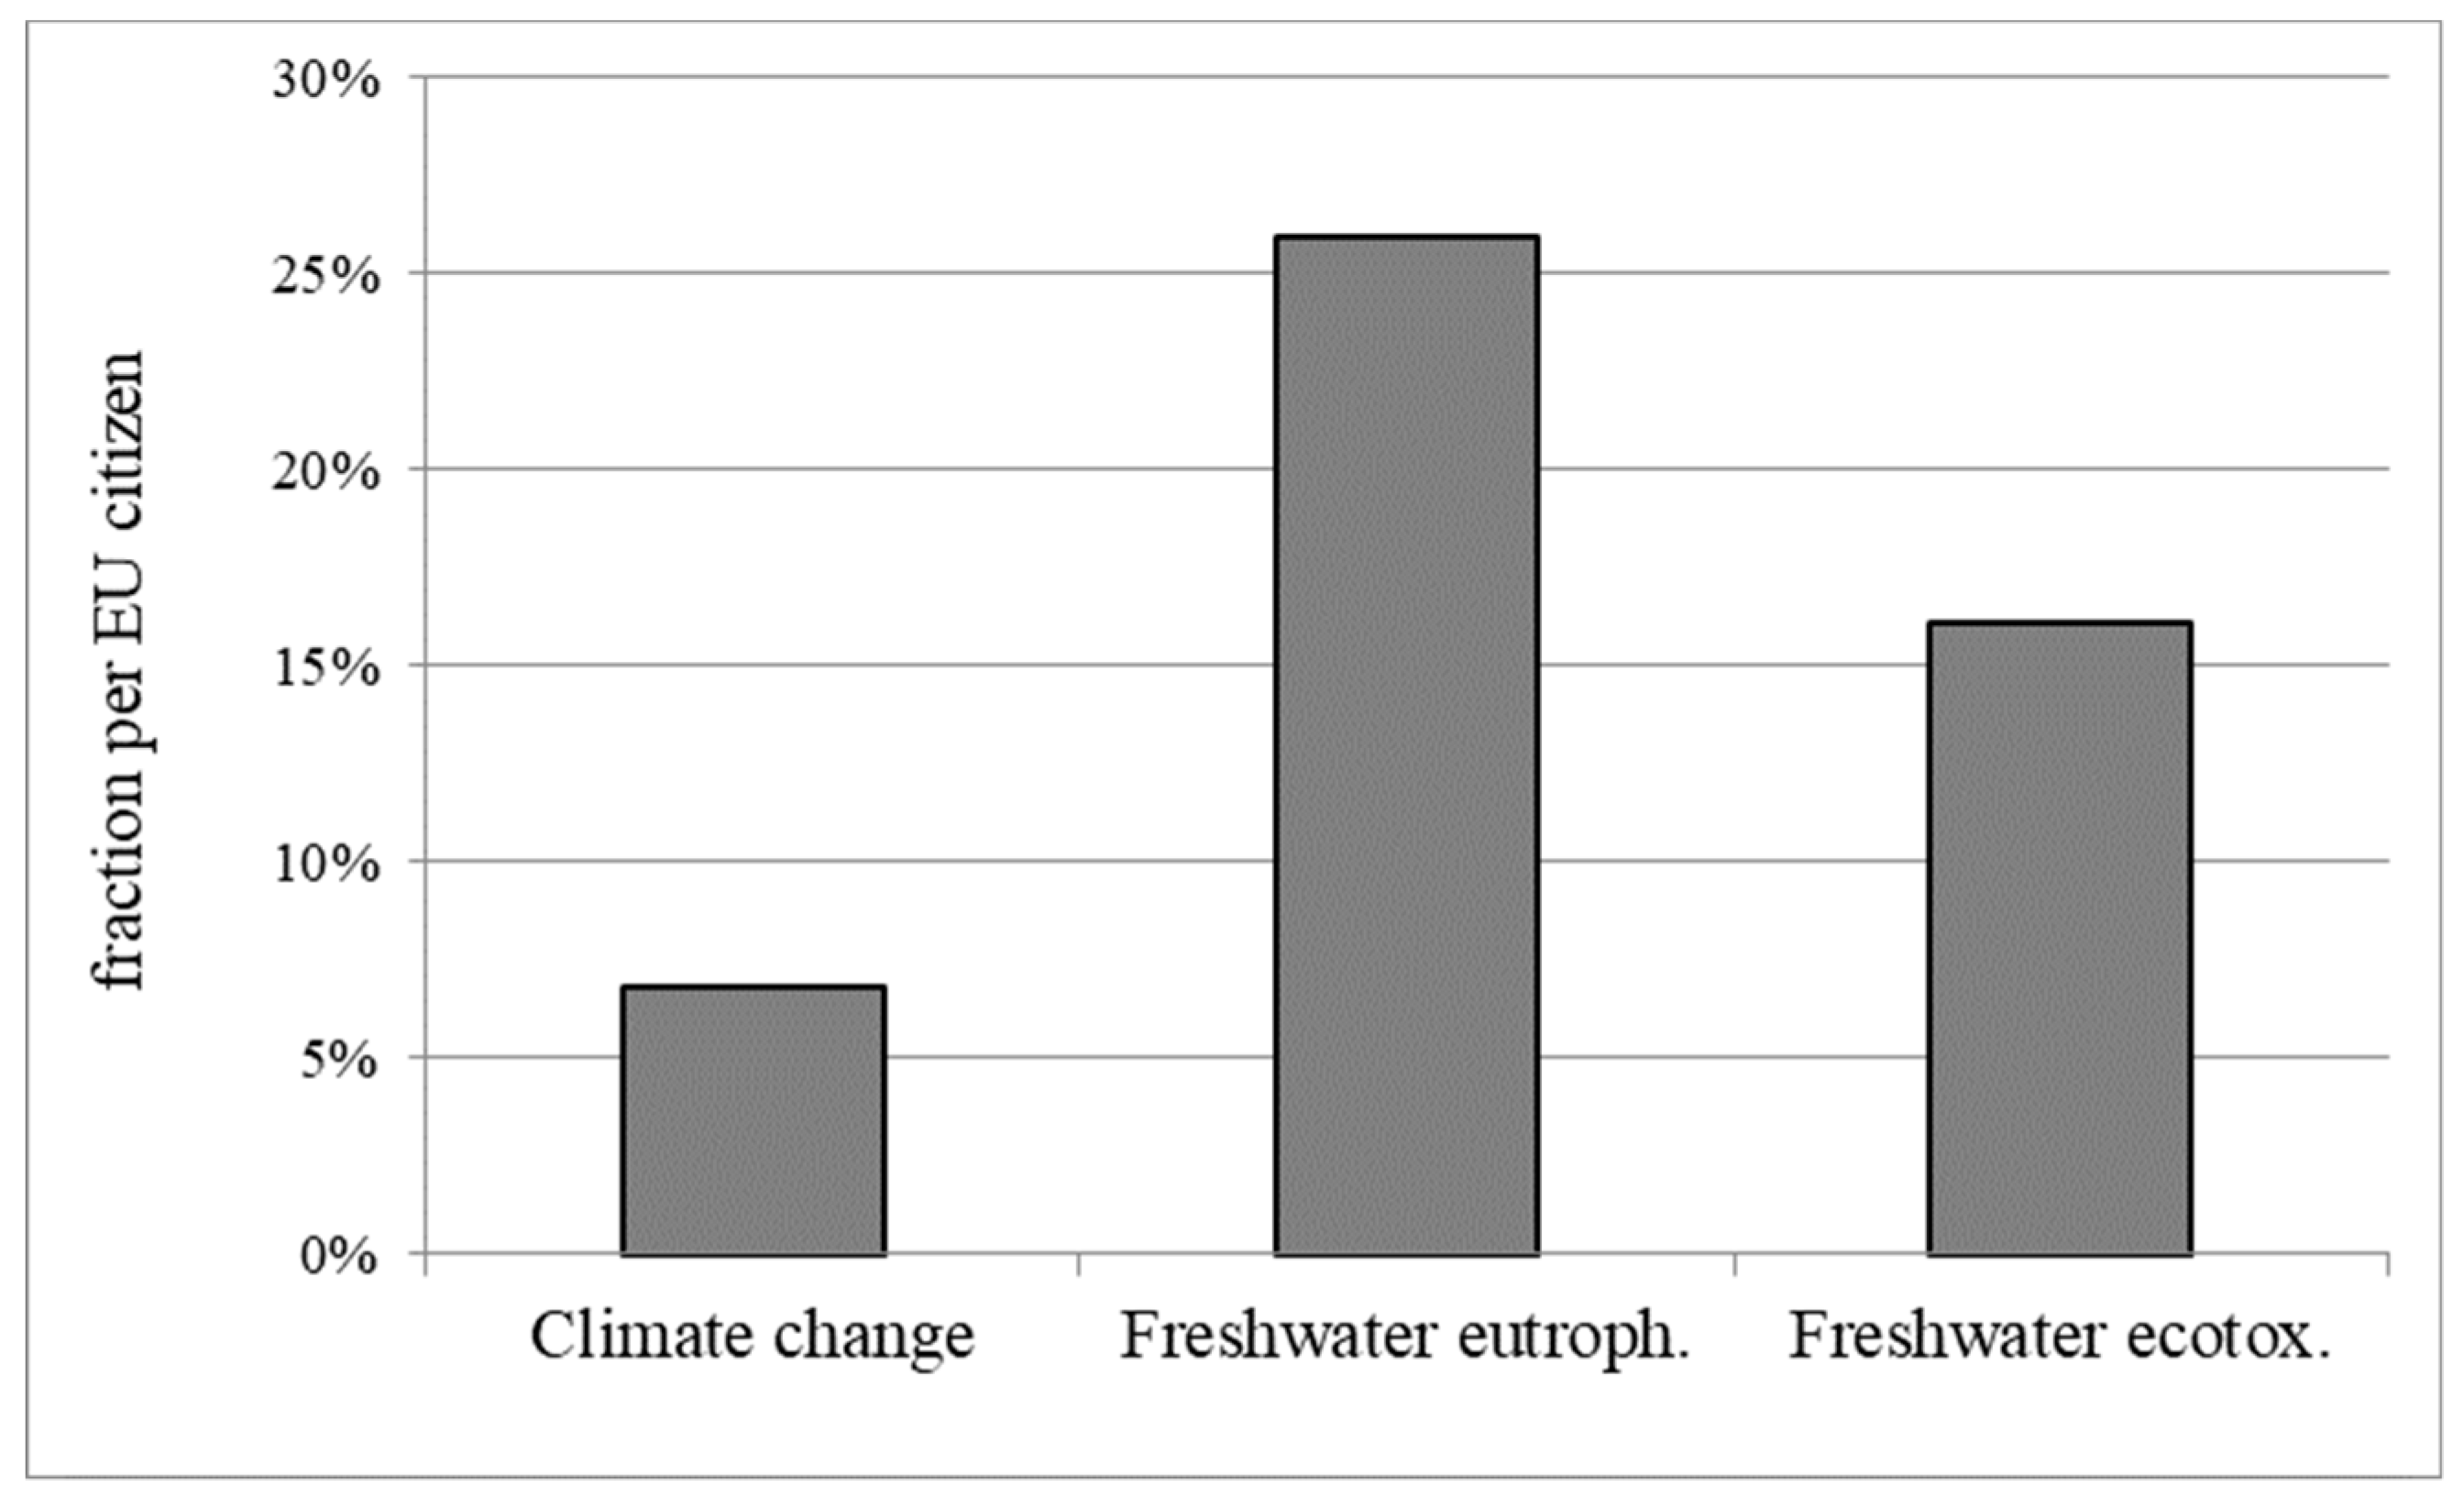
3.3. Normalized LCIA Results

Normalization is an optional step of LCIA, which allows the practitioner to express the results using a common reference value [29]. For this study, we chose the European domestic market as a reference impact and used the normalization factors (NF) provided by the European Commission (EC) in the context of the European Environmental Footprint [30]. Normalization factors express the total impact occurring in a reference region for certain impact categories within a reference year. Using these factors, the LCIA results of this case study can be presented as a fraction of all emissions in the EU per year or also as a share of all emissions of an average EU citizen.
When evaluating normalized results, it has to be noted that the NFs, i.e., the determined numbers of total emissions, have different robustness levels. The EC [30] differentiates between the levels low, medium, high, and very high based on the data availability of the emissions and the methodological development of the LCIA methods. Generally, normalized LCIA results, and particularly those which are calculated using NFs with low robustness levels, need to be interpreted carefully.
Due to the difficulties related to normalization, Figure 3 shows the normalized results of the case study only for three selected impact categories: Climate change, the only impact category (next to particulate matter), which is characterized with a very high robustness level, according to [30], and freshwater eutrophication and freshwater ecotoxicity. Though the latter two categories are characterized with medium to low and low robustness level, we decided to show their normalized results because both categories are highly influenced by the dog´s excrements. The normalized results in Figure 3 are expressed as fraction per EU citizen, i.e., the results for the individual impact categories are all compared to the annual impact of an average EU citizen. Moreover, MFR resource depletion, as well as human toxicity cancer and non-cancer effects, has large fractions, but as those impact categories are mainly driven by the pet food, they are not displayed in Figure 3. The normalized results for all impact categories can be found in the Supplementary Materials (Figure S1).
To illustrate the meaning of the normalized results, we use the following example: The total LCIA results of one dog over 13 years shown in Table 4 correspond to an annual impact of around 630 kg CO2 eq. For comparison, the GHG emissions in the EU in 2010 were about nine tons CO2 eq. per person [30]. Therefore, one dog has an impact of 630/9000 = 0.07 person-year, which means that the impact of an average dog is around 7% of an average EU citizen in a year similar to the one calculated for an average German citizen in Section 3.1.
High fractions per EU citizen of more than 15% up to 26% were calculated for the categories of freshwater ecotoxicity and freshwater eutrophication (reference values in [30]). It is not clear here if the high normalization results indeed represent high fractions or if the results are only high because the NFs are too small. This could happen if not all emissions related to this impact category, for instance, direct emissions caused by dog excrements, are captured in the NFs. However, in any case, the contribution of a dog to these impact categories appears to be rather significant.

3.4. Scenario Analysis

Table 5 shows the results of the scenario analyses examining the influence of both the weight of a dog and its life expectancy on the LCIA results (see Table 3).
Naturally, the impacts caused by one dog increase with its life expectancy with increasing weight. Regarding life expectancy and its impacts, a linear relation was assumed. For illustrating the influence of life expectancy and weight/size of the dog, we used two scenarios representing two extremes: A small dog of 7.5 kg with a low life expectancy of eight years and a big dog of 30 kg with a high life expectancy of 18 years.
Compared to the impacts of the average 15 kg dog caused during its 13-year lifetime (e.g., 8200 kg CO2 eq.) the impacts caused by a small 7.5 kg dog that lives eight years would be less than a half of it (e.g., 3000 kg CO2 eq.) while the impacts caused by a big 30 kg dog that lives 18 years, would be more than twice as high (e.g., 19,000 kg CO2 eq.).
For most impact categories in the 0% pick-up scenario, the deviation of the results of the 15%-pick-up scenario (average scenario) is negligible (less than 1%). Only within the categories of freshwater eutrophication and freshwater ecotoxicity, significant differences between the results can be seen. The impact increases almost 9% in the category of freshwater ecotoxicity, a category where feces have a high contribution to the overall impact, derives from more direct emissions (from feces) that enter the environment. Feces also have a high contribution to the category of freshwater eutrophication (7.5%).
In the 100% scenario, significant changes in the results can be observed in the same categories as in the 0% pick-up scenario. If all feces are picked up, there are (almost) no direct emissions from feces, which is one of the main drivers in freshwater eutrophication and freshwater ecotoxicity (see Figure 2). This also leads to significant decreases in both categories (−43% and −50%).

4. Conclusions and Outlook

This study analyses the potential environmental impacts of a pet dog, taking into account impacts related to its food and excrements, i.e., trying to address the whole ´life cycle´. The following conclusions are mainly valid for a German or European context, but potentially also other developed countries. Regional differences in feeding dogs and treating their excrements were not part of this study.
The life cycle stage ´pet food´ is the main contributor to all impact categories except of those that are affected by direct emissions, i.e., the dog excrements, such as freshwater eutrophication and freshwater ecotoxicity. The impacts in these two categories are mainly determined by dog urine and feces. When looking at the whole life cycle, the impact caused by the production of plastic bags is comparably small. In this study, the calculation assumed two bags per day, hence, rather overestimated the real number of bags needed to collect the feces, only one impact category was affected by more than 8%. Waste collection and waste incineration only have visible impacts in the categories of climate change and water depletion.
The results obtained for the category of climate change potential in this study are overall in line with those calculated by [4], and also in this study, the main contribution to climate change comes from pet food. It has to be noted, that both studies differ regarding their system boundaries: In contrast to this study, [4] considered drives with the dog, nurturing, toys, and other accessories next to the pet food, but excluded the EoL emissions of excrements. In that sense, these studies contain complementary aspects. However, at least for climate change, the additional aspects covered by [4] did not have a significant contribution to the overall impact, whereas the inclusion of the EoL stage in this study showed significant contributions to the impact categories of freshwater eutrophication and freshwater ecotoxicity. It should be noted, that in [4] only global warming potential and eco-points were calculated for different pet animals. Other impact categories were not included.
As dogs urinate to mark territories and communicate [31,32], the impact due to urine can probably not be reduced without harming the social structure of the dog. However, the impact of feces can be significantly reduced if feces would be collected and disposed of properly. The scenario analyses of different pick-up rates showed that collecting the feces, hence decreasing direct emissions, would lead to significant decreases in the categories of freshwater ecotoxicity and freshwater eutrophication. A positive side effect of collecting the feces would also be the reduction of littering in general, which is not measured in LCA. In Berlin in Germany, for example, special cars are used to collect feces from the streets. These cars consequently lead to a reduction of direct emissions from feces, but also cause additional impacts due to a higher collection effort.
Moreover, optimizing dog food could significantly contribute to reducing environmental impacts. According to [12] the impacts of the pet food are mainly caused by beef and poultry co-products, tinplate production, steel can production and transport to retailer.
It has to be noted that many processes and activities related to a dog´s life, such as health care or accessories, have been excluded from this study for now. If they would have been considered, the environmental impacts would be even higher [4].
It is acknowledged, that there might be potential positive impacts of dogs on human health due to interactions between dog and owner (described, e.g., by [33,34,35,36]), which were not analyzed in this study, as they demand much broader system boundaries. These positive impacts have to be acknowledged when the environmental impacts are evaluated. From a purely environmental point of view, fewer pets and if at all, smaller pets are obviously preferable.
Further research and case studies should focus on the following topics:
  • Inclusion of other life cycle stages, e.g., consideration of accessories, care of the dog (including, e.g., pharmaceuticals).
  • Addressing other environmental aspects, such as littering.
  • Detailing the analysis for different dog breeds and types of food.
  • Regional differences
Comparison of different consumption lifestyles (with and without pets), in a broader context of, e.g., the recently proposed new Life-LCA method by [15]. Differences may relate, e.g., to different travel behaviors.
This study is a first attempt to comprehensively analyze environmental impacts related to pet dogs. It was found that the environmental impacts of pet dogs are rather significant. Environmental hotspots were identified, some recommendations for reducing optimization potential are given, and several ideas for future research are provided.

Supplementary Materials

The following are available online at https://www.mdpi.com/2071-1050/12/8/3394/s1, Figure S1: LCIA results for an average dog (15 kg, life expectancy of 13 years) and an average pick-up-rate of 15% normalized to the total impacts occurring in the EU domestic market per person per year, Table S1: Composition of the excrements of a dog (feces and urine). The results for “feces to soil” are average values based on three samples (each from a different dog), analyzed by Raiffeisen Laborservice1. The results for “urine to soil” are average values based on the urine collected from 3 dogs on 5 days by Schaepe 20112.

Author Contributions

Conceptualization, M.F.; methodology, M.F. and A.L.; investigation, K.M.Y. and A.L.; data curation, K.M.Y.; writing—original draft preparation, K.M.Y.; writing—review and editing, A.L. and M.F.; supervision, M.F.; project administration, A.L. All authors have read and agreed to the published version of the manuscript.

Funding

This research received no external funding.

Acknowledgments

We acknowledge support by the German Research Foundation and the Open Access Publication Fund of TU Berlin.

Conflicts of Interest

The authors declare no conflict of interest.

References

  1. European Pet Food Federation (FEDIAF): More than 140 Million Cats and Dogs in the EU. Available online: http://www.fediaf.org/press-releases/2156-more-than-140-million-cats-and-dogs-in-the-eu.html (accessed on 11 April 2020).
  2. Statista. Available online: https://de.statista.com/statistik/daten/studie/30157/umfrage/anzahl-der-haustiere-in-deutschen-haushalten-seit-2008/ (accessed on 20 July 2018).
  3. Kasielke, T.; Buch, C. Urbane Böden im Ruhrgebiet. In Online-Veröffentlichungen des Bochumer Botanischen Vereins; 2011; Volume 3, Available online: https://www.botanik-bochum.de/publ/OVBBV3_7_Kasielke_Buch_UrbaneBoedenRuhrgebiet.pdf (accessed on 11 April 2020).
  4. Annaheim, J.; Jungbluth, N.; Meili, C. Bericht. In Praktikumsarbeit; ESU-services GmbH: Schaffhausen, Switzerland, 2019. [Google Scholar]
  5. Su, B.; Martens, P. Environmental impacts of food consumption by companion dogs and cats in Japan. Ecol. Indic. 2018, 93, 1043–1049. [Google Scholar] [CrossRef]
  6. Bermingham, E.N.; Thomas, D.G.; Cave, N.J.; Morris, P.J.; Butterwick, R.F.; German, A.J. Energy Requirements of Adult Dogs: A Meta-Analysis. PLoS ONE 2014, 9, e109681. [Google Scholar] [CrossRef] [PubMed]
  7. Okin, G.S. Environmental impacts of food consumption by dogs and cats. PLoS ONE 2017, 12, e0181301. [Google Scholar] [CrossRef] [PubMed] [Green Version]
  8. German, A.J. The growing problem of obesity in dogs and cats. J. Nutr. 2006, 136, 1940S–1946S. [Google Scholar] [CrossRef] [PubMed] [Green Version]
  9. Ravilious, K. How green is your pet? New Sci. 2009, 204, 46–47. [Google Scholar] [CrossRef]
  10. European Commission (EC). Results and Deliverables of the Environmental Footprint Pilot Phase. Available online: https://ec.europa.eu/environment/eussd/smgp/PEFCR_OEFSR_en.htm (accessed on 11 April 2020).
  11. Finkbeiner, M. Product environmental footprint—Breakthrough or breakdown for policy implementation of life cycle assessment? Int. J. Life Cycle Assess. 2014, 19, 266–271. [Google Scholar] [CrossRef] [Green Version]
  12. The European Pet Food Industry Federation (FEDIAF); C&D Foods; FACCO, Chambre Syndicale des Fabricants d’Aliments pour Chiens, Chats, Oiseaux et autres Animaux Familiers (the French Pet Food Association for Dogs, Cats, Birds and Other Domestic Pets); Mars PetCare Europe; Nestlé Purina PetCare Europe; saturn petcare gmbh, and Quantis. Product Environmental Footprint Category Rules (PEFCRs): Prepared Pet Food for Cats and Dogs, Final version; European Commission: Brussels, Belgium, 2018. [Google Scholar]
  13. Adams, V.J.; Evans, K.M.; Sampson, J.; Wood, J.L.N. Methods and mortality results of a health survey of purebred dogs in the UK. J. Small Anim. Pract. 2010, 51, 512–524. [Google Scholar] [CrossRef] [PubMed]
  14. Inoue, M.; Kwani, N.C.L.; Sugiura, K. Estimating the life expectancy of pet dogs in Japan using pet cemetery data. J. Vet. Med Sci. 2018, 80, 1153–1158. [Google Scholar] [CrossRef] [PubMed] [Green Version]
  15. Goermer, M.M.; Lehmann, A.; Finkbeiner, M. Life-LCA: Assessing the environmental impacts of a human being—Challenges and perspectives. Int. J. Life Cycle Assess. 2019, 25, 141–156. [Google Scholar] [CrossRef]
  16. Life Cycle Initiative, United Nations Environment Programme and Society for Environmental Toxicology and Chemistry. Guidance on Organizational Life Cycle Assessment; UNEP/SETAC: Pensacola, FL, USA, 2015. [Google Scholar]
  17. The European Pet Food Industry Federation (FEDIAF); C&D Foods; FACCO, Chambre Syndicale des Fabricants d’Aliments pour Chiens, Chats, Oiseaux et autres Animaux Familiers (the French Pet Food Association for Dogs, Cats, Birds and Other Domestic Pets); Mars PetCare Europe; Nestlé Purina PetCare Europe; saturn petcare gmbh, and Quantis. Product Environmental Footprint Screening Study—Prepared Pet Food or Cats and Dogs; The European Pet Food Industry Federation: Brussels, Belgium, 2015. [Google Scholar]
  18. Schaepe, K. Untersuchungen an Hunden zur Rohnährstoffverdaulichkeit Sowie Kot- und Harnzusammensetzung bei Variation der Rohaschegehalte im Futter durch Unterschiedlich Knochenreiche Schlachtprodukte. Ph.D. Thesis, Tierärztliche Hochschule Hannover, Hannover Deutschland, Germany, 2011. [Google Scholar]
  19. Meyer, H.; Zentek, J.; Habernoll, H.; Maskell, I. Digestibility and Compatibility of Mixed Diets and Faecal Consistency in Different Breeds of Dog. J. Vet. Med. A 1999, 46, 155–165. [Google Scholar] [CrossRef] [PubMed]
  20. Mundim, A.V.; Coelho, A.O.; Hortêncio, S.M.; Guimarães, E. Influence of age and sex on the serum biochemical profile of Doberman dogs in the growth phase. Comp. Clin. Pathol. 2007, 16, 41–46. [Google Scholar] [CrossRef]
  21. BSR. Phone Call with Representative of the Municipal Waste Collection Company; Berliner Stadtreinigung (BSR): Berlin, Germany, 2018. [Google Scholar]
  22. Eurostat. Database. Municipal Waste by Waste Management Operations. Available online: http://ec.europa.eu/eurostat/data/database?node_code=env_wasmun (accessed on 3 January 2019).
  23. Becker, N.; Dillitzer, N.; Sauter-Louis, C.; Kienzle, E. Fütterung von Hunden und Katzen in Deutschland. Tierärztliche Prax. Ausg. K Kleintiere/Heimtiere 2018, 40, 391–397. [Google Scholar]
  24. Henßler, M.; Bach, V.; Berger, M.; Finkbeiner, M.; Ruhland, K. Resource Efficiency Assessment—Comparing a Plug-In Hybrid with a Conventional Combustion Engine. Resources 2015, 5, 5. [Google Scholar] [CrossRef]
  25. OECD, Air and GHG Emissions (Indicator). Available online: https://data.oecd.org/air/air-and-ghg-emissions.htm (accessed on 25 July 2019).
  26. Atmosfair. Available online: https://www.atmosfair.de/ (accessed on 5 July 2019).
  27. UBA. Pflanzenschutzmittelverwendung in der Landwirtschaft (Use of Herbicides in Agriculture); Umweltbundesamt: Dessau, Germany, 2019. [Google Scholar]
  28. Blonk Consultants. PEF Screening Report of Beer in the Context of the EU Product Environmental Footprint Category Rules (PEFCR) Pilots 2 December 2015—Version 4.0. Available online: https://lcdn.quantis-software.com/PEF/resource/sources/69846e99-0950-4071-be0d-90fc32665bee/TheBrewersOfEurope_2015_PEFScreeningReport_Beer.pdf;jsessionid=66620121A42C12019A72D2872BC0C9CB?version=01.01.000 (accessed on 7 September 2019).
  29. ISO. 14044 Environmental Management—Life Cycle Assessment—Requirements and Guidelines; ISO: Geneva, Switzerland, 2006. [Google Scholar]
  30. European Commission (EC). Normalisation Method and Data for Environmental Footprints; Joint Research Centre (JRC) JRC Technical report; Eurpean Commission: Luxembourg, 2014; ISBN 978-92-79-40847-2. [Google Scholar]
  31. Coombes, H.A.; Stockley, P.; Hurst, J.L. Female Chemical Signalling Underlying Reproduction in Mammals. J. Chem. Ecol. 2018, 44, 851–873. [Google Scholar] [CrossRef] [PubMed] [Green Version]
  32. Pal, S.K. Urine marking by free-ranging dogs (Canis familiaris) in relation to sex, season, place and posture. Appl. Anim. Behav. Sci. 2003, 80, 45–59. [Google Scholar] [CrossRef]
  33. Barker, S.; Wolen, A.; Aaron, R. The benefits of human-pet animal interaction. A review. J. Vet. Med Educ. 2008, 35, 487–495. [Google Scholar] [CrossRef] [PubMed]
  34. Serpell, J. Beneficial Effects of Pet Ownership on Some Aspects of Human Health and Behaviour. J. R. Soc. Med. 2018, 84, 717–720. [Google Scholar] [CrossRef] [Green Version]
  35. Mazzatenta, A.; Carluccio, A.; Robbe, D.; Di Giulio, C.; Cellerino, A. The companion dog as a unique translational model for aging. Semin. Cell Dev. Biol. 2017, 70, 141–153. [Google Scholar] [CrossRef] [PubMed]
  36. Beetz, A.; Uvnäs-Moberg, K.; Julius, H.; Kotrschal, K. Psychosocial and psychophysiological effects of human-animal interactions. The possible role of oxytocin. Front. Psychol. 2012, 3, 234. [Google Scholar] [CrossRef] [PubMed] [Green Version]
Figure 1. Illustration of the product system of a dog.
Sustainability 12 03394 g001
Figure 2. Relative contribution to impact categories by life cycle stages/processes for an average dog (15 kg, life expectancy of 13 years) and an average pick-up-rate of 15%.
Sustainability 12 03394 g002
Figure 3. LCIA results of an average dog (15 kg, life expectancy of 13 years) and an average pick-up-rate of 15% normalized to the total impacts occurring in the EU domestic market per person per year.
Sustainability 12 03394 g003
Table 1. Inputs and outputs considered in the product system of a dog.
Input (pet food)Pet food itself
  • production of the pet food, including food packaging and transportation
Dishes for pet food
  • washing
Output (feces and urine)Plastic bag for disposal
  • production, including transportation of the bag
  • waste collection
  • waste treatment (landfilling and incineration)
Cleaning of streets
  • water
  • scavenger
Direct emissions
  • from feces to soil
  • from urine to soil
Table 2. Inventory data (presented for an average dog of 15 kg with a life expectancy of 13 years) and data sources.
ParametersUnitInventory Data Sources
Excrements
Average amount of urine l/day
l/lifetime
0.4
1898
Average results from experiments by [18] (only mature dogs were considered)
Amount of feceskg/day
kg/ lifetime
0.2
949
Rounded average weight of feces from three dogs on five days [18]
Feces are picked up and disposed of in plastic bags
Average number of bags usedbags/day
bags/lifetime
21
9490
Average times of defecations per day (based on the habits of the three dogs supplying the samples for these measurements)
Weight of one plastic bag (Polyethylene Film (PE-HD) without additives)g20Measuring the weight of a random plastic bag picked up in a ‘dog-station’ in Berlin2
Average pick-up rate%153Estimation of an expert from the municipal cleaning company in Berlin, Germany [21]
Municipal waste collection and treatment
Truck, municipal waste collectionkm30Estimated distance to landfill or incineration based on [12]
Small cars operating on the street to collect feces and dirtm/dog dirt12In total, the cars drive approximately 20 km per day and collect around 500 kg feces. Assuming that one dog dirt weighs around 0.3 kg, the car has to stop (on average) every 12 m to collect one dog dirt (calculation based on experts’ opinion from [21])
Waste to municipal waste incineration% 55Estimation based on data supplied by [22] (the same estimation was made in [12])
Waste to landfill% 45
Note 1 Two bags are needed when it is assumed that all feces (i.e., 100%) are picked up. This number is used in this model, even though the pick-up rate was calculated with 15%, which would require less bags. However, it is used here as a conservative approach. 2 A `dog-station´ is a public bin and a deposit of bags to pick up and dispose the dog feces. 3 According to expert’s opinion the pick-up rate in Berlin is 15% and one of the lowest in big cities in Germany.
Table 3. Scenario analysis: Parameters related to the dog (size and lifetime) and the EoL of excrements (pick-up rate), as well as data sources and assumptions.
ParametersUnitAverage DogScenariosData Sources and Assumptions
LifetimeYear13818It is assumed that the life expectancy of dogs varies on average between 8 and 18 years (using data from [13,14])
WeightKg157.530It is assumed that an average small dog weighs around 8 kg and an average big dog around 30 kg (based on data from, e.g., [23]). For this study, the numbers 7.5 kg and 30 kg are chosen, which represent dogs weighing half as much and twice as much as the average dog.
Pet food (average amount)kg/lifetime452815886563The pet food per weight is calculated as followed 110 [kcal] *dog weight 0.75[kg] (Based on [12])
Feces (average amount)g/lifetime9495841314The amount of feces and urine produced over different lifetimes is calculated based on the data for the average dog, assuming a linear relation.
Urine (average amount)l/lifetime 189811682628
Pick up rate%151000Here, the two extremes are considered, i.e., that no feces or all feces are picked up in plastic bags by the dog owners.
Table 4. LCIA results for an average dog (15 kg, life expectancy of 13 years and a pickup-rate of feces of 15%), absolute values.
Impact Category (Expressed as Potential)UnitLCIA Results
Climate changekg CO2 eq8.2 × 103
Ozone depletionkg CFC-11 eq7.9 × 10−4
Human toxicity, cancerCTUh3.6 × 10−4
Human toxicity, non-cancerCTUh2.5 × 10−3
Particulate matterkg PM2.5 eq3.5
Ionizing radiation (human health effects)kBq U235 eq480
Photochemical ozone formationkg NMVOC eq25
Acidificationmolc H+ eq64
Terrestrial eutrophicationmolc N eq220
Freshwater eutrophicationkg P eq5.0
Marine eutrophicationkg N eq21
Freshwater ecotoxicityCTUe1.8 × 104
Land usekg C deficit7.4 × 104
Water depletionm³ water eq34
Resource depletion (mineral, fossil, renewable)kg Sb eq1.6
Table 5. LCIA results of the scenario analyses: Variation of the age and the weight of a dog (assuming a 15% pick-up rate of feces), absolute values.
Impact Categories (Expressed as Potential)UnitSmall Dog with Low Life Expectancy (7.5 kg, 8 years)Big Dog with High Life Expectancy (30 kg, 18 years)
Climate changekg CO2 eq3.0 × 1031.9 × 104
Ozone depletionkg CFC-11 eq2.9 × 10−41.8 × 10⁻³
Human toxicity, cancerCTUh1.3 × 10−48.4 × 10⁻⁴
Human toxicity, non-cancerCTUh9.0 × 10−45.8 × 10⁻³
Particulate matterkg PM2.5 eq1.38.1
Ionizing radiation (human health effects)kBq U235 eq1801.1 × 103
Photochemical ozone formationkg NMVOC eq9.258
Acidificationmolc H+ eq23150
Terrestrial eutrophicationmolc N eq81510
Freshwater eutrophicationkg P eq1.812
Marine eutrophicationkg N eq7.648
Freshwater ecotoxicityCTUe6.6 × 1034.2 × 104
Land usekg C deficit2.7 × 1041.7 × 105
Water depletionm³ water eq1279
Resource depletion (mineral, fossil, renewable)kg Sb eq0.583.7

