Article

Evaluating Cyclists’ Route Preferences with Respect to Infrastructure

1
German Aerospace Center (DLR), Institute of Transport Research, 12489 Berlin, Germany
2
Department of Geography, Humboldt University of Berlin, 10099 Berlin, Germany
3
Department of Transportation Planning and Engineering, National Technical University of Athens, GR-15773 Athens, Greece
*
Author to whom correspondence should be addressed.
Sustainability 2020, 12(8), 3375; https://doi.org/10.3390/su12083375
Submission received: 23 March 2020 / Revised: 17 April 2020 / Accepted: 19 April 2020 / Published: 21 April 2020
(This article belongs to the Section Sustainable Transportation)

Abstract

:
Providing a sufficiently appropriate route environment is crucial to ensuring fair and safe biking, thus encouraging cycling as a sustainable mode of transport. At the same time, better understanding of cyclists’ preferences regarding the features of their routes and their infrastructure requirements is fundamental to evaluating improvement of the current infrastructure or the development of new infrastructure. The present study has two objectives. The first is to investigate cyclists’ route preferences by means of a choice experiment based on a stated preference survey. Subsequently, the second objective is to compare cyclist preferences in two countries with different cycling characteristics (both in infrastructure as well as cyclists’ behavior). For this purpose, a graphical online stated preferences survey was conducted in Greece and Germany. Within the framework of statistical analyses, multinomial mixed logit discrete choice models were developed that allow us to quantify the trade-offs of interest, while distinguishing between the preferences of different user groups. In addition, user requirements in Greece, as a country with a low cycling share and very little dedicated bike infrastructure, were compared to the requirements in Germany, where cycling is popular and the infrastructure is well developed. The results over the whole sample indicate that subgroups value infrastructure differently according to their specific needs. When looking at country specifics, users from Greece are significantly more willing to accept longer travel times in return for higher-quality facilities. The utility of low speed limits in mixed traffic is also different. In Germany, low speed limits offset the disturbance caused by motorized traffic, but in Greece they do not. Consequently, the results help to asses which types of infrastructure are most sustainable from a user perspective and help to set priorities when the aim is to adapt the road infrastructure efficiently in a stable strategy.

1. Introduction

1.1. Background

Cycling in cities has positive impacts on public health [1,2,3], space requirements, and noise and air pollution [1] in several ways. At the same time, cycling rates are rising in many cities around the world, and a growing number of cities and municipalities are encouraging people to take up cycling. Enhancing the infrastructure is therefore of major importance, as insufficient infrastructure is a significant barrier. Consequently, infrastructure investments are the main focal point of municipal cycle strategies. To meet the demand of cyclists, it is crucial to have a good understanding of cyclists’ route choice behavior. There are many different options possible when looking at bike routing. There are generally different types of infrastructure solutions that are practicable for main roads, as well as regulatory measures for both main and side roads. For example, protected bike lanes along main streets, as a rather new type of infrastructure, compete with cycle paths on the pavement or marked bike lanes [4]. Alternatively, it appears desirable to cycle in mixed traffic along calm roads of different types. Cycle streets, however, did not exist in many countries or were used very rarely [5].
Knowledge of these route preferences with regard to the types of bikes used is essential. Previous research on route choice has increased our understanding, but, recently, the proportion of cyclists and public interest in cycling has increased dramatically. In addition, since there is an increasing division between areas with booming cycle traffic and those where cycling is stagnating at a low level, more knowledge about specific preferences and interactions is needed.
At the same time, we are experiencing several developments and recent dynamics that impact the field of research on this topic. In many urban areas in the global north, cycling as a mode of transport is being revived [6,7,8]. In contrast, there are cities where cycling still does not play a significant role in everyday transport [9,10,11].
Based on the above, the present study had two main objectives. The first was to investigate cyclists’ route preferences by means of a choice experiment based on a stated preference survey. Subsequently, the second objective was to compare cyclist preferences in two countries with different cycling characteristics. Accordingly, the study is conducted in Germany, as a country with relatively high cycle mode shares and a supply of cycle infrastructure, and Greece, a country with little cycle traffic and almost no dedicated bike infrastructure.
The manuscript is structured as follows. First, a brief overview of similar studies is provided. Second, the methodology of designing the experiment, gathering data, and modeling is described. Then, results are presented and discussed, while in the final step, conclusions are drawn.

1.2. Literature Review

This section provides an overview of research investigating cyclists’ route preferences. There are different established approaches for investigating cyclists’ route preferences and the impact of a corresponding road infrastructure.
  • Cross-sectional studies use geodata and mobility data in different reference areas to analyze interrelations between cycling levels and properties of the road network [12,13].
  • In stated preference studies, participants are asked in hypothetical choice situations which type of infrastructure they prefer. Cyclists and non-cyclists may be surveyed, and the results are differentiated between socio-demographic factors [11,14,15].
  • Revealed preference studies gather data on actual roads taken by cyclists via GPS, e.g., from bike sharing or apps. Subsequently, conclusions are drawn regarding route choice behavior based on estimated alternatives [16,17,18,19].
  • Interventional studies designed to evaluate measures use case studies to investigate changes in cycling rates before and after infrastructural interventions [20,21,22,23].
  • Meta-analysis or reviews on interrelations between transport and urban form summarize findings from previous studies [24,25,26]. In addition, planning advice is offered based on a literature review [27].
Regarding the methodological approach of the present study, the following literature review focuses on stated preference studies. These are a well-established method when researching individual preferences for defined alternatives, and in transport research, they have been applied in various settings in general [28,29] and in the case of bike infrastructure preferences in particular [30]. In recent years, there has been a growing body of empirical research on cyclists’ preferences using stated preference methods, as summarized below.
In this context, most studies focus on road design and bike infrastructures. A study presented by Clark et al. [11] investigates various types of bike infrastructure, number of car lanes, and car parking. Test persons are asked specifically about convenience, safety, and willingness to try the corresponding route. Vedel et al. included road characteristics and surroundings, the specific types of bike infrastructure, and operational measures of stops and bicycle crowding in Copenhagen, Denmark [14]. Winters and Teschke conducted a similar study by varying several parameters of the road, and focused on differences regarding potential cyclists in Vancouver, Canada [31]. A North-America-wide survey investigated various road characteristics with respect to the specific type of bike infrastructure, properties of the road, such as roadway class and parking as well as number, and types of crossings on the route [32]. In a study by Sener et al. [33], the influence of parking, type and width of facility, and number and type of crossings, as well as speed limits and traffic volume, are evaluated among cyclists in Texas. In a study conducted by Abraham et al. [34] in Calgary, a long list of attributes was included without using visualizations. Travel times on different route types were presented to the respondents to add up to the total travel time. The authors also included facilities such as changing rooms at the destination. A similar approach was used in Edmonton, Canada, including destination facilities [35].
Other studies focus on infrastructures as well, but do not take different road types or categories into account. A study conducted by Poorfakhraei and Rowangould [36] in Albuquerque, New Mexico evaluates the willingness to pay for improvements regarding the implementation of cycle tracks, bike lanes, or street lighting. Videos of riding bikes on different types of infrastructures were shown to the probands. The research of Tilahun et al. [37] is methodologically similar; it showed short video clips to test persons and used an adaptive stated preference survey in Minnesota. The authors investigated the impact of two types of infrastructure along streets, one off-street solution and parking. Mertens at al. conducted a study in Belgium with several road characteristics regarding design and condition as well as greenery and operational measures, such as speed limits and traffic density [15]. Caulfield et al. varied only four attributes (plus travel time) in a study in Dublin, Ireland [38]. The authors investigated the type of infrastructure, number of crossings and traffic speed, and volume of cycle traffic.
Further studies increase the scope of specific research questions. The direct surroundings of public transport stations in Tianjin, China are evaluated by Liu et al. [39] in order to investigate which attributes are relevant for pedestrians and cyclists. Another study, based in Berlin, Germany, investigates the influence of different levels of street greening on cyclists’ route choices [40]. A study conducted in Santiago de Chile investigates reasons for bike commuters to ride on the sidewalk [41]. The authors consider the existence and width of a bike lane as well as operational measures, such as the presence of pedestrians and buses, characteristics of the sidewalk, and surrounding land use.
Content-related prior research found mixed results. Here, only Stinson and Bhat [32] see residential roads as a first choice in comparison to arterial roads with separated facilities, while Sener et al. [33] even see a negative impact for bike lanes in Texas, and argue this with the fact of being boxed in. However, in the majority of studies, the conclusion is a preference for separated facilities [14,34,35]. Here, the existence of a separated facility is referred to as more important than the specific type of facility or other characteristics of the road, such as speed limits or traffic density [15]. When differentiating the type of infrastructure, research results in a preference for bike lanes over cycle tracks [37,42] or cycle tracks over bike lanes [36]. When off-street cycle ways are included, some authors conclude that these routes are preferred over separated facilities along main streets [31], while others conclude the opposite [38] or find almost no difference between high-quality infrastructure and off-street paths [11]. Prior research agrees that a smooth surface is important, but several other factors of the route outweigh the impact [15,31,32]. The negative effect of on-street parking is verified by [33,37].
As is obvious, studies conclude that there is a willingness to avoid disturbances caused by nearby motorized traffic. Cyclists state that they mainly prefer either a separated cycling infrastructure or, less significantly, calm side roads in mixed traffic. The parameters considered vary. The main variable used for differentiating between the types of dedicated cycle infrastructures is accompanied in most cases by road type and surface quality. These are complemented by other specific variables. Except for Stinson and Bhat [32], all cited studies research an isolated local area under investigation. Differences between different regions or spatial locations are not evaluated. Furthermore, most studies are conducted in cities or regions with significant cycle mode shares.

2. Materials and Methods

Individual route choice behavior is influenced by several parameters of the route environment. At the same time, preferences for certain route characteristics differ strongly between individuals with respect to socio-demographics or bike types used. For this reason, a discrete choice experiment was used as the survey method, which allows differentiation between various factors. In this method, individual route characteristics were composed to create complete route alternatives. One major advantage of this stated preference approach is that cyclists as well as non-cyclists may be surveyed. Hypothetical and non-existent infrastructures can also be evaluated. The latter is particularly important when making a comparison between countries with a different infrastructure status.

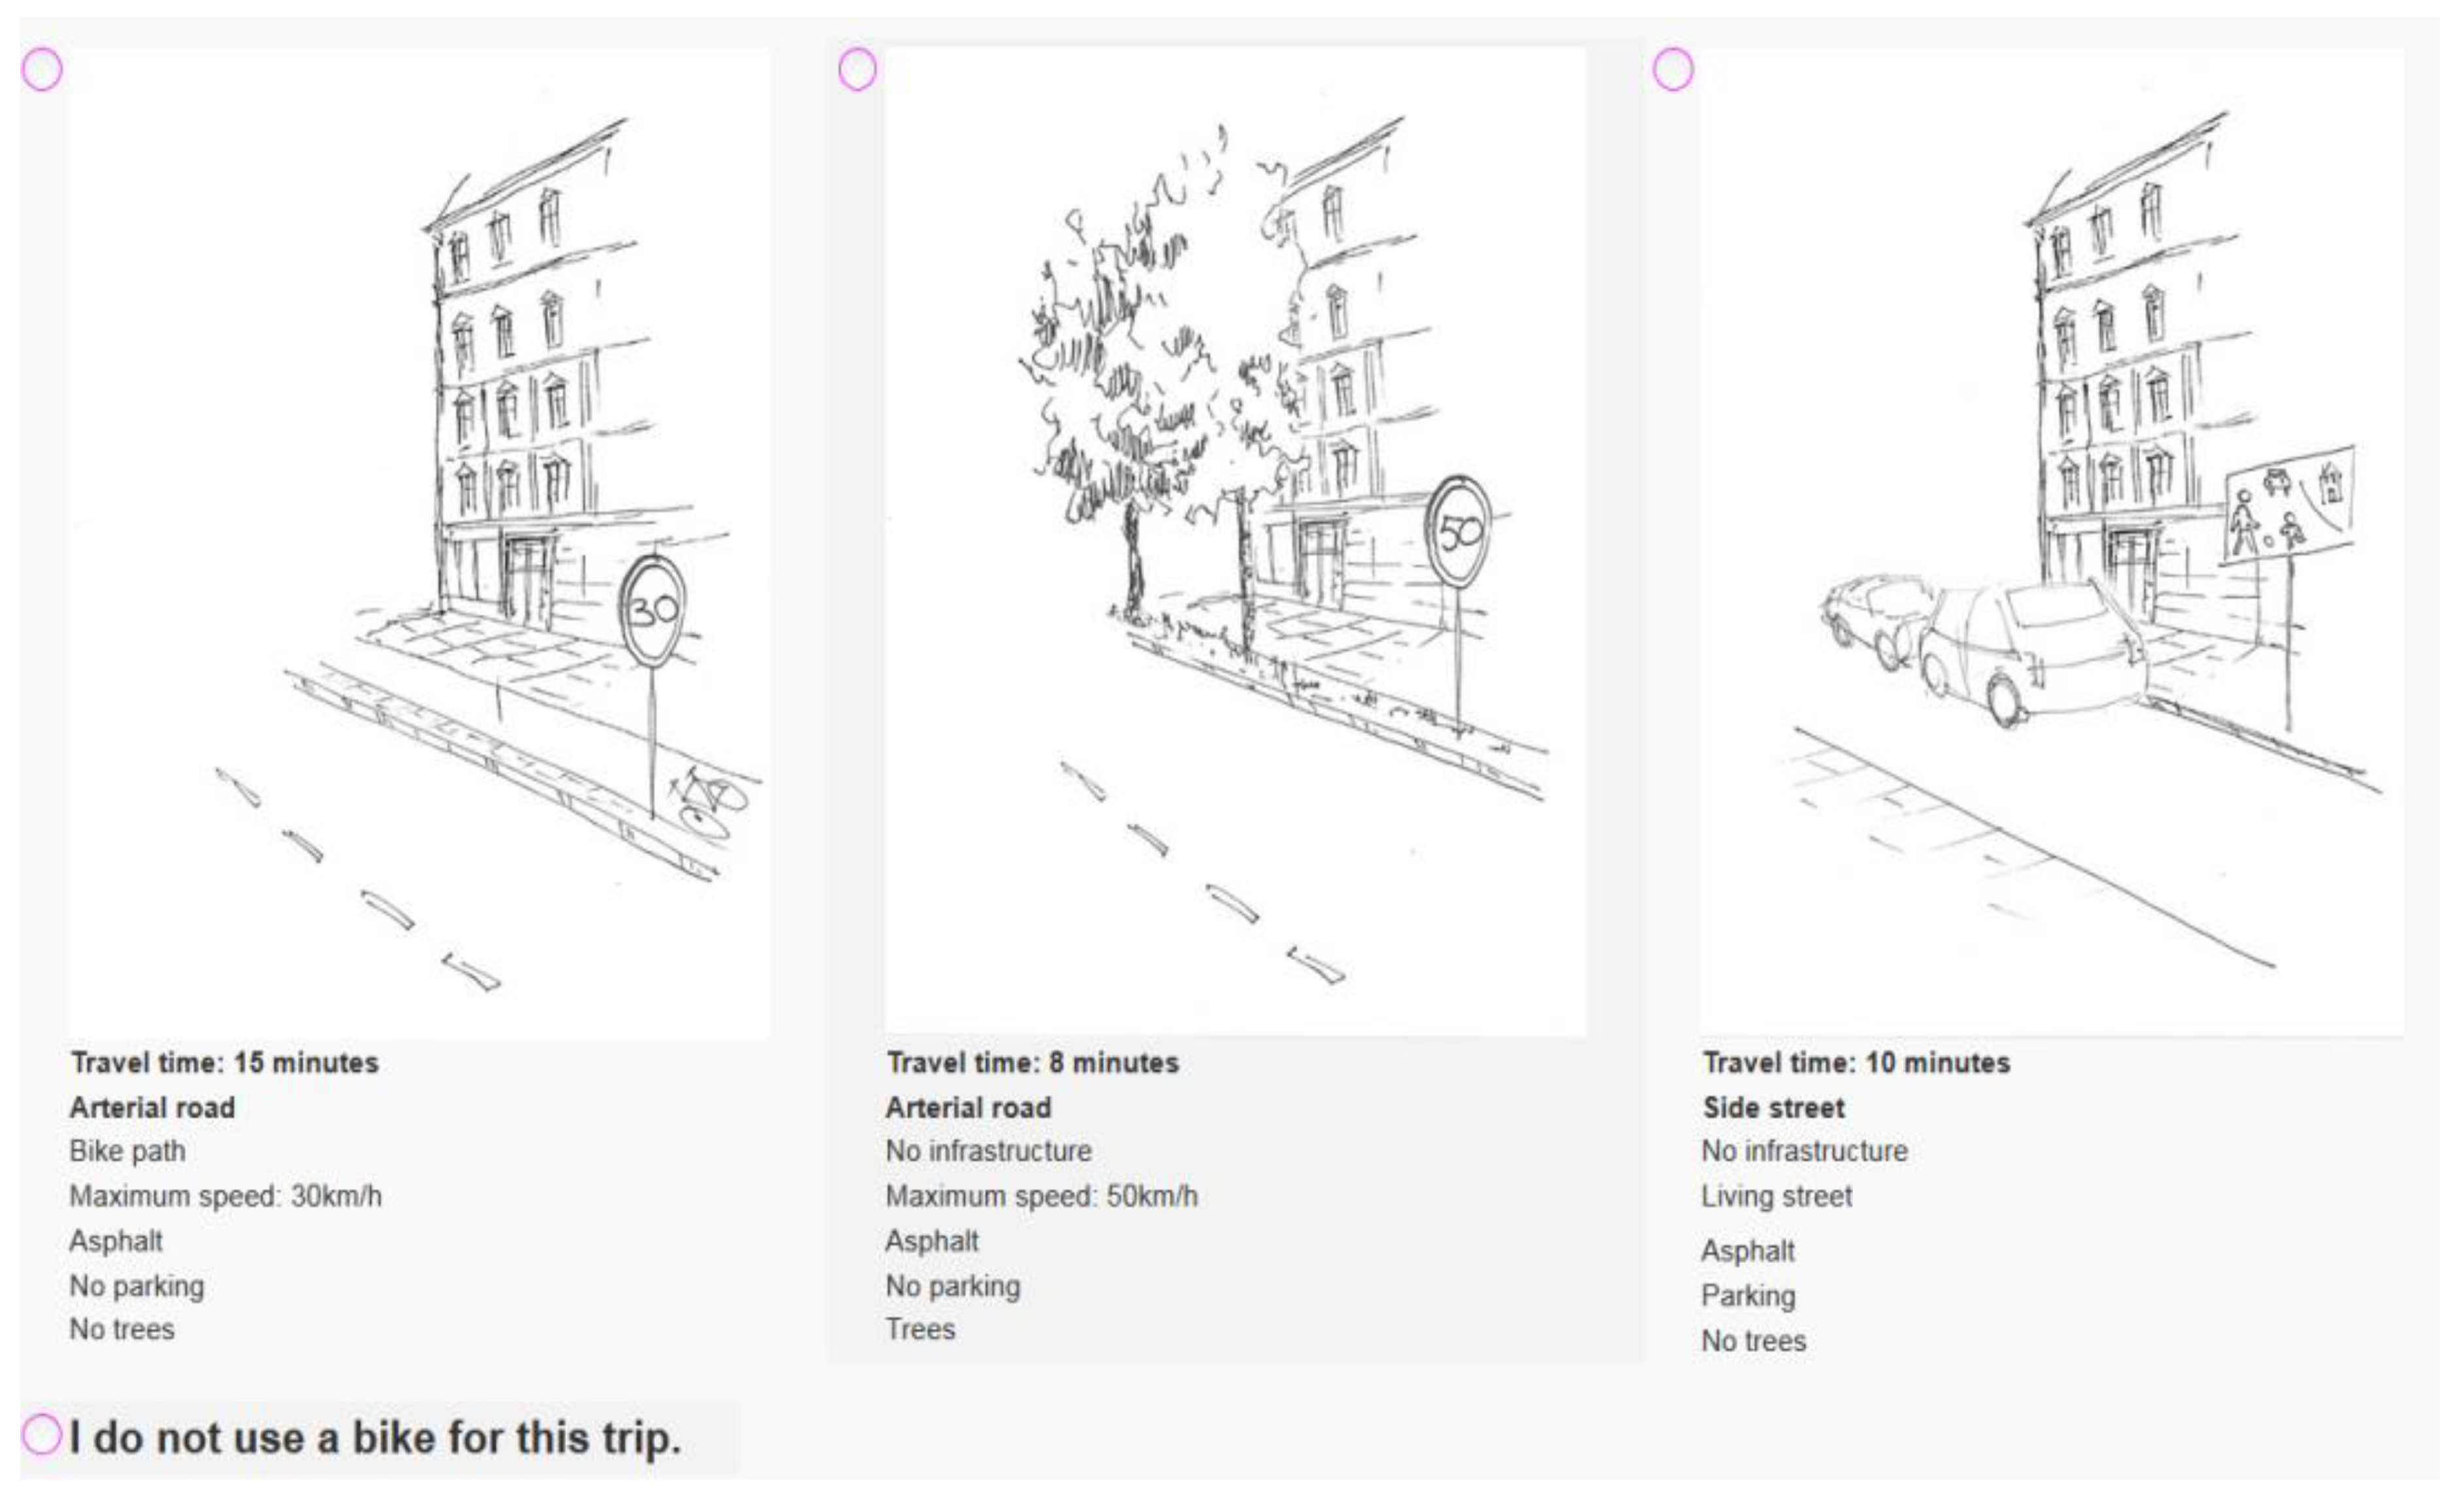
2.1. Designing the Experiment

The questionnaire consisted of three parts. First, the method and objective were briefly described. Second, the actual discrete choice experiment was included. Third, additional questions were asked regarding the users’ socio-demographics, mobility behavior, and spatial allocation.
Before proceeding to the core of the questionnaire, a brief description of the key targets of the survey was presented in the first part. The aim was to inform the participant about the scientific scope of the research and the expected results that relate to the development of appropriate municipal strategies on cycling. This introduction is provided in Appendix B. In addition, the following text was displayed during the whole discrete choice experiment (DCE) part of the poll, as guidance for the choice experiment: On a day in May with good weather conditions, you would like to visit a friend. There are several alternative routes for this trip. Which route do you choose? All answers are your personal preference! There are no right or wrong answers.
In the second part of the poll, the choice experiment was conducted. Before the experiment, we only asked whether the proband would be riding the bike on the road with children and which type of bike he or she would be using when choosing the following routes. This is to make sure the participants were aware of this difference from the beginning. The design of the actual experiment was extremely important. It included selecting attributes and levels, composing them to create complete alternatives, and combining the alternatives in choice sets. The attributes and levels were therefore defined in a workshop with experts in cycling science from two universities, a cycling advocacy group, a planning office for cycling strategies, non-university research institutions, and the federal environment agency. Based on the selection, a draft design that considered the expected interactions between the attributes was developed by hand. This design was tested and discussed in a focus group. Subsequently, a balanced design was created by hand. This pre-poll was implemented as an online survey using the software lamapoll [43]. Here, some combinations were omitted in order to obtain a realistic picture. In side streets, for example, there was no cycle infrastructure. Using this design, a pretest was carried out with 41 participants. To enhance the design efficiency, the data gathered in the pretest were used to develop a Bayesian efficient design using Ngene [44,45]. In the final design, the duration of the trip as well as six properties of the road and its surroundings were differentiated. Each attribute had two to five possible levels (see Table 1). An experiment with eight choice situations, each consisting of three alternatives, was chosen. In order to allow for larger variations within the data collection, three blocks consisting of eight situations each were created. This resulted in a total of 24 choice situations, eight of which were shown to each proband. A no-choice option was also implemented for each choice situation. Each participant was randomly assigned to one of three blocks.
The choice situations were described in a tabular form and visualized with drawings (Figure 1). In addition, explanations were displayed for the infrastructure types “protected bike lane”, “cycle street”, and “living street” when hovering over the text. Earlier research proved that images in stated preference surveys are perceived subjectively [46]. As a result, we did not have any control over features that were not explicitly included in the design, but are perceived by the test person [46]; plain black and white drawings were chosen to display the alternatives. On a basic drawing with the same buildings and sidewalk, additional layers with drawings of streets of different sizes, different types of cycle infrastructure, signs indicating different regulations, uneven surfaces, trees, and parked cars were turned on and off to create the illustrations for the 72 different alternatives used.
In the third part of the questionnaire, we collected additional information on the participants. These included mobility behavior (frequency of bicycle usage), socio-demographic information (levels of formal education, occupation, gender self-association, and age), and spatial information (country and postcode of permanent residence).

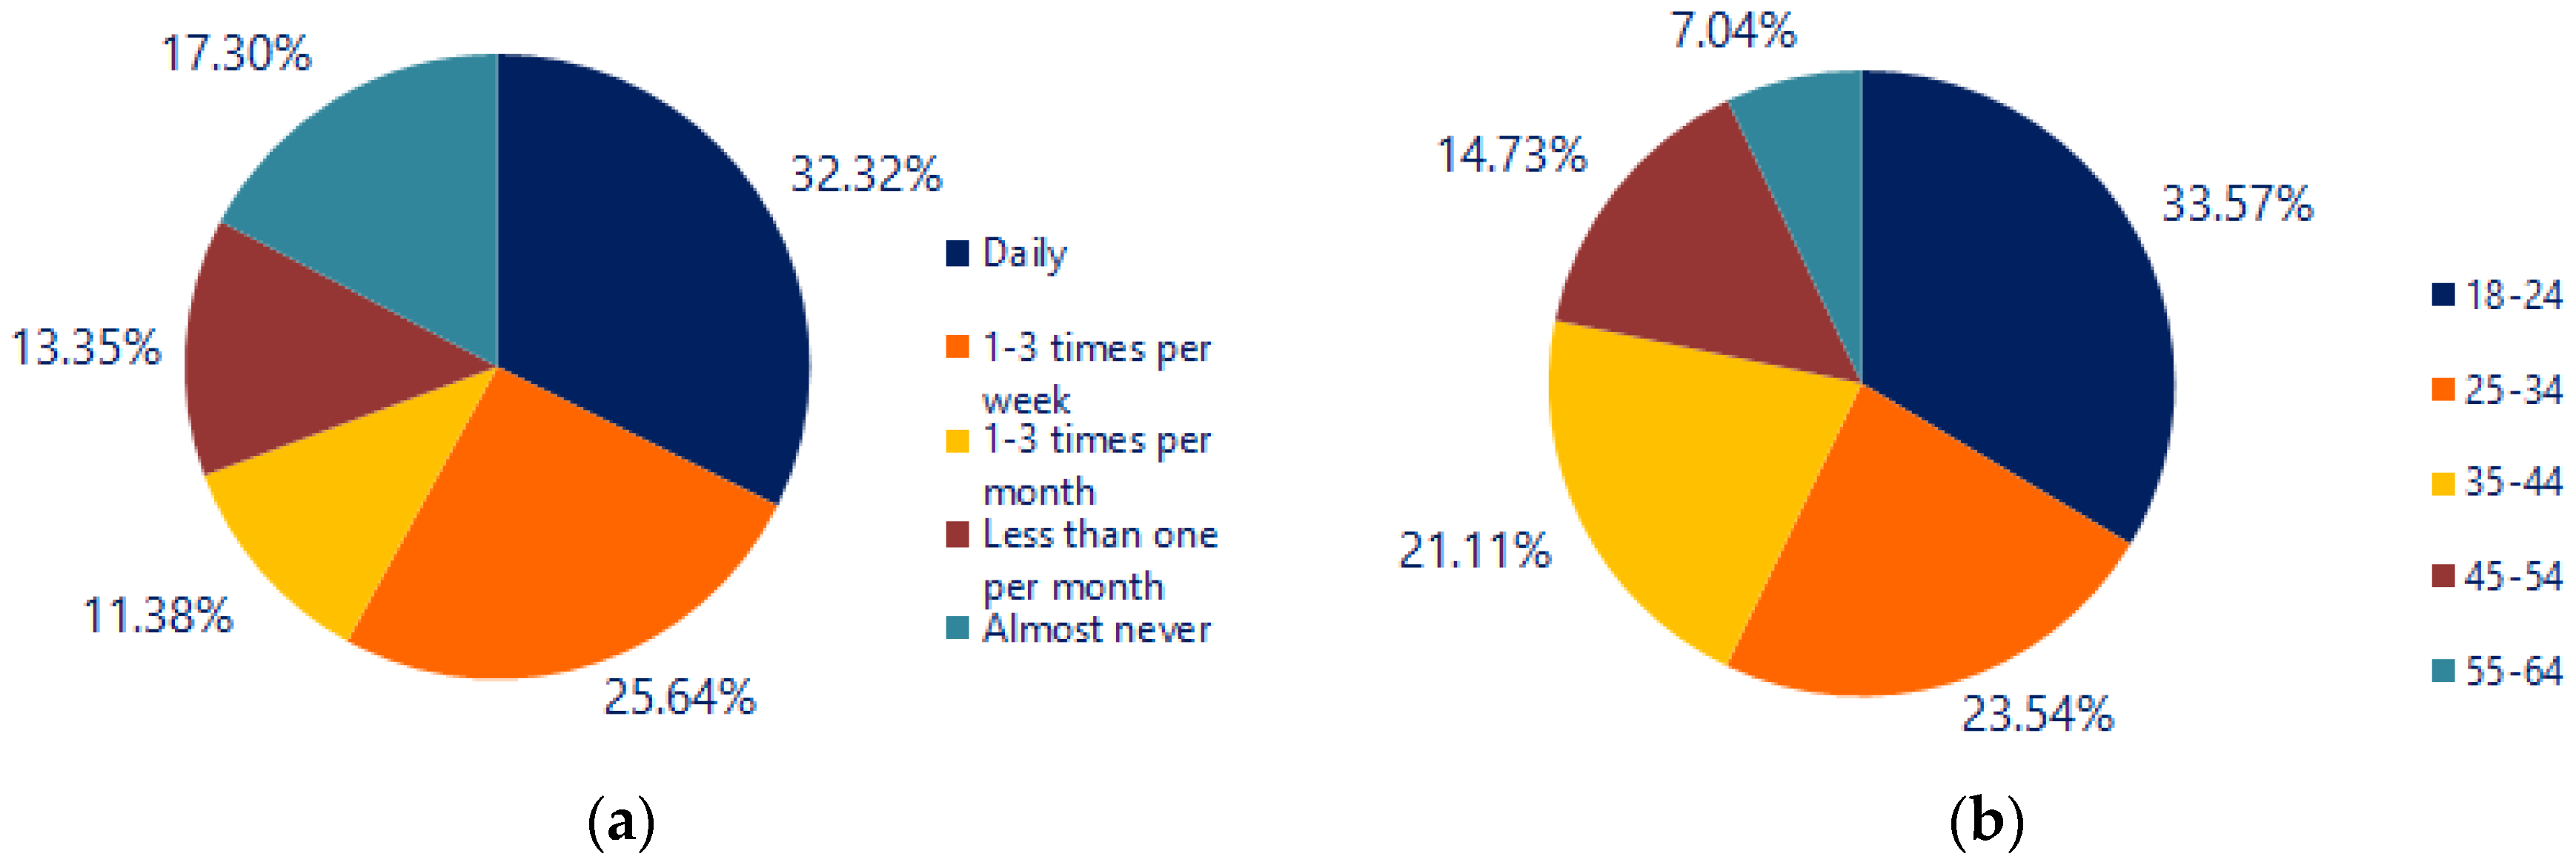
2.2. Recruitment, Sample, and Subsampling

The data were collected in autumn 2018 (Germany) and spring 2019 (Greece). Participants were recruited using internet, social media (mainly Twitter), cycling associations, universities, the German national cycle portal (nationalerradverkehrsplan.de), and Ecocity, a non-profit environmental organization in Greece. Thus, the sample is self-selective; however, several sample characteristics were evaluated during the survey in order to counterbalance the sample in several characteristics, as presented below.
Participants from other countries and those who filled in the poll with unrealistic speed were removed from the dataset. All incomplete returns were also deleted. After these steps, the dataset consisted of 4775 individuals. With eight choice situations per individual, this results in 38,200 valid observations. Thus, 4463 individuals with 35,704 observations were found in the German sample and 312 individuals with 2496 observations in the Greek sample.
Due to the sampling method, the sample shows some bias in terms of socio-demographics. These distortions appear differently in the two countries under investigation. As is obvious, the German sample is also much larger than its Greek counterpart. We therefore draw a subsample from the German sample that approximates the distribution of socio-demographic variables in the Greek sample. Consequently, we use iterative post-stratification. By doing so, we match the marginal distributions of the German sample to the margins observed in the Greek sample. We use the distributions of the attributes of gender, age, and children. The latter specifies whether or not the participants use the bike with children. As a result, we obtain a German subsample of 350 observations, which approximates the corresponding distribution in the Greek sample. The total size of the dataset used is 662 individuals with 5296 observations. Participants’ characteristics indicate that there is a counterbalanced sample in terms of gender (60% males and 40% females), while with regard to age group, almost half of the participants belong to the 25–44 age groups (44%), with younger participants aged up to 24 years old accounting for 34% and older cyclists for 23% of the sample (Figure 2). Another interesting socio-demographic characteristic relates to the fact that 59% of the participants ride with their child. Finally, a similar counterbalance is achieved regarding how often participants ride their bicycle, as all options have similar percentages (highest percentage of daily cyclists).

2.3. Area under Investigation

In Germany, the cycle mode share grew in metropolitan areas from 9% in 2002 to 15% of all trips in 2017, while it stagnated in rural areas [47]. The national cycle plan has formed the basis of cycle policies in Germany since 2002 [48]. In recent decades, many cities and regions have increasingly invested in cycling infrastructure and image campaigns to increase the cycle mode share [7]. Most recently, starting with Berlin, bottom-up initiatives have been emerging in more and more cities. Initiated by these new actors, legally binding acts now specify high quality standards and wide coverage of the cycle infrastructure for the near future [49].
In Greece, cities are a hostile environment for cycling. Some of the most serious problems are narrow roads, very poor bike infrastructure, and lack of public transport. As a result, in spite of low-volume traffic flows, roads are congested and lose a lot of their capacity due to illegal parking. In many provincial streets, there are no pavements or they are exceptionally narrow, and general conditions are unsafe and discourage pedestrians. Today, mainly through programs funded by the Ministry of Transport and Ministry of the Interior, 27 Greek cities are equipped with cycling infrastructure, and there are also plans for several more [50]. In addition, the implementation of the Sustainable Urban Mobility Plans in 160 Greek cities is another tool for improving cycling in Greece in the current decade.
Figure 3 provides an impression of the different conditions in the two countries under observation. The network of cycle tracks in the two cities, Munich in Germany and Athens in Greece, is displayed on a scale of 1:250,000. As can be seen, the city of Munich provides a dense network of cycle tracks, while in Athens, only a few isolated cycle tracks are available.

2.4. Model

The theoretical basis of choice experiments was provided with the random utility theory [51]. Utility-maximizing behavior by the participants is assumed. The theory claims that people act according to their preferences. The inconsistency of choices that is often observed to some extent is explained by a random parameter. On this basis, the data are analyzed by applying mixed logit models using the software Biogeme [52]. We use mixed logit over multinomial logit in order to deal with the panel effect, as it allows the coefficient to vary for different decision-makers. Hence, these models take into account that the eight choices made by each subject are correlated, but heterogeneity exists between the subjects, and they are highly flexible [53]. The choice probability of the mixed logit, as shown in Equation (1), is defined as an integral of logit probabilities over a density of parameters:
P n i = ( e β x n i j e β x n j ) f ( β ) d β
Accordingly, the probability in the mixed logit is the weighted average (mixed function) of the logit provided by the density (mixing distribution). We also include normal error components for each alternative. The method allows the quantification of the benefit of an alternative compared to the defined reference. As reference, a main road without cycle infrastructure and without trees, with a maximum speed of 50 km/h and on-street parking, was chosen so that any change in the route characteristics represents an improvement for cyclists. Methods of discrete choice modeling were used to estimate utility functions based on the sum of the individual responses [52]. We aimed to compare three models: Model 0 evaluates the route attributes used in the DCE (see Table 1), model 1 includes socio-demographic interactions (see Section 2.2), and model 2 develops interactions regarding the two parts of the area under investigation by adding dummies (see Section 2.3).
For model 0, we estimated the extent to which the specific route characteristics influenced the decision for a route using a mixed logit model.
To estimate systematic differences between groups of participants, socio-demographic interactions are implemented in model 1. Here, we proceeded iteratively. First, we explored a large number of possible interactions regarding socio-demographic attributes and combinations of these attributes in the whole sample. For this, we used multinomial logit models due to performance issues. Second, we tested all interactions that were significant in the whole sample, consisting of the two national samples in the nations’ samples, separately. Third, we included only those interactions that were significant in all three cases (whole sample and both separate nations’ samples). In this case, these are the interaction terms for surface*rarely, which indicates the interaction of a smooth surface with a stated usual frequency of using the bike less than once per week. Fourth, with this specification, we estimate the final model using a mixed logit approach; slow_kids indicates the interaction of the living street and cycle street regulations (slow) with stating cycling with children.
To finally analyze country specifics, in model 2, we estimate systematic heterogeneity between Greece and Germany by testing country dummies. Similarly to model 1, in a first step, we tested many relevant interactions. In a second step, we included only significant interactions. In model 2, these are the interaction of the living street and cycle street regulations (slow) with the country dummy for Greece, and the interaction of the time parameter with the dummy for Greece. For this final model, we used the mixed logit approach.
The utility (U) for a route for an individual (n) as an alternative (j) in a choice situation is specified as the sum of the values of the coefficients (β) and the random error term for the agent effect (EC):
Unj = ASCj + (β_timen + β_time_sn × Triang) × timenj + β_slow_greecen × slow_greecenj + β_time_greecen × time_greecenj + β_surface_rarelyn × surface_rarelynj + β_kids_slown × kids_slownj + β_sidestreetn × sidestreetnj + β_pathn × pathnj + β_protectedn × protectednj + β_lanen × lanenj + β_no_ISn × no_ISnj + β_livingn × livingnj + β_cyclen × cyclenj + β_v30n × n30nj + β_v50n × v50nj + β_surfacen × surfacenj + β_parkingn × parkingnj + β_treesn × treesnj + ECnj
The description of the coefficients is included in Appendix A.
Equation (2) is presented using the example of model 2. In model 1 and model 0, the interaction parts are omitted with regard to socio-demographics and socio-demographics with country specifics, respectively. All mixed logit models used for the final estimations were estimated using 700 draws. Thus, the time parameter was distributed triangularly in order to obviate positive values in the distribution. We performed chi-square-based likelihood ratio tests to compare the models.

3. Results

The estimation results are presented in Table 2. Model 0 takes only route characteristics into account, while model 1 also includes socio-demographic interactions, and model 2 extends model 1 by adding country dummies.
The results indicate that all parameters show the expected sign and plausible values. This means that all improvements in road characteristics compared to the reference are assigned higher utilities for the user, while travel time has a negative utility. For all route attributes under consideration, a significant impact on route choice is demonstrated. In addition, the alternative specific constants (ASC) show similar values for the three alternatives in all three models. This is most plausible, as all proposed route alternatives vary randomly over the alternatives. Regarding the error term, the results show insignificance for alternatives one to three. Only the no-choice option (4) differs significantly. This can be explained by some individuals choosing not to cycle at all several times, while the majority almost always chose a defined alternative.
The route attributes are organized along the topics of dedicated bike infrastructure (bike lane, bike path, and protected bike lane), regulation (living street, cycle street, 30 km/h), other factors of the road (side street, on-street parking, surface, and trees), and travel time. In addition, model 1 includes socio-demographic interactions (slow_kids and smooth_surface_rarely). Model 2 includes both socio-demographic interactions and country dummies (time_greece and slow_greece). Regarding dedicated bike infrastructure, values for the different types vary substantially. The values for the three types of dedicated bike infrastructure show that cyclists value the alternatives very differently. The highest utility over all parameters is presented for bike lanes that are protected from motorized transport by bollards. This coefficient shows very high values of more than 2.5. A physical bike path (1.9) and a painted bike lane (1.39) show high but clearly lower utilities. Regarding different types of regulation, it is seen that a cycle street, as a street type with priorities for cyclists, shows a very high utility (1.88). Apart from dedicated infrastructure, a cycle street is the most popular attribute. With a value of 0.85, a living street has a much lower utility. The utility for a reduced speed limit of 30 km/h (0.297) is very low by comparison. Regarding other factors of the road, a smooth surface shows a high utility (1.26), while a side street instead of a main street (0.643), absence of on-street parking (0.539), and trees along the street (0.288) are less important for route choice. With a value of 0.14, a longer travel time has a clear disutility.
The socio-demographic interactions implemented in model 1 show two fundamental trends. Firstly, low speed limits (living street and cycle street) are much more beneficial for those travelling with children. The interaction term has a value of 0.288, which is added onto the values for the living street and cycle street in model 1. Secondly, the utility of a smooth surface is lower for people stating that they cycle only rarely (less than once per week). The term of −0.739 indicates that a smooth surface means a much lower utility for people who state that they cycle only rarely.
In model 2, the country specifics are evaluated. The results indicate that higher travel time is linked to significantly less disutility in Greece than in Germany. The interaction term of time_greece has a value of 0.673. Compared to the global value of the time parameter in model 2 (−0.171), this indicates a major difference between the two countries under investigation. Furthermore, in the Greek sample, the utility of cycling in slow mixed traffic (living street and cycle street) is much lower than in Germany (−1.13).
Values for both rho-square and log likelihood increase in the more complex models 1 and 2, while the likelihood ratio tests are positive at the 95% level, proving the increased goodness of fit of both models.

4. Discussion

The present study had two main objectives. The first was to investigate cyclists’ route preferences through a choice experiment based on a stated preference survey. Subsequently, the second objective was to compare cyclist preferences in two countries with different cycling characteristics (both in infrastructure as well as cyclists’ behavior), Greece and Germany.
Regarding the first objective, the results indicate that dedicated bike infrastructure along main streets as well as good surface quality are highly beneficial to road users. Thus, the utility increases with the level of separation. Protected bike lanes are most desirable. Here, the current research is in line with the recent results of Clark et al. [11]. In mixed traffic, cycle streets that give priority to cyclists were perceived as much more beneficial than living streets, which are defined by a very low speed limit. The utilities for using a side street instead of a main street, no parked cars, and a lower speed limit (30 km/h) are relatively low. Interestingly, in this study, a reduced speed limit of 30 km/h is less beneficial to cyclists than the absence of parked cars. When taking the state of research into account, it is assumed that the utility of dedicated infrastructure is lower in real life. This means that cyclists tend to prefer separated infrastructure, but do use calm streets without facilities more often when comparing the results to revealed preference surveys [25]. Finally, significant positive utility from street greening can be measured, even though it is comparatively very low, a statement that is supported by Nawrath et al. [40]. In the present research, the utility for trees along the street is almost the same as that for a speed limit reduced to 30 km/h.
Furthermore, the data show several fundamental trends when evaluating interactions. Utilities of low speed limits in mixed traffic are much higher when cycling with children. This is very plausible, as the need for safety is higher when on the road with children [54]. In addition, when cycling with slow kids, very low speed limits certainly do not slow cyclists any further, as they are already cycling slowly anyway. Interestingly, these interrelations are not seen to a large extent for dedicated bike infrastructure. Another insight relates to the importance of surface quality. This is of much less utility for respondents who state that they cycle on an irregular basis. This can be verified by the impression that cycling on uncomfortable cobblestones may be acceptable for a sporadic trip, but not for regular commuting. Interestingly, unlike earlier research, we did not find any consistent impact of gender [30].
A unique contribution of the present research refers to the comparison of two countries, Germany and Greece. As described above, cycling mode shares as well as the amount and quality of the infrastructure are very different in Germany and Greece. To analyze whether these differences are interrelated with different route choice behaviors, several interactions with country dummies were tested. Model 2 indicated two significant interactions. Firstly, it can clearly be seen that the utility for low speed limits is much less in Greece. This shows that for Greek respondents, low speed limits reduce the disturbances by motorized traffic to a much smaller extent. It is assumed that this is connected to the perception of the safety-in-numbers effect, which means that accidents increase less than proportionally to the traffic volume of cyclists [55]. With fewer cyclists present in traffic, motorists tend to pay less attention. This interrelation can also be explained by less willingness to obey traffic rules generally in Greece [56]. A corresponding interrelation regarding dedicated bike infrastructure cannot be found. Apart from that, the time parameter is significantly less negative in the Greek sample. This means that travel time is perceived less negatively here. Consequently, cyclists would accept longer detours in order to account for better route characteristics. Both country-specific interaction terms, the one for slow speed limits and the one for travel time, show high magnitudes. This shows that the differences between the two countries under observation are great.
Considering some limitations of the present study, the research is based on a self-selective distorted sample in two countries. Thus, a varying amount of social media visibility was necessary to obtain returns. This implies a bias in the data. The parent population for this research is not the whole population of the country, but people who are at least interested in cycling as a mode of transport. Hence, a representative sampling would not be beneficial. As we draw a weighted subsample for the German part and test for individual interactions, including controlling thereof, distortions between the two countries under observation are assessed as unproblematic. Furthermore, most studies cited above do not use representative samples [14,15,32,33,34,35,36,37,38,39,40,41].
In the choice experiment, all characteristics except for the travel time were represented graphically. This may lead to this component being considered differently, as well as to a potential under-estimation of the negative utility implied by the time parameter. In addition, there are levels of attributes that are not currently common in the observation area. These particularly account for protected bike lanes and cycle streets. Some users may be inexperienced regarding these infrastructures. On the other hand, researching non-existing alternatives and hypothetical decisions is a major strength of the stated preference approach [46].
Finally, as a proposal for further research, a predictive platform market can be used instead of a questionnaire survey. On the predictive markets, platform users try to predict the probability of certain events. This is the result of asking participants not only to perceive reality, but also to estimate the probability of the event appearance on the market. The advantage of predictive markets is the so-called wisdom of the crowd, which leads to the use of diversified knowledge [57].

5. Conclusions

The present study uses a questionnaire survey (discrete choice experiment) in two countries with different cyclists’ characteristics, both in terms of infrastructure and significance of the bike as mode of transport in everyday traffic. Subsequently, three models were implemented: One considering only route characteristics, a second also including socio-demographic interactions, and a third adding the country dummies. Overall, the proposed methodological approach improves knowledge and provides new insights regarding the cyclist’s preferences in route choice.
The main findings of the research are presented below:
  • Dedicated bike infrastructure, referring especially to protected bike lanes, indicates stable high utilities across subgroups and the different countries, highlighting that providing dedicated space for bicycles is effective in creating places that appeal to cyclists.
  • Route preferences do not generally differ between Greece, as a country with low cycling shares and a less developed bike infrastructure, and Germany, as a country with much cycle traffic and a comparatively well-developed infrastructure. Moreover, differences in subgroups regarding socio-demographics or mobility behavior are limited. Both statements indicate that the selection of the route for a cyclist is not, in general, affected by the regional characteristics of riders, but is based on independent characteristics of the route.
  • On the other hand, for particular characteristics, preferences between the countries appear quite differently. These are in line with the perception of different mobility cultures in the investigation areas. For instance, low speed limits in mixed traffic are much less beneficial in Greece than they are in Germany, highlighting the different users’ behaviors that exist in the countries examined.
Based on the key findings above and the overall research results, the following practical recommendations, which are crucial for both stakeholders and policy makers, may be extracted:
  • Implementing dedicated bike infrastructure along main streets appears to be a stable strategy, regardless of individual and local characteristics. From the user’s perspective, the separated bike infrastructure, which brings order and predictability to streets, is preferred across all subdivisions. In this way, expanding a network of preferably segregated infrastructure appears to meet stable demand, always considering that this requires smart investment and careful planning.
  • With regard to the alternative strategy—integrating cyclists into mixed traffic by lowering speed limits—no general statements can be made. Here, preferences appear more diverse regarding both socio-demographic characteristics and regional particularities. The results show that requirements for several subgroups can be met by such a strategy, but it is less of a one-size-fits-all approach. Consequently, good knowledge of local particularities is crucial to ensuring that such a strategy will be widely accepted and, in particular, supports the needs of vulnerable groups.

Author Contributions

M.H.: Conceptualization, data curation, formal analysis, methodology, visualization, writing—original draft, writing—review and editing; P.P.: Data curation, funding acquisition, investigation, writing—review and editing. All authors have read and agreed to the published version of the manuscript.

Funding

The research was funded by the German Federal Ministry of Transport and Digital Infrastructure using resources from the National Cycling Plan 2020 (NRVP) and the German Federal Ministry of Environment, Nature Conservation, and Nuclear Safety (BMU) using resources from the European Climate Initiative (EUKI).

Acknowledgments

The research mainly took place within the framework of the EUKI project CyclUrban. The authors wish to acknowledge the project partners. In addition, the authors would like to thank Daniel Krajzewicz for his feedback on the manuscript.

Conflicts of Interest

The authors declare no conflict of interest.

Appendix A. Survey Parameters

AttributeLevelDescriptionCoefficient
Street typeArterial roadWide road with two lanes for motorized traffic in each direction. Road has a center marker.-
Side streetNarrow street without markings for motorized traffic.β_sidestreet
Cycle infrastructureNo cycle infrastructureThere is no dedicated cycle infrastructure. Bikes and cars share use the same roadway in mixed traffic.β_no_IS
Bike laneMarked lane or cyclists on street level.β_lane
Cycle pathPath on the sidewalk level.β_path
Protected bike laneProtected bike lanes are located on street level. They are separated from motorized vehicles by bollards.β_protected
RegulationMaximum speed: 50 km/hThe maximum permitted speed for motorized traffic is 50 km/h. The right of way is regulated by traffic signs.β_v50
Maximum speed: 30 km/hThe maximum permitted speed for motorized traffic is 30 km/h. In arterial roads: The right of way is regulated by traffic signs. In side streets: Right over left, as is standard.β_v30
Cycle streetCycle streets give priority to cyclists. Access for residents in motorized vehicles is allowed, with a speed of up to 30 km/h. Cyclists must not be endangered or hindered. If necessary, vehicles have to slow down further. Cycling side by side is allowed.β_cycle
Living streetMaximum speed is walking pace. Pedestrians and playing children may use the full width of the road. Pedestrians must not be endangered or hindered. If necessary, vehicles have to wait. Pedestrians must avoid unnecessarily obstructing vehicle traffic.β_living
SurfaceCobblestonesThe surface is bumpy and consists of cobblestones.-
AsphaltThe surface is smooth and consists of asphalt.β_surface
ParkingNo on-street parkingNo cars are parked.β_parking
On-street parkingCars are parked at the side on street level.-
TreesNo treesThere are no trees along the street.-
TreesTrees line the street at sidewalk level.β_trees
Travel time8 | 10 | 12 | 15The travel time for the alternative in minutes.β_time
Interaction terms
Cycle street or living streetslow
Cycling on the road with kidskids
Less than once per weekrarely
Country dummy for Greecegreece

Appendix B. Introduction and Survey Instructions

Sustainability 12 03375 i001Sustainability 12 03375 i002

Appendix C. Model Estimation Results

model 0 model 1 model 2
ParameterValuet-testStd errValuet-testStd errValuet-testStd err
ASC_14.048.490.4763.718.230.4513.488.090.431
ASC_34.168.710.4783.828.470.4523.68.330.432
ASC_23.978.340.4773.648.080.4513.427.920.431
β_lane1.3914.40.09661.3914.480.09621.3714.320.0954
β_path1.918.70.1021.9118.880.1011.8918.810.1
β_protected2.5724.890.1032.5825.070.1032.5625.050.102
β_sidestreet0.6436.320.1020.6216.120.1020.6015.940.101
β_time−0.14−12.780.0109−0.141−12.950.0109−0.171−13.330.0129
β_time_s0.2834.280.06620.2543.710.06840.1962.620.0747
SIGMA_1−0.0582−0.510.114−0.0426−0.350.121−0.0299−0.180.164
SIGMA_2−0.00891−0.120.0757−0.00896−0.120.0742−0.00676−0.090.073
SIGMA_3−0.0044−0.050.0969−0.00225−0.020.0999−0.00893−0.080.106
SIGMA_42.49.250.2592.138.940.2382.139.210.231
β_cycle1.8817.80.1061.7315.070.1152.1517.840.121
β_kids_slow-- 0.2883.570.08060.3834.620.083
β_living0.85312.050.07080.7068.280.08521.1212.240.0918
β_v300.2976.920.04290.3047.110.04270.2997.020.0426
β_parking0.53914.750.03650.5414.870.03630.54614.90.0366
β_slow_greece------−1.13−13.390.0842
β_surface1.2616.220.0781.5816.510.09561.6917.380.0975
β_surface_rarely---−0.739−6.410.115−0.924−7.860.118
β_time_greece------0.06735.060.0133
β_trees0.2888.730.0330.2898.80.03280.3019.120.033
model fit
LL (null model)−5803.381 −5804.387 −5709.107
LL(final)−5684.278 −5658.247 −5537.178
Est. parameters19 21 23
Rho square0.017 0.022 0.026
LL ratio test (initial model)238.206 292.279 343.858
Gray values are not significant at the 95% level.

References

  1. Frank, L.D.; Sallis, J.F.; Conway, T.L.; Chapman, J.E.; Saelens, B.E.; Bachman, W. Many pathways from land use to health: Associations between neighborhood walkability and active transportation, body mass index, and air quality. J. Am. Plan. Assoc. 2006, 72, 75–87. [Google Scholar] [CrossRef]
  2. Mueller, N.; Rojas-Rueda, D.; Salmon, M.; Martinez, D.; Ambros, A.; Brand, C.; De Nazelle, A.; Dons, E.; Gaupp-Berghausen, M.; Gerike, R.; et al. Health impact assessment of cycling network expansions in European cities. Prev. Med. 2018, 109, 62–70. [Google Scholar] [CrossRef] [PubMed] [Green Version]
  3. De Hartog, J.J.; Boogaard, H.; Nijland, H.; Hoek, G. Do the health benefits of cycling outweigh the risks? Environ. Health Perspect. 2010, 118, 1109–1116. [Google Scholar] [CrossRef] [PubMed]
  4. Monsere, C.M.; McNeil, N.; Safely, B. Through the Intersection: Guidance for Protected Bike Lanes; Transportation Research and Education Center (TREC) at Portland State University (PSU): Portland, OR, USA, 2019. [Google Scholar]
  5. Blitz, A.; Busch-Geertsema, A.; Lanzendorf, M. More Cycling, Less Driving? Findings of a Cycle Street Intervention Study in the Rhine-Main Metropolitan Region, Germany. Sustainability 2020, 12, 805. [Google Scholar] [CrossRef] [Green Version]
  6. Reid, C. Bike Boom: The Unexpected Resurgence of Cycling; Island Press: Washington, DC, USA, 2017. [Google Scholar]
  7. Lanzendorf, M.; Busch-Geertsema, A. The cycling boom in large German cities—Empirical evidence for successful cycling campaigns. Transp. Policy 2014, 36, 26–33. [Google Scholar] [CrossRef]
  8. Pucher, J.; Buehler, R. Cycling towards a more sustainable transport future. Transp. Rev. 2017, 37, 689–694. [Google Scholar] [CrossRef] [Green Version]
  9. Buehler, R.; Pucher, J. International Overview: Cycling Trends in Western Europe, North America, and Australia. In City Cycling; The MIT Press: Cambridge, MA, USA; London, UK, 2012; pp. 9–29. [Google Scholar]
  10. Morgan, N. Cycling infrastructure and the development of a bicycle commuting socio-technical system: The case of Johannesburg. Appl. Mobil. 2019, 4, 106–123. [Google Scholar] [CrossRef]
  11. Clark, C.; Mokhtarian, P.; Circella, G.; Watkins, K. User Preferences for Bicycle Infrastructure in Communities with Emerging Cycling Cultures. Transp. Res. Rec. 2019, 2673, 89–102. [Google Scholar] [CrossRef]
  12. Winters, M.; Teschke, K.; Brauer, M.; Fuller, D. Bike Score: Associations between urban bikeability and cycling behavior in 24 cities. Int. J. Behav. Nutr. Phys. Act. 2016, 13, 1–10. [Google Scholar] [CrossRef] [Green Version]
  13. Sallis, J.F.; Cain, K.L.; Conway, T.L.; Gavand, K.A.; Millstein, R.A.; Geremia, C.M. Is Your Neighborhood Designed to Support Physical Activity? A Brief Streetscape Audit Tool. Prev. Chronic Dis. 2015, 12, E141. [Google Scholar] [CrossRef] [Green Version]
  14. Vedel, S.E.; Jacobsen, J.B.; Skov-Petersen, H. Bicyclists’ preferences for route characteristics and crowding in Copenhagen—A choice experiment study of commuters. Transp. Res. Part A Policy Pract. 2017, 100, 53–64. [Google Scholar] [CrossRef]
  15. Mertens, L.; Van Dyck, D.; Ghekiere, A.; De Bourdeaudhuij, I.; Deforche, B.; Van de Weghe, N.; Van Cauwenberg, J. Which environmental factors most strongly influence a street’s appeal for bicycle transport among adults? A conjoint study using manipulated photographs. Int. J. Health Geogr. 2016, 15, 1–14. [Google Scholar] [CrossRef] [PubMed] [Green Version]
  16. Broach, J.; Dill, J.; Gliebe, J. Where do cyclists ride? A route choice model developed with revealed preference GPS data. Transp. Res. Part A Policy Pract. 2012, 46, 1730–1740. [Google Scholar] [CrossRef]
  17. Prato, C.G.; Halldórsdóttir, K.; Nielsen, O.A. Evaluation of land-use and transport network effects on cyclists’ route choices in the Copenhagen Region in value-of-distance space. Int. J. Sustain. Transp. 2018, 12, 770–781. [Google Scholar] [CrossRef] [Green Version]
  18. Ghanayim, M.; Bekhor, S. Modelling bicycle route choice using data from a GPS-assisted household survey. EJTIR 2018, 18, 158–177. [Google Scholar]
  19. Zimmermann, M.; Mai, T.; Frejinger, E. Bike route choice modeling using GPS data without choice sets of paths. Transp. Res. Part C Emerg. Technol. 2017, 75, 183–196. [Google Scholar] [CrossRef]
  20. Thakuriah, P.; Metaxatos, P.; Lin, J.; Jensen, E. An examination of factors affecting propensities to use bicycle and pedestrian facilities in suburban locations. Transp. Res. Part D Transp. Environ. 2012, 17, 341–348. [Google Scholar] [CrossRef]
  21. Mölenberg, F.J.M.; Panter, J.; Burdorf, A.; Van Lenthe, F.J. A systematic review of the effect of infrastructural interventions to promote cycling: Strengthening causal inference from observational data. Int. J. Behav. Nutr. Phys. Act. 2019, 16, 93. [Google Scholar] [CrossRef] [Green Version]
  22. Gössling, S.; Choi, A.; Dekker, K.; Metzler, D. The Social Cost of Automobility, Cycling and Walking in the European Union. Ecol. Econ. 2019, 158, 65–74. [Google Scholar] [CrossRef]
  23. Ghosh, S.; Arnold, P.; Vingrys, S.; Ballis, T. Southall Broadway Public Realm—Post Implementation Study. In Proceedings of the ETC Proceedings, Barcelona, Spain, 5–7 October 2016. [Google Scholar]
  24. Wang, Y.; Chau, C.K.; Ng, W.Y.; Leung, T.M. A review on the effects of physical built environment attributes on enhancing walking and cycling activity levels within residential neighborhoods. Cities 2016, 50, 1–15. [Google Scholar] [CrossRef]
  25. Buehler, R.; Dill, J. Bikeway Networks: A Review of Effects on Cycling. Transp. Rev. 2016, 36, 9–27. [Google Scholar] [CrossRef]
  26. Ewing, R.; Cervero, R. Travel and the Built Environment. J. Am. Plan. Assoc. 2010, 76, 265–294. [Google Scholar] [CrossRef]
  27. Forsyth, A.; Krizek, K.J. Promoting Walking and Bicycling: Assessing the Evidence to Assist Planners. Built Environ. 2010, 36, 429–446. [Google Scholar] [CrossRef]
  28. Hensher, D.A. Stated preference analysis of travel choices: The state of practice. Transportation 1994, 21, 107–133. [Google Scholar] [CrossRef] [Green Version]
  29. Ben-Akiva, M.; Bierlaire, M. Discrete choice methods and their applications to short term travel decisions. In Handbook of Transportation Science; Springer: Boston, MA, USA, 1999; pp. 5–33. [Google Scholar]
  30. Aldred, R.; Elliott, B.; Woodcock, J.; Goodman, A. Cycling provision separated from motor traffic: A systematic review exploring whether stated preferences vary by gender and age. Transp. Rev. 2016, 37, 1–27. [Google Scholar] [CrossRef]
  31. Winters, M.; Teschke, K. Route Preferences Among Adults in the Near Market for Bicycling: Findings of the Cycling in Cities Study. Am. J. Health Promot. 2010, 25, 40–47. [Google Scholar] [CrossRef]
  32. Stinson, M.A.; Bhat, C.R. Commuter Bicyclist Route Choice: Analysis Using a Stated Preference Survey. Transp. Res. Rec. J. Transp. Res. Board 2003, 1828, 107–115. [Google Scholar] [CrossRef]
  33. Sener, I.N.; Eluru, N.; Bhat, C.R. An analysis of bicycle route choice preferences in Texas, US. Transportation 2009, 36, 511–539. [Google Scholar] [CrossRef] [Green Version]
  34. Abraham, J.E.; McMillan, S.; Brownlee, A.T.; Hunt, J.D. Investigation of Cycling Sensitivities. Transp. Res. Board Annu. Conf. 2002, 81, 1–12. [Google Scholar]
  35. Hunt, J.D.; Abraham, J.E. Influences on bicycle use. Transportation 2007, 34, 453–470. [Google Scholar] [CrossRef]
  36. Poorfakhraei, A.; Rowangould, G.M. Estimating welfare change associated with improvements in urban bicycling facilities. J. Transp. Eng. 2015, 141, 04015025. [Google Scholar] [CrossRef]
  37. Tilahun, N.Y.; Levinson, D.M.; Krizek, K.J. Trails, lanes, or traffic: Valuing bicycle facilities with an adaptive stated preference survey. Transp. Res. Part A Policy Pract. 2007, 41, 287–301. [Google Scholar] [CrossRef] [Green Version]
  38. Caulfield, B.; Brick, E.; McCarthy, O.T. Determining bicycle infrastructure preferences—A case study of Dublin. Transp. Res. Part D Transp. Environ. 2012, 17, 413–417. [Google Scholar] [CrossRef] [Green Version]
  39. Liu, Y.; Yang, D.; Timmermans, H.J.P.; De Vries, B. Analysis of the impact of street-scale built environment design near metro stations on pedestrian and cyclist road segment choice: A stated choice experiment. J. Transp. Geogr. 2020, 82, 102570. [Google Scholar] [CrossRef]
  40. Nawrath, M.; Kowarik, I.; Fischer, L.K. The influence of green streets on cycling behavior in European cities. Landsc. Urban Plan. 2019, 190, 103598. [Google Scholar] [CrossRef]
  41. Rossetti, T.; Saud, V.; Hurtubia, R. I want to ride it where I like: Measuring design preferences in cycling infrastructure. Transportation 2019, 46, 697–718. [Google Scholar] [CrossRef]
  42. Krizek, K.J. Two Approaches to Valuing Some of Bicycle Facilities’ Presumed Benefits: Propose a session for the 2007 National Planning Conference in the City of Brotherly Love. J. Am. Plan. Assoc. 2007, 72, 309–320. [Google Scholar] [CrossRef]
  43. Langner, L.; Maibaum, M.; Notev, S. LamaPoll. Available online: https://www.lamapoll.de/ (accessed on 20 April 2018).
  44. Metrics, C. N. 1.1. 1 User Manual & Reference Guide; Choice Metrics: Sydney, Australia, 2012. [Google Scholar]
  45. Bliemer, M.; Rose, J. Designing Stated Choice Experiments: State-of-the-Art; ETH Zürich: Zürich, Switzerland, 2006. [Google Scholar]
  46. Hurtubia, R.; Guevara, A.; Donoso, P. Using images to measure qualitative attributes of public spaces through sp surveys. Transp. Res. Procedia 2015, 11, 460–474. [Google Scholar] [CrossRef] [Green Version]
  47. Nobis, C. Mobilität in Deutschland—MiD Analysen zum Radverkehr und Fußverkehr; Bundesministerium für Verkehr und Digitale Infrastruktur: Berlin, Germany, 2019.
  48. Bracher, T. Fahrrad-und Fußverkehr: Strukturen und Potentiale. In Handbuch Verkehrspolitik; Springer: Wiesbaden, Germany, 2016; pp. 265–291. [Google Scholar]
  49. Becker, S.; Renn, O. Akzeptanzbedingungen politischer Maßnahmen für die Verkehrswende: Das Fallbeispiel Berliner Mobilitätsgesetz. In Akzeptanz und Politische Partizipation in der Energietransformation; Springer: Wiesbaden, Germany, 2019; pp. 109–130. [Google Scholar]
  50. Vlastos, T.; Bakogiannis, E. Cycling. Pedaling your city to a sustainable future. Hell. Post Off. 2015, 1, 174–182. [Google Scholar]
  51. Domencich, T.A.; McFadden, D. Urban Travel Demand—A Behavioral Analysis; North-Holland Publishing Company Limited: Oxford, UK, 1975. [Google Scholar]
  52. Bierlaire, M. PandasBiogeme: A Short Introduction; Report TRANSP-OR: Lausanne, Switzerland, 2018; p. 181219. [Google Scholar]
  53. McFadden, D.; Train, K. Mixed MNL models for discrete response. J. Appl. Econom. 2000, 15, 447–470. [Google Scholar] [CrossRef]
  54. Bakogiannis, E.; Siti, M.; Vassi, A.; Christodoulopoulou, G.; Eleftheriou, V. Research on the development potential of cycling routes connecting green open spaces in Athens. Glob. J. Eng. Sci. Res. Manag. 2014, 1, 1–20. [Google Scholar]
  55. Elvik, R.; Bjørnskau, T. Safety-in-numbers: A systematic review and meta-analysis of evidence. Saf. Sci. 2017, 92, 274–282. [Google Scholar] [CrossRef] [Green Version]
  56. Vlastos, T. Promoting Cycling in Greece in the framework of the European Strategy for sustainable mobility. In Seminar Proceedings of «Mobility Planning and Management in Tourist Destinations»; Conference Proceedings: Ibiza, Spain, 2007. [Google Scholar]
  57. Czwajda, L.; Kosacka-Olejnik, M.; Kudelska, I.; Kostrzewski, M.; Sethanan, K.; Pitakaso, R. Application of prediction markets phenomenon as decision support instrument in vehicle recycling sector. LogForum 2019, 15, 265–278. [Google Scholar] [CrossRef]
Figure 1. Exemplary choice situation.
Sustainability 12 03375 g001
Figure 2. Sample characteristics: (a) Frequency of cycling; (b) age groups (years).
Sustainability 12 03375 g002
Figure 3. Bike infrastructure: (a) Munich; (b) Athens.
Sustainability 12 03375 g003
Table 1. Attributes and levels of the experiment.
AttributeLevels
Street typeArterial road | Side street
Cycle infrastructureNo cycle infrastructure | Bike lane | Cycle path | Protected bike lane
RegulationMaximum speed: 50 km/h | Maximum speed: 30 km/h / Zone 30 |
Cycle street (residents only) | Living street
SurfaceCobblestones | Asphalt
ParkingNo on-street parking | On-street parking
TreesNo trees | Trees
Travel time (minutes)8 | 10 | 12 | 15
Bold indicates the reference scenarios. The description of the attributes and levels is included in Appendix A.
Table 2. Estimation results.
Model 0 Model 1 Model 2
ParameterEst. Valuet-ValueEst. Valuet-ValueEst. Valuet-Value
ASC_14.048.493.718.233.488.09
ASC_34.168.713.828.473.608.33
ASC_23.978.343.648.083.427.92
β_lane1.3914.41.3914.481.3714.32
β_path1.9018.71.9118.881.8918.81
β_protected2.5724.892.5825.072.5625.05
β_sidestreet0.646.320.626.120.605.94
β_time−0.14−12.78−0.14−12.95−0.17−13.33
β_time_s0.284.280.253.710.202.62
SIGMA_1−0.06−0.51−0.04−0.35−0.02−0.18
SIGMA_2−0.01−0.12−0.01−0.12−0.01−0.09
SIGMA_3−0.00−0.05−0.00−0.02−0.01−0.08
SIGMA_42.409.252.138.942.139.21
β_cycle1.8817.81.7315.072.1517.84
β_kids_slow--0.293.570.384.62
β_living0.8512.050.718.281.1212.24
β_v300.306.920.307.110.307.02
β_parking0.5414.750.5414.870.5514.90
β_slow_greece----−1.13−13.39
β_surface1.2616.221.5816.511.6917.38
β_surface_rarely--−0.74−6.41−0.92−7.86
β_time_greece----0.075.06
β_trees0.298.730.298.800.309.12
Model fit
LL (null model)−5803.38 −5804.39 −5709.11
LL(final)−5684.28 −5658.25 −5537.18
Est. parameters19.00 21.00 23.00
Rho square0.02 0.022 0.03
LL ratio test (initial model)238.21 292.28 343.86
Gray values are not significant at the 95% level. The description of the coefficients is included in Appendix A, and comprehensive results are in Appendix C.

