U.S. State-level Projections of the Spatial Distribution of Population Consistent with Shared Socioeconomic Pathways


Abstract
1. Introduction
2. SSPs and Their Demographic Assumptions
3. Methodology
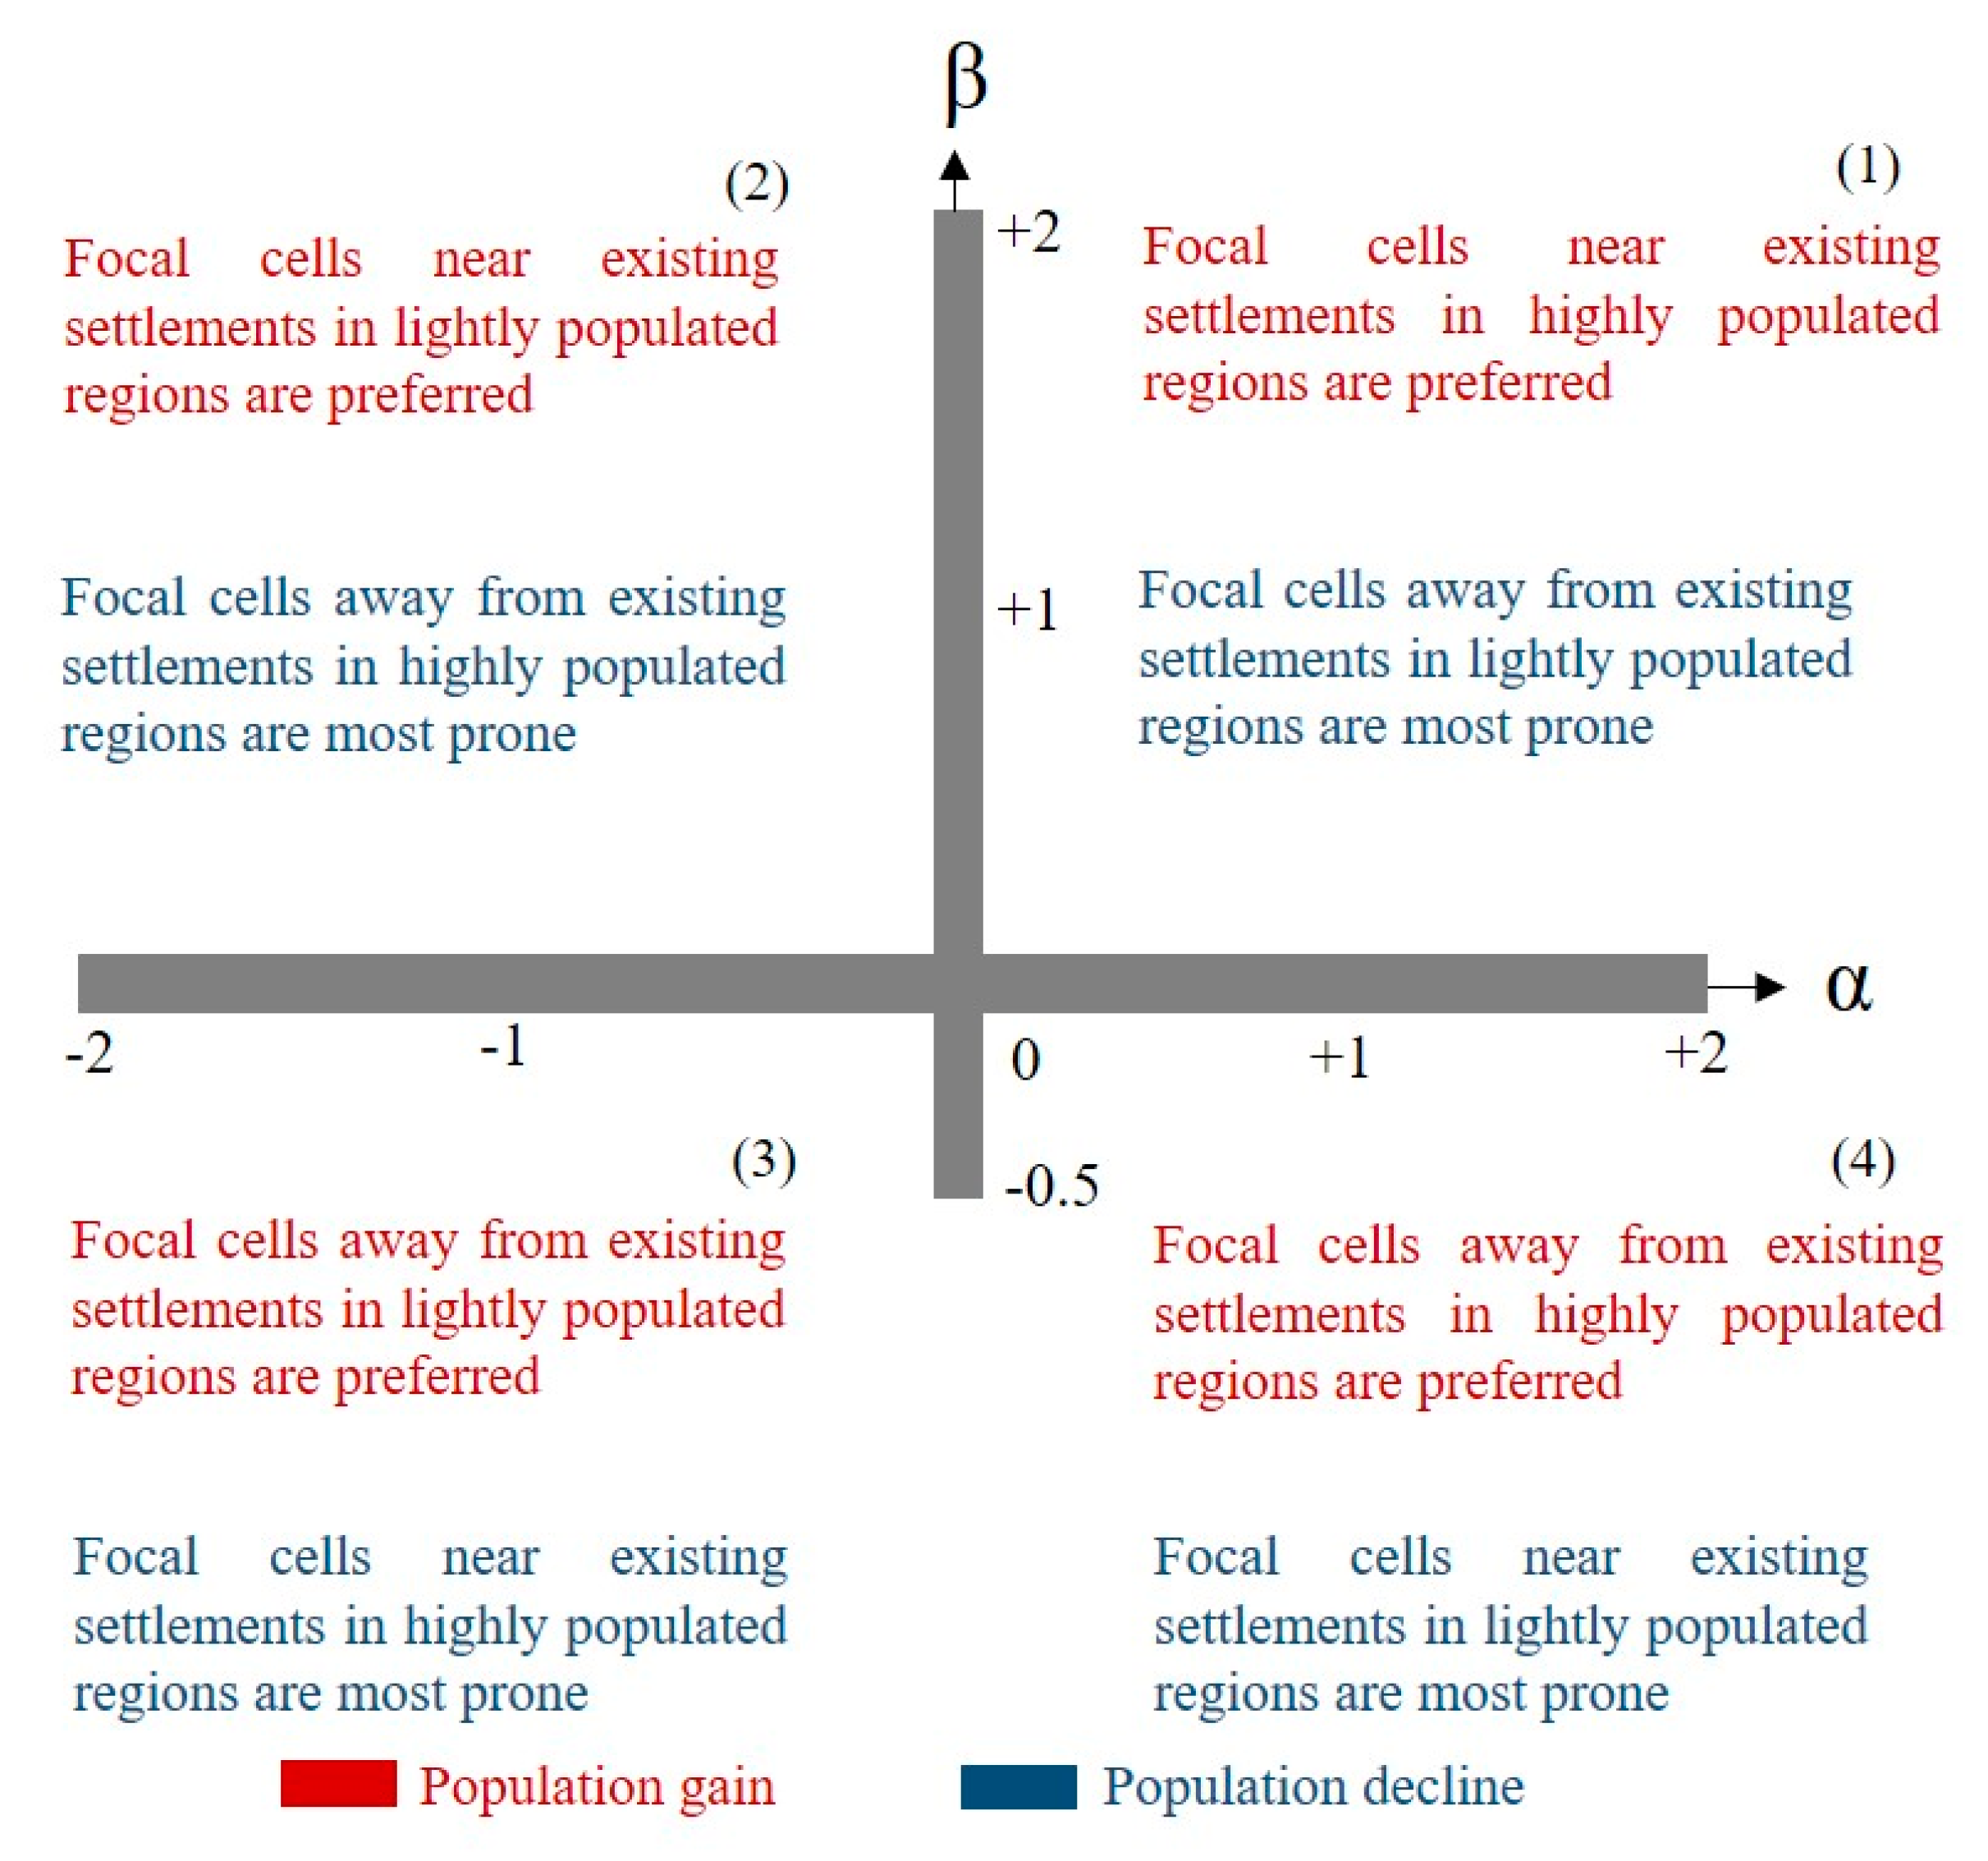
3.1. Gravity-based Population Downscaling Model
3.2. Modification of Parameters According to SSPs
4. Results and Discussion
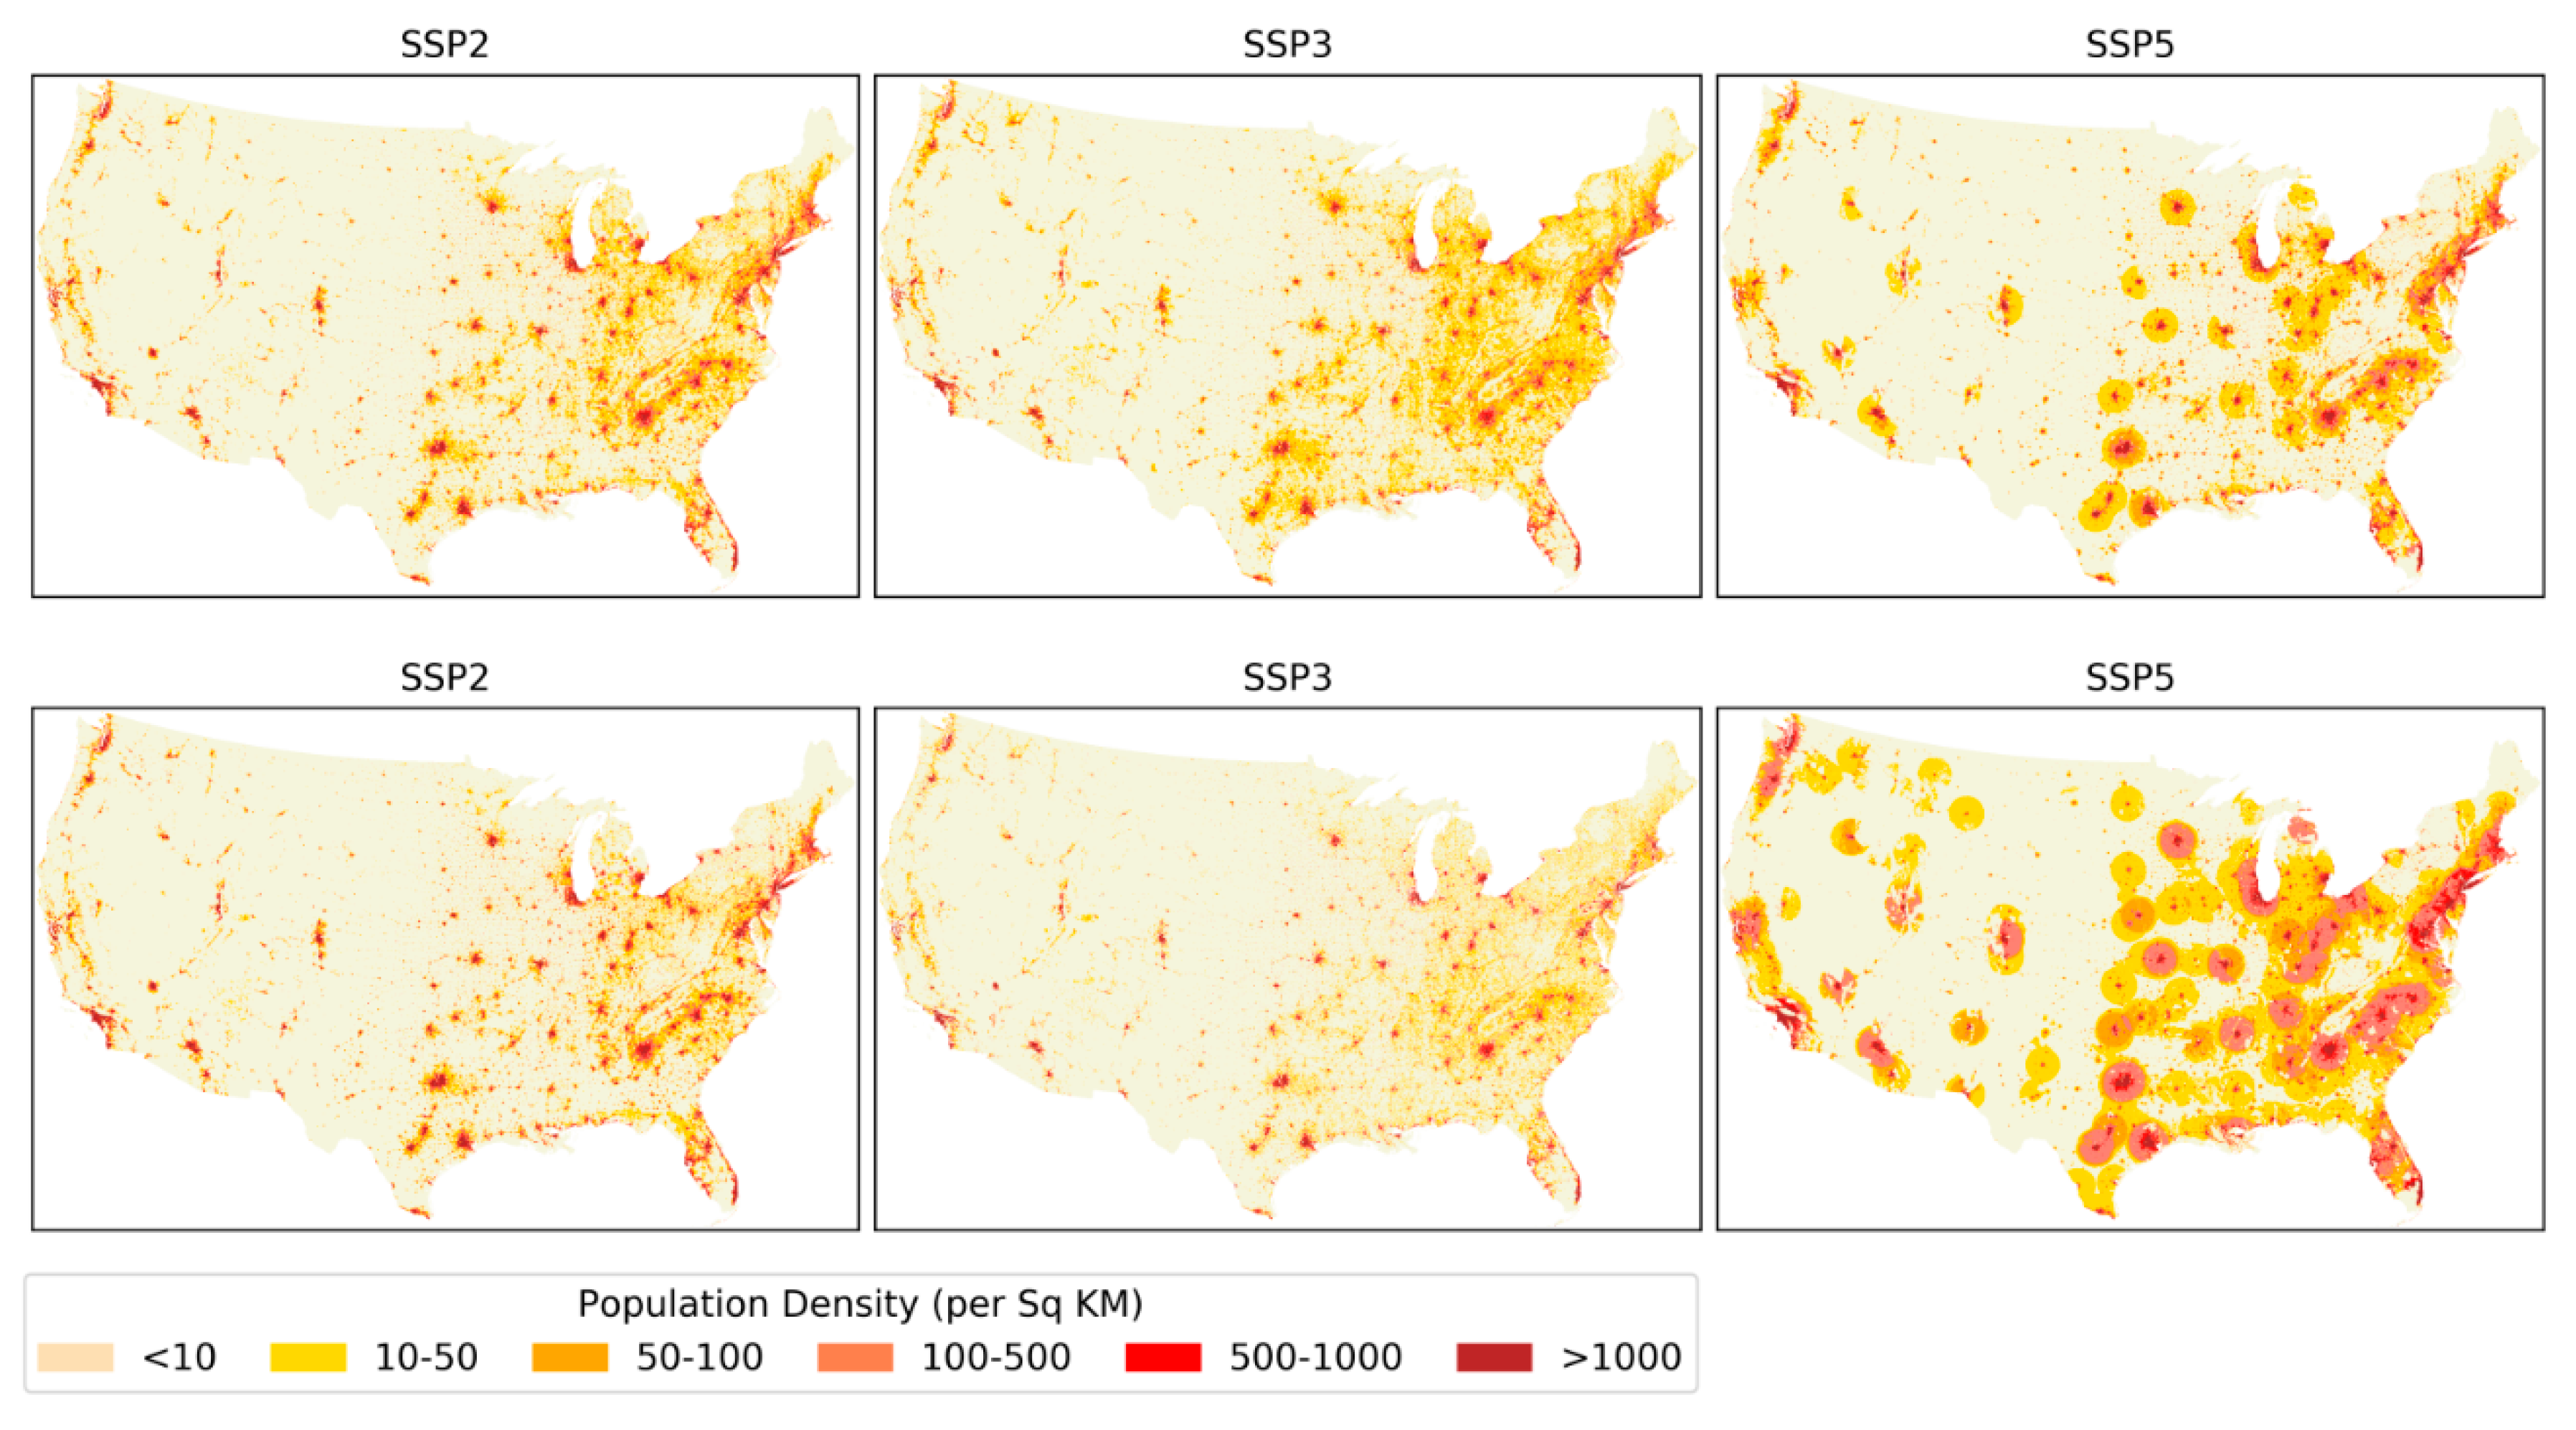
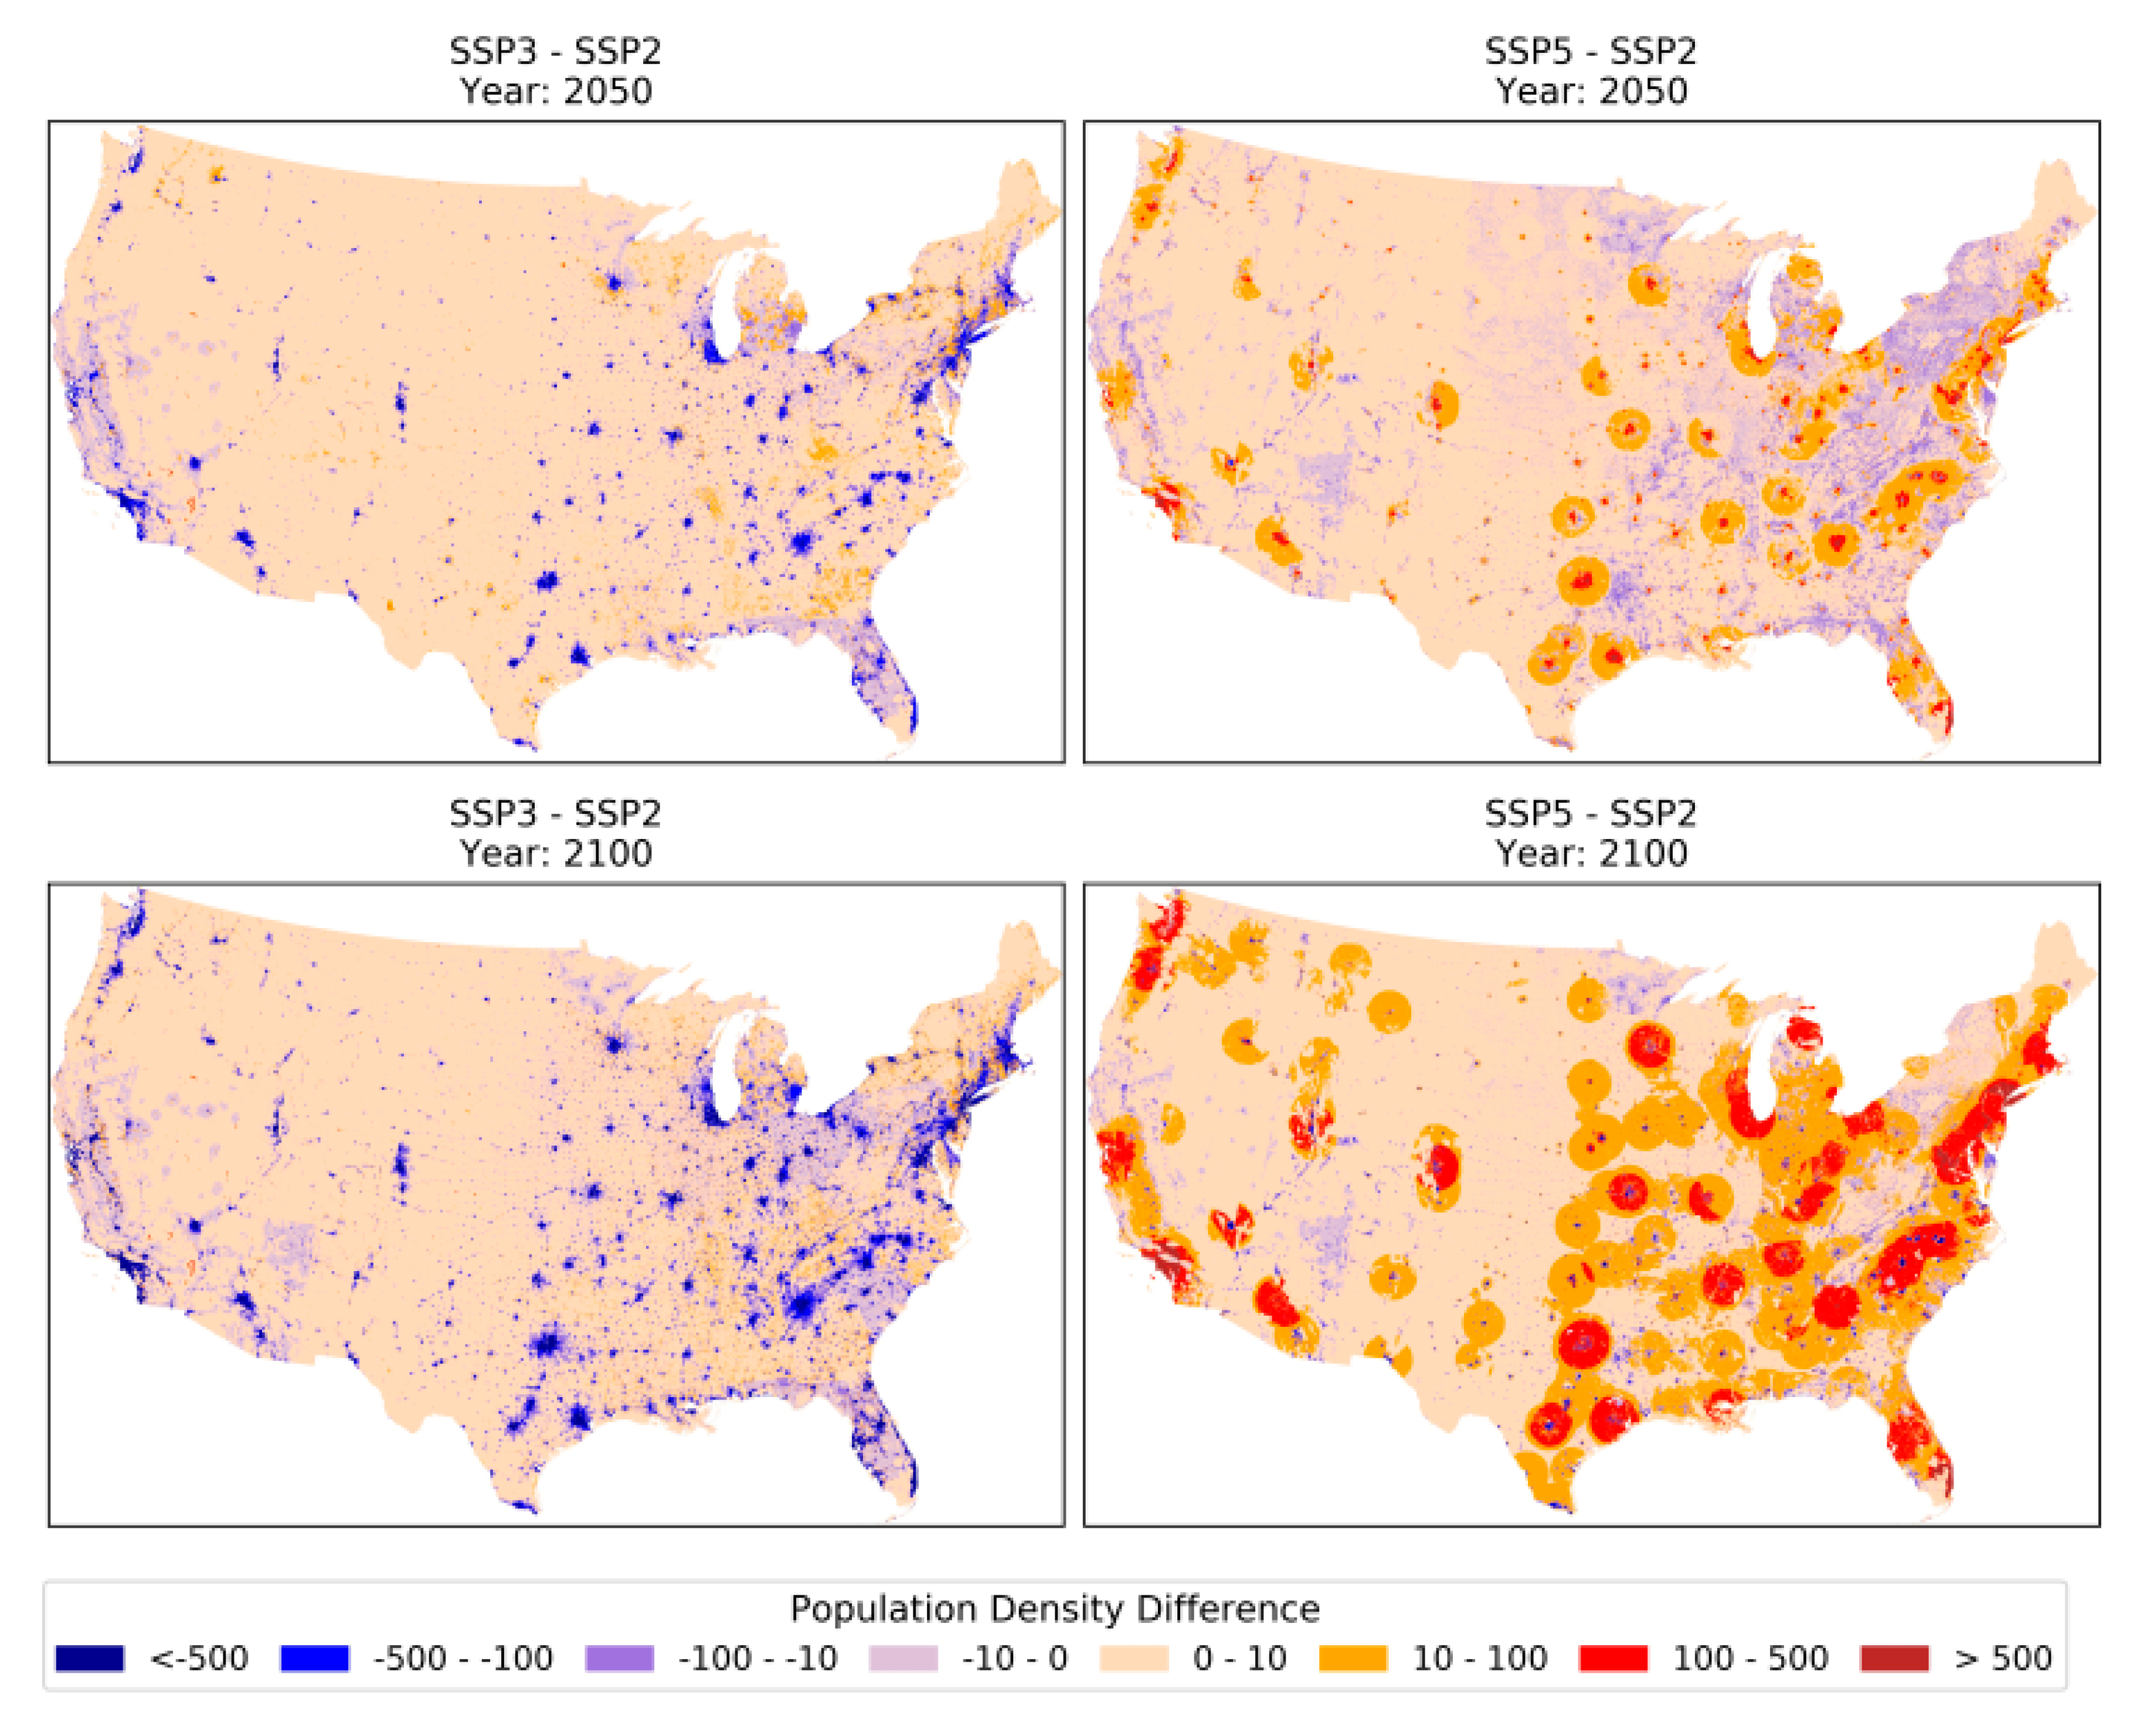
4.1. SSP Projections
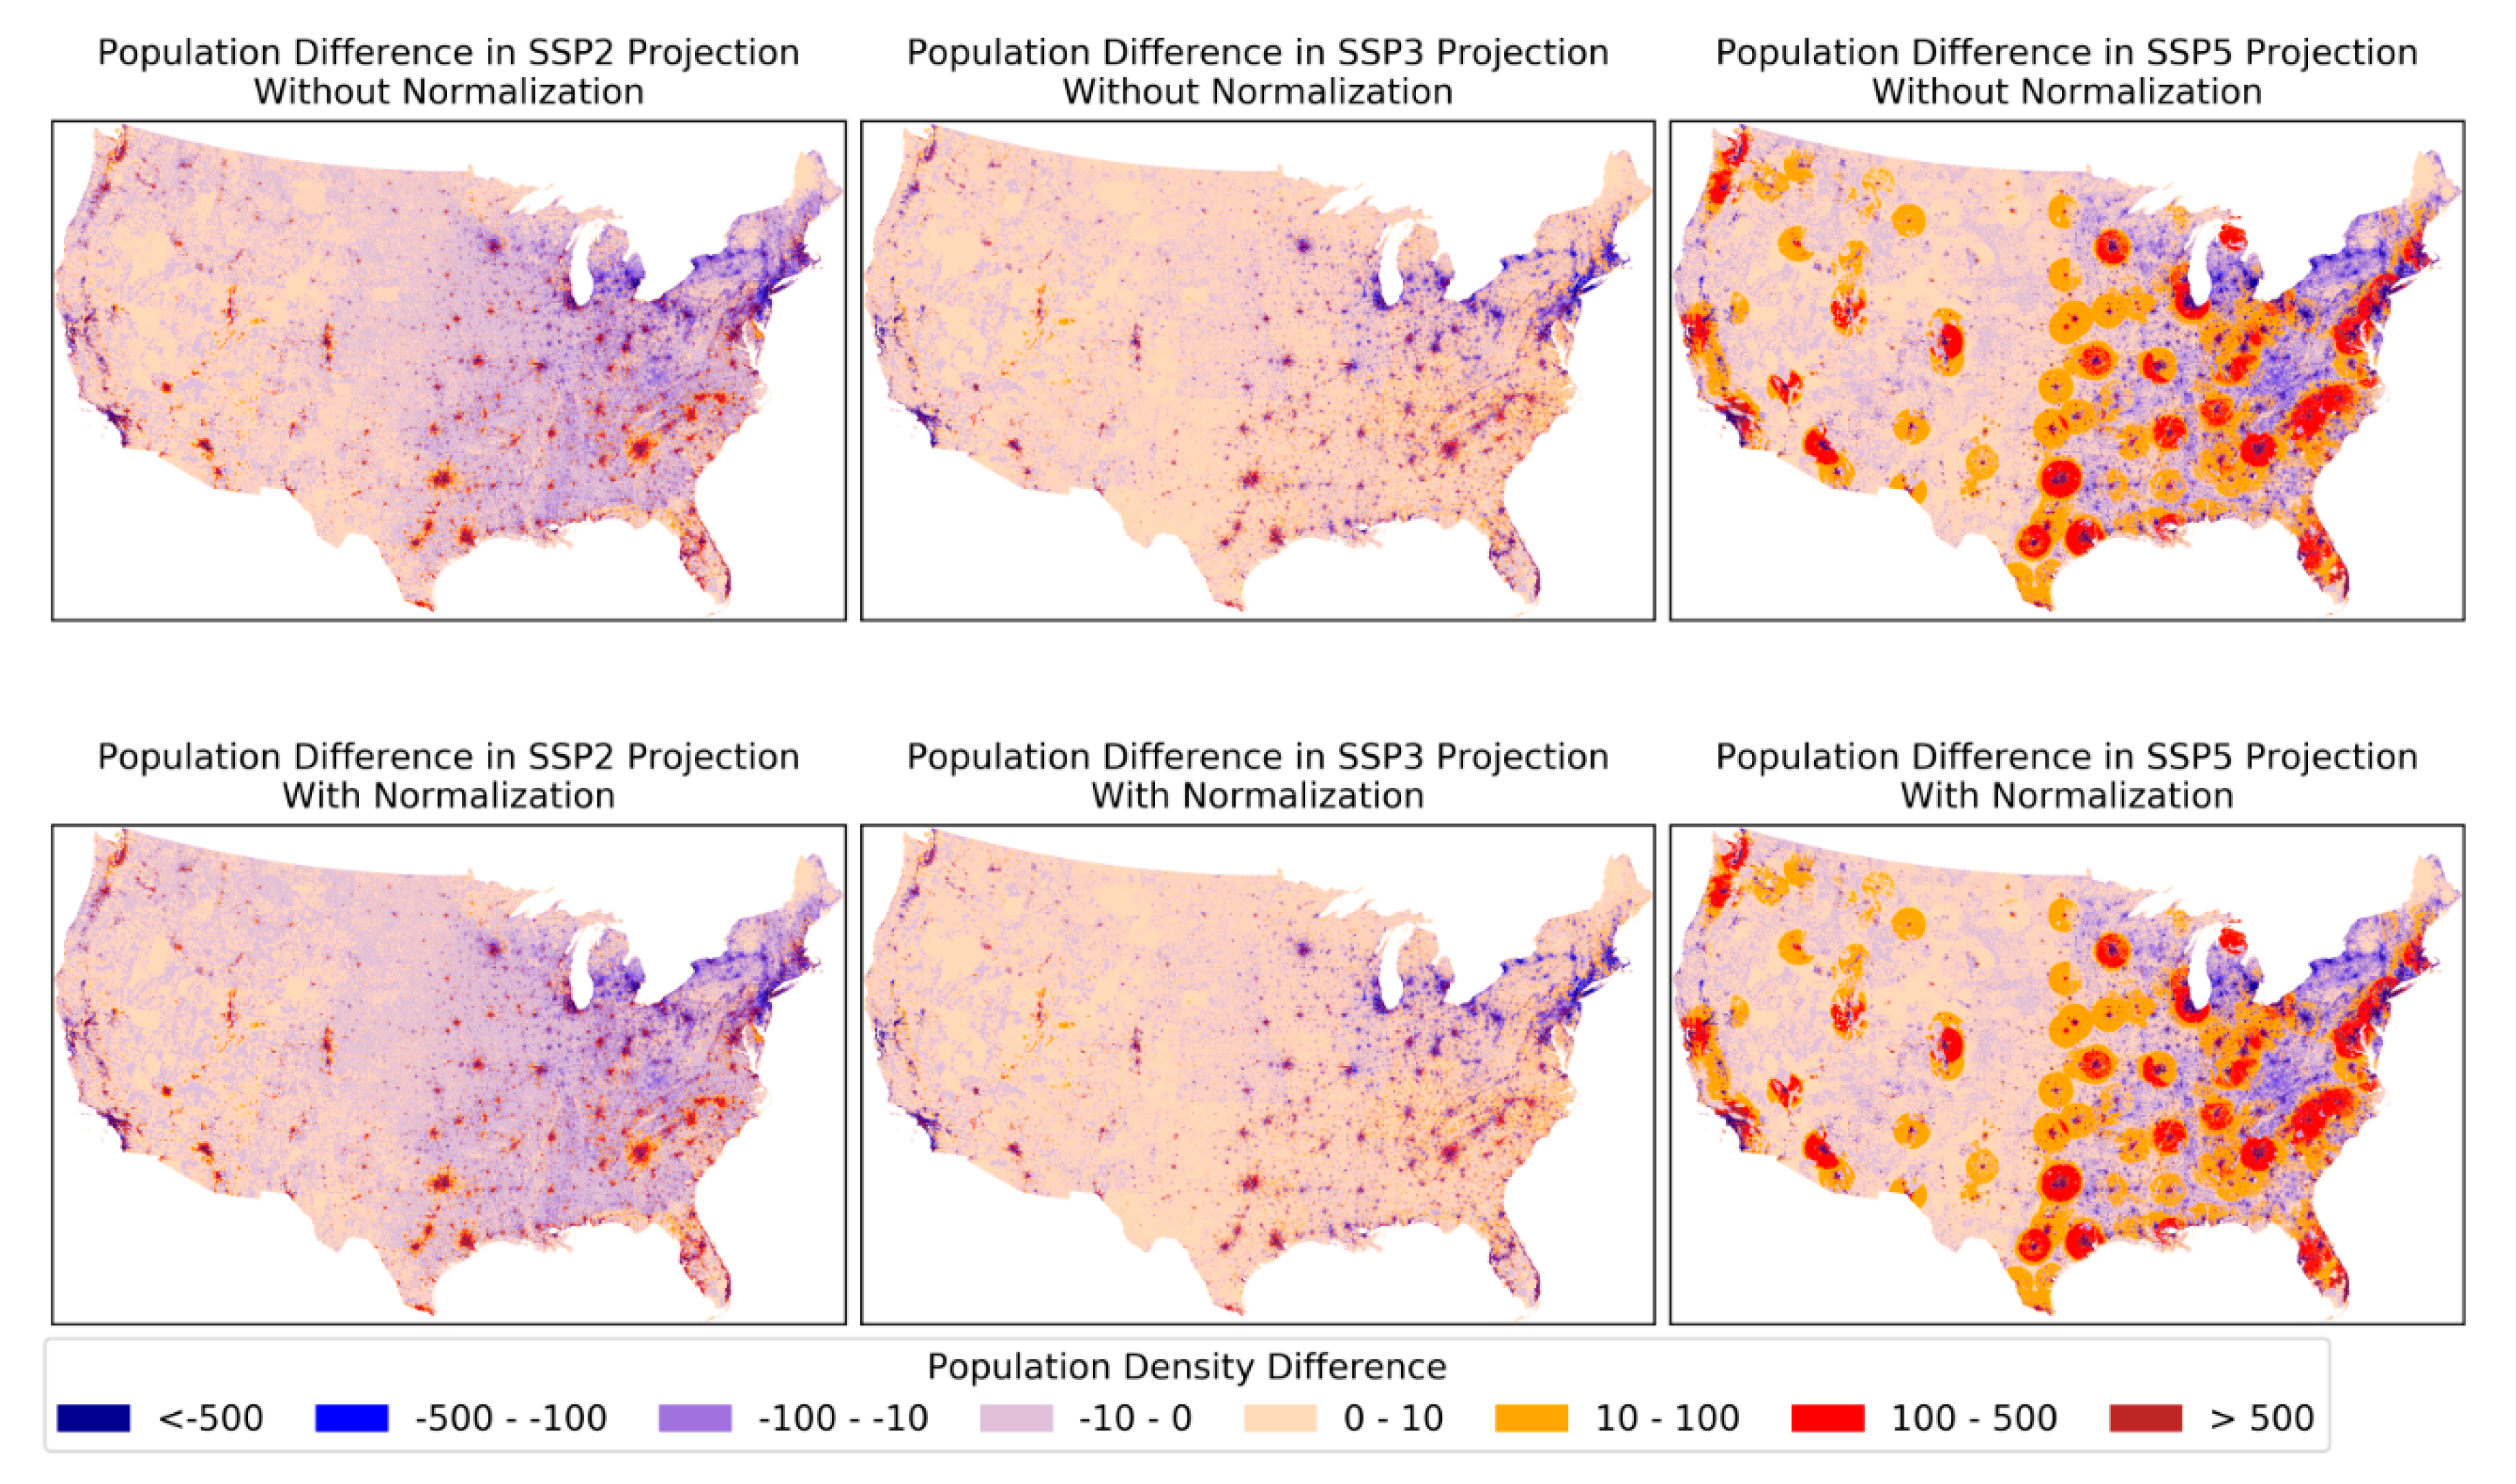
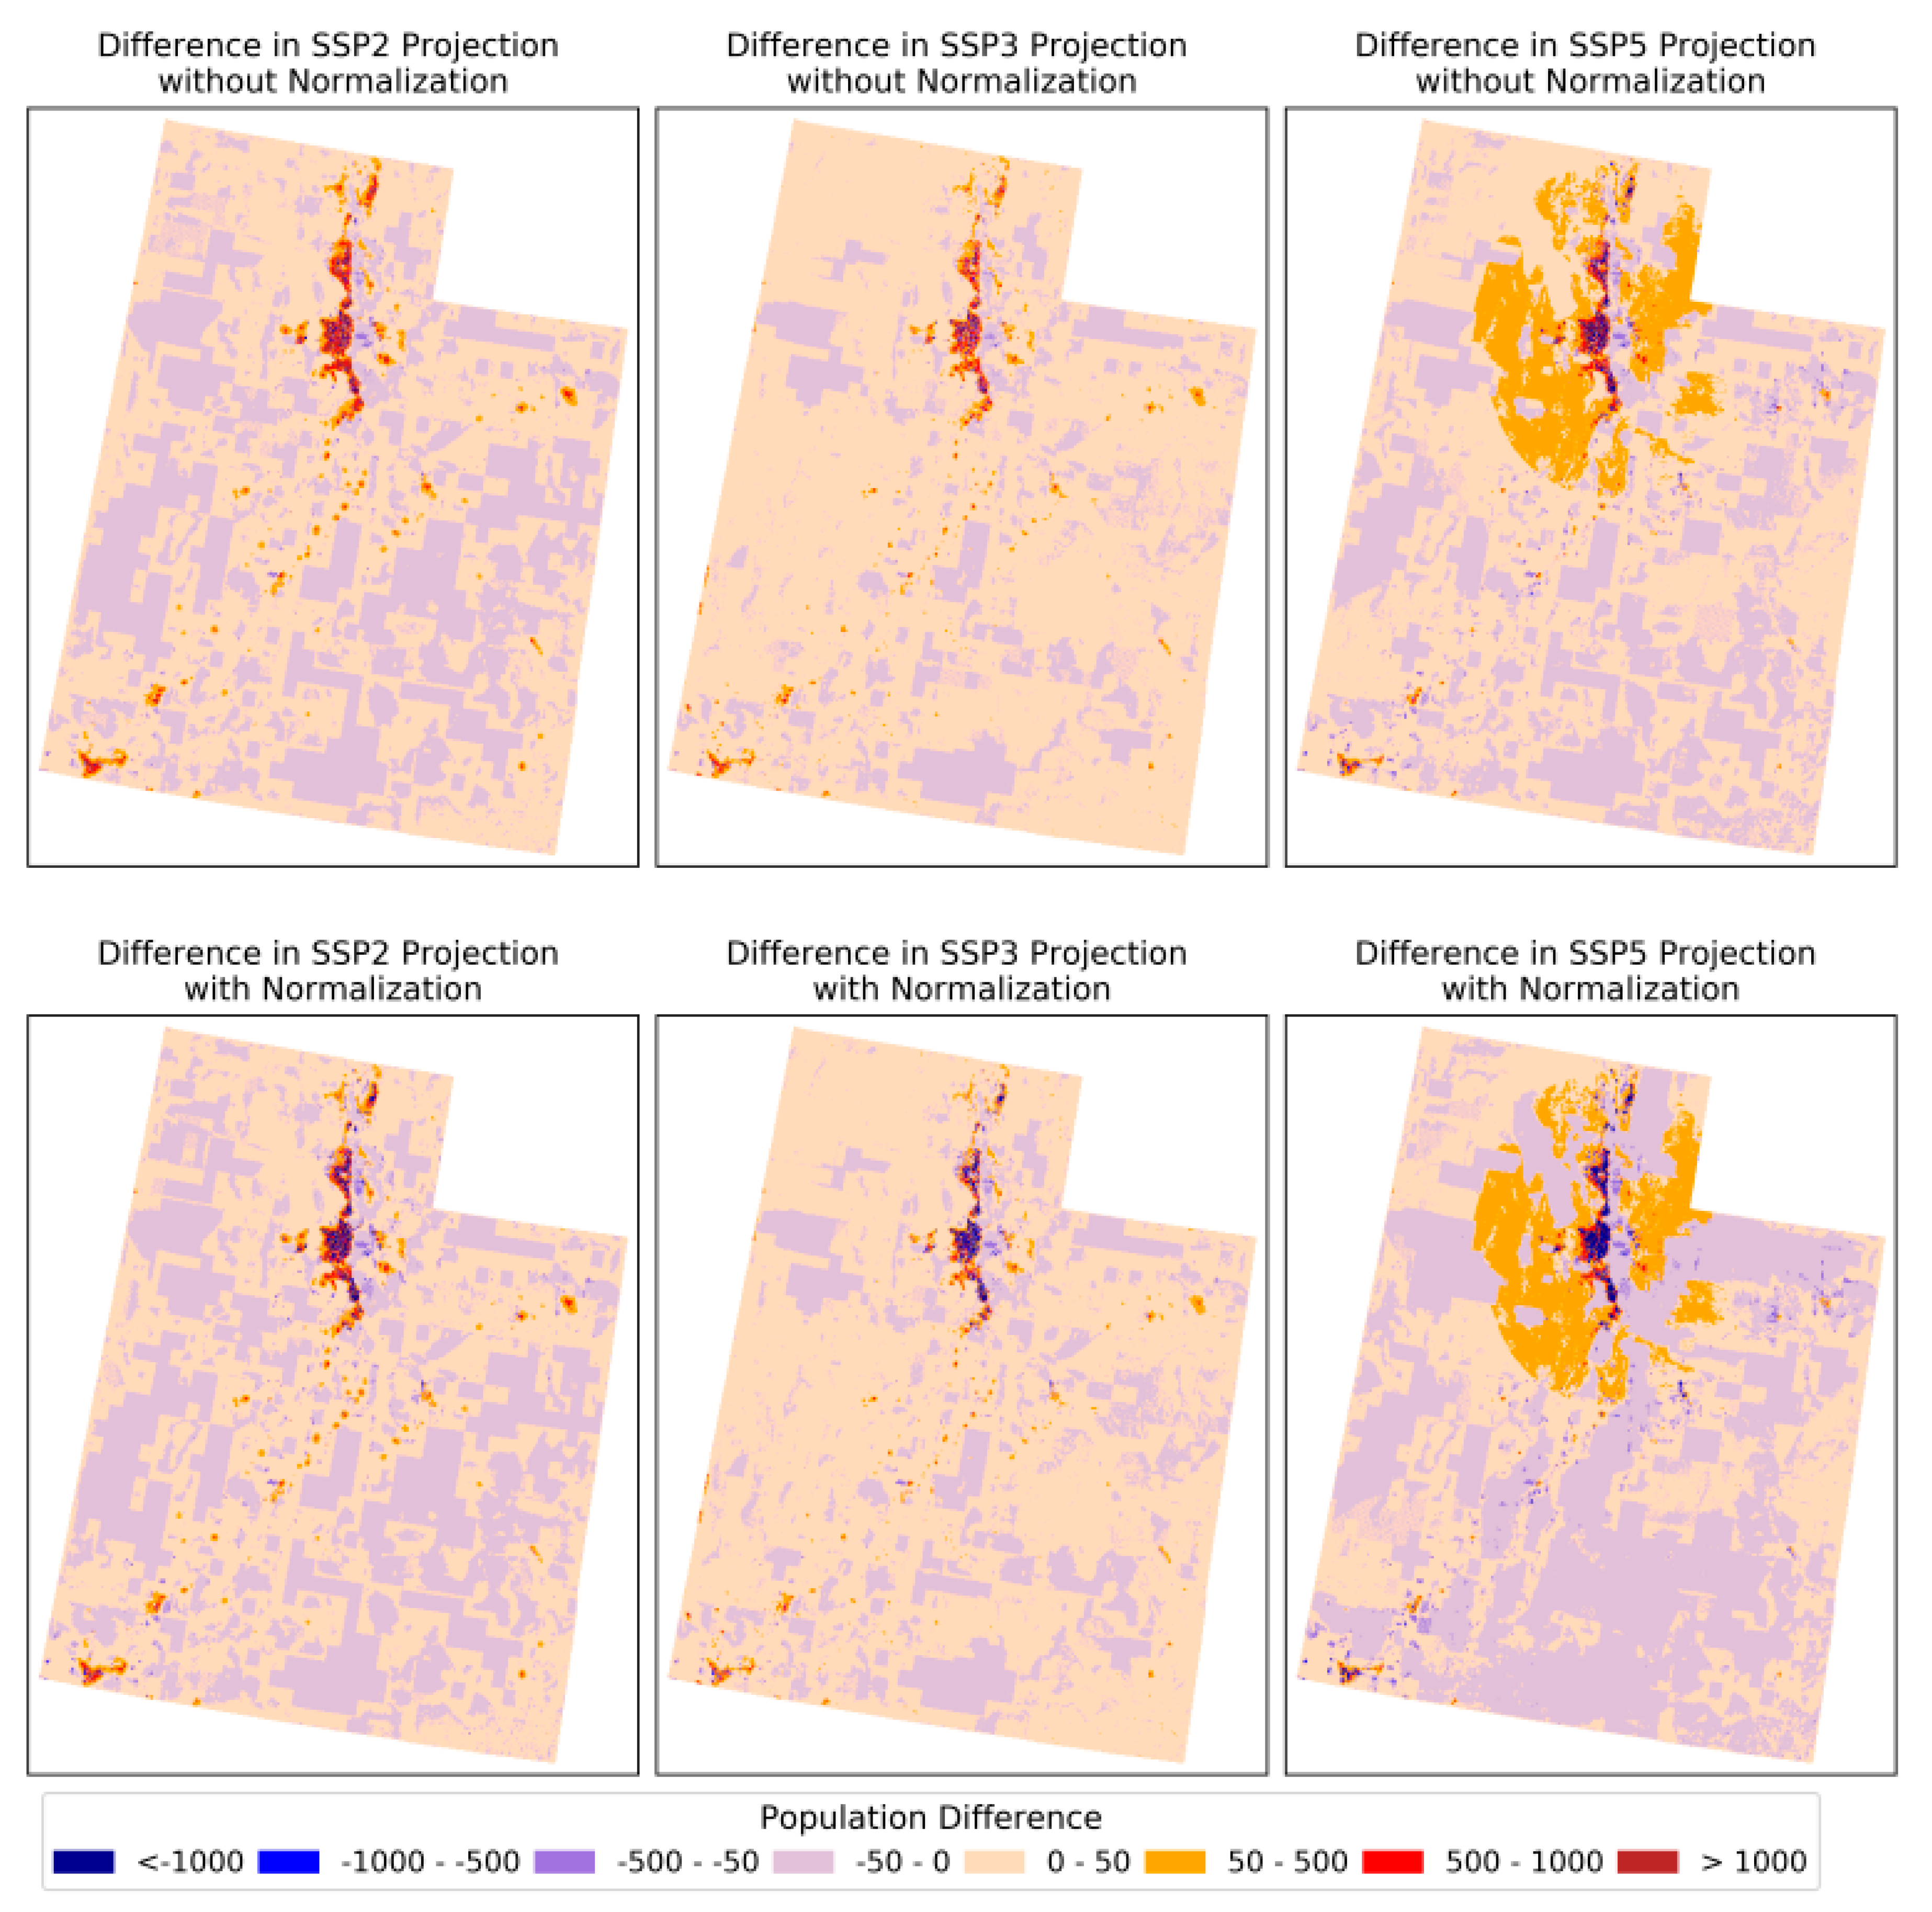
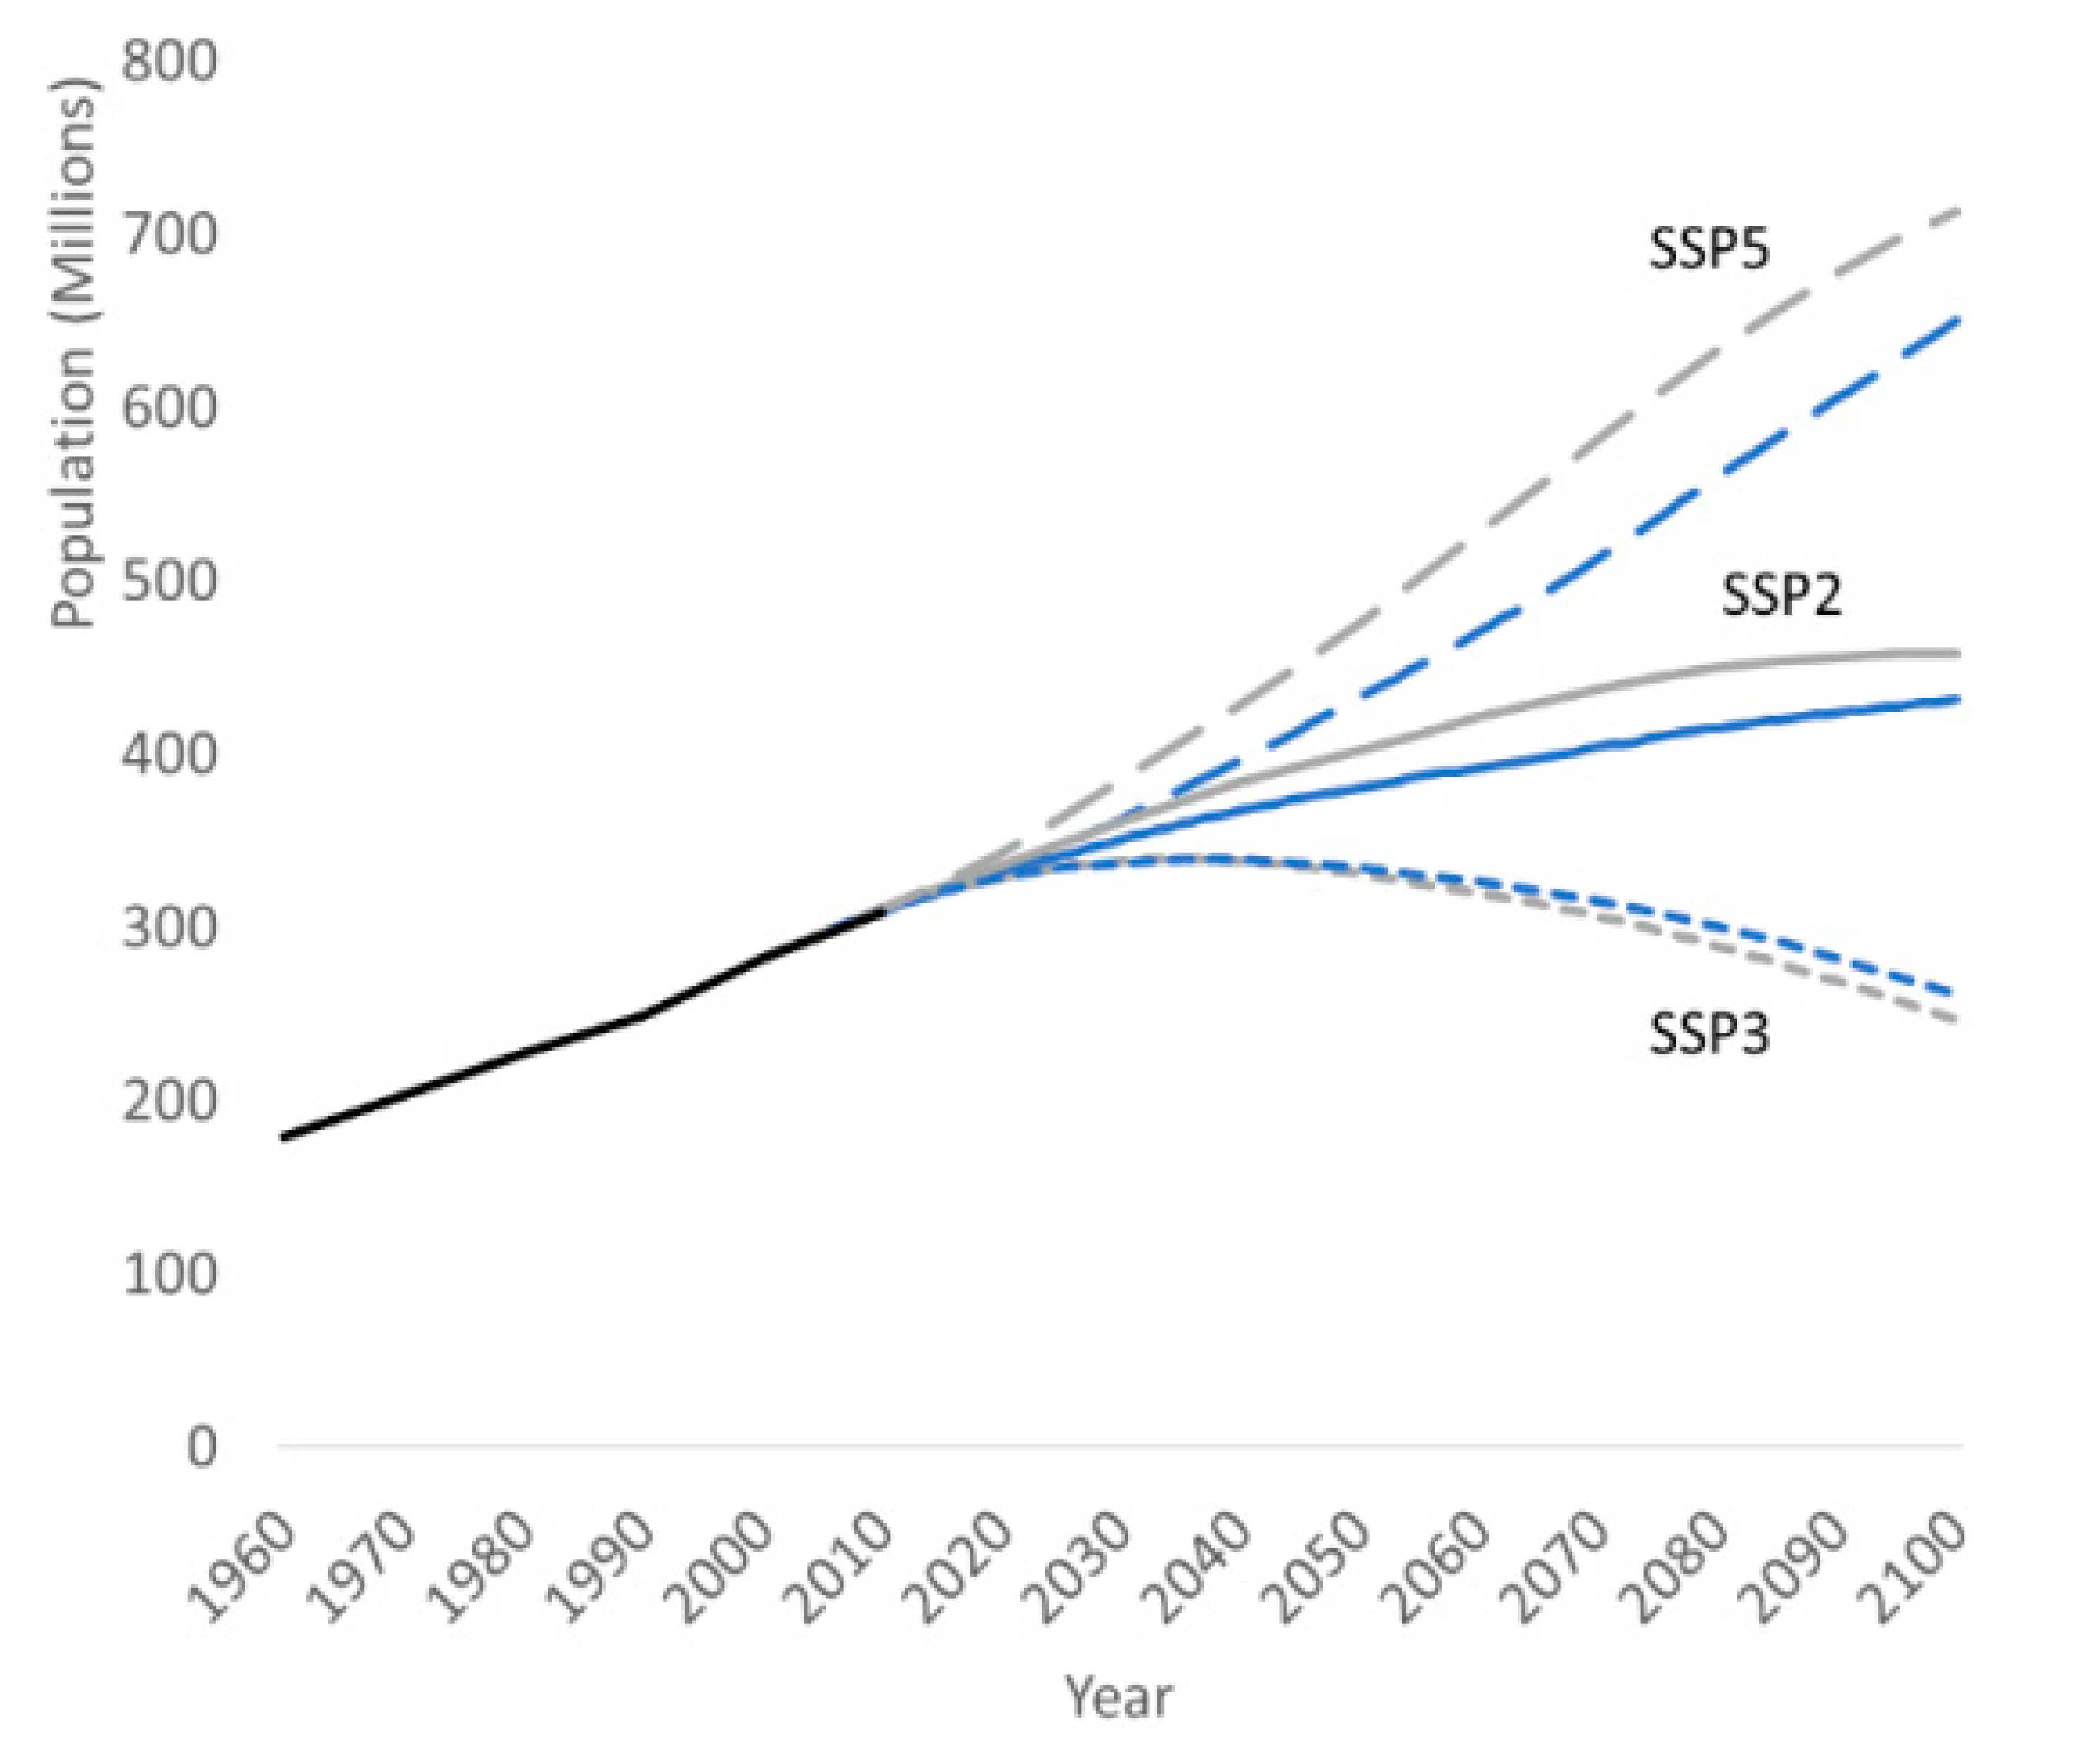
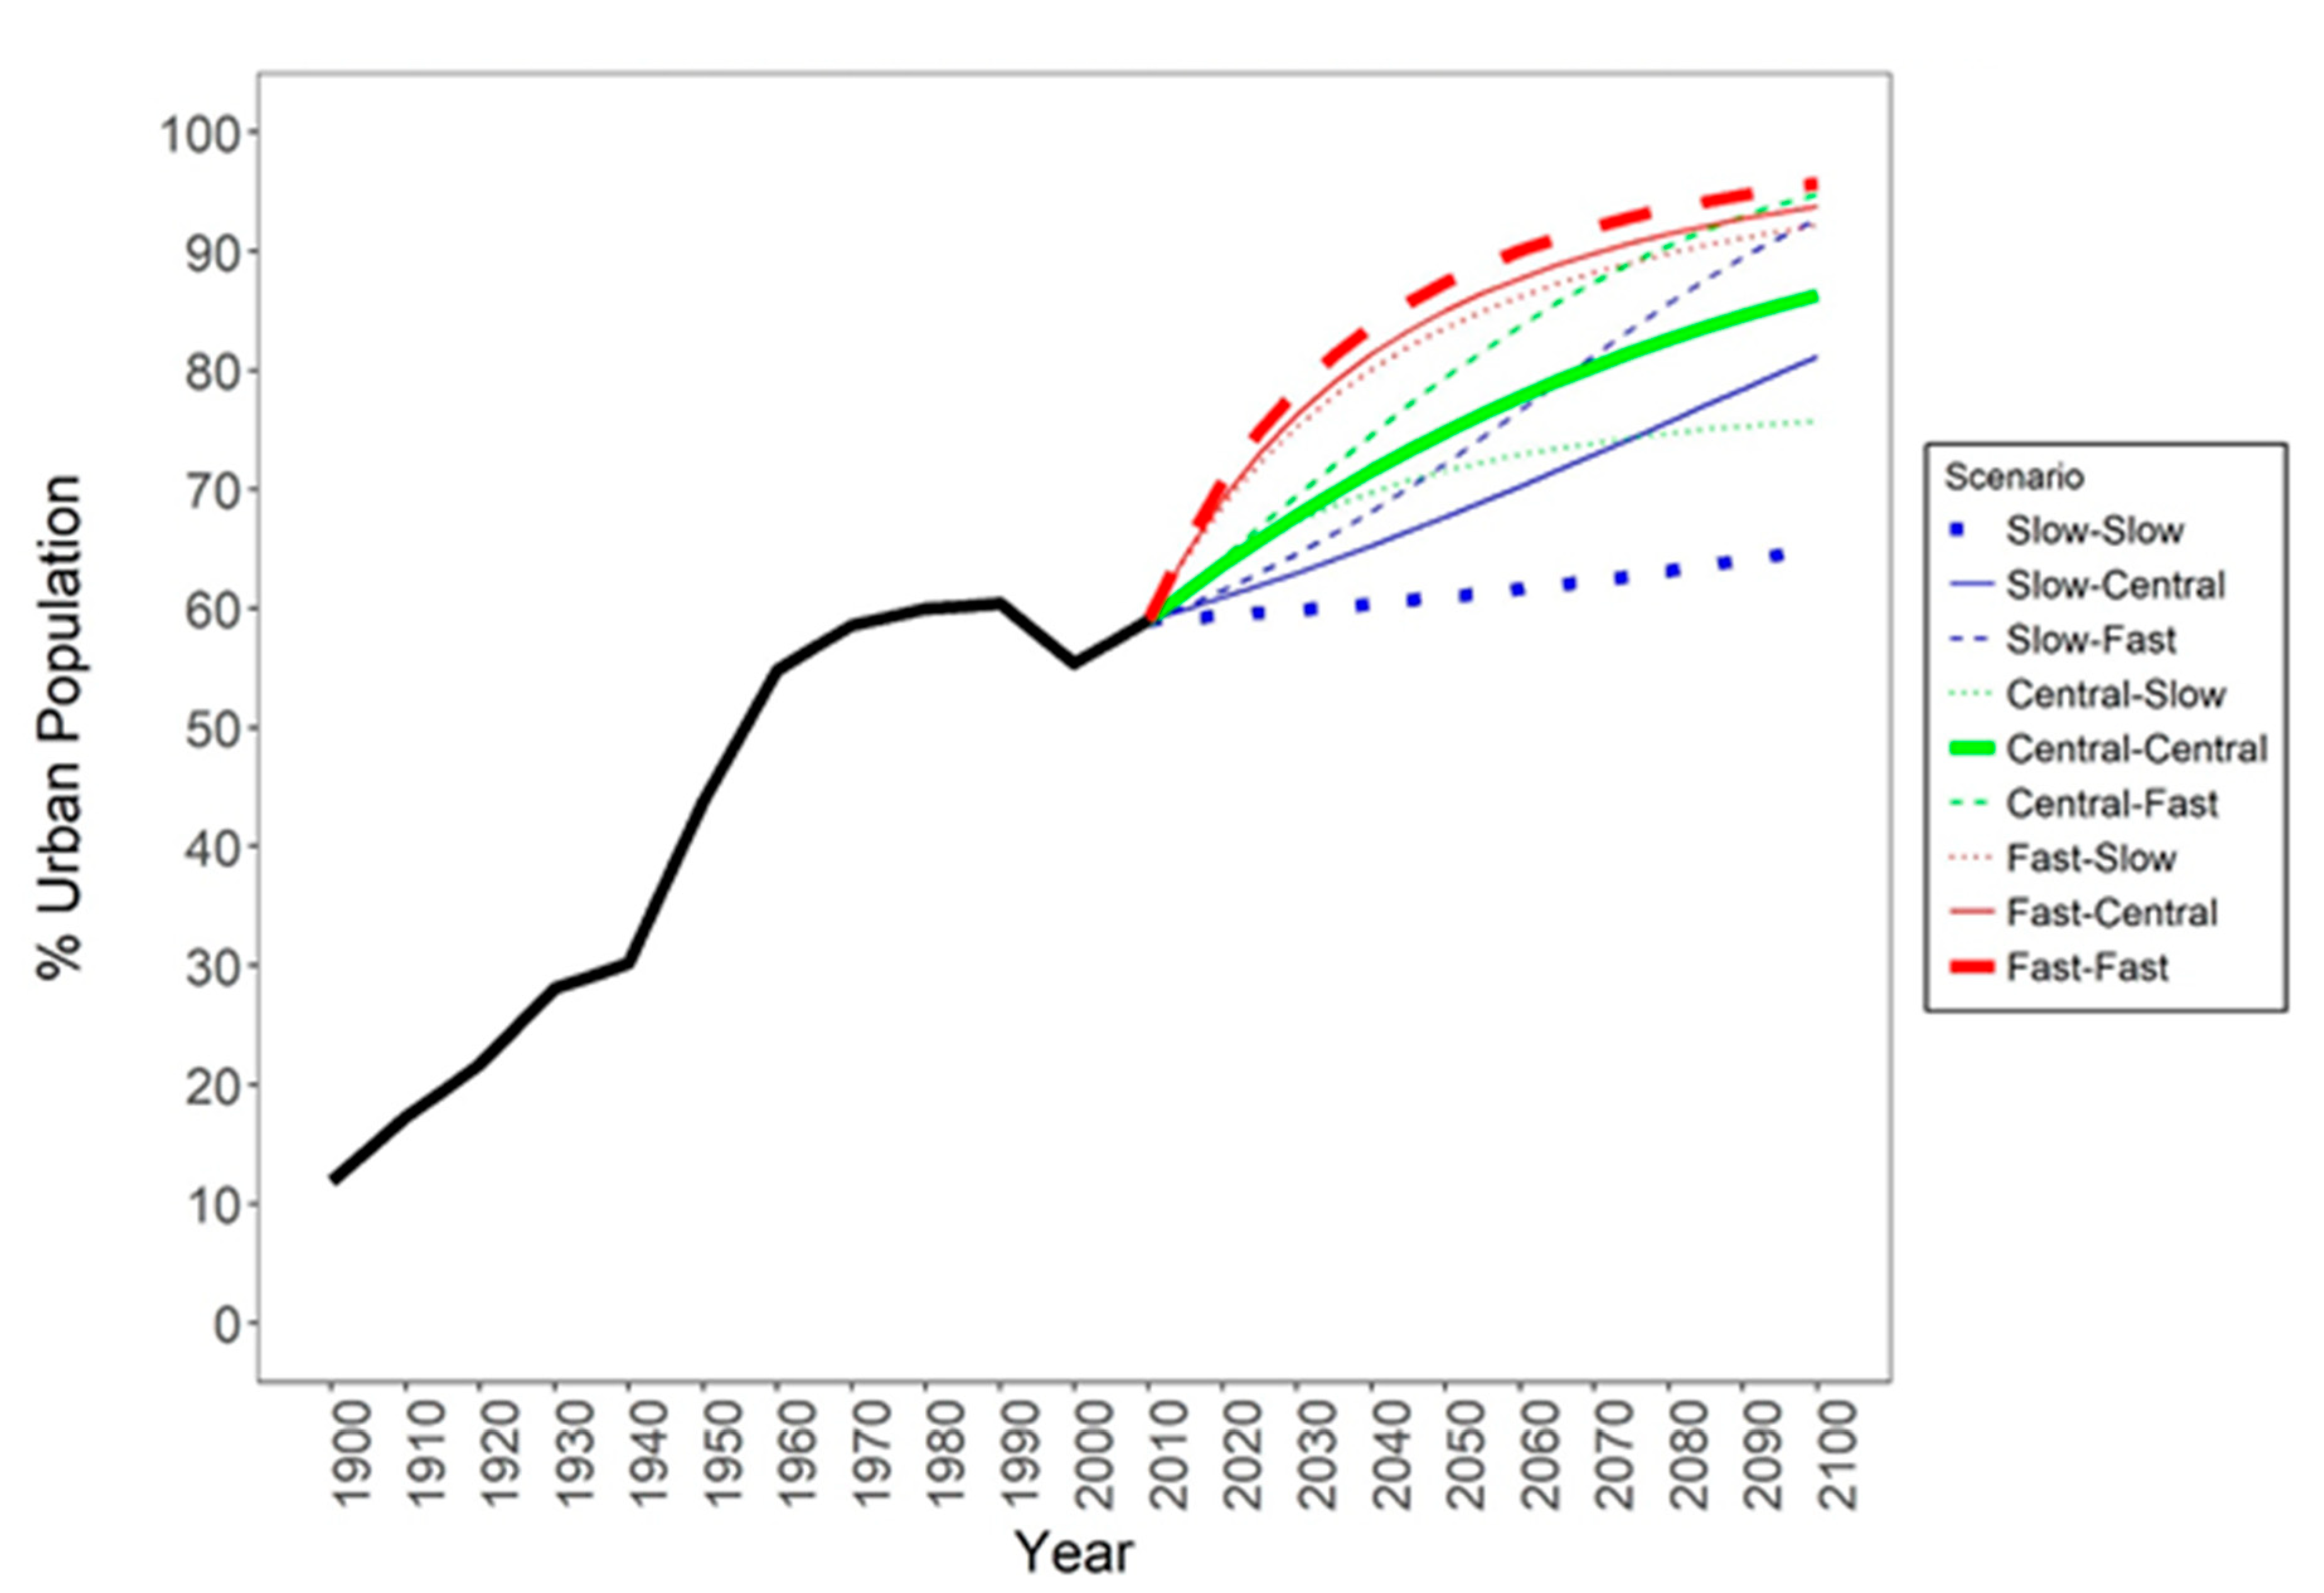
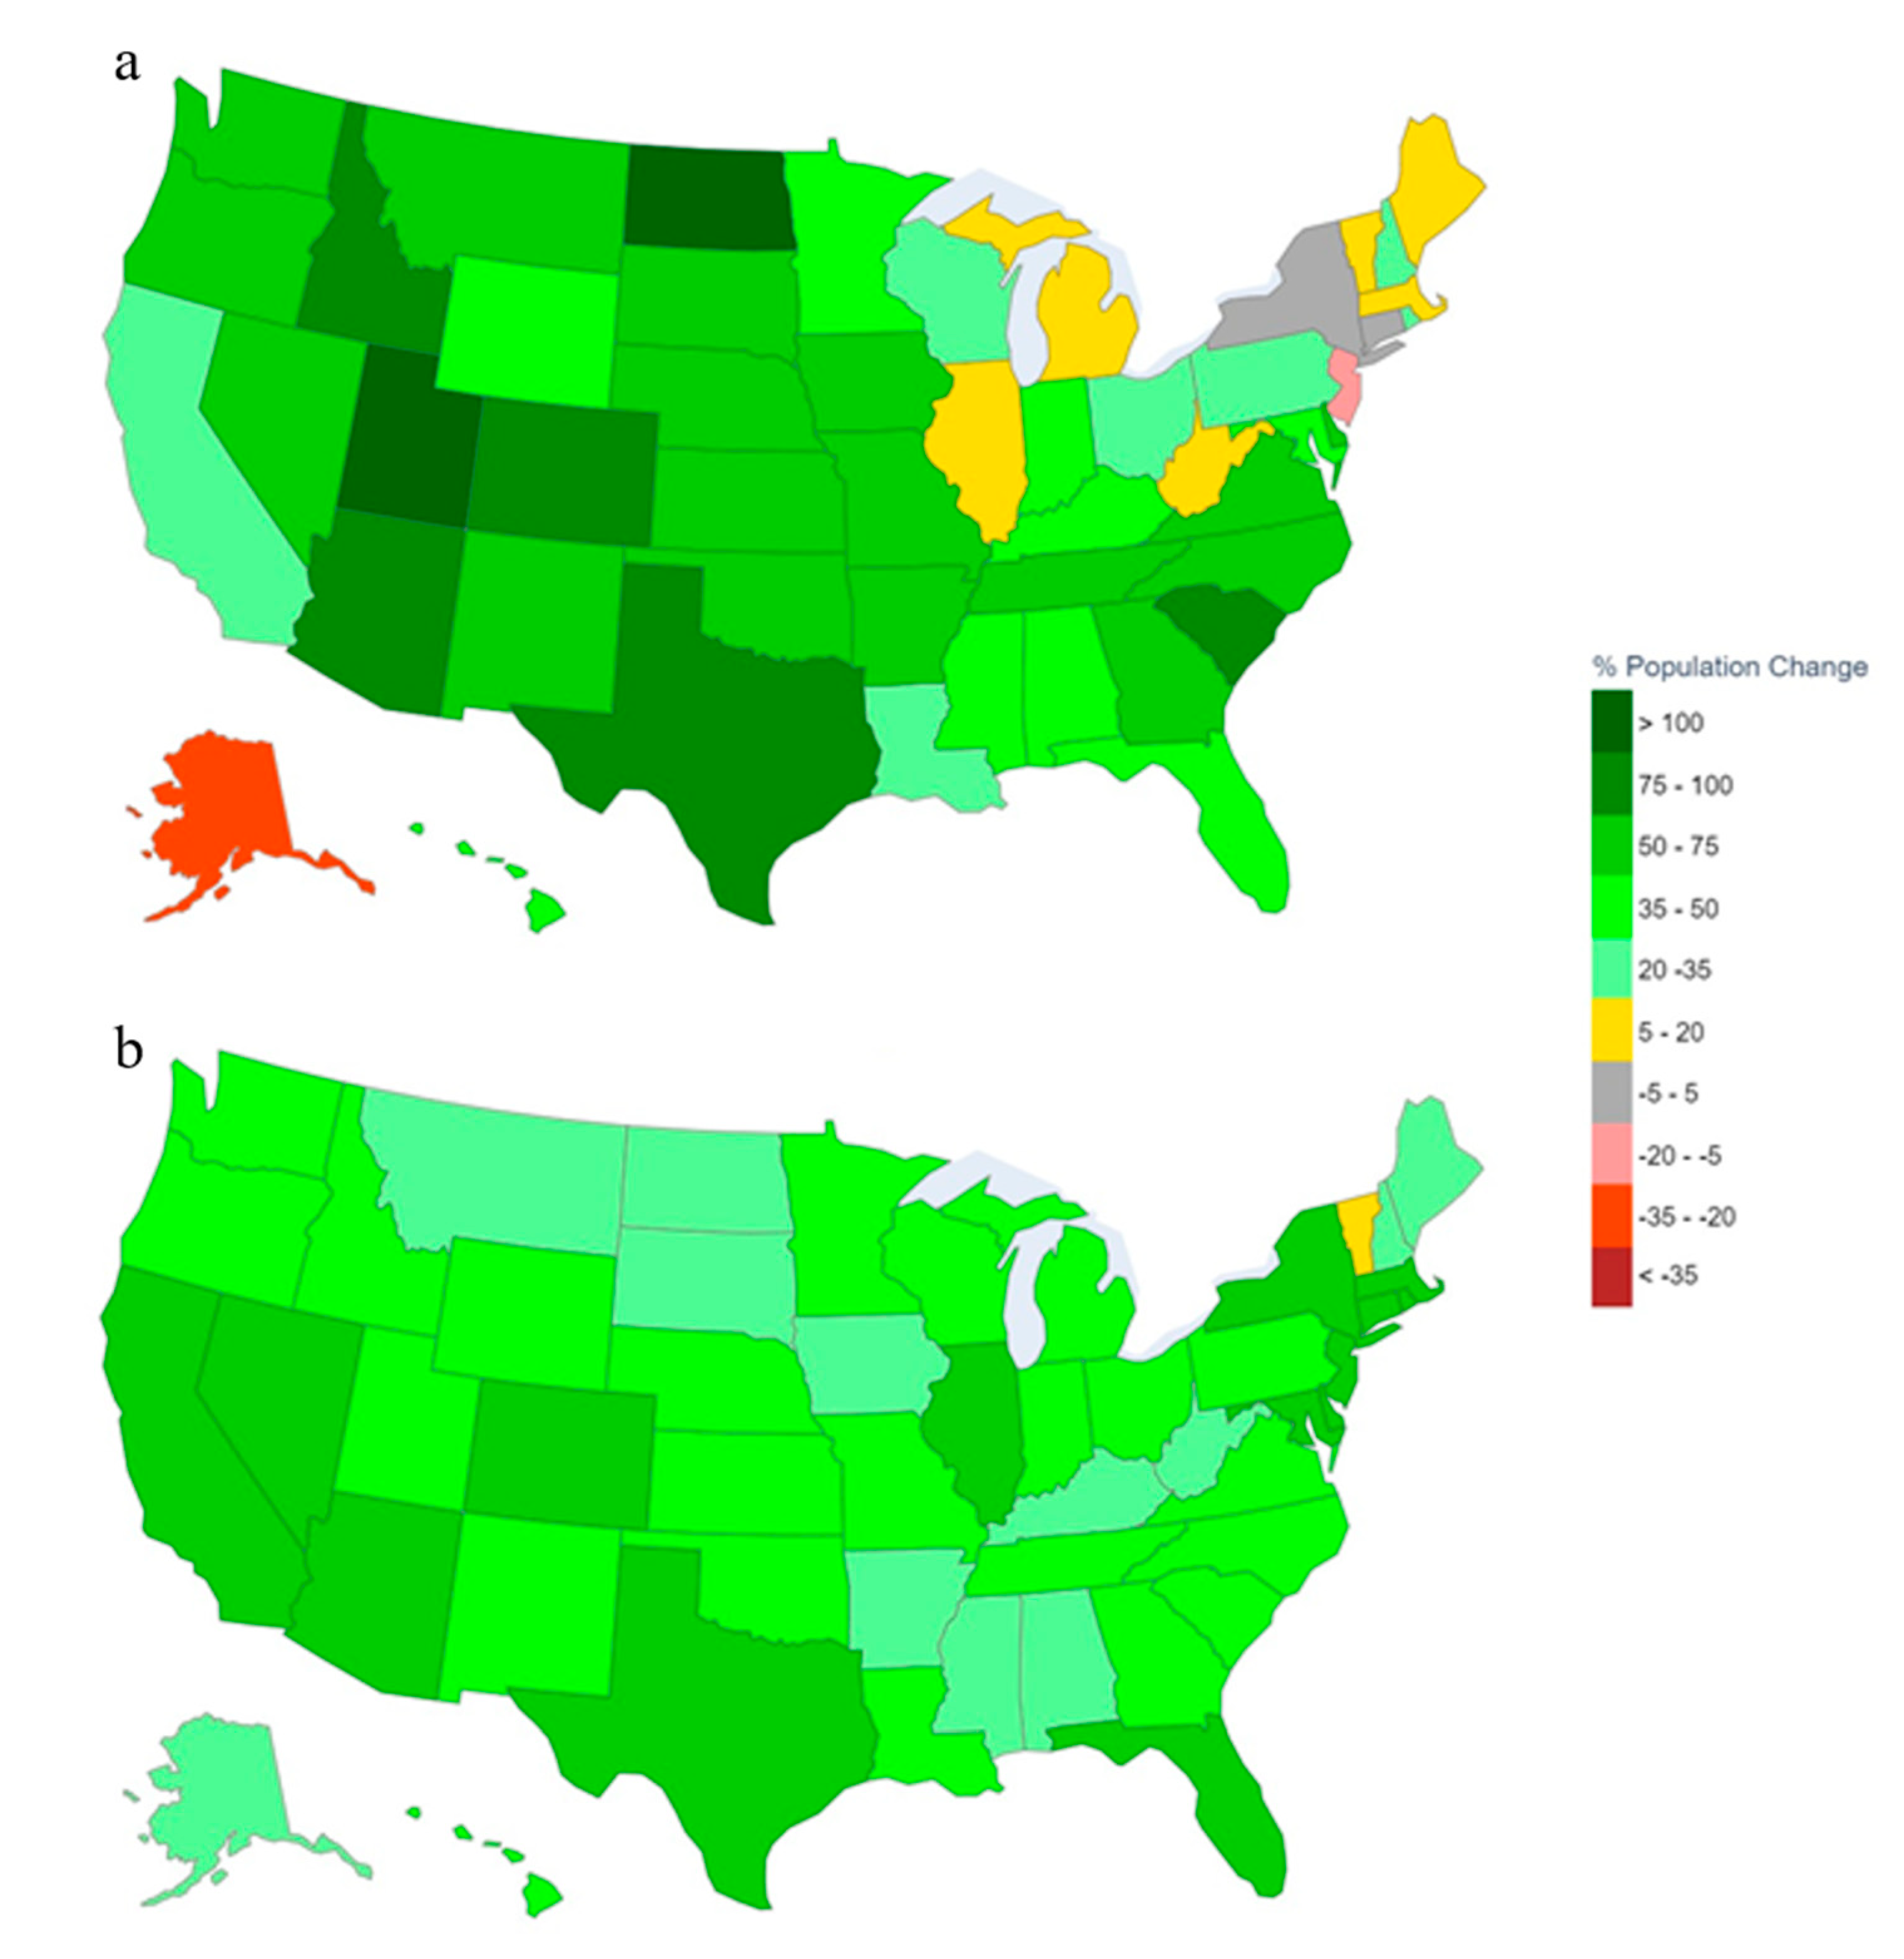
4.1.1. National SSP Projections
4.1.2. State level SSP Projections
4.2. Comparison to the Current National Model
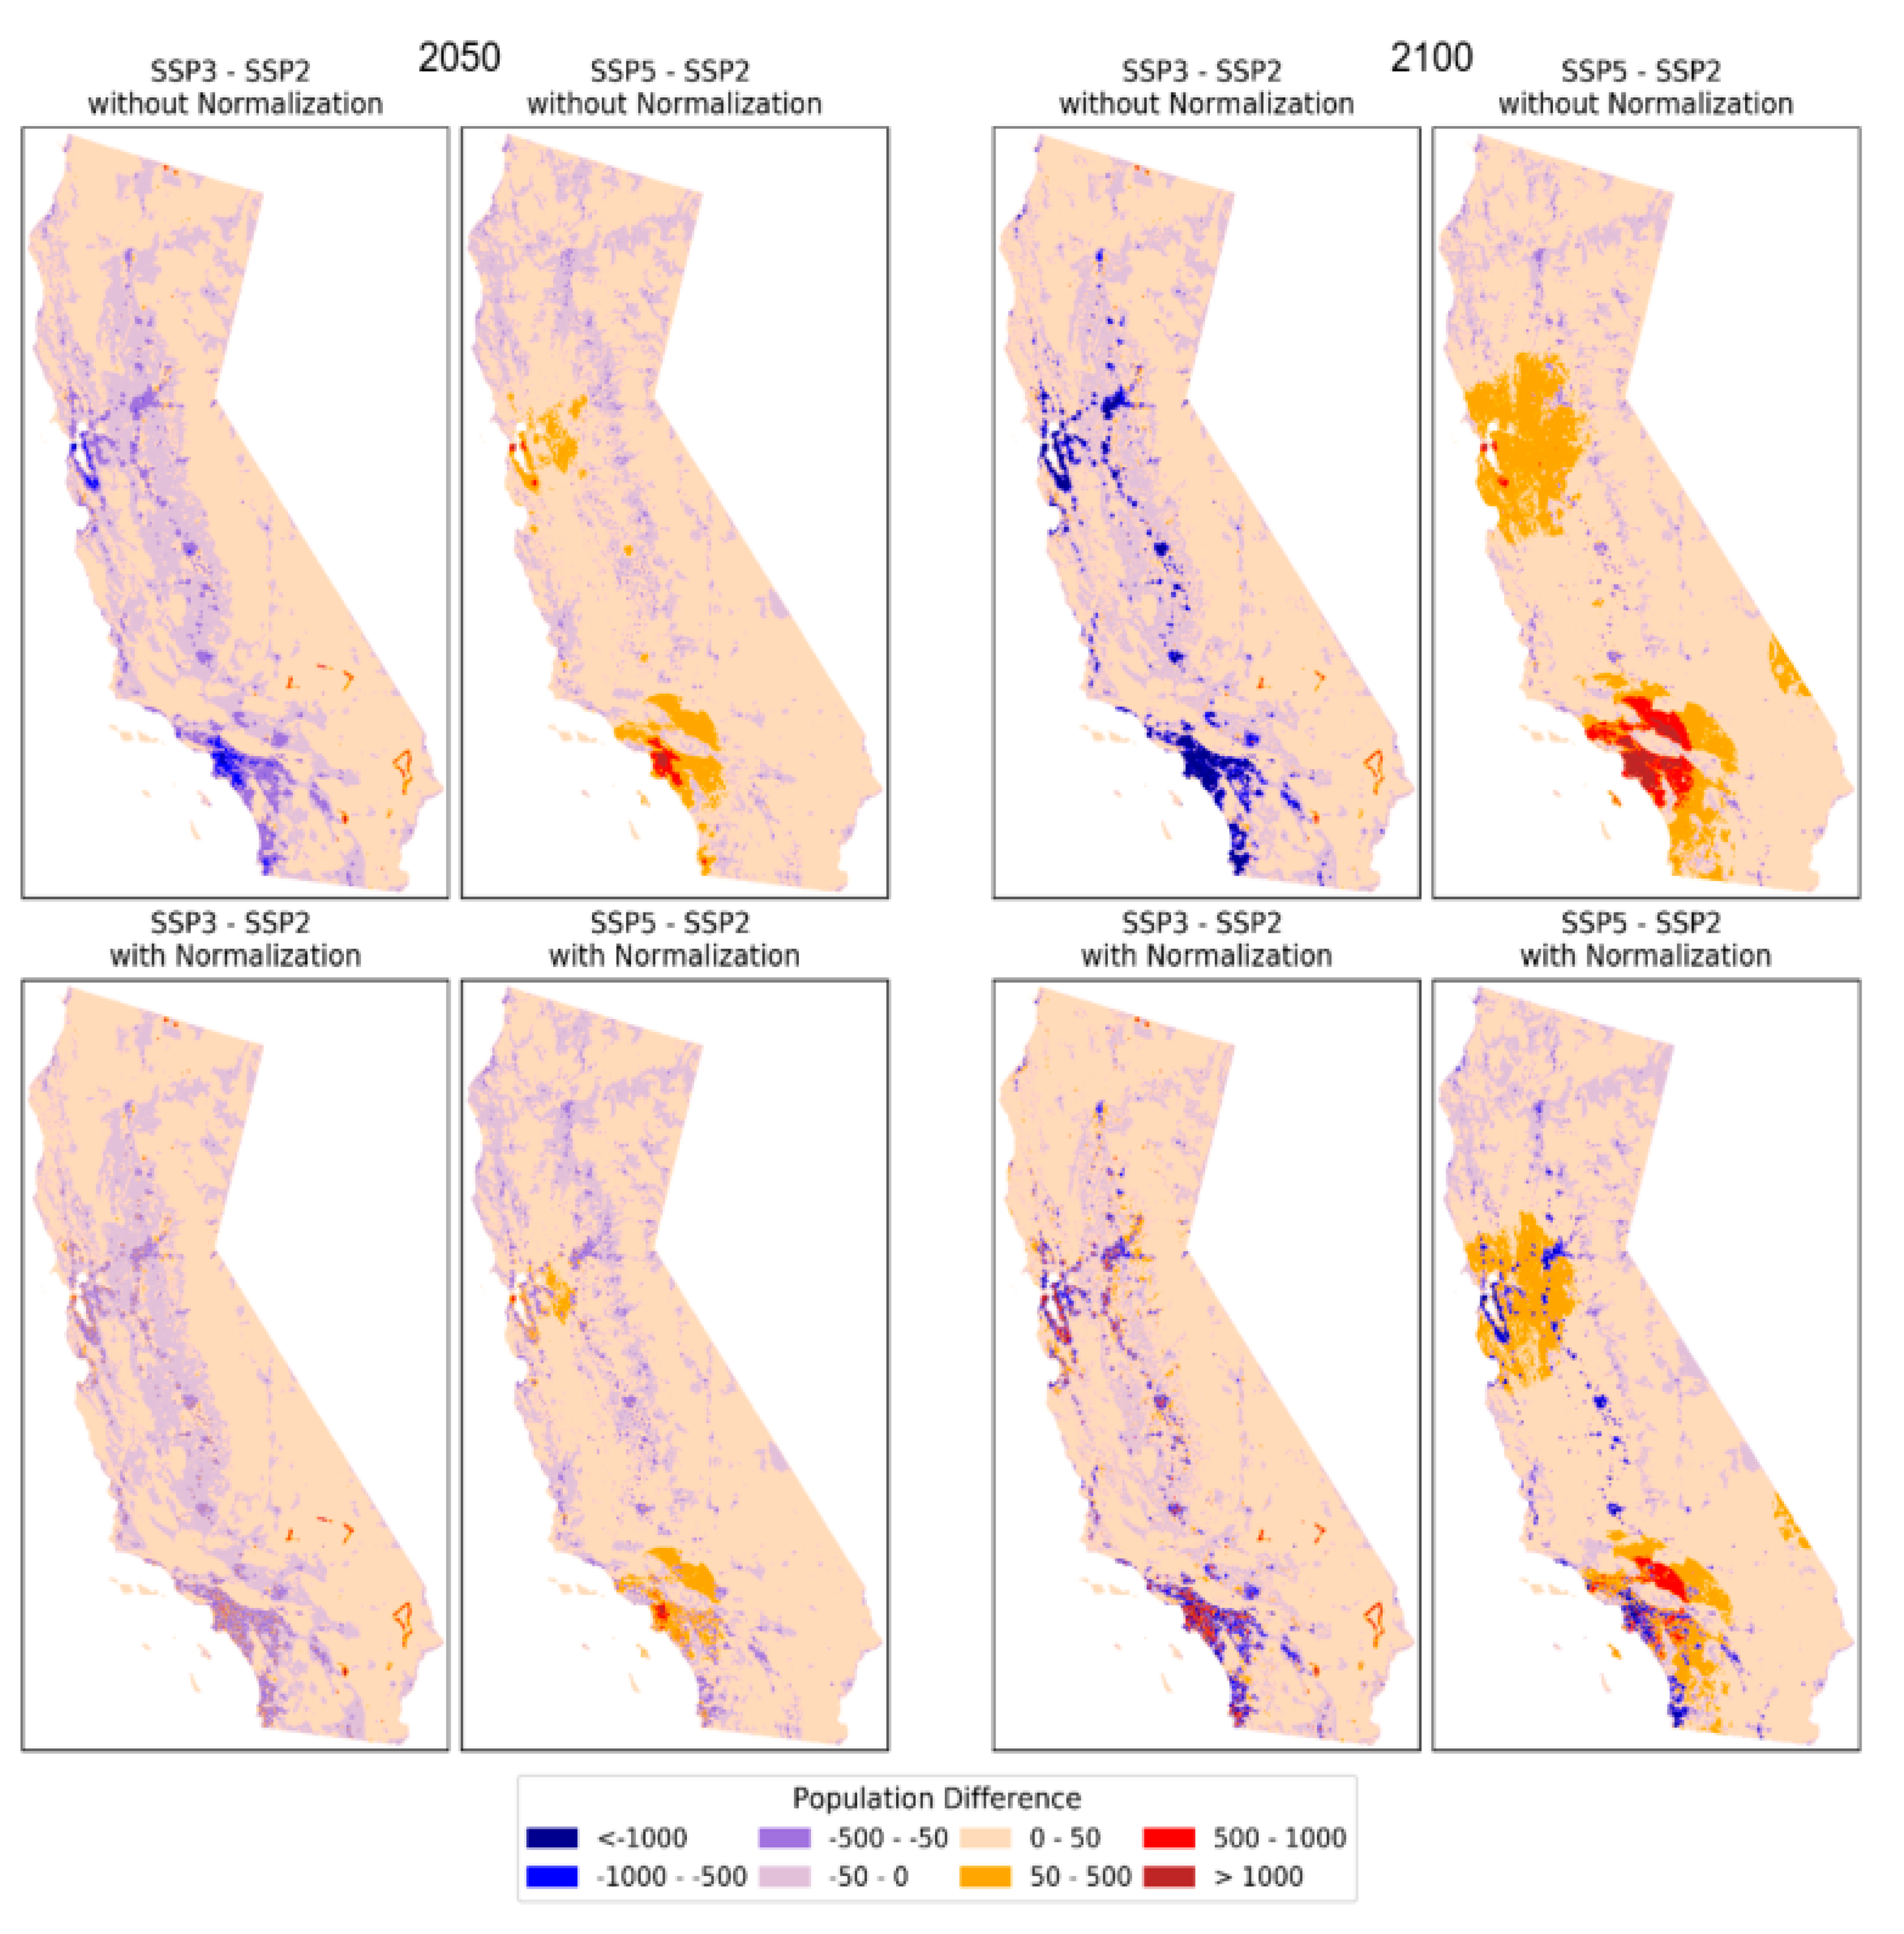
- The global model downscales SSP-based national population aggregates of each country [22] to its constituent grid cells whereas the state-level model downscales each U.S. state’s population [31] to its grid cells. The most important difference between these projections is that the state-level model produces redistribution of the population across states through differences in fertility, mortality, and (especially) migration at the state level while the global model does not (Appendix A.5 and Figure A8 in Appendix A as well as [36]).
- The global model uses a single set of spatial parameters that is estimated from data for the whole country, and are applied to the entire country while the state-level model estimates and applies parameters specific to each state (except for after 2050 in SSPs 3 and 5 when all states have the same parameters).
- The initial spatial resolution of the global model is 1/8° that has been downscaled to 1 km resolution grids [37]. The resolution of the state-level model is 1 km, and therefore we used the 1 km version of the global model for the comparison.
- The global model uses datasets that are globally available while the state-level model leverages datasets that are specific to the U.S.
- The base year of the global model is 2000, and it generates projections from 2010 to 2100 at 10-year intervals while the base year of the state-level model is 2010 and it creates population projection grids from 2020 to 2100 at the same interval.
5. Conclusions
Author Contributions
Acknowledgments
Conflicts of Interest
Appendix A
- State-level population projections
- State-level urbanization projections
- Estimated parameters of the population downscaling model
- SSP projections for New York
- Regional redistribution in state-level projections
- Population summary of Massachusetts and Utah
Appendix A.1. State-Level Population Projections


| State | SSP2 | SSP3 | SSP5 | ||||
|---|---|---|---|---|---|---|---|
| 2010 | 2050 | 2100 | 2050 | 2100 | 2050 | 2100 | |
| Alabama | 4780 | 5920 | 6980 | 5121 | 3918 | 6943 | 11,083 |
| Alaska | 710 | 488 | 526 | 422 | 299 | 495 | 726 |
| Arizona | 6249 | 9266 | 11,244 | 7967 | 6360 | 10,885 | 17,082 |
| Arkansas | 2916 | 3784 | 4607 | 3273 | 2595 | 4470 | 7339 |
| California | 37,235 | 44,103 | 46,730 | 38,852 | 27,360 | 48,540 | 68,917 |
| Colorado | 5027 | 7522 | 9208 | 6475 | 5187 | 8790 | 13,976 |
| Connecticut | 3574 | 3670 | 3625 | 3243 | 2133 | 4011 | 5360 |
| Delaware | 898 | 1268 | 1474 | 1084 | 824 | 1481 | 2204 |
| D.C. | 602 | 753 | 826 | 647 | 463 | 776 | 1108 |
| Florida | 18,801 | 23,010 | 26,004 | 19,684 | 14,105 | 27,256 | 40,716 |
| Georgia | 9688 | 13,109 | 15,454 | 11,321 | 8701 | 15,222 | 23,847 |
| Hawaii | 1360 | 1748 | 2019 | 1492 | 1132 | 1930 | 2855 |
| Idaho | 1568 | 2378 | 3018 | 2037 | 1729 | 2768 | 4498 |
| Illinois | 12,830 | 13,338 | 13,484 | 11,781 | 7854 | 14,366 | 19,769 |
| Indiana | 6425 | 7933 | 8981 | 6897 | 5209 | 8867 | 13,146 |
| Iowa | 3046 | 3924 | 4770 | 3427 | 2840 | 4457 | 7057 |
| Kansas | 2853 | 3872 | 4770 | 3336 | 2751 | 4395 | 7015 |
| Kentucky | 4339 | 5450 | 6425 | 4736 | 3661 | 6374 | 10,116 |
| Louisiana | 4533 | 5249 | 5950 | 4574 | 3364 | 5947 | 9248 |
| Maine | 1328 | 1373 | 1433 | 1197 | 809 | 1599 | 2287 |
| Maryland | 5774 | 7047 | 7869 | 6087 | 4409 | 7973 | 11,708 |
| Massachusetts | 6548 | 7455 | 7816 | 6488 | 4444 | 8270 | 11,434 |
| Michigan | 9884 | 10,298 | 10,696 | 9048 | 6340 | 11,043 | 15,114 |
| Minnesota | 5304 | 6443 | 7312 | 5648 | 4356 | 7168 | 10,676 |
| Mississippi | 2967 | 3514 | 4022 | 3046 | 2262 | 4013 | 6255 |
| Missouri | 5989 | 7665 | 9159 | 6593 | 5138 | 8812 | 13,840 |
| Montana | 989 | 1266 | 1543 | 1095 | 868 | 1500 | 2424 |
| Nebraska | 1826 | 2497 | 3170 | 2170 | 1905 | 2813 | 4544 |
| Nevada | 2701 | 3779 | 4420 | 3259 | 2475 | 4406 | 6729 |
| New Hampshire | 1316 | 1526 | 1630 | 1331 | 951 | 1720 | 2427 |
| New Jersey | 8792 | 8313 | 7637 | 7343 | 4460 | 8757 | 10,824 |
| New Mexico | 2059 | 2710 | 3275 | 2335 | 1871 | 3072 | 4829 |
| New York | 19,376 | 19,478 | 18,695 | 17,210 | 10,952 | 20,492 | 26,174 |
| North Carolina | 9535 | 13,485 | 16,259 | 11,510 | 8935 | 15,963 | 25,170 |
| North Dakota | 673 | 1047 | 1345 | 916 | 820 | 1194 | 1944 |
| Ohio | 11,537 | 12,834 | 14,024 | 11,214 | 8120 | 14,404 | 21,145 |
| Oklahoma | 3751 | 4954 | 6105 | 4310 | 3486 | 5843 | 9735 |
| Oregon | 3831 | 5303 | 6375 | 4554 | 3498 | 6356 | 10,109 |
| Pennsylvania | 12,702 | 14,403 | 15,503 | 12,542 | 8880 | 16,267 | 23,213 |
| Rhode Island | 1053 | 1199 | 1278 | 1046 | 746 | 1321 | 1846 |
| South Carolina | 4625 | 6661 | 8244 | 5687 | 4551 | 8015 | 12,984 |
| South Dakota | 814 | 1057 | 1295 | 928 | 775 | 1200 | 1924 |
| Tennessee | 6346 | 8110 | 9599 | 7006 | 5385 | 9537 | 15,157 |
| Texas | 25,146 | 36,665 | 45,331 | 31,800 | 25,939 | 42,781 | 70,405 |
| Utah | 2764 | 4765 | 6449 | 4140 | 3957 | 5314 | 8870 |
| Vermont | 626 | 642 | 662 | 564 | 379 | 724 | 1011 |
| Virginia | 8001 | 10,850 | 12,704 | 9287 | 7041 | 12,412 | 18,859 |
| Washington | 6725 | 9513 | 11,524 | 8161 | 6395 | 11,176 | 17,738 |
| West Virginia | 1853 | 1861 | 1996 | 1637 | 1129 | 2165 | 3259 |
| Wisconsin | 5687 | 6460 | 6883 | 5679 | 4031 | 7224 | 10,317 |
| Wyoming | 564 | 696 | 839 | 606 | 483 | 795 | 1260 |
Appendix A.2. State-Level Urbanization Projections

| State | SSP2 | SSP3 | SSP5 | ||||
|---|---|---|---|---|---|---|---|
| 2010 | 2050 | 2100 | 2050 | 2100 | 2050 | 2100 | |
| Alabama | 59.0 | 74.9 | 86.3 | 61.0 | 65.0 | 87.4 | 95.7 |
| Alaska | 66.0 | 79.7 | 89.2 | 67.7 | 70.9 | 88.6 | 96.1 |
| Arizona | 89.6 | 94.4 | 97.9 | 89.0 | 87.7 | 97.7 | 99.7 |
| Arkansas | 56.2 | 73.1 | 83.1 | 58.1 | 62.9 | 88.2 | 98.4 |
| California | 95.0 | 97.0 | 98.5 | 90.8 | 87.9 | 99.0 | 99.6 |
| Colorado | 86.2 | 92.9 | 96.2 | 86.6 | 86.8 | 97.1 | 99.0 |
| Connecticut | 88.0 | 93.9 | 97.3 | 88.4 | 88.7 | 97.1 | 98.8 |
| Delaware | 83.3 | 90.6 | 95.1 | 84.9 | 87.0 | 95.6 | 98.7 |
| D.C. | 100.0 | 100.0 | 100.0 | 100.0 | 100.0 | 100.0 | 100.0 |
| Florida | 91.2 | 95.0 | 98.8 | 89.4 | 86.9 | 98.3 | 99.8 |
| Georgia | 75.1 | 85.5 | 91.7 | 78.1 | 81.5 | 94.3 | 99.1 |
| Hawaii | 91.9 | 96.3 | 98.7 | 90.0 | 87.5 | 98.0 | 99.2 |
| Idaho | 70.6 | 82.4 | 91.3 | 72.3 | 75.4 | 94.6 | 99.4 |
| Illinois | 88.5 | 94.3 | 97.9 | 88.2 | 88.0 | 97.8 | 99.3 |
| Indiana | 72.3 | 84.4 | 93.0 | 74.7 | 78.8 | 95.6 | 99.5 |
| Iowa | 64.0 | 77.0 | 87.1 | 65.6 | 68.7 | 87.1 | 95.0 |
| Kansas | 74.2 | 85.1 | 91.8 | 76.7 | 80.0 | 94.6 | 98.9 |
| Kentucky | 58.4 | 74.7 | 85.8 | 60.3 | 64.0 | 87.9 | 98.0 |
| Louisiana | 73.2 | 84.6 | 93.1 | 75.8 | 79.1 | 94.5 | 99.1 |
| Maine | 38.7 | 60.2 | 76.0 | 39.8 | 43.4 | 78.1 | 92.7 |
| Maryland | 87.2 | 93.3 | 97.2 | 87.1 | 87.1 | 97.4 | 98.9 |
| Massachusetts | 92.0 | 96.4 | 98.9 | 89.6 | 86.7 | 98.6 | 99.8 |
| Michigan | 74.6 | 85.7 | 92.0 | 77.8 | 82.1 | 94.5 | 98.7 |
| Minnesota | 73.3 | 84.4 | 93.3 | 75.3 | 78.5 | 94.6 | 99.1 |
| Mississippi | 49.4 | 68.0 | 82.3 | 51.0 | 58.0 | 83.9 | 96.2 |
| Missouri | 70.4 | 83.2 | 91.1 | 71.4 | 74.4 | 95.2 | 99.6 |
| Montana | 55.9 | 72.4 | 82.8 | 57.9 | 62.8 | 87.2 | 97.7 |
| Nebraska | 73.1 | 84.2 | 93.0 | 75.5 | 78.6 | 94.6 | 99.4 |
| Nevada | 94.2 | 97.2 | 99.3 | 90.7 | 86.8 | 98.9 | 99.7 |
| New Hampshire | 60.3 | 74.9 | 86.7 | 62.2 | 65.6 | 87.7 | 95.7 |
| New Jersey | 94.7 | 96.7 | 97.9 | 90.1 | 87.3 | 98.9 | 99.7 |
| New Mexico | 77.4 | 87.3 | 93.0 | 79.9 | 83.6 | 94.7 | 99.1 |
| New York | 87.9 | 93.7 | 97.2 | 88.4 | 89.2 | 97.0 | 98.7 |
| North Carolina | 66.1 | 78.8 | 88.4 | 68.3 | 71.6 | 88.4 | 96.2 |
| North Dakota | 59.9 | 75.1 | 86.6 | 62.1 | 65.9 | 87.7 | 96.2 |
| Ohio | 77.9 | 87.6 | 93.2 | 81.1 | 85.2 | 94.6 | 99.2 |
| Oklahoma | 66.2 | 79.8 | 89.2 | 68.0 | 71.4 | 88.8 | 96.3 |
| Oregon | 81.0 | 89.3 | 94.7 | 83.1 | 85.0 | 96.0 | 99.0 |
| Pennsylvania | 78.7 | 87.9 | 93.0 | 80.7 | 85.1 | 95.3 | 99.3 |
| Rhode Island | 90.7 | 95.1 | 98.4 | 89.5 | 87.8 | 98.3 | 99.8 |
| South Carolina | 66.3 | 78.9 | 88.3 | 68.6 | 72.1 | 88.5 | 96.1 |
| South Dakota | 56.7 | 73.2 | 83.3 | 59.0 | 64.4 | 86.0 | 96.4 |
| Tennessee | 66.4 | 79.5 | 89.1 | 68.0 | 71.4 | 89.1 | 96.6 |
| Texas | 84.7 | 91.2 | 95.0 | 86.2 | 87.6 | 96.4 | 99.0 |
| Utah | 90.6 | 94.7 | 98.2 | 90.2 | 88.6 | 97.3 | 99.0 |
| Vermont | 38.9 | 60.2 | 76.0 | 39.6 | 41.8 | 79.2 | 94.0 |
| Virginia | 75.5 | 86.0 | 91.8 | 78.1 | 81.7 | 94.4 | 99.4 |
| Washington | 84.1 | 91.1 | 95.0 | 85.9 | 87.4 | 96.1 | 98.8 |
| West Virginia | 48.7 | 66.2 | 81.4 | 50.1 | 57.0 | 83.7 | 96.0 |
| Wisconsin | 70.2 | 82.4 | 91.1 | 71.7 | 75.2 | 94.7 | 99.4 |
| Wyoming | 64.8 | 78.0 | 88.0 | 66.6 | 69.7 | 88.1 | 96.1 |
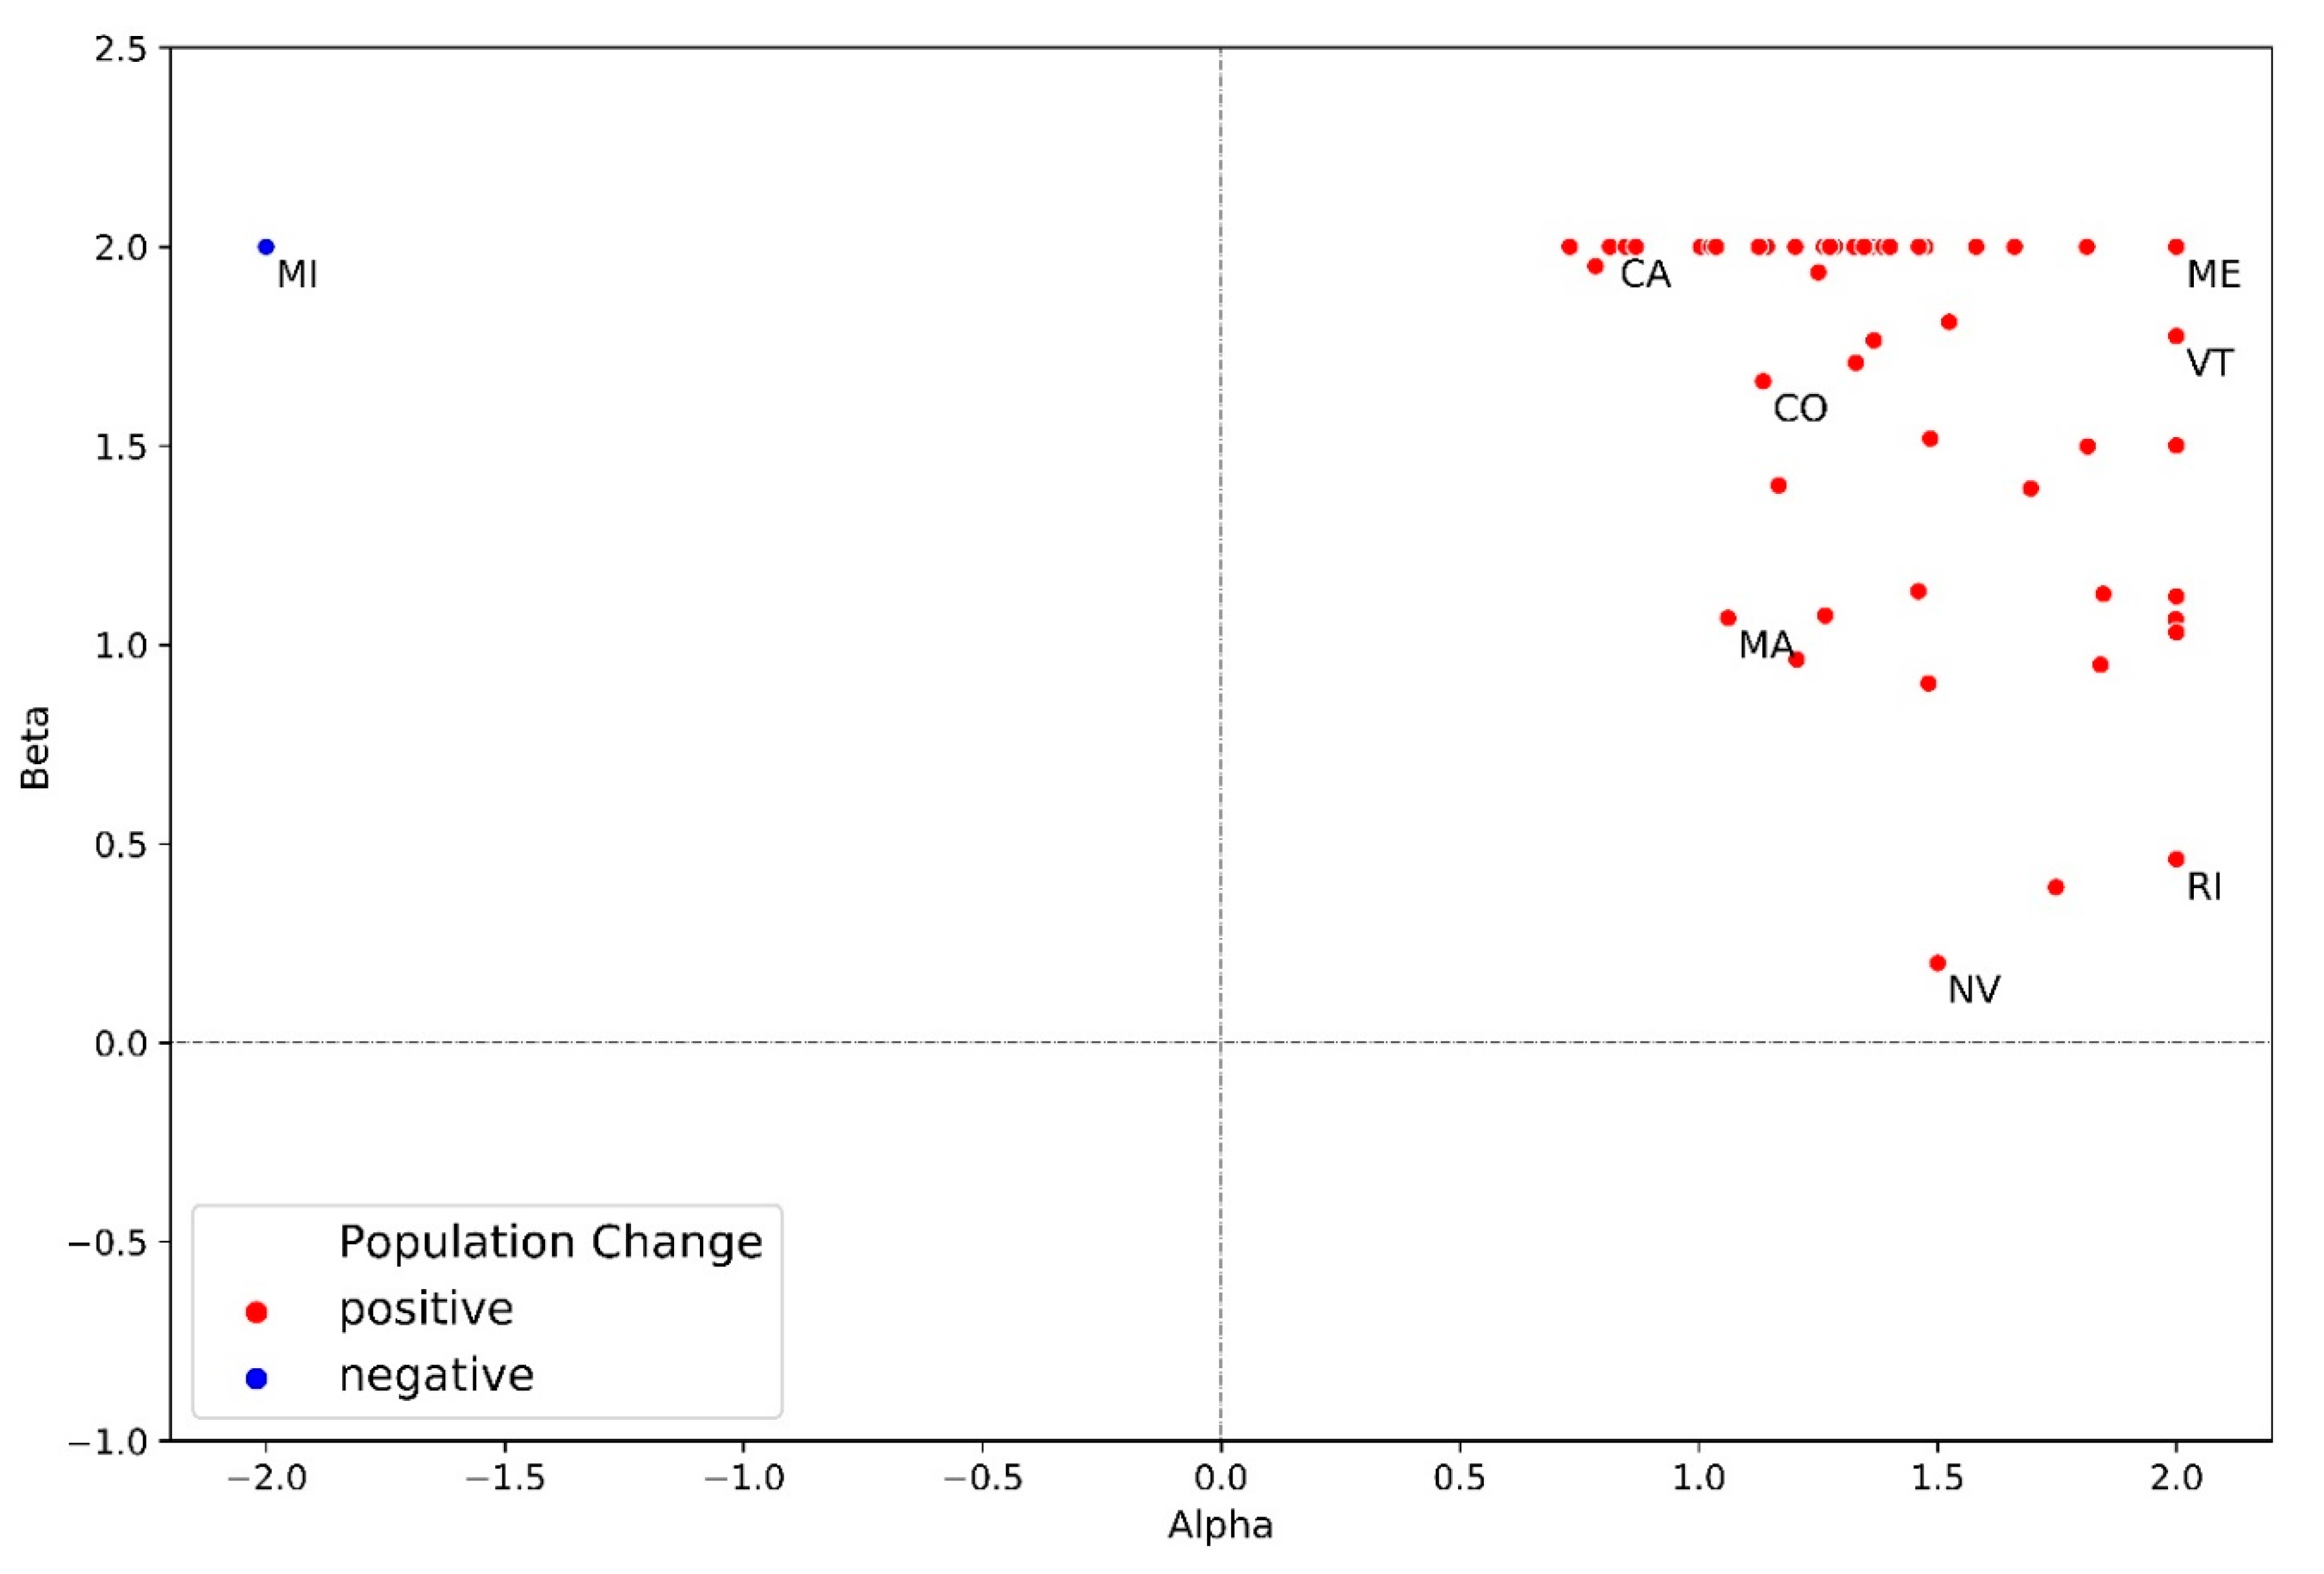
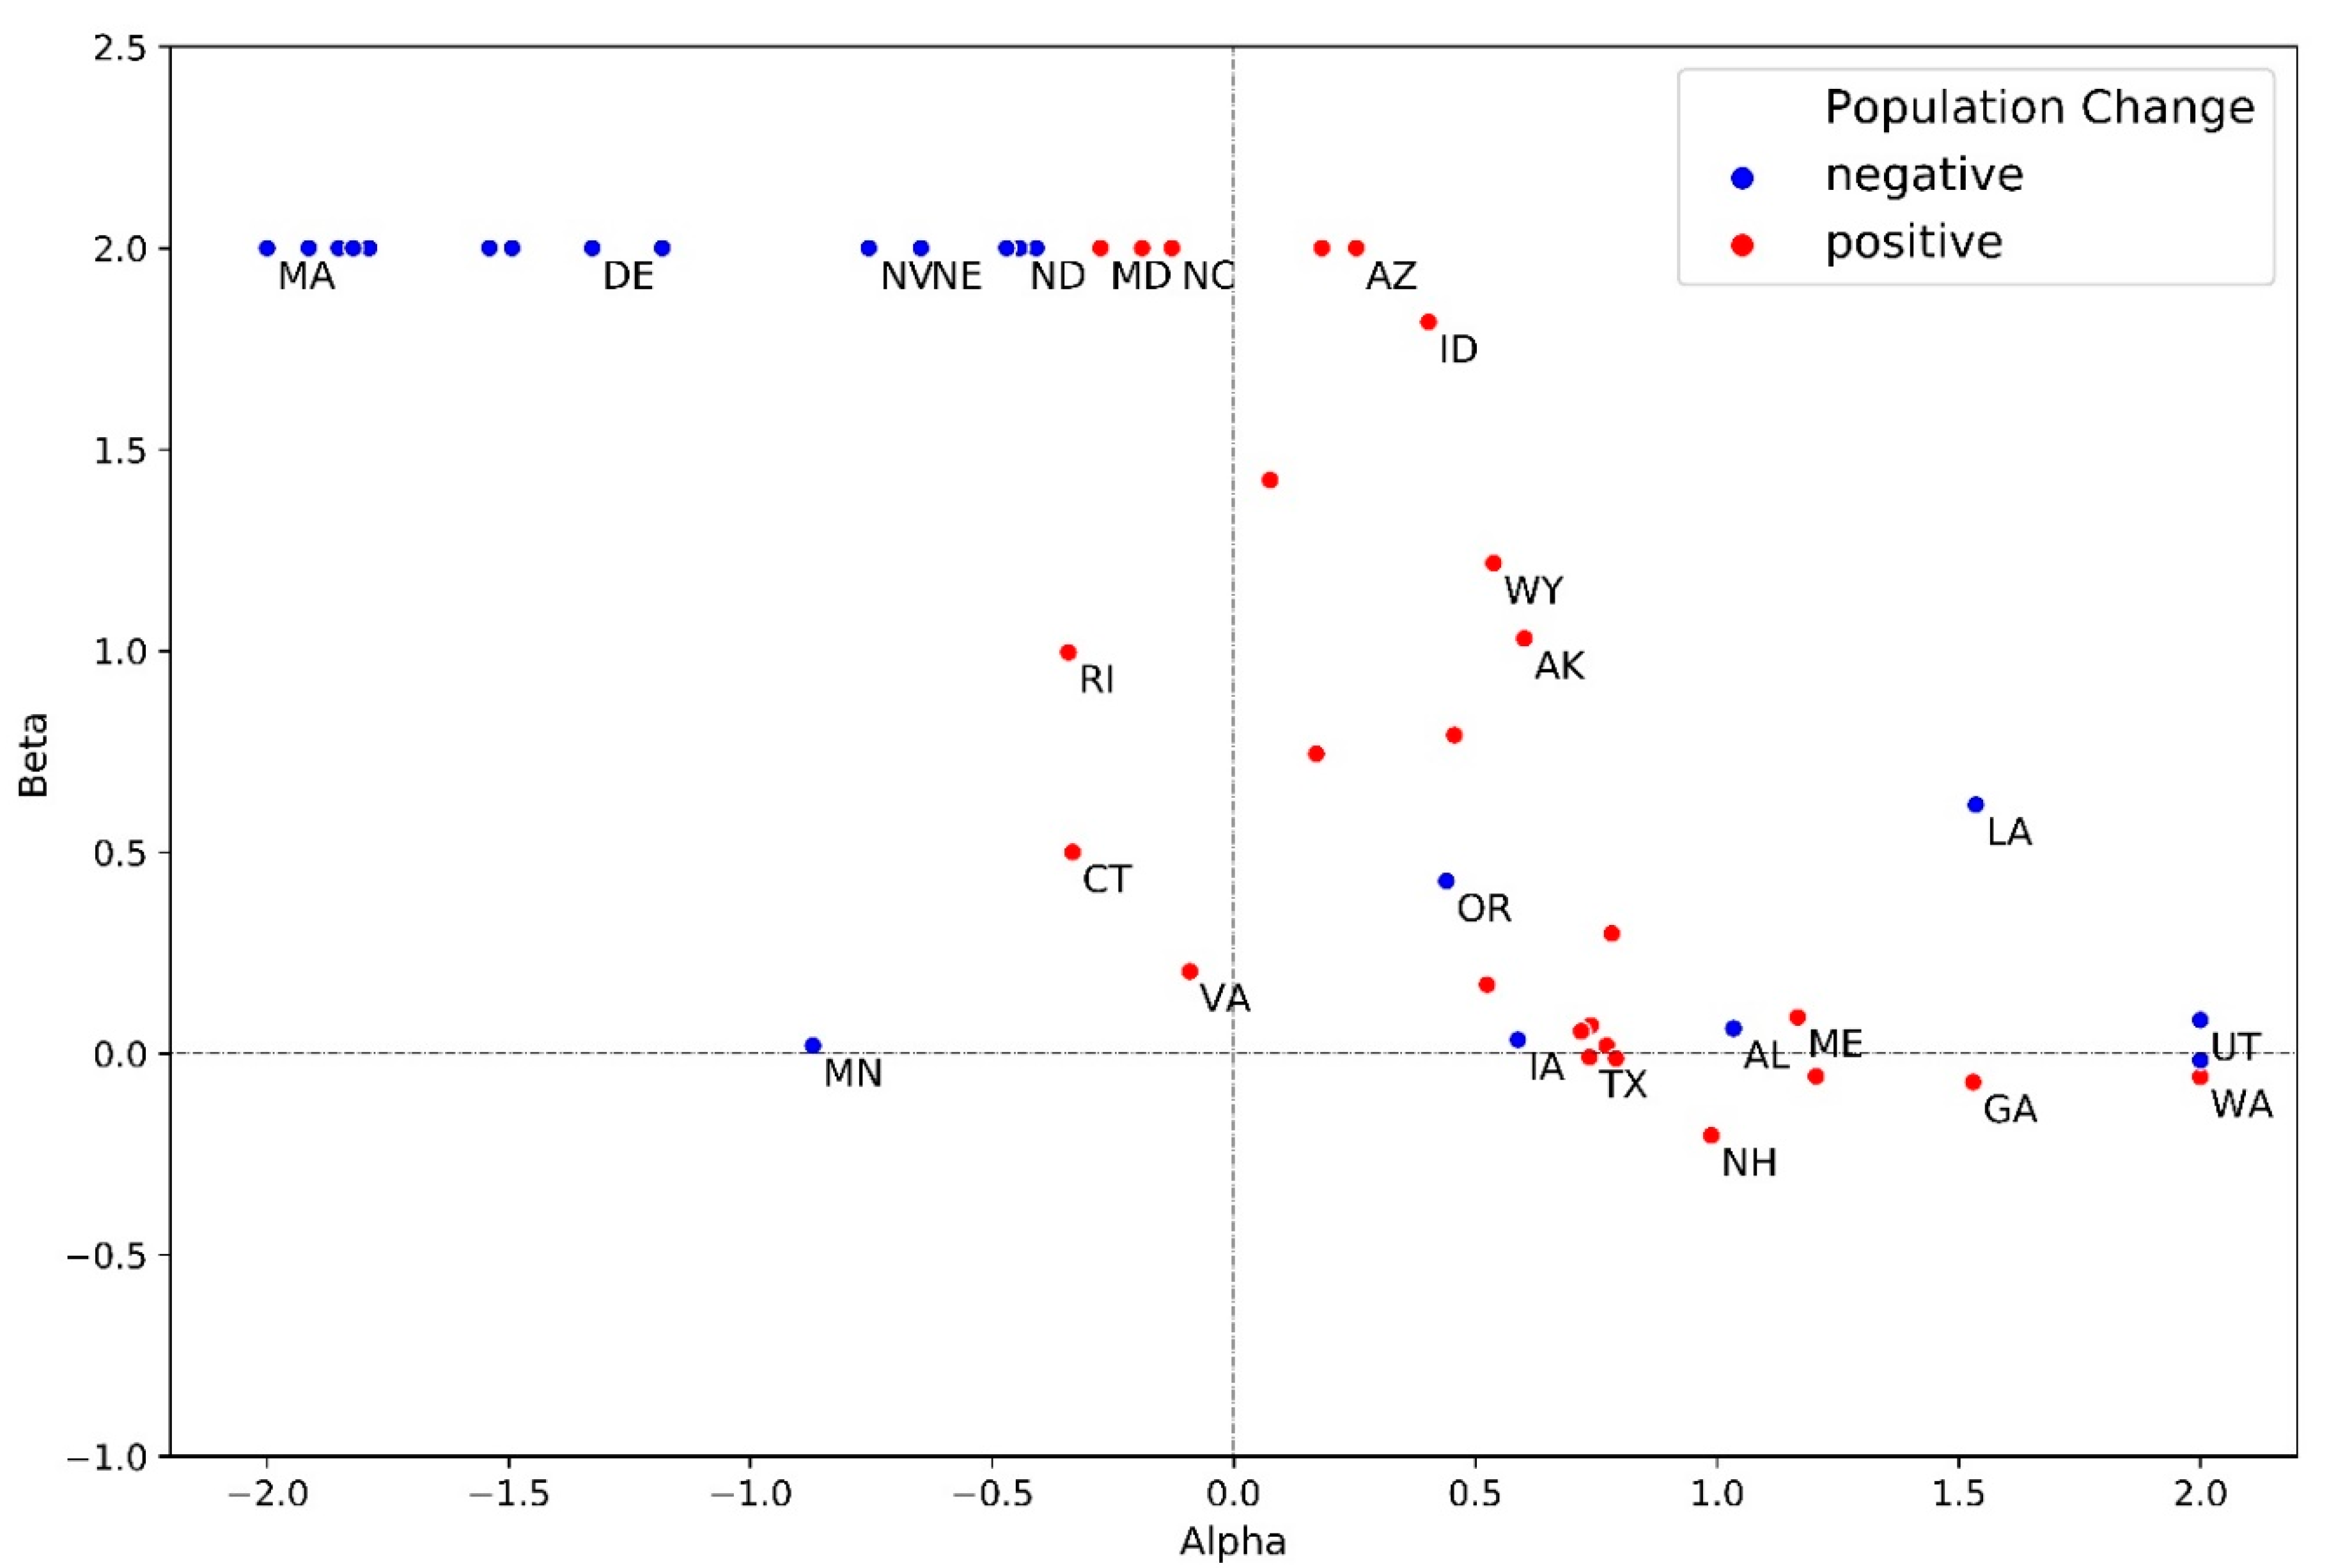
Appendix A.3. Estimated Parameters of The Population Downscaling Model


| State | Alpha (Rural) | Beta (Rural) | Alpha (Urban) | Beta (Urban) |
|---|---|---|---|---|
| Alabama | 1.03 | 0.06 | 1.47 | 2.00 |
| Alaska | 0.60 | 1.03 | 1.36 | 2.00 |
| Arizona | 0.25 | 2.00 | 0.84 | 2.00 |
| Arkansas | 0.52 | 0.17 | 1.69 | 1.39 |
| California | −1.79 | 2.00 | 0.81 | 2.00 |
| Colorado | 0.77 | 0.02 | 1.13 | 1.66 |
| Connecticut | −0.33 | 0.50 | 1.20 | 2.00 |
| Delaware | −1.33 | 2.00 | 0.73 | 2.00 |
| D.C. | - | - | 2.00 | 1.50 |
| Florida | −1.54 | 2.00 | 0.78 | 1.95 |
| Georgia | 1.53 | −0.07 | 1.17 | 1.40 |
| Hawaii | 0.18 | 2.00 | 1.00 | 2.00 |
| Idaho | 0.40 | 1.82 | 1.48 | 1.52 |
| Illinois | −1.18 | 2.00 | 1.03 | 2.00 |
| Indiana | −0.19 | 2.00 | 1.37 | 1.76 |
| Iowa | 0.59 | 0.03 | 1.81 | 1.50 |
| Kansas | −0.41 | 2.00 | 1.52 | 1.81 |
| Kentucky | 1.20 | −0.06 | 1.46 | 2.00 |
| Louisiana | 1.54 | 0.62 | 1.14 | 2.00 |
| Maine | 1.17 | 0.09 | 2.00 | 2.00 |
| Maryland | −0.28 | 2.00 | 1.04 | 2.00 |
| Massachusetts | −2.00 | 2.00 | 1.06 | 1.07 |
| Michigan | −2.00 | 2.00 | −2.00 | 2.00 |
| Minnesota | −0.87 | 0.02 | 1.25 | 1.94 |
| Mississippi | 0.74 | 0.07 | 2.00 | 1.06 |
| Missouri | 0.17 | 0.74 | 1.28 | 2.00 |
| Montana | 0.78 | 0.30 | 1.58 | 2.00 |
| Nebraska | −0.65 | 2.00 | 1.84 | 0.95 |
| Nevada | −0.75 | 2.00 | 1.50 | 0.20 |
| New Hampshire | 0.99 | −0.20 | 1.48 | 0.90 |
| New Jersey | −1.85 | 2.00 | 0.85 | 2.00 |
| New Mexico | 0.46 | 0.79 | 1.33 | 2.00 |
| New York | −1.82 | 2.00 | 1.39 | 2.00 |
| North Carolina | −0.13 | 2.00 | 1.75 | 0.39 |
| North Dakota | −0.44 | 2.00 | 2.00 | 1.03 |
| Ohio | −1.91 | 2.00 | 1.26 | 1.07 |
| Oklahoma | 0.72 | 0.06 | 1.66 | 2.00 |
| Oregon | 0.44 | 0.43 | 1.40 | 2.00 |
| Pennsylvania | −1.49 | 2.00 | 1.26 | 2.00 |
| Rhode Island | −0.34 | 1.00 | 2.00 | 0.46 |
| South Carolina | −2.00 | 2.00 | 1.46 | 1.13 |
| South Dakota | −0.47 | 2.00 | 2.00 | 1.12 |
| Tennessee | 0.79 | −0.01 | 1.33 | 1.71 |
| Texas | 0.74 | −0.01 | 1.21 | 0.96 |
| Utah | 2.00 | 0.08 | 0.87 | 2.00 |
| Vermont | 0.08 | 1.42 | 2.00 | 1.78 |
| Virginia | −0.09 | 0.20 | 1.35 | 2.00 |
| Washington | 2.00 | −0.06 | 1.13 | 2.00 |
| West Virginia | −0.76 | 2.00 | 1.85 | 1.13 |
| Wisconsin | 2.00 | −0.02 | 1.27 | 2.00 |
| Wyoming | 0.54 | 1.22 | 1.81 | 2.00 |
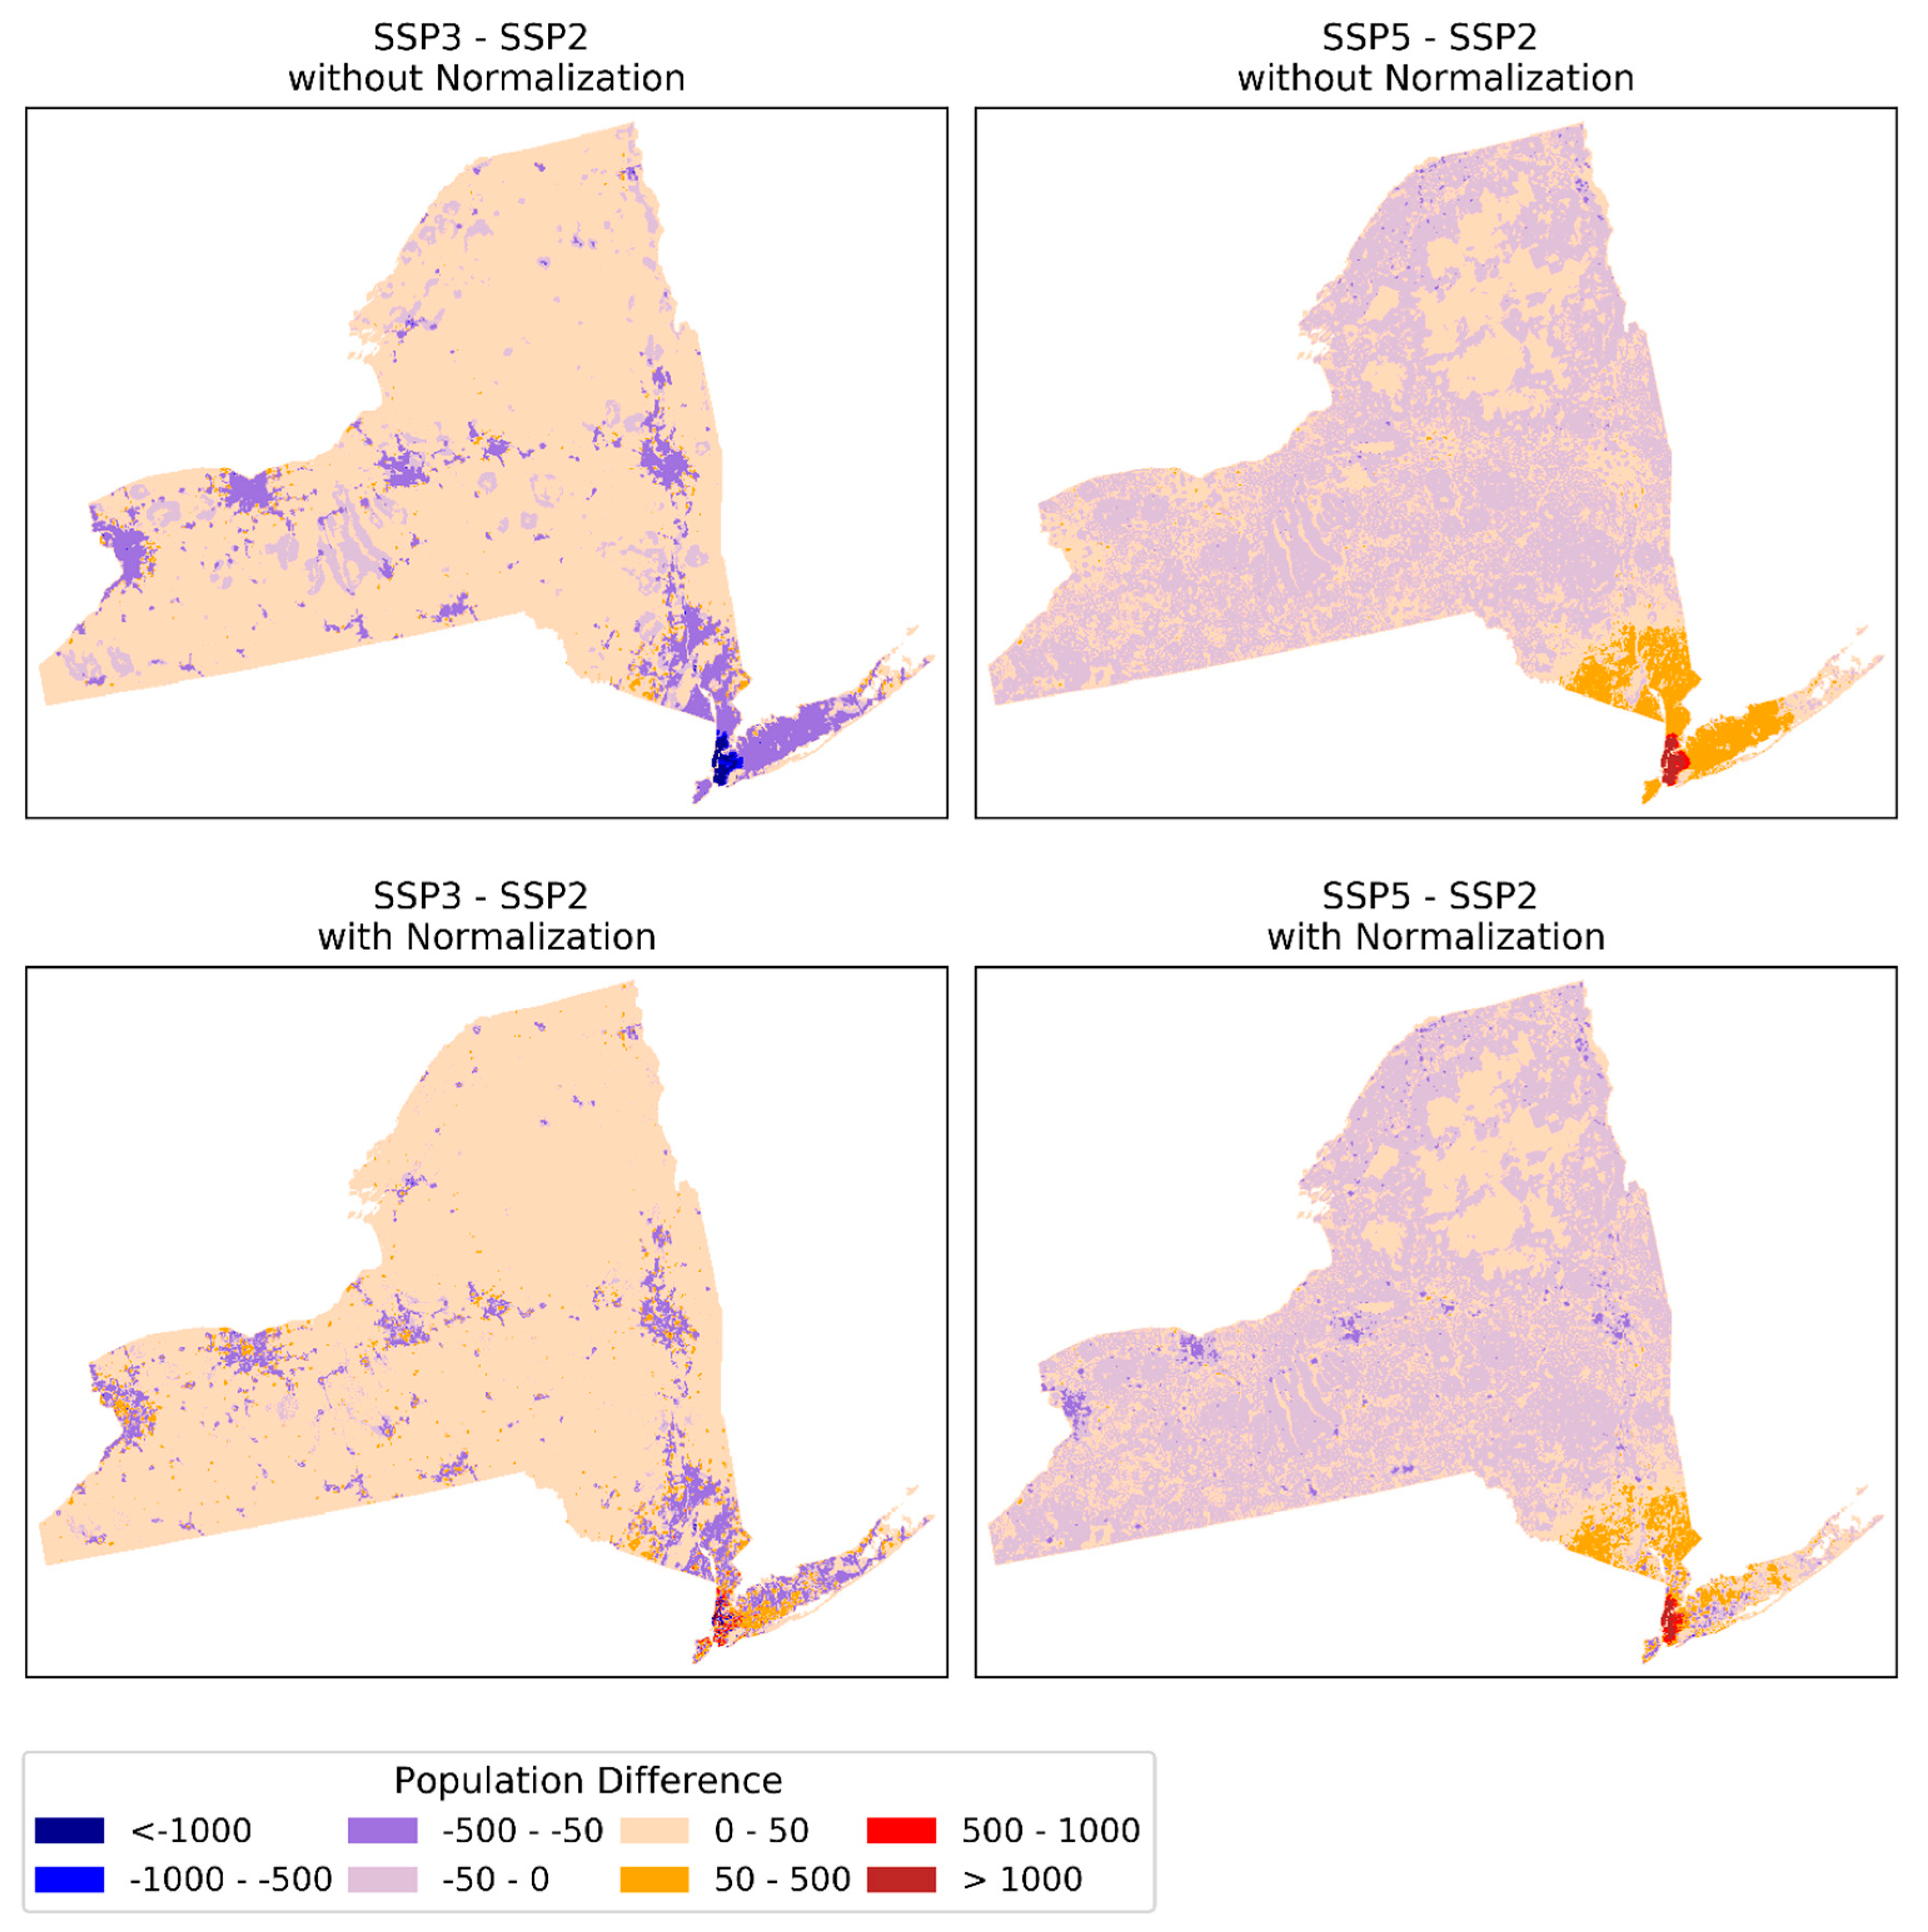
Appendix A.4. SSP Projections for New York


Appendix A.5. Regional Redistribution in State-Level Projections

Appendix A.6. Population Summary of Massachusetts and Utah
| State | Global Model | State-Level Model | ||||
|---|---|---|---|---|---|---|
| SSP2 | SSP3 | SSP5 | SSP2 | SSP3 | SSP5 | |
| Massachusetts | 10684414 | 6252805 | 16190552 | 7771613 | 4426074 | 11353269 |
| Utah | 3672869 | 2134776 | 5609918 | 6449132 | 3955916 | 8862053 |
References
- Meiyappan, P.; Dalton, M.; O’Neill, B.C.; Jain, A.K. Spatial modeling of agricultural land use change at global scale. Ecol. Modell. 2014, 291, 152–174. [Google Scholar] [CrossRef]
- Güneralp, B.; Seto, K.C. Futures of global urban expansion: Uncertainties and implications for biodiversity conservation. Environ. Res. Lett. 2013, 8, 014025. [Google Scholar] [CrossRef]
- Riahi, K.; Rao, S.; Krey, V.; Cho, C.; Chirkov, V.; Fischer, G.; Kindermann, G.; Nakicenovic, N.; Rafaj, P. RCP 8.5-A scenario of comparatively high greenhouse gas emissions. Clim. Chang. 2011, 109, 33. [Google Scholar] [CrossRef]
- Gao, J.; O’Neill, B.C. Data-driven spatial modeling of global long-term urban land development: The SELECT model. Environ. Model. Softw. 2019, 119, 458–471. [Google Scholar] [CrossRef]
- Shepard, C.C.; Agostini, V.N.; Gilmer, B.; Allen, T.; Stone, J.; Brooks, W.; Beck, M.W. Assessing future risk: Quantifying the effects of sea level rise on storm surge risk for the southern shores of Long Island, New York. Nat. Hazards 2012, 60, 727–745. [Google Scholar] [CrossRef]
- McGranahan, G.; Balk, D.; Anderson, B. The rising tide: assessing the risks of climate change and human settlements in low elevation coastal zones. Environ. Urban. 2007, 19, 17–37. [Google Scholar] [CrossRef]
- Xingong, L.; Rowley, R.J.; Kostelnick, J.C.; Braaten, D.; Meisel, J.; Hulbutta, K. GIS analysis of global impacts from sea level rise. Photogramm. Eng. Remote Sens. 2009, 75, 807–818. [Google Scholar]
- Jones, B.; O’Neill, B.C.; Mcdaniel, L.; Mcginnis, S.; Mearns, L.O.; Tebaldi, C. Future population exposure to US heat extremes. Nat. Clim. Chang. 2015, 5, 652–655. [Google Scholar] [CrossRef]
- Luber, G.; McGeehin, M. Climate Change and Extreme Heat Events. Am. J. Prev. Med. 2008, 35, 429–435. [Google Scholar] [CrossRef]
- Caminade, C.; Kovats, S.; Rocklov, J.; Tompkins, A.M.; Morse, A.P.; Colón-González, F.J.; Stenlund, H.; Martens, P.; Lloyd, S.J. Impact of climate change on global malaria distribution. Proc. Natl. Acad. Sci. USA 2014, 111, 3286–3291. [Google Scholar] [CrossRef]
- Hales, S.; De Wet, N.; Maindonald, J.; Woodward, A. Potential effect of population and climate changes on global distribution of dengue fever: An empirical model. Lancet 2002, 360, 830–834. [Google Scholar] [CrossRef]
- Monaghan, A.J.; Sampson, K.M.; Steinhoff, D.F.; Ernst, K.C.; Ebi, K.L.; Jones, B.; Hayden, M.H. The potential impacts of 21st century climatic and population changes on human exposure to the virus vector mosquito Aedes aegypti. Clim. Chang. 2018, 146, 487–500. [Google Scholar] [CrossRef]
- Striessnig, E.; Gao, J.; O’Neill, B.; Jiang, L. Empirically-based spatial projections of U.S. population age structure consistent with the shared socioeconomic pathways. Environ. Res. Lett. 2019, 14, 114038. [Google Scholar] [CrossRef]
- Byers, E.; Gidden, M.; Leclere, D.; Balkovic, J.; Burek, P.; Ebi, K.; Greve, P.; Grey, D.; Havlik, P.; Hillers, A.; et al. Global exposure and vulnerability to multi-sector development and climate change hotspots. Environ. Res. Lett. 2018, 13, 055012. [Google Scholar] [CrossRef]
- Jones, B.; O’Neill, B.C. Historically grounded spatial population projections for the continental United States. Environ. Res. Lett. 2013, 8, 044021. [Google Scholar] [CrossRef]
- McKee, J.J.; Rose, A.N.; Bright, E.A.; Huynh, T.; Bhaduri, B.L. Locally adaptive, spatially explicit projection of US population for 2030 and 2050. Proc. Natl. Acad. Sci. USA 2015, 112, 1344–1349. [Google Scholar] [CrossRef]
- Jones, B.; O’Neill, B.C. Spatially explicit global population scenarios consistent with the Shared Socioeconomic Pathways. Environ. Res. Lett. 2016, 11, 084003. [Google Scholar] [CrossRef]
- O’Neill, B.C.; Kriegler, E.; Ebi, K.L.; Kemp-Benedict, E.; Riahi, K.; Rothman, D.S.; van Ruijven, B.J.; van Vuuren, D.P.; Birkmann, J.; Kok, K.; et al. The roads ahead: Narratives for shared socioeconomic pathways describing world futures in the 21st century. Glob. Environ. Chang. 2017, 42, 169–180. [Google Scholar] [CrossRef]
- EPA. Updates to the Demographic and Spatial Allocation Models to Produce Integrated Climate and Land Use Scenarios (ICLUS) (Final Report, Version 2); US EPA: Washington, DC, USA, 2017. [Google Scholar]
- Bierwagen, B.G.; Theobald, D.M.; Pyke, C.R.; Choate, A.; Groth, P.; Thomas, J.V.; Morefield, P. National housing and impervious surface scenarios for integrated climate impact assessments. Proc. Natl. Acad. Sci. USA 2010, 107, 20887–20892. [Google Scholar] [CrossRef]
- Hauer, M.E. Population projections for U.S. counties by age, sex, and race controlled to shared socioeconomic pathway. Sci. Data 2019, 6, 190005. [Google Scholar] [CrossRef]
- KC, S.; Lutz, W. The human core of the shared socioeconomic pathways: Population scenarios by age, sex and level of education for all countries to 2100. Glob. Environ. Chang. 2017, 42, 181–192. [Google Scholar] [CrossRef] [PubMed]
- Jiang, L.; O’Neill, B.C. Global urbanization projections for the Shared Socioeconomic Pathways. Glob. Environ. Chang. 2017, 42, 193–199. [Google Scholar] [CrossRef]
- Dellink, R.; Chateau, J.; Lanzi, E.; Magné, B. Long-term economic growth projections in the Shared Socioeconomic Pathways. Glob. Environ. Chang. 2017, 42, 200–214. [Google Scholar] [CrossRef]
- Hasegawa, T.; Fujimori, S.; Takahashi, K.; Masui, T. Scenarios for the risk of hunger in the twenty-first century using Shared Socioeconomic Pathways. Environ. Res. Lett. 2015, 10, 014010. [Google Scholar] [CrossRef]
- Merkens, J.L.; Reimann, L.; Hinkel, J.; Vafeidis, A.T. Gridded population projections for the coastal zone under the Shared Socioeconomic Pathways. Glob. Planet. Chang. 2016, 145, 57–66. [Google Scholar] [CrossRef]
- Nauels, A.; Rogelj, J.; Schleussner, C.F.; Meinshausen, M.; Mengel, M. Linking sea level rise and socioeconomic indicators under the Shared Socioeconomic Pathways. Environ. Res. Lett. 2017, 12, 114002. [Google Scholar] [CrossRef]
- Rohat, G. Projecting drivers of human vulnerability under the shared socioeconomic pathways. Int. J. Environ. Res. Public Health 2018, 15, 554. [Google Scholar] [CrossRef]
- Zoraghein, H.; O’Neill, B.C. The methodological foundation of a gravity-based model to downscale U.S. state-level populations to high-resolution distributions for integrated human-environment analysis. Demogr. Res. under review.
- Grübler, A.; O’Neill, B.; Riahi, K.; Chirkov, V.; Goujon, A.; Kolp, P.; Prommer, I.; Scherbov, S.; Slentoe, E. Regional, national, and spatially explicit scenarios of demographic and economic change based on SRES. Technol. Forecast. Soc. Chang. 2007, 74, 980–1029. [Google Scholar]
- Jiang, L.; O’Neill, B.; Zoraghein, H.; Dahlke, S. Population scenarios for U.S. states consistent with Shared Socioeconomic Pathways. Environ. Res. Lett. under review.
- Zoraghein, H.; Jiang, L. The Improved Urbanization Projections of the NCAR Community Demographic Model (CDM). NCAR Tech. Notes 2018. [Google Scholar] [CrossRef]
- Zoraghein, H.; O’Neill, B. Data Supplement: U.S. State-Level Projections of the Spatial Distribution of Population Consistent with Shared Socioeconomic Pathways. (Version v0.1.0) [Data set]. Available online: https://doi.org/10.5281/zenodo.3756179 (accessed on 19 April 2020).
- Zoraghein, H.; O’Neill, B.C.; Vernon, C. Population Gravity Model (Version v0.1.0). Available online: https://github.com/IMMM-SFA/population_gravity. (accessed on 19 April 2020).
- Santos, A.; McGuckin, N.; Nakamoto, H.Y.; Gray, D.; Liss, S. Summary of Travel Trends: 2009 National Household Travel Survey; U.S. Department of Transportation: Washington, DC, USA, 2011. [Google Scholar]
- Jiang, L.; Zoraghein, H.; O’Neill, B.C. Population projections for US states under the Shared Socioeconomic Pathways based on global gridded population projections. NCAR Tech. 2018. [Google Scholar] [CrossRef]
- Gao, J. Downscaling Global Spatial Population Projections from 1/8-degree to 1-km Grid Cells. NCAR Tech. Notes 2017. [Google Scholar] [CrossRef]


© 2020 by the authors. Licensee MDPI, Basel, Switzerland. This article is an open access article distributed under the terms and conditions of the Creative Commons Attribution (CC BY) license (http://creativecommons.org/licenses/by/4.0/).
Share and Cite
Zoraghein, H.; O’Neill, B.C. U.S. State-level Projections of the Spatial Distribution of Population Consistent with Shared Socioeconomic Pathways. Sustainability 2020, 12, 3374. https://doi.org/10.3390/su12083374
Zoraghein H, O’Neill BC. U.S. State-level Projections of the Spatial Distribution of Population Consistent with Shared Socioeconomic Pathways. Sustainability. 2020; 12(8):3374. https://doi.org/10.3390/su12083374
Chicago/Turabian StyleZoraghein, Hamidreza, and Brian C. O’Neill. 2020. "U.S. State-level Projections of the Spatial Distribution of Population Consistent with Shared Socioeconomic Pathways" Sustainability 12, no. 8: 3374. https://doi.org/10.3390/su12083374
APA StyleZoraghein, H., & O’Neill, B. C. (2020). U.S. State-level Projections of the Spatial Distribution of Population Consistent with Shared Socioeconomic Pathways. Sustainability, 12(8), 3374. https://doi.org/10.3390/su12083374