Article

A Fuzzy ANP-QFD Methodology for Determining Stakeholders in Product-Service Systems Development from Ecosystem Perspective

Institute of Industrial Engineering and Management, School of Mechanical Engineering, Shanghai Jiao Tong University, 800 Dongchuan Road, Minhang District, Shanghai 200240, China
*
Author to whom correspondence should be addressed.
Sustainability 2020, 12(8), 3329; https://doi.org/10.3390/su12083329
Submission received: 2 March 2020 / Revised: 13 April 2020 / Accepted: 15 April 2020 / Published: 20 April 2020

Abstract

:
Recently the competition between firms is transforming from “firm vs. firm” to “ecosystem vs. ecosystem”. To fulfil the personalized customer requirements for a high-quality product-service in the age of servitization and sustainability, it is difficult for an individual actor to realize it. The product-service system (PSS) is naturally an integration of product and service. The final product-service of PSS that depends on a tangible product and intangible service, calls for value co-creation of multi-stakeholders. However, most existing related works have investigated PSS from the perspective of a supply chain or network, PSS in the view of an ecosystem of multi-stakeholders lacks sufficient exploration, especially the topic on the relationship between product-service and stakeholders. To fill the gap, this paper proposed a framework for the PSS ecosystem with quality function deployment (QFD) and fuzzy analytic network process (fuzzy ANP) to determine the stakeholders by clarifying the relationship between the final integrated product-service and stakeholders. Firstly, the PSS ecosystem structure was presented, including the stakeholders. Secondly, a model with the three-stage fuzzy ANP-QFD approach to determine stakeholders was employed. Thirdly, the specific process of the three-stage approach was presented. An illustrative case study of the automobile aftermarket was presented to verify the proposed model and approach. Discussions and future directions concluded this paper.

1. Introduction

The product-service system (PSS) is an integrated product-service offering that delivers value to customers. In recent years, it is difficult for an individual actor to fulfil the customer requirements for an integrated high-quality product and service. It calls for value co-creation of multi-stakeholders from the perspective of an ecosystem [1,2,3]. From the perspective of quality managment, the final product-service quality is related to product quality and service quality [4]. They are influenced by large amounts of quality characteristics (QC), such as functionality, availability (i.e., engineering characteristics (ECs) termed by literatures) in the quality bill of materials (QBOM), which means the relationship of quality characteristics. The QC can be divided into two categories, namely product-related QC and service-related QC. They are influenced by the product components in product-BOM and service components in the service-BOM. The product components and service components are related to multi-stakeholders, who play an important role in PSS innovation and performance [5].
Quality function development (QFD) is widely used as an efficient tool to translate customer requirements (CRs) to technical attributes in PSS planning and PSS development [6,7,8], which is termed QFDforPSS. Existing research on QFDforPSS focus on the translation from CRs to ECs (i.e., the first phase in PSS development) and the translation from ECs to components (i.e., the second phase). However, the translation from components to stakeholders (i.e., the third phase proposed in this work) was missing in PSS development. The relationship between product-service offerings and stakeholders have not been explored sufficiently.
Therefore, this research takes a step further, the aim of this paper is to explore the relationship between CRs and stakeholders by integrating three phases focusing on product-service quality from the perspective of ecosystem. A fuzzy ANP-QFD methodology for PSS development was carried through three stages: (1) Translation from CRs to QCs, (2) translation from QCs in QBOM to BOM attributes, and (3) translation from BOM attributes to stakeholders.
The paper is organized as follows: Literature review on QFDforPSS and ecosystem was conducted in Section 2, a proposed framework for the PSS ecosystem, a fuzzy ANP-QFD model for determining stakeholders, and the process of the proposed model were described in Section 3. Application of the proposed model in an automobile aftermarket was illustrated in Section 4. The effectiveness, implication, and limitation of the proposed model were discussed in Section 5. Conclusion and future research directions were discussed in Section 6.

2. Related Work

2.1. Quality Function Deployment for Product-Service System (QFDforPSS)

PSS can be divided into five types, including integration-oriented, product-oriented, service-oriented, use-oriented, and result-oriented PSS [9,10]. The relationship between customer requirements and engineering characteristics in a PSS context was explored by numerous scholars, such as PSS planning [4] and service conflicts identification [11].
Existing literatures on QFDforPSS showed that QFD was widely used in PSS development [12] to translate CRs into product-related engineering characteristics and service-related engineering characteristics [4]. Figure 1 depicts the scheme of QFDforPSS and the relationship among product-service offerings, customer requirements (i.e., customer domain), quality characteristics in QBOM (i.e., functional domain), BOM attributes (i.e., component domain), and stakeholders (i.e., stakeholder domain) in a network form. The process of identifying the relationship between PSS offerings and stakeholders can be divided into three phases. Phase 1 was discussed by Geng et al. [4,8], a two-phase exploration including phase 1 and phase 2 was investigated by [6,7,12], but a systematic research integrating phase 1, phase 2, and phase 3 was missing. The relationship between BOM and stakeholders was not addressed.

2.2. Ecosystem Theory

Ecosystem is a buzzword and has attracted the interest of numerous researchers. Borrowed from ecology, the ecosystem concept refers to a group of interactive and interdependent enterprises and individuals [13], which is beyond the scope of a value collaborative network [14] and supply chain network. Existing literatures on ecosystem can be classified into four bodies of streams, namely business ecosystem [15], service ecosystem [16], entrepreneurial ecosystem [17,18], and innovation ecosystem [19].
The ecosystem theory was adopted in a wide scope, such as service quality management [20], networked manufacturing systems [21], network management [22], ecosystem as a structure [23], and PSS design [2,3].
However, the existing research works lack a holistic view of integrated product-service from the ecosystem perspective, considering multiple stakeholders’ co-creation for qualified PSS offerings. Chen and Dahlgaard-Park [20] proposed a framework of service ecosystem emphasizing the total quality of the whole ecosystem. However, the investigation of customers’ role as key actorsto co-create value was insufficient, the relationship between stakeholders and the final product-service was missing.
To match customer expectation with qualified PSS offerings, it is essential to propose a holistic and systematic framework for the PSS ecosystem, particularly for complex product-service systems characterized by the nature of multiple stakeholders’ involvement, such as the automobile industry. Table 1 showed a summary of literatures on QFDforPSS in Section 2.1 and the ecosystem theory for PSS in Section 2.2.

3. A Proposed Fuzzy ANP-QFD Framework for PSS Ecosystem

3.1. PSS Ecosystem

3.1.1. The Stakeholders of PSS: An Ecosystem Perspective

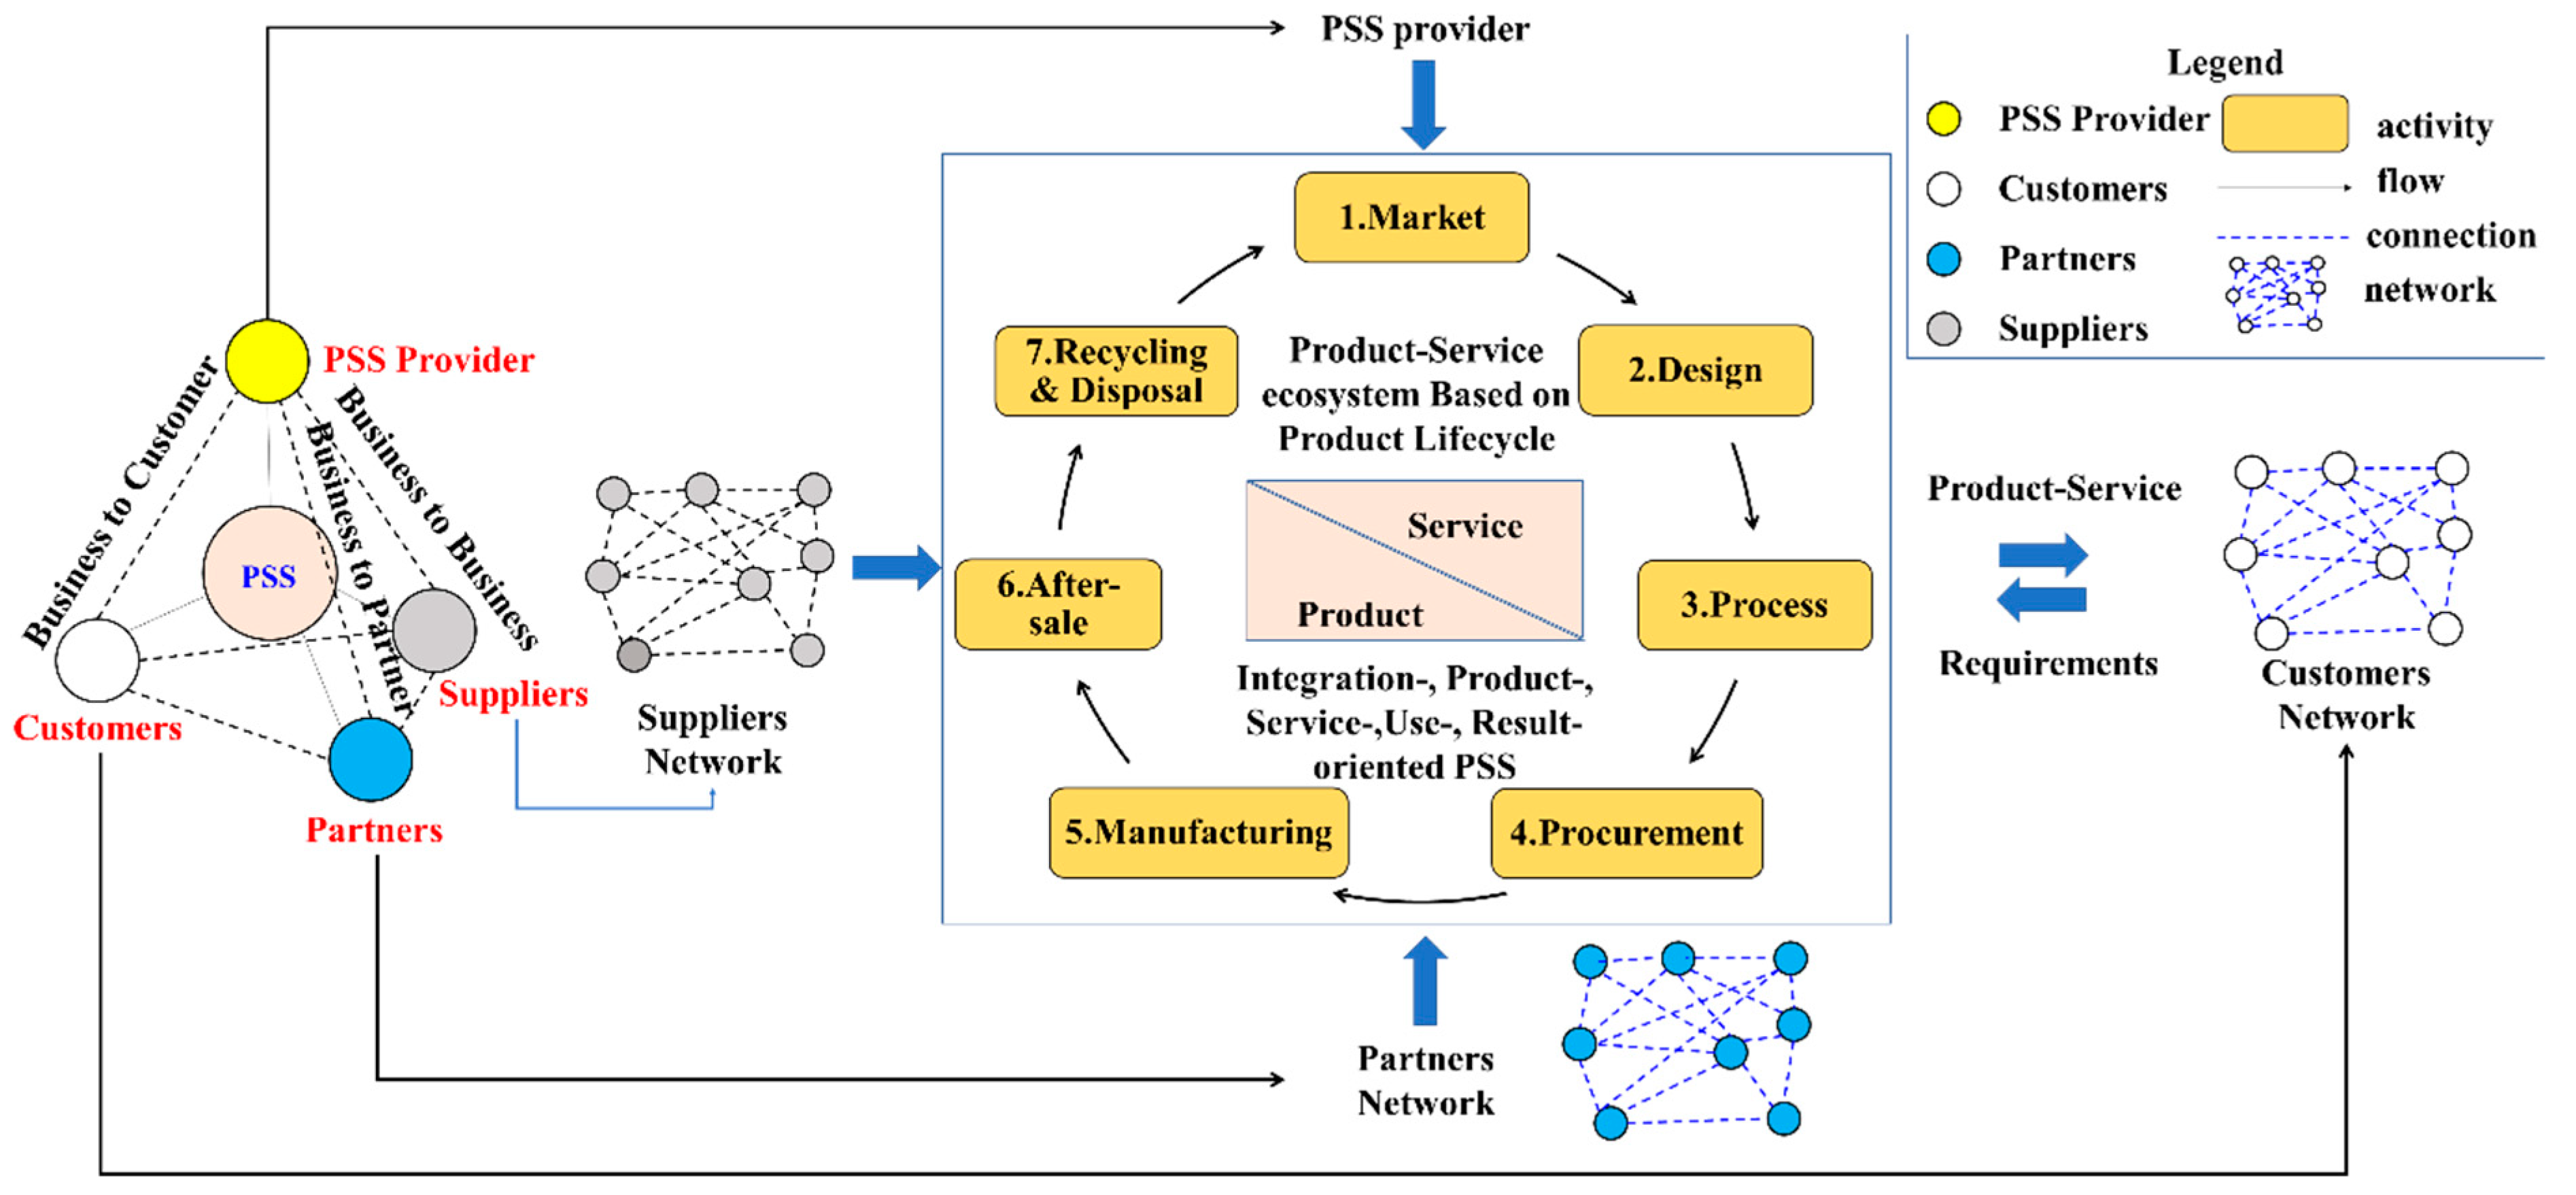
Inspired by the industrial PSS network organization [25] and ecosystem theory [19], we constructed a conceptual structure of the PSS ecosystem. As shown in Figure 2, the PSS ecosystem is a set of actors, activities, and relations that interconnected multiple actors co-creating value throughout the PSS lifecycle (i.e., from market to disposal) and offering integrated PSS to customers. It can be viewed as a dynamic and complex adaptive system [26]. The ecosystem provides high-quality PSS offerings to customers according to customer requirements through the value co-creation of all stakeholders around the PSS.
Stakeholders in the ecosystem include focal company, customers, spare part suppliers, module suppliers [25], component supplier, software vendors, service supplier, technology partners, system integrators, and channel partners, etc. In terms of role, the stakeholders can be divided into four categories, namely PSS provider, customers, suppliers, and partners. The details on the role of stakeholders and relationships in value co-creation are as follows:
  • PSS Provider. PSS provider is the orchestrator of the product-service ecosystem, and it is often the focal company. The PSS provider is responsible for the final outcome and enables the value co-creation in an ecosystem. The relationship between PSS provider and the other actors can be classified into three categories, namely business-to-business (B2B), business-to-customers (B2C), and business-to-partners (B2P).
  • Customers. The customer plays a role of both consumer and producer. On one hand, customers receive a PSS solution from the PSS provider, including product, service, or the integration of product and service. On the other hand, they co-operate with stakeholders in the ecosystem. A number of customers form a customer network. The relationship among elements in the customer network is customer-to-customer (C2C). They can communicate on social media or social networks.
  • Suppliers. Suppliers are responsible for providing hardware, software, and service. Correspondingly, they include module supplier, component supplier, software vendors, and service supplier. The module supplier is responsible for providing a PSS module throughout the lifecycle. The component supplier provides a physical component directly to customers or PSS provider. The service provider is responsible for delivering service directly to customers. They form different kinds of supplier networks according to their role, including module supplier network, component supplier network, software vendor network, and service supplier network. The relationship among elements in the supplier network is supplier-to-supplier (S2S).
  • Partners. Partners are stakeholders providing complementary capabilities and resources. They play an important role as a complementor in the ecosystem, they are typically technology partners, system integrators, and channel partners. They form partner networks, including technology partner network, system integrators network, and channel partner network. The relationship among elements in the partner network is partner-to-partner (P2P).

3.1.2. The Relationship among Stakeholders and BOM

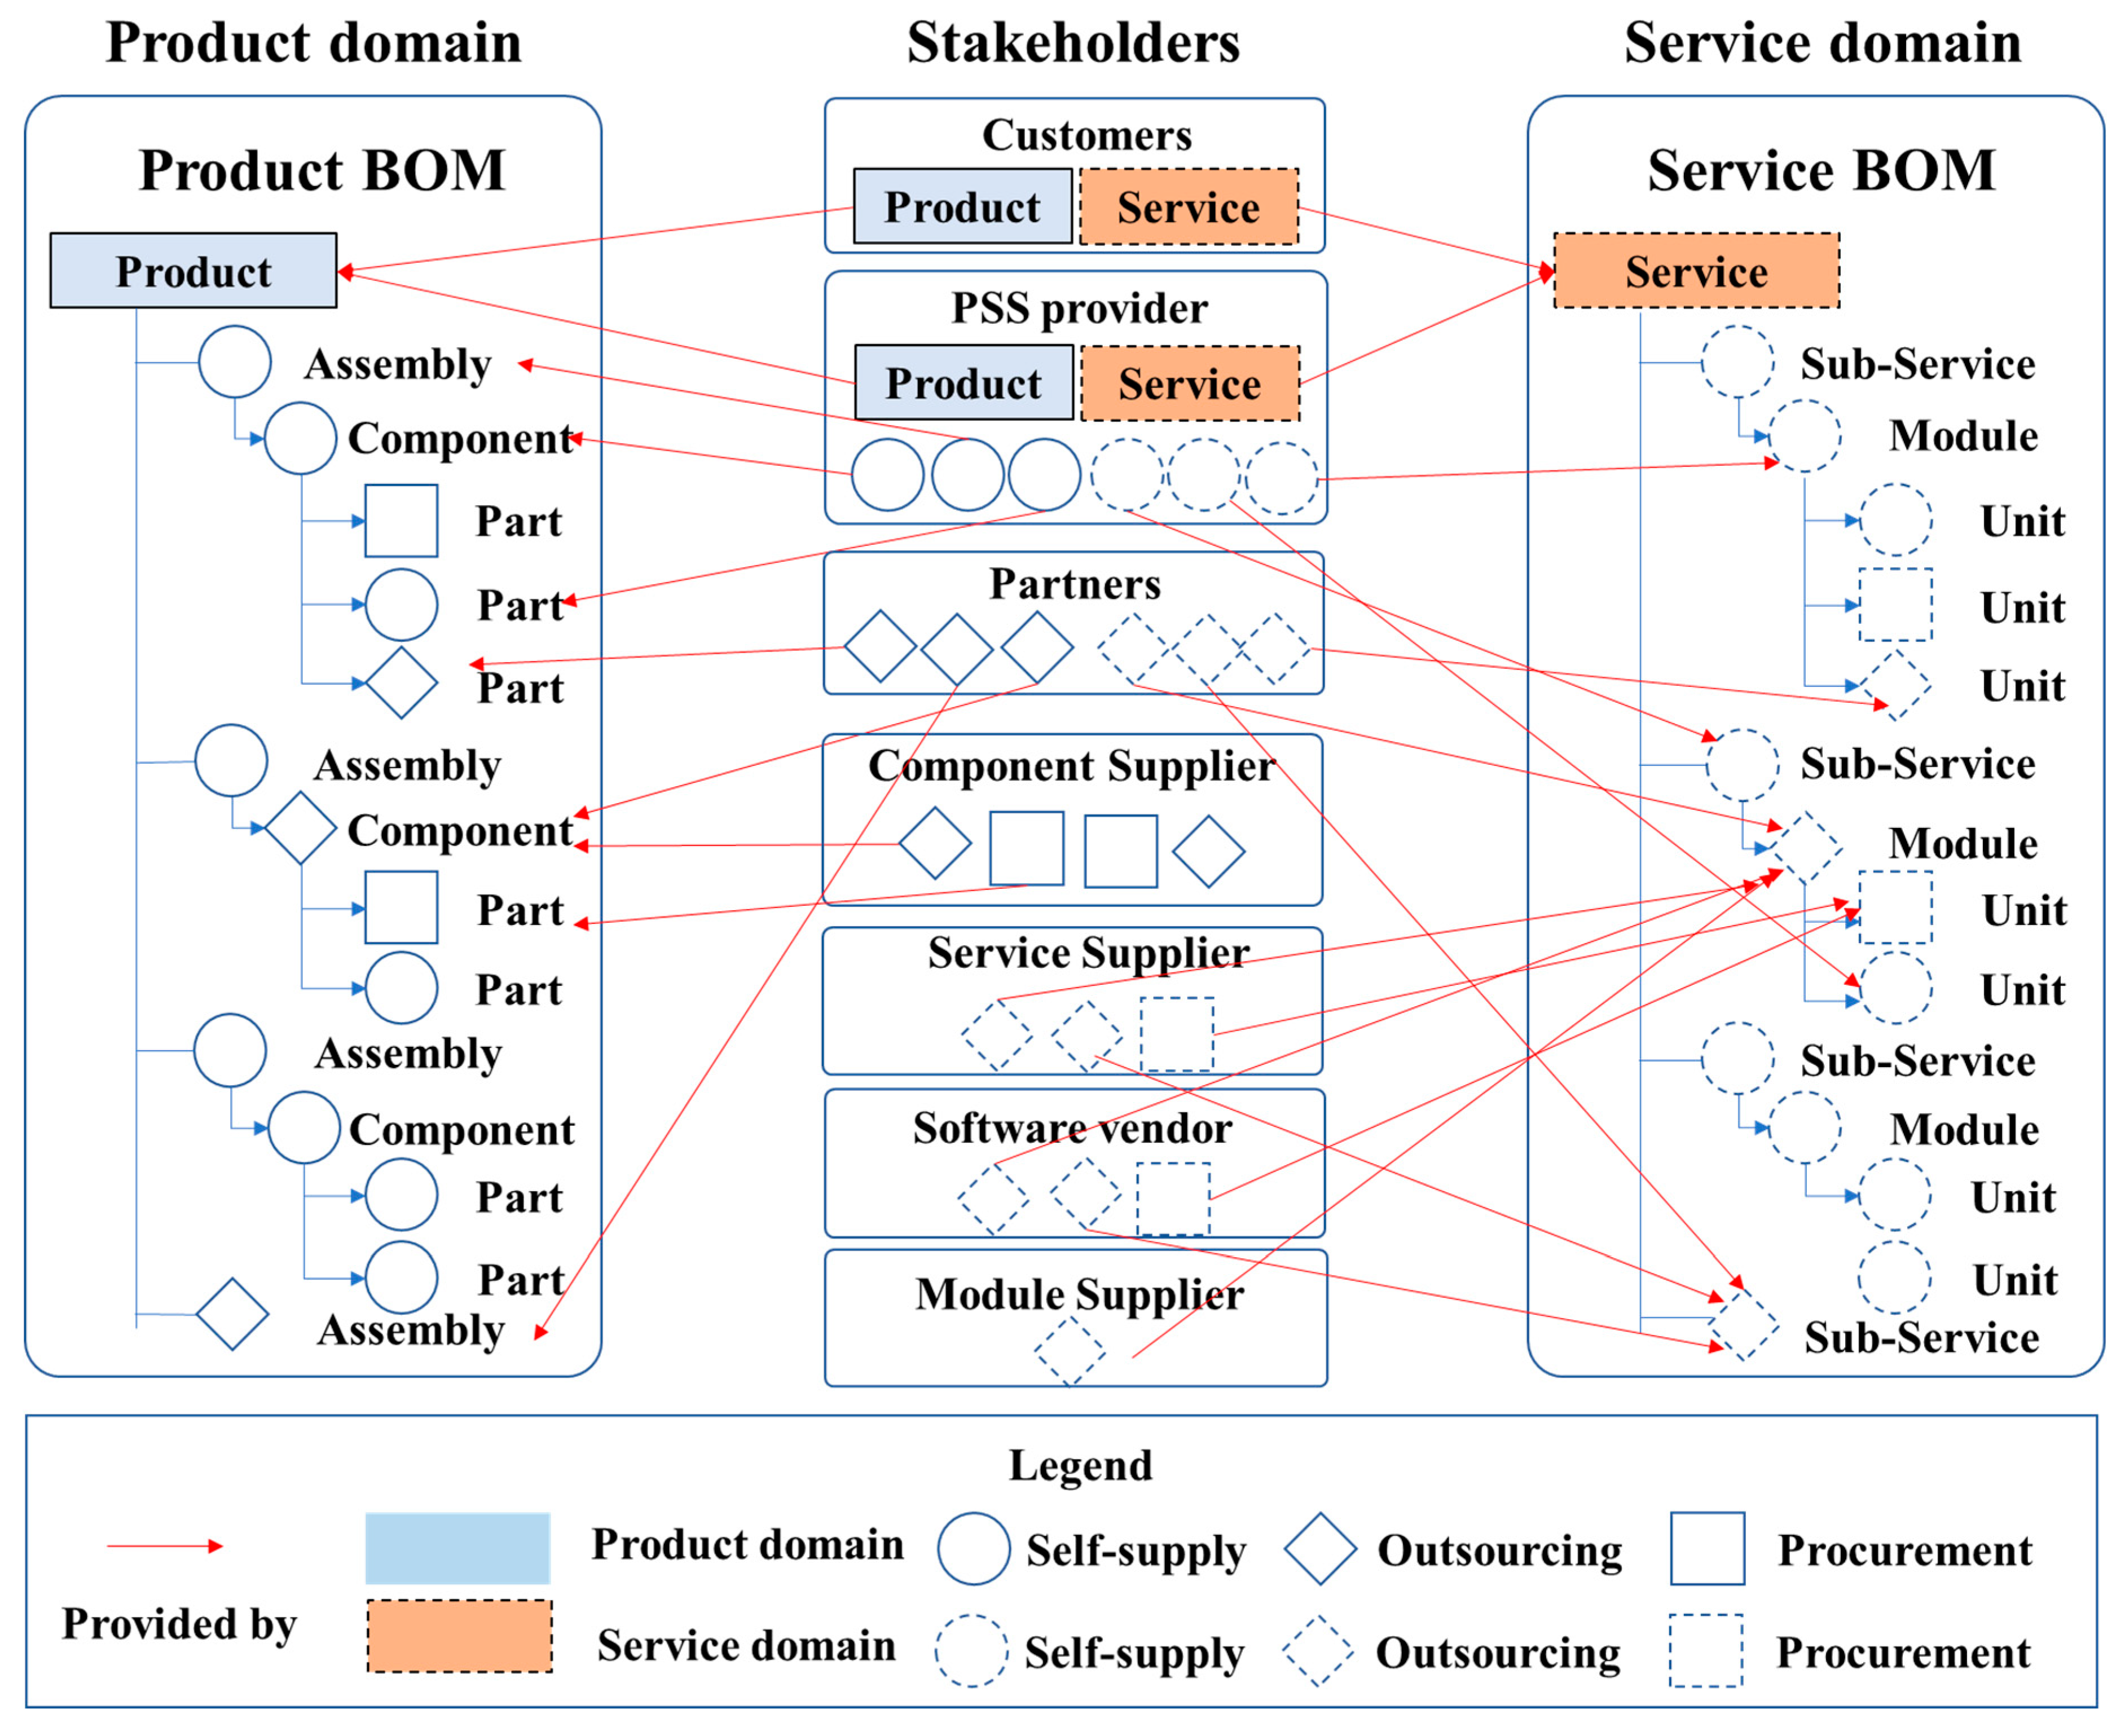
BOM refers to a module or components that constitute the product or service in this paper. As it is complicated to map the relationship between BOM throughout the lifecycle and stakeholders, taking manufacturing BOM as an example, Figure 3 depicts the mapping between stakeholders and BOM, including product BOM and service BOM, respectively. On the left lies the product domain, the manufacturing BOM can be divided into three levels, namely assembly, component, and part. On the right lies the service domain, the service BOM can be divided into three levels, namely sub-service, module and unit. In the middle lies the stakeholders, including customers, PSS provider, partners, component supplier, service supplier, software vendor, module supplier, etc. From the perspective of a focal firm (i.e., PSS provider), the assembly, component, and part can be self-supplied, outsourced, or purchased in the product domain. Similarly, the sub-serve, module, and unit also can be self-supplied, outsourced, or purchased in the service domain.
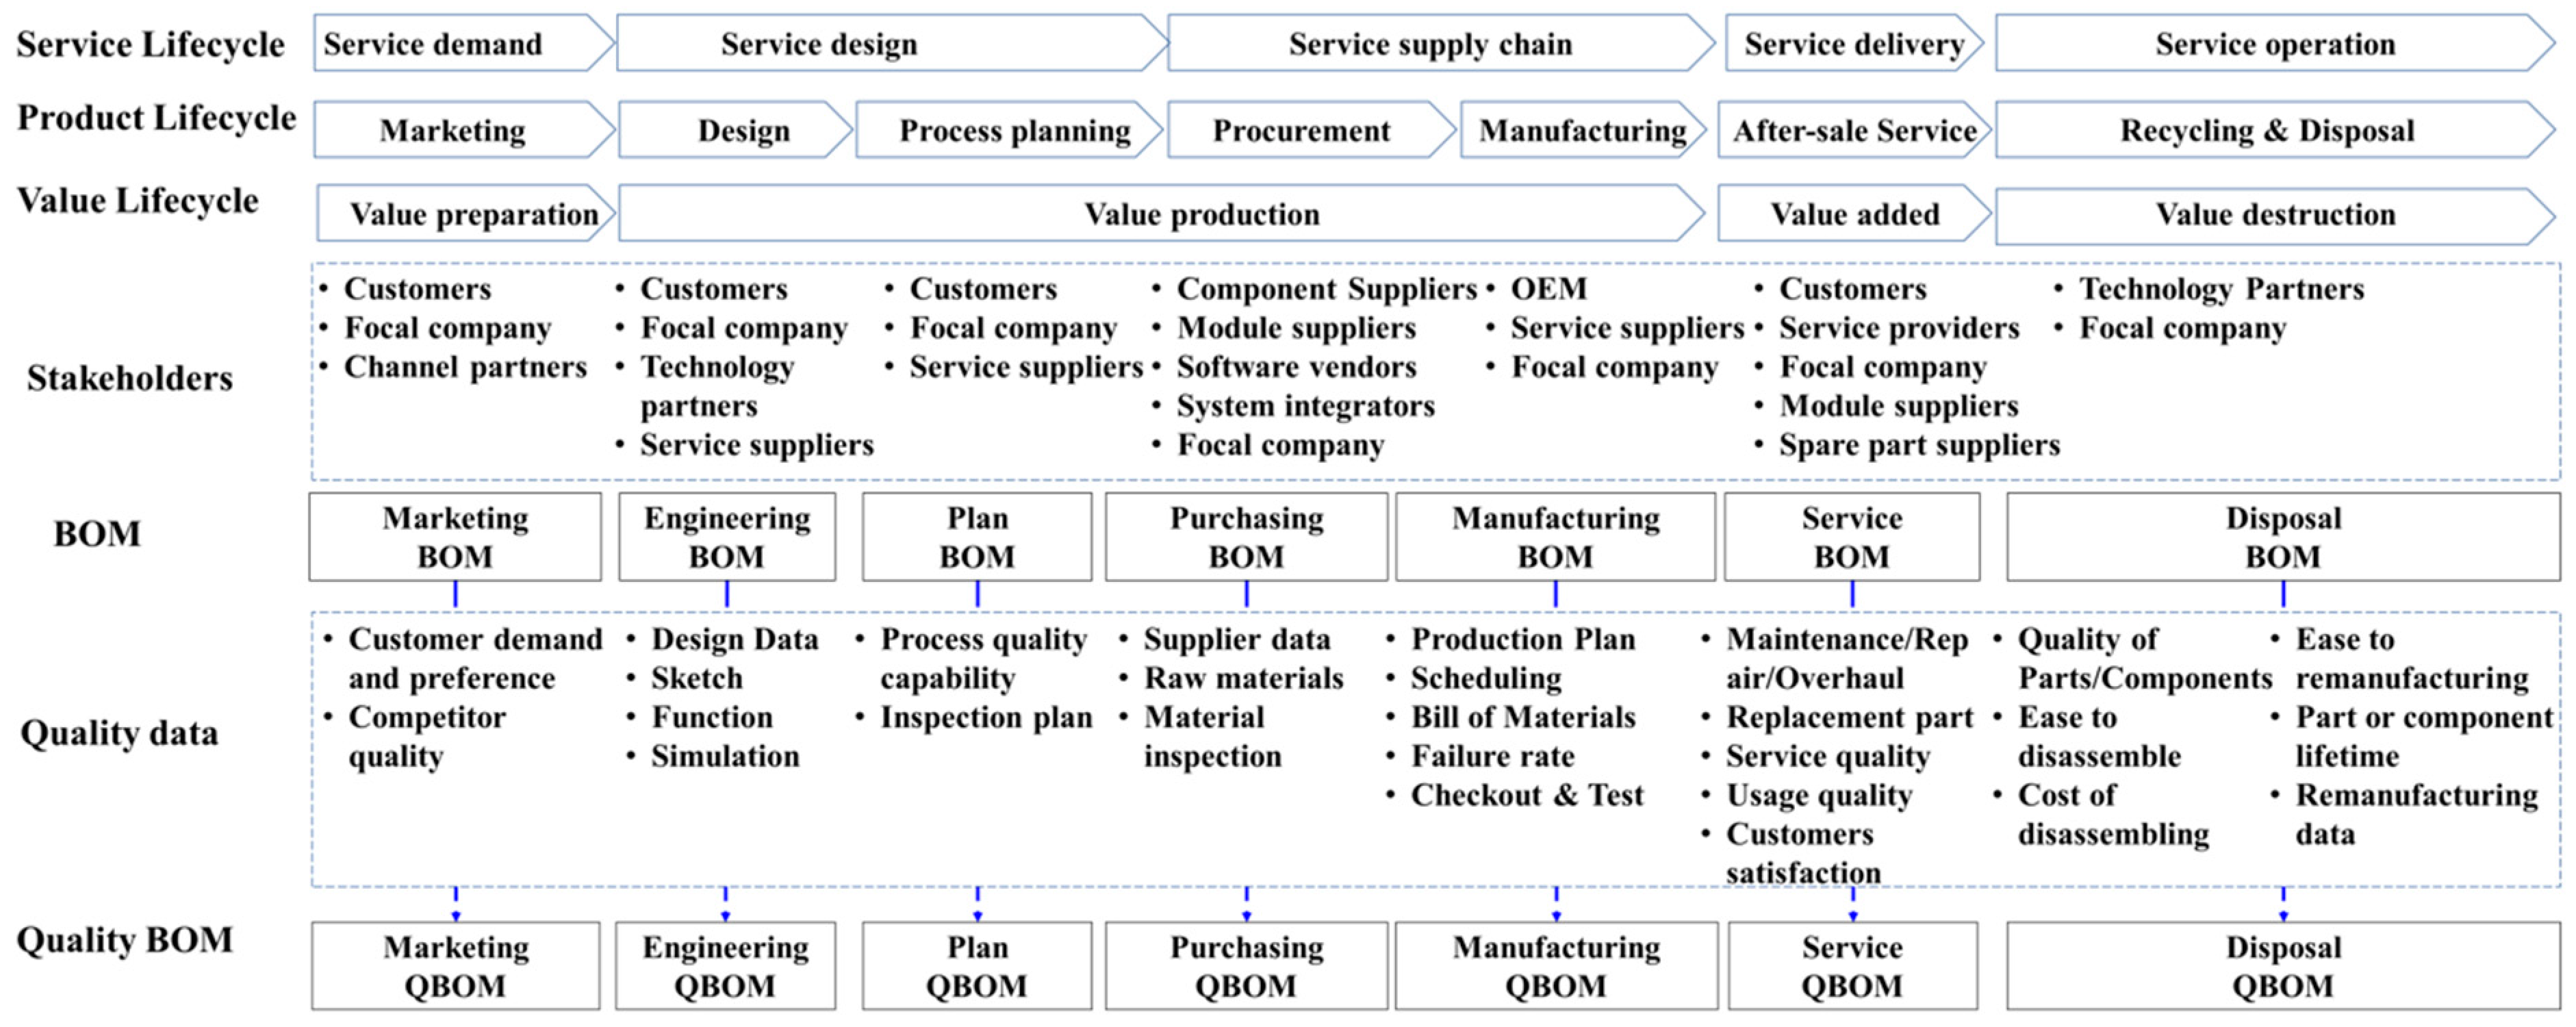
In order to clarify the influence of multi-stakeholders on the final product-service, the concept of quality BOM (QBOM) from the perspective of key quality characteristics is introduced, including marketing QBOM, engineering QBOM, plan QBOM, purchasing QBOM, manufacturing QBOM, service QBOM, and disposal QBOM.
Product-related quality characteristics are inherent attributes influencing the goods quality level, including properties, functionality, performance, reliability, durability, safety indices, maintainability, serviceability, appearance, etc. They rely on a function node in the product BOM-based function network. The service-related quality characteristics refer to the service attributes (e.g., tangibility, responsiveness, reliability, assurance, empathy, etc.). Figure 4 shows the corresponding relationship among product lifecycle, service lifecycle, value lifecycle, stakeholders, BOM, quality data, and quality BOM (QBOM). Generally, the product lifecycle can be divided into seven phases, including marketing, design, process planning, procurement, supply, manufacturing, after-sale service, and disassembly, recycling, and disposal. Service lifecycle is derived from after-sale service, including service demand, service design, service supply chain, service delivery, and service operation. The stakeholders gather together for value co-creation in networks. The value lifecycle includes value preparation, value production, value added, and value destruction. Corresponding to each phase, BOMs comprise of marketing BOM, engineering BOM, plan BOM, purchasing BOM, manufacturing BOM, service BOM, and disposal BOM.

3.2. A Fuzzy ANP-QFD Model for PSS to Determine Stakeholders

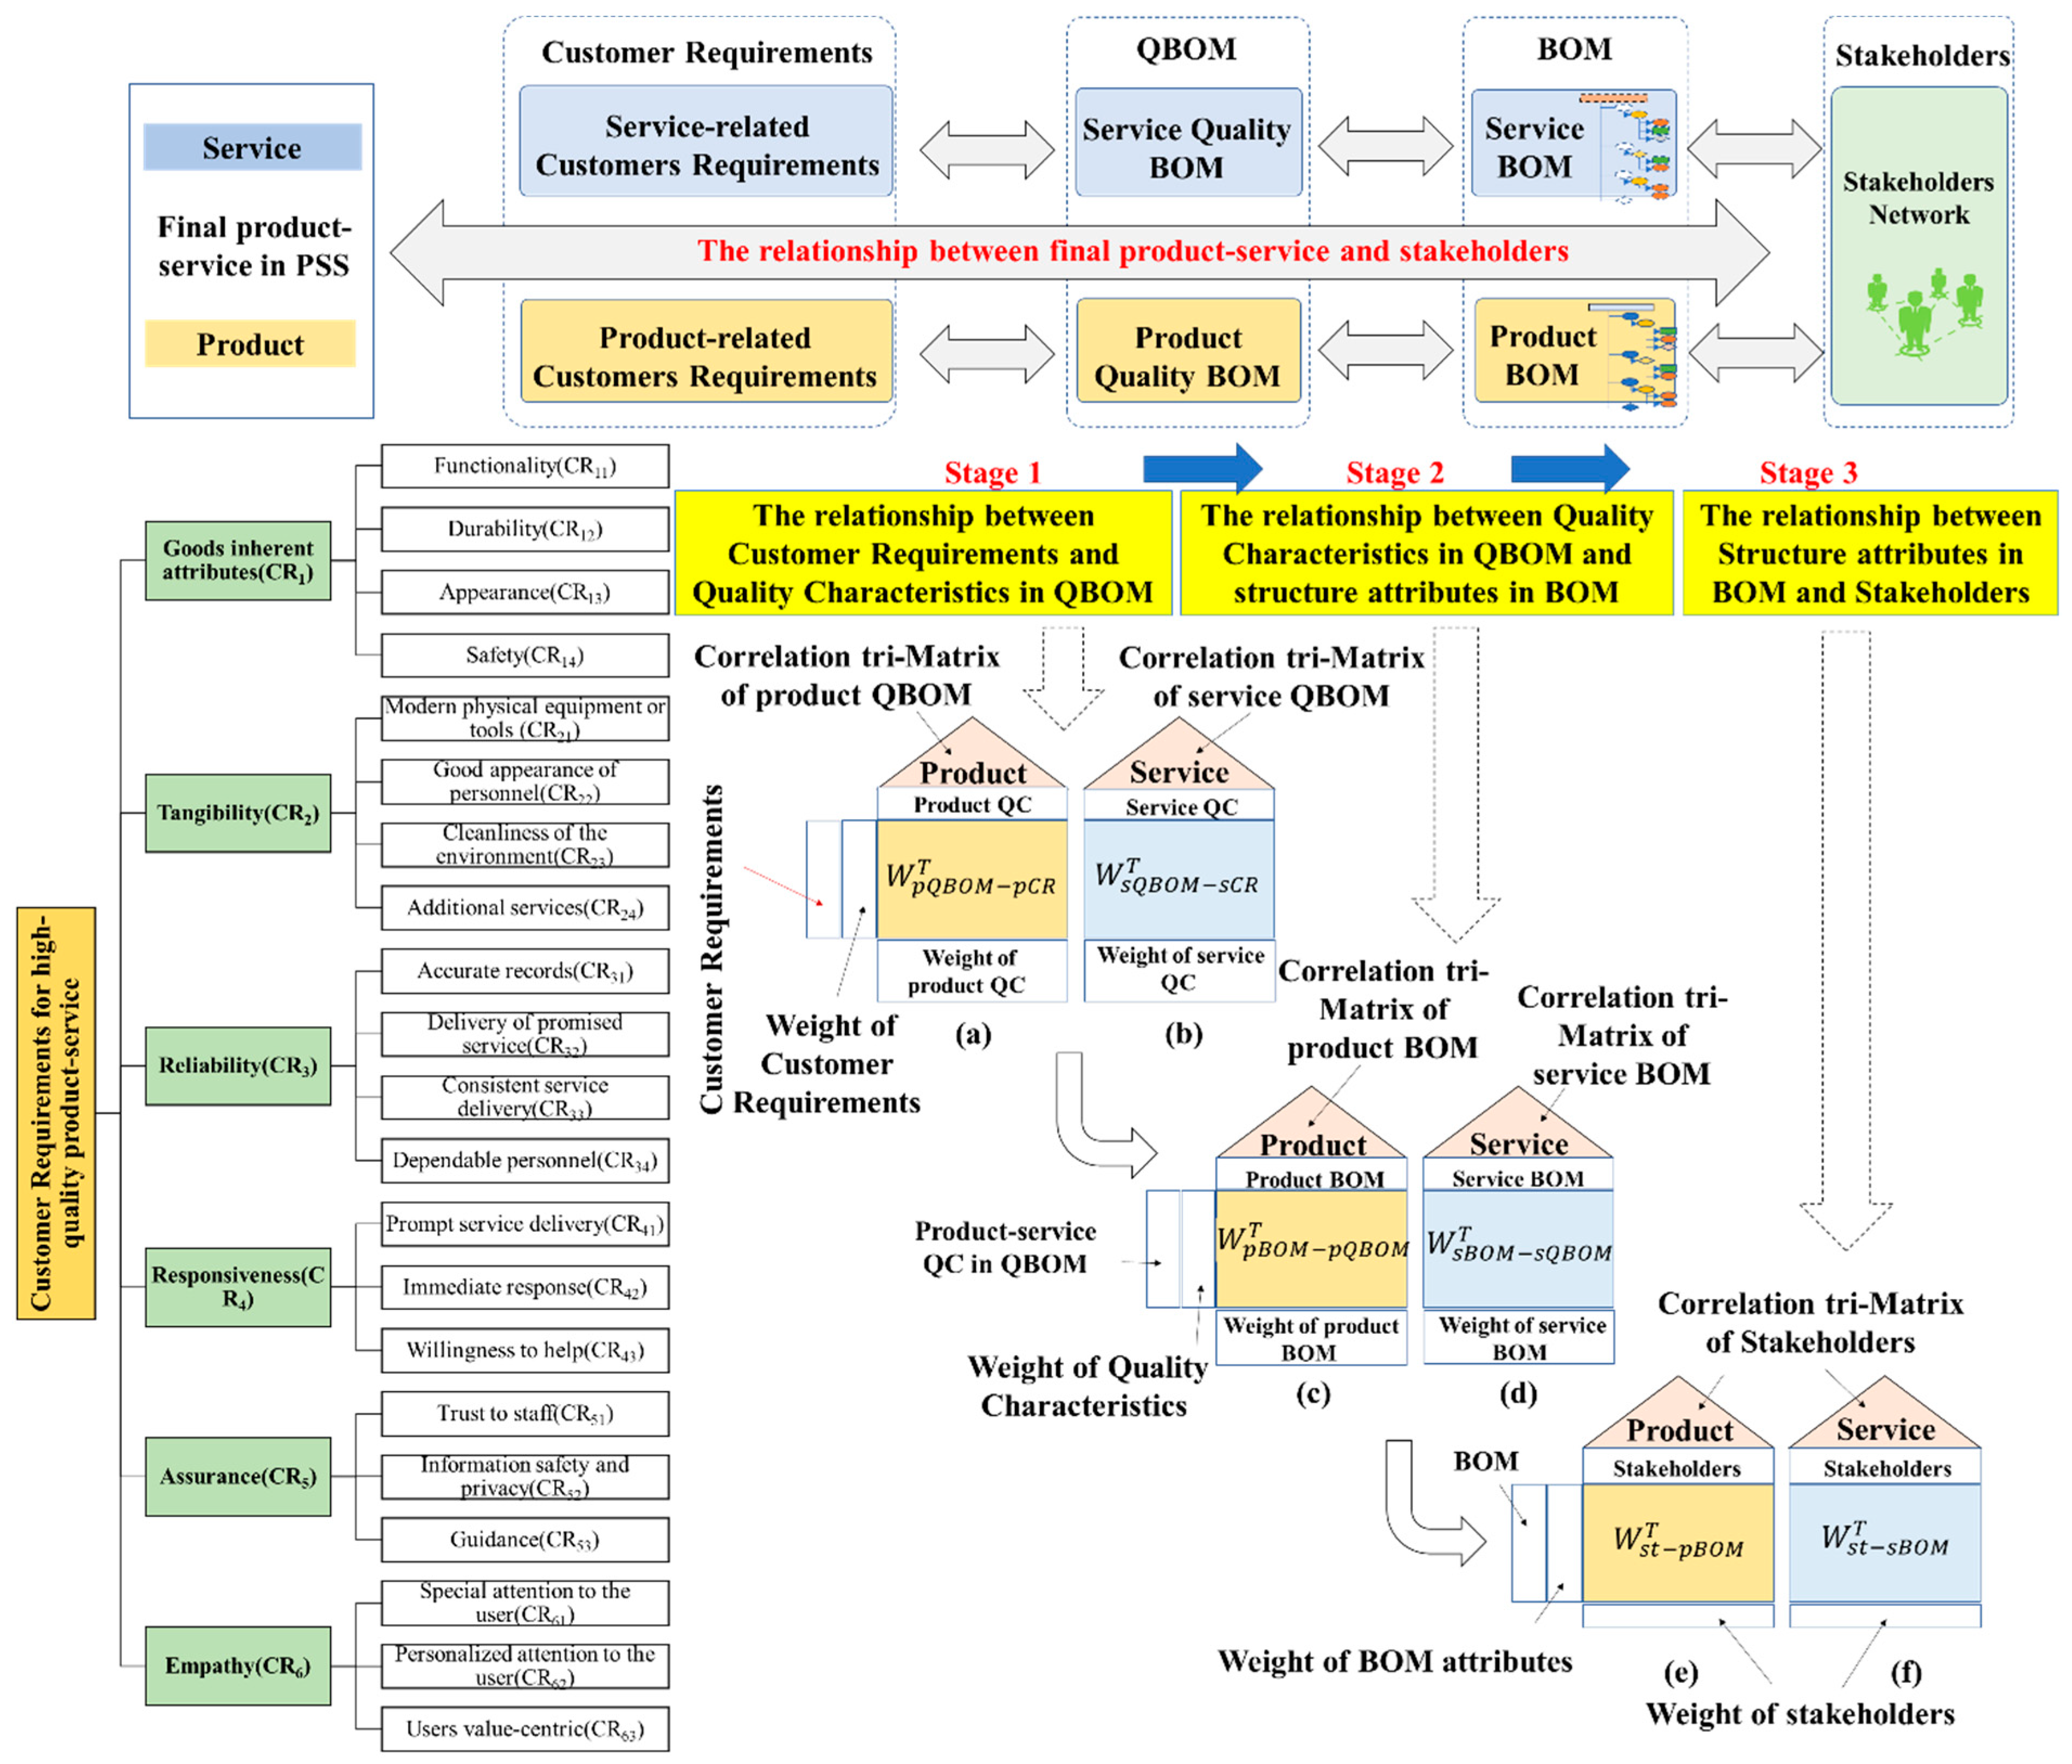
In order to clarify the relationship between final PSS offerings and stakeholders, we proposed a three-stage fuzzy ANP-QFD model, as shown in Figure 5.
The structure of QFD is similar to a house of quality (HoQ), consisting of WHATs and importance, HOWs and importance, relationship matrix, and correlation matrix of HOWs. The output of the former stage was the input for the next stage. Each stage can be divided into the following steps: (1) Identify the WHATs, (2) determine the HOWs, (3) rate the weights of WHATs, (4) form the relationship matrix, and (5) calculate the weights of HOWs.
The customer requirements for product-service offerings (i.e., the expected product-service quality) are derived from a combination of product quality and SERVQUAL. The SERVQUAL model [27] is used to assess the perceived service quality, in this paper, a modified SERVQUAL model is used to determine the CRs of the product-service offerings. Compared with the traditional SERVQUAL model, a new dimension is added, namely goods inherent attributes, resulting in twenty-one sub-dimensions, as shown in Table 2.
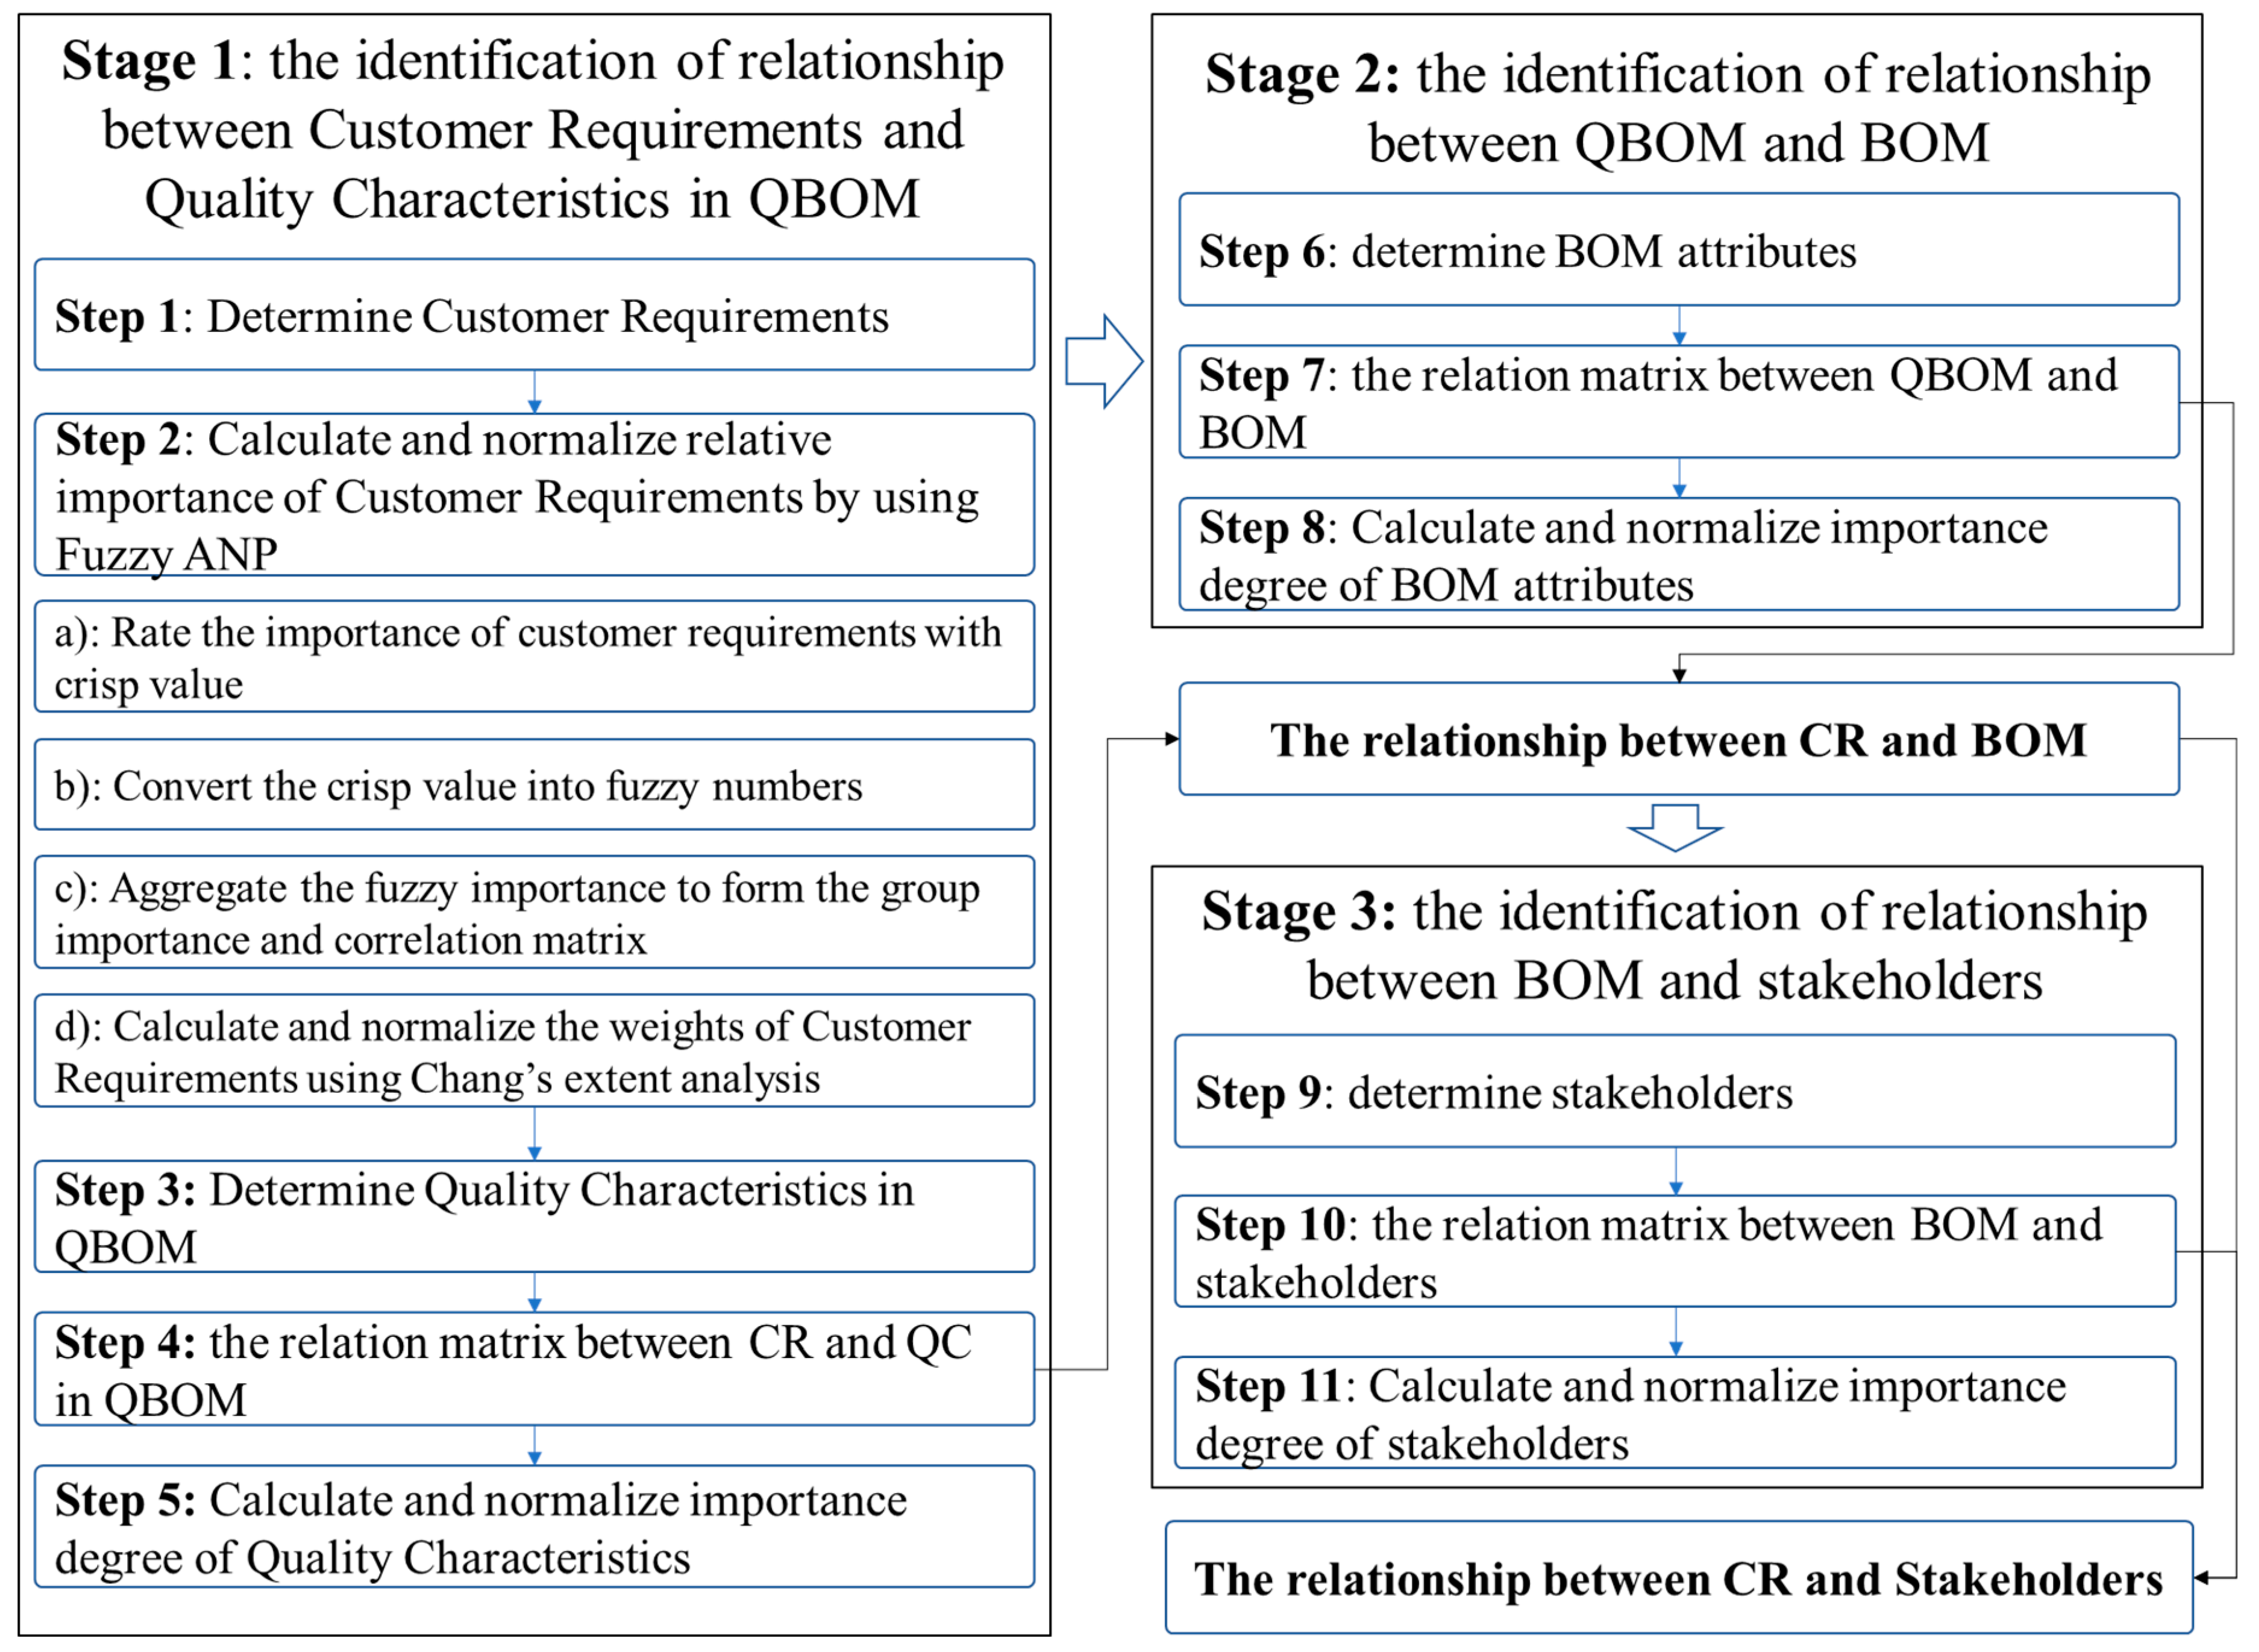
The process can be divided into three stages, as shown in Figure 6.
Stage 1 aims to identify the relationship between customer requirements (CR) and quality characteristics (QC) in QBOM. Stage 2 deals with identification of the relationship between quality characteristics in QBOM and BOM attributes. Stage 3 is responsible for identifying the relationship between BOM attributes and stakeholders.
Based on stage 1, stage 2, and stage 3, the relationship between product-service and stakeholders is identified. Based on stage 1 and stage 2, the relationship between customer requirements and BOM attributes is identified. Based on stage 2 and stage 3, the relationship between QBOM and stakeholders is identified.

3.3. The Process of the Proposed Model

3.3.1. Stage 1: Identification of the Relationship between Customer Requirements and Quality Characteristics in QBOM

1. Step1: Determine customer requirements for product-service
Customer requirements are generated by a market survey and focus interview.
2. Step 2: Calculate and normalize relative importance degree of customer requirements by using fuzzy ANP
The fuzzy set theory is used to address the vague rating issues. In this section, the fuzzy analytic network process (ANP) approach is used for figuring out the interdependence between customer requirements (CR) in stage 1. Typically, trapezoidal fuzzy number and triangular fuzzy number are the most common fuzzy numbers. A triangular fuzzy number is defined as A ˜ = ( l ,   m ,   u ) , the membership function f(x) is presented in Equation (1).
f ( x ) = { x l m l ,   l < x m u x u m ,   m < x u 0   ,   o t h e r w i s e
The steps of using fuzzy ANP are as follows:
(a) Rate the importance of customer requirements with crisp value
The importance of CR is rated with a 1-3-5-7-9 scale. Score 1 means being equally important, score 9 refers to being absolutely more important, as shown in Table 3.
(b) Convert the crisp value into fuzzy numbers
The crisp value of importance of CR is converted into fuzzy numbers, as shown in Table 3.
(c) Aggregate the fuzzy importance to form the group importance and correlation matrix
Let A 1 ˜ = ( a 1 , a 2 , a 3 ) , B 1 ˜ = ( b 1 , b 2 , b 3 ) be the fuzzy numbers, then the fuzzy number operation for multiplication of two fuzzy numbers is (Babbar and Amin 2018), as shown in Equation (2).
A 1 ˜ B 1 ˜ = ( a 1 b 1 , a 2 b 2 , a 3 b 3 )
The geometric mean method in [28] is employed to generate the aggregation of ratings made by k experts.
R ˜ = ( r ˜ i j ) m × m = ( k = 1 K r ˜ i j k K ) m × m = ( k = 1 K l ˜ i j k K , k = 1 K m ˜ i j k K , k = 1 K u ˜ i j k K ) m × m
R ˜ k = ( r ˜ i j k ) m × m is the correlation matrix where r ˜ i j k = ( l ˜ i j k , m ˜ i j k , u ˜ i j k ) is the importance of the ith quality characteristic and jth quality characteristic assessed by the kth expert.
(d) Calculate and normalize the weights of customer requirements using Chang’s extent analysis [29].
The extent analysis method and steps in [29,30] are used to determine the crisp value of weights of customer requirements.
The fuzzy synthetic extent for S ˜ E i is defined by Equation (4).
S ˜ E i = ( l i , m i , u i ) = ( j = 1 m r ˜ i j ) [ i = 1 m j = 1 m r ˜ i j ] 1 = ( j = 1 m l ˜ i j i = 1 m j = 1 m u ˜ i j , j = 1 m m ˜ i j i = 1 m j = 1 m m ˜ i j , j = 1 m u ˜ i j i = 1 m j = 1 m l ˜ i j )
The degree of possibility of S ˜ E i S ˜ E j is defined by Equation (5).
V ( S ˜ E i S ˜ E j ) = s u p [ min ( μ S ˜ E i ( x ) , μ S ˜ E j ( y ) ) ]
Which can be expressed by Equation (6).
V ( S ˜ E 1 S ˜ E 2 ) = { 1 m 1 m 2 0 l 2 u 1 l 2 u 1 ( m 1 u 1 ) ( m 2 l 2 ) o t h e r w i s e
The degree of possibility for a convex fuzzy number to be greater than other convex fuzzy numbers can be expressed by Equation (7).
d ( S ˜ E i ) = Min   V ( S ˜ E i S ˜ E j )
where j = 1, 2, …, m, j i.
The normalized weight vector W is given by Equation (8).
W = ( d ( S ˜ E 1 ) i = 1 m d ( S ˜ E 1 ) , d ( S ˜ E i ) i = 1 m d ( S ˜ E i ) , , d ( S ˜ E m ) i = 1 m d ( S ˜ E m ) ) T
where W is a crisp number.
The proposed model and approach to identify the linkage between stakeholders and final product-service are discussed in the next section.
3. Step 3: Determine quality characteristics in QBOM
Consulting the domain experts, including developers, quality engineers, service engineers, and designers, the quality characteristics in QBOM can be acquired. The quality characteristics are function supporting usability, reliability, accessibility, availability, safety, and interaction.
4. Step 4: The relation matrix between CR and QC
The relation between CR and QC is rated with very high influence, high influence, medium influence, low influence, and very low influence, as shown in Table 4.
5. Step 5: Calculate and normalize importance degree of quality characteristics
Equation (3) is used to aggregate the group relationship. The fuzzy weight of quality characteristics w c ˜ j is shown in Equation (9), the crisp weight of quality characteristics w c j can be calculated by Equations (4)–(8).
w c ˜ j = i = 1 m p ˜ i j × w i
To defuzzify the numbers, Equation (10) is used.
D F = 1 4 ( l + 2 m + u )
w c j = w c j j = 1 n w c j
where w i represents the weight of ith customer requirement, w c j is the normalized importance of quality characteristics.

3.3.2. Stage 2: Identification of the Relationship between QBOM and BOM

The second stage is to clarify the relationship between quality characteristics in QBOM and attributes in BOM (i.e., matrix W p B O M p Q B O M T and matrix W s B O M s Q B O M T ), as shown in Figure 5c,d. BOM represents the structure and composition relationship of the product or service. Product QBOM represents the structure based on function availability. Service QBOM represents the structure based on serviceability. The mapping between product BOM and product QBOM depends on the relationship between structure and function. The mapping between service BOM and service QBOM rely on the relationship between structure and service function.
As mentioned above, QFD is also used to translate the QBOM attributes into BOM attributes. In Figure 5c, the correlation matrix of product QBOM and product QBM is W pBOM pQBOM T = ( v ij ) t × k . The correlation tri-matrix of product BOM can be used to generate a product BOM-based structure network. The weight of elements in product BOM (i.e., structure) can be acquired through the QFD process.
Likewise, in Figure 5d, the correlation matrix of quality characteristics and service QBM is W s B O M s Q B O M T = ( l i j ) h × j . The correlation tri-matrix of service BOM can be used to generate the service BOM-based structure network. The weight of elements in service BOM (i.e., service structure) can be acquired through the QFD process.
6. Step 6: Determine BOM attributes
Consulting the domain experts, including quality engineers, service engineers, and designers, the attributes in BOM can be obtained. The BOM attributes are structure-related attributes, such as service module, physical part, and component.
7. Step 7: The relation matrix between QBOM and BOM
The relation between QBOM and BOM is rated with very high influence, high influence, medium influence, low influence, and very low influence, as shown in Table 4.
8. Step 8: Calculate and normalize importance degree of BOM attributes
Equation (3) is used to aggregate the group relationship. The fuzzy weight of BOM attributes w b ˜ j is shown in Equation (12), the crisp weight of BOM attributes w b j can be calculated by Equations (4)–(8). w b j is the normalized importance of BOM attributes, as shown in Equation (13).
w b ˜ j = i = 1 m u ˜ i j × w c i
w b j = w b j j = 1 n w b j

3.3.3. Stage 3: Identification of the Relationship between BOM and Stakeholders

The expected relationship between BOM and stakeholders can be acquired by using QFD, as shown in Figure 5e,f.
9. Step 9: Determine stakeholders
As mentioned in previous sections, stakeholders are engaged in the whole value lifecycle, product lifecycle, and service lifecycle to co-create value. The quality characteristics in each phase are affected by the stakeholders in interaction and collaboration. As a result, the final quality is influenced by the stakeholders in an ecosystem. The stakeholders are determined by consulting manager, product developer, quality engineers, service engineers, manufacturers, etc.
10. Step 10: The relation matrix between BOM and stakeholders
The relation between BOM and stakeholders is rated with very high influence, high influence, medium influence, low influence, and very low influence, as shown in Table 4.
11. Step 11: Calculate and normalize importance degree of stakeholders
Equation (3) is used to aggregate the group relationship. The fuzzy weight of stakeholders w s ˜ j is shown in Equation (14), the crisp weight of stakeholders w s j can be calculated by Equations (4)–(8). w s j is the normalized importance of stakeholders, as shown in Equation (15).
w s ˜ j = i = 1 m v ˜ i j × w b i
w s j = w s j j = 1 n w s j

4. Case Study

With the rapid growth of car ownership in recent years, China has moved into the second largest market around the world. The automobile aftermarket attracts much attention. In a narrow sense, the automobile aftermarket includes replacement of the spare part, maintenance-repair-overhaul (MRO) service automobile decorative beauty, and modification. As a service provider in the automobile aftermarket, Company CX extends the traditional MRO service to a broad sense, by building a service ecosystem of the automobile aftermarket. It covers the user lifecycle of the driver, including new vehicle, second-hand vehicle, repair, car wash, replacement, car rental, automobile insurance, and automobile finance. With the shift from a product-oriented solution to service-oriented solution, as a matter of fact, it requires more emphasis on product-service than product or service only. Owing to the fact that the various kinds of service are distributed in the service ecosystem, to manage and ensure the quality, it calls for a product service ecosystem.

4.1. PSS Ecosystem in the Automobile Aftermarket

Company CX and its stakeholders co-constructed a PSS ecosystem in the automobile market, as shown in Figure 7.
The PSS ecosystem of the automobile market is based on a product-service orchestration platform. The stakeholders of the ecosystem include suppliers, customers, partners, and Company CX. Their roles and responsibilities are shown in Table 5.

4.2. The Application of Proposed Model for Product-Service Ecosystem in Automobile Aftermarket

4.2.1. Identification of the Relationship between Customer Requirements and QBOM in Automobile Aftermarket

1. Step 1: Determine customer requirements for product-service based on SERVQUAL
Fifteen key customer requirements are identified via questionnaire, market survey, and interviews. They are “Functionality (CR1), Durability (CR2), Special attention to the user (CR3), Guidance (CR4), Willingness to help (CR5), Modern physical equipment or tools (CR6), Cleanliness of the environment (CR7), Additional services CR8), Delivery of promised service (CR9), Dependable personnel (CR10), Safety (CR11), Information safety and privacy (CR12), Prompt service delivery (CR13), Immediate response (CR14), Users value-centric (CR15).
2. Step 2: Calculate relative importance degree of customer requirements by using fuzzy ANP
Six customer representatives were chosen to rate the relative importance of customer requirements with linguist variables by pairwise comparisons. Triangle fuzzy numbers were used to address the vague. The geometric mean method was used to aggregate the fuzzy number to compute the relative importance of each customer requirement, as shown in Equation (3). The aggregated relation fuzzy matrix of customer requirements is shown in Table 6.
The results of the fuzzy synthetic extent for S ˜ E i are shown below by using Equation (4). S ˜ E 1 = ( 0.038 , 0.084 , 0.224 ) , S ˜ E 2 = ( 0.038 , 0.087 , 0.224 ) , S ˜ E 3 = ( 0.037 , 0.088 , 0.221 ) , S ˜ E 4 = ( 0.037 , 0.081 , 0.205 ) , S ˜ E 5 = ( 0.035 , 0.077 , 0.191 ) , S ˜ E 6 = ( 0.031 , 0.076 , 0.186 ) , S ˜ E 7 = ( 0.028 , 0.066 , 0168 ) , S ˜ E 8 = ( 0.027 , 0.068 , 0.164 ) , S ˜ E 9 = ( 0.025 , 0.062 , 0.147 ) , S ˜ E 10 = ( 0.023 , 0.062 , 0.14 ) , S ˜ E 11 = ( 0.021 , 0.049 , 0.129 ) , S ˜ E 12 = ( 0.02 , 0.053 , 0.118 ) , S ˜ E 13 = ( 0.018 , 0.045 , 0.108 ) , S ˜ E 14 = ( 0.017 , 0.05 , 0.101 ) , S ˜ E 15 = ( 0.017 , 0.051 , 0.092 ) .
The results of the degree of possibility of S ˜ E i S ˜ E j are shown in Table 7 by using Equations (5)–(7). The results form a S 15 × S 15 matrix, where V ( S ˜ E i S ˜ E j ) = C ij , for example, V ( S ˜ E 1 S ˜ E 2 ) = 0.987 , V ( S ˜ E 1 S ˜ E 3 ) = 0.979 , V ( S ˜ E 1 S ˜ E 4 ) = 1 , V ( S ˜ E 1 S ˜ E 5 ) = 1 , V ( S ˜ E 1 S ˜ E 6 ) = 1 .
The weight of customer requirements were calculated by Equation (7). d ( S ˜ E i ) = { 0.62 ,   0.601 ,   0.597 ,   0.652 ,   0.693 ,   0.709 ,   0.812 ,   0.782 ,   0.833 ,   0.836 ,   0.962 ,   0.919 , 1 , 0.953 , 0.937 } , the normalized weights of customer requirements are calculated by using Equation (8). w1 = 0.052, w2 = 0.051, w3 = 0.05, w4 = 0.055, w5 = 0.058, w6 = 0.06, w7 = 0.068, w8 = 0.066, w9 = 0.07, w10 = 0.07, w11 = 0.081, w12 = 0.077, w13 = 0.084, w14 = 0.08, w15 = 0.079.
According to the value of normalized weights, the importance of customer requirements can be ranked as follows.
CR13 > CR11 > CR14 > CR15 > CR12 > CR10 > CR9 > CR7 > CR8 > CR6 > CR5 > CR4 > CR1 > CR2 > CR3. It means that prompt service delivery is the most important.
3. Step 3: Determine quality characteristics in QBOM of the automobile aftermarket
By consulting the automobile industry experts, the product-service quality characteristics are design features of product function (QC1), process features of product function (QC2), production features of product function (QC3), service transparency (QC4), service standardization (QC5), diversity of service (QC6), and service efficiency (QC7).
4. Step 4: Correlation matrix between customer requirements and quality characteristics
The relationship between customer requirements and quality characteristics was rated by a group of experts, including service engineers, quality engineers, and managers. The aggregated matrix is shown in Table 8.
5. Step 5: Calculate and normalize the importance of quality characteristics
The fuzzy weight of quality characteristics w c ˜ j is as follows by using Equation (9). w c ˜ j = { ( 0.328 , 0.507 , 0.607 ) , ( 0.391 , 0.55 , 0.65 ) , ( 0.386 , 0.551 , 0.651 ) , ( 0.344 , 0.505 , 0.605 ) , ( 0.620 , 0.738 , 0.839 ) , ( 0.377 , 0.538 , 0.639 ) , ( 0.454 , 0.601 , 0.702 ) } .
To defuzzify the numbers, Equation (10) was used. By using Equation (11), the normalized weights of quality characteristics are w c 1 = 0.125 , w c 2 = 0.137 , w c 3 = 0.137 , w c 4 = 0.126 , w c 5 = 0.188 , w c 6 = 0.134 , w c 1 = 0.151 .

4.2.2. Identification of the Relationship between QBOM and BOM in Automobile Aftermarket

6. Step 6: Determine BOM attributes
By consulting the automobile industry experts, the BOM attributes are design features of product structure (BA1), process features of product structure (BA2), production features of product structure (BA3), quality features of spare part (BA4), quality features of MRO service (BA5), and quality features of life service (BA6).
7. Step 7: The relation matrix between QBOM and BOM
The relationship between QCs in QBOM and BAs in BOM is rated with very high influence, high influence, medium influence, low influence, and very low influence. The results are shown in Table 9.
8. Step 8: Calculate and normalize importance degree of BOM attributes
The fuzzy weight of BOM attributes w b ˜ j is as follows by using Equation (12). w b ˜ j = { ( 0.51 , 0.632 , 0.732 ) , ( 0.236 , 0.446 , 0.546 ) , ( 0.211 , 0.421 , 0.521 ) , ( 0.248 , 0.45 , 0.55 ) , ( 0.644 , 0.763 , 0.864 ) , ( 0.37 , 0.554 , 0.655 ) } .
To defuzzify the numbers, Equation (10) was used. By using Equation (13), the normalized weights of quality characteristics are w b 1 = 0.199 , w b 2 = 0.133 , w b 3 = 0.125 , w b 4 = 0.134 , w b 5 = 0.24 , w b 6 = 0.169 .

4.2.3. Identification of the Relationship between BOM and Stakeholders for QME in Automobile Aftermarket

9. Step 9: Determine the stakeholders
Apart from customers, the stakeholders are company CX (St1), spare part supplier A (St2), spare part supplier B (St3), spare part supplier C (St4), automobile company (St5), vehicle service provider D (St6), vehicle service provider E (St7), life service provider F (St8), life service provider G (St9), and e-commerce channel partner (St10).
10. Step 10: The relation matrix between BOM attributes and stakeholders
The relation between BOM attributes and stakeholders is rated with very high influence, high influence, medium influence, low influence, and very low influence. The results are shown in Table 10.
11. Step 11: Calculate and normalize importance degree of stakeholders
The fuzzy weight of stakeholders w s ˜ j is as follows by using Equation (14). w s ˜ j = { ( 0.317 , 0.507 , 0.607 ) , ( 0.344 , 0.525 , 0.626 ) , ( 0.415 , 0.578 , 0.678 ) , ( 0.464 , 0.611 , 0.712 ) , ( 0.4 , 0.562 , 0.662 ) , ( 0.233 , 0.427 , 0.528 ) , ( 0.192 , 0.386 , 0.486 ) , ( 0.146 , 0.371 , 0.471 ) , ( 0.164 , 0.389 , 0.489 ) , ( 0.134 , 0.376 , 0.478 ) } .
To defuzzify the numbers, Equation (10) was used. By using Equation (15), the normalized weights of quality characteristics are as follows: w s 1 = 0.108 , w s 2 = 0.112 , w s 3 = 0.125 , w s 4 = 0.133 , w s 5 = 0.121 , w s 6 = 0.09 , w s 7 = 0.081 , w s 8 = 0.075 , w s 9 = 0.08 , w s 10 = 0.076 .
The relationship between product-service and stakeholders can be obtained by using the matrix mapping approach and the results of the correlation matrix, as shown in Table 8, Table 9 and Table 10. The correlation matrix between customer requirements for product-service and stakeholders in the fuzzy number form and crisp value form is shown in Table 11.
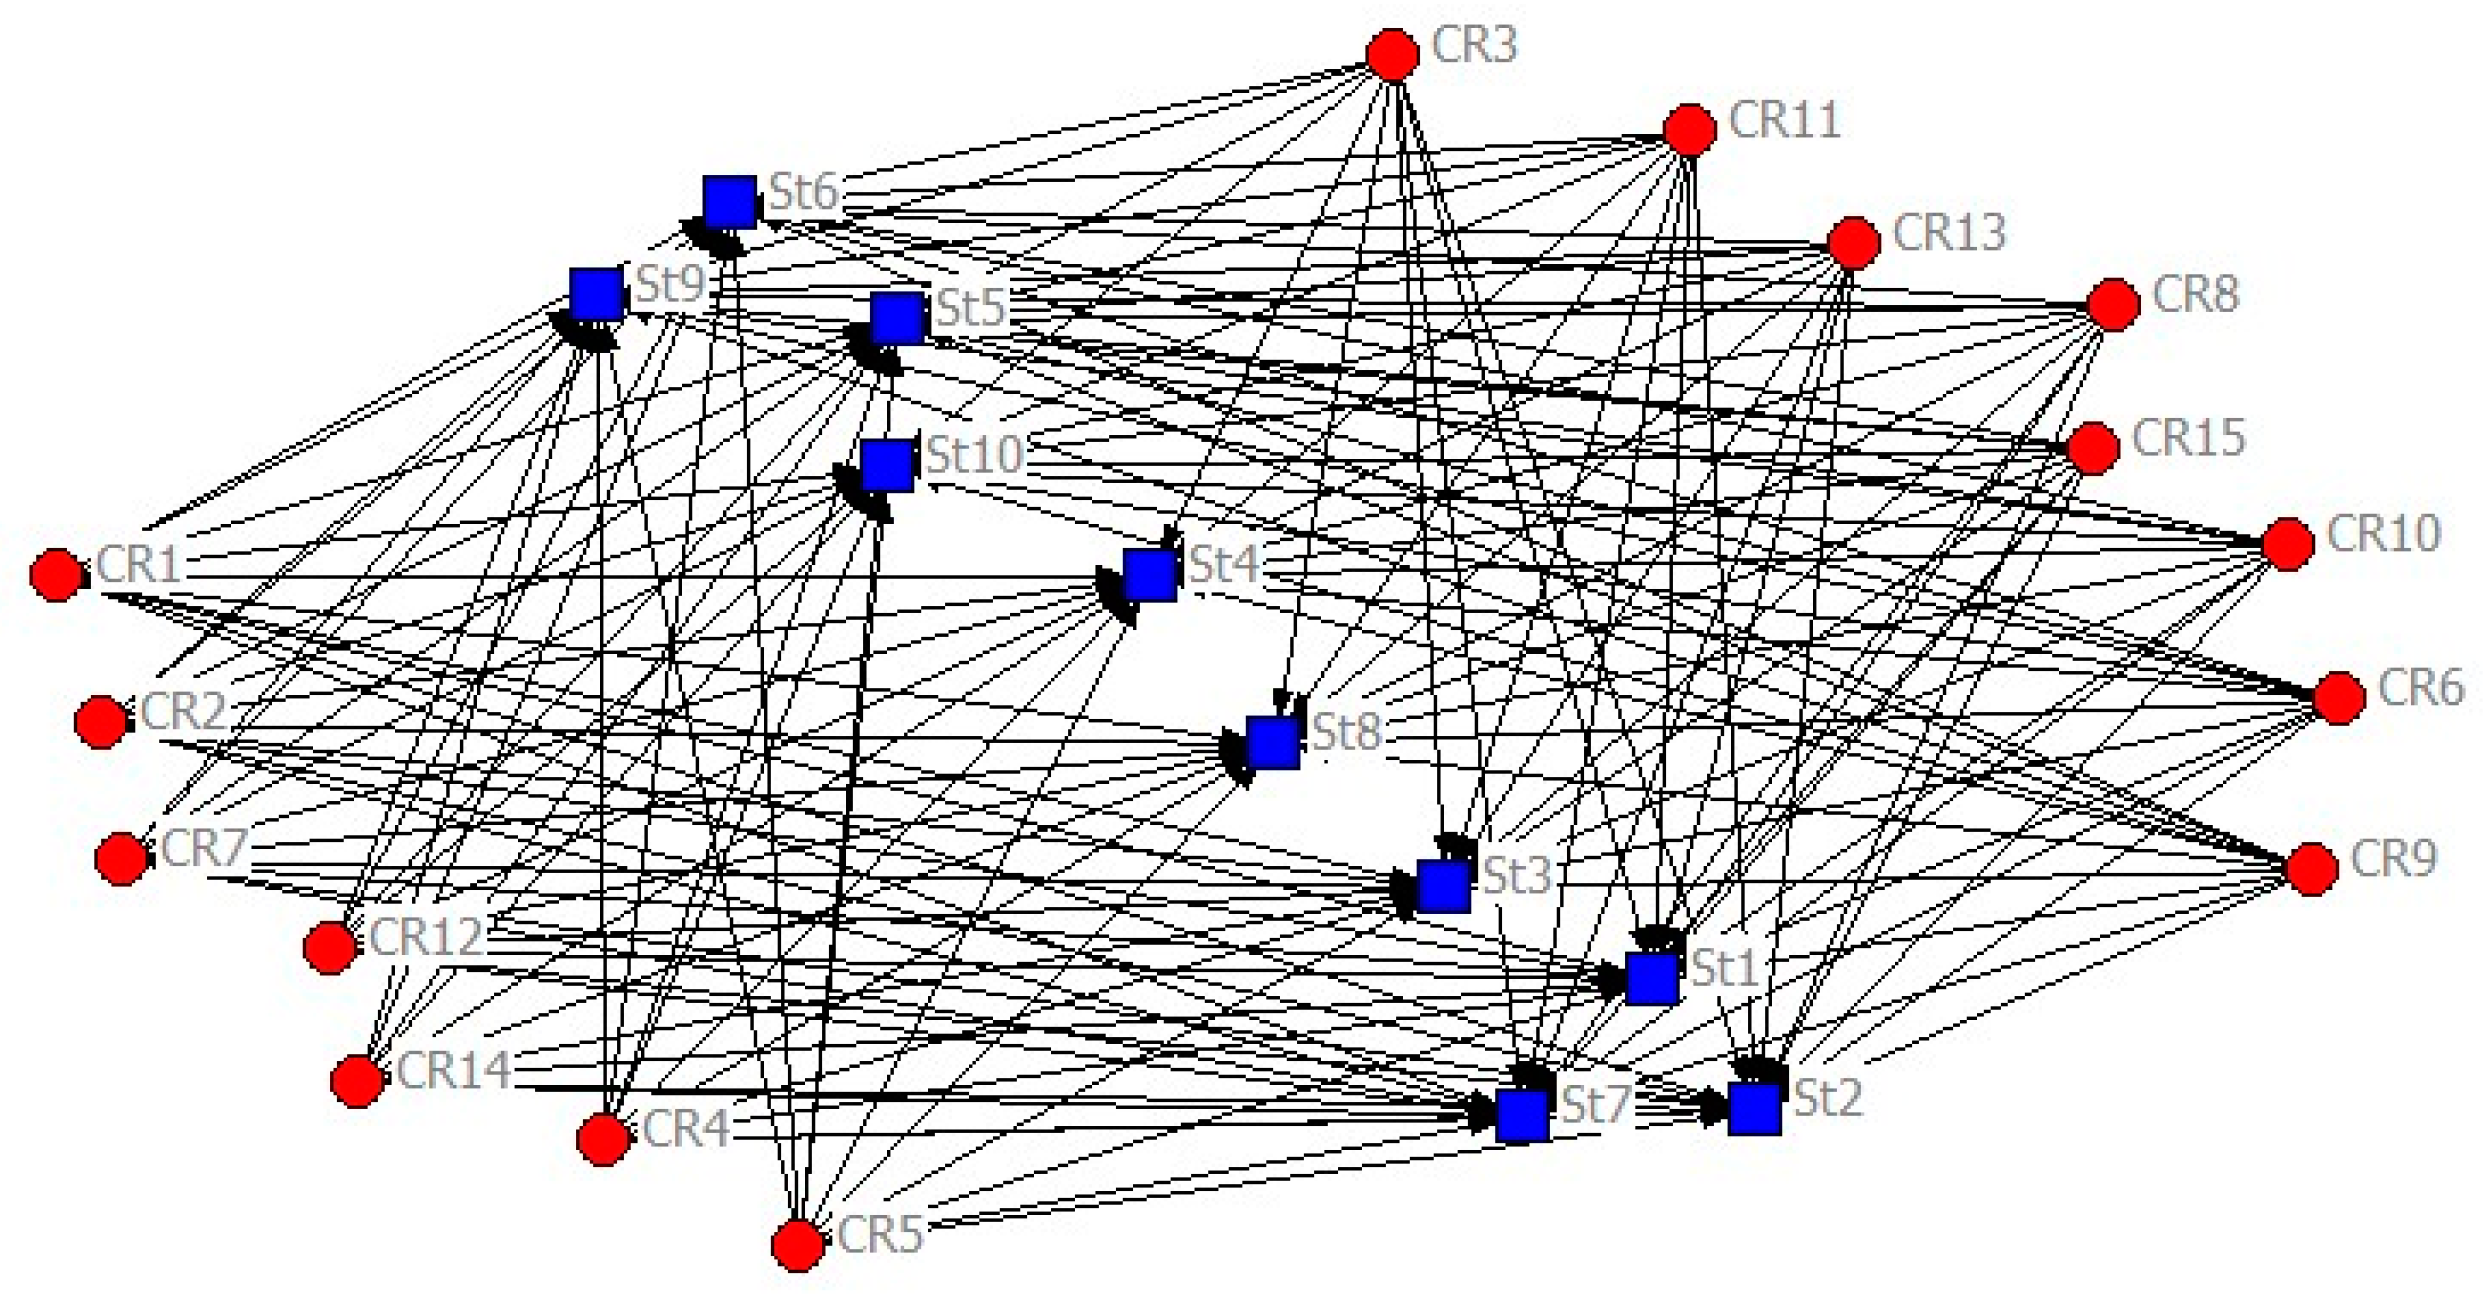
Figure 8 depicts the mapping between final product-service and stakeholders.
The results show that the top five stakeholders in terms of importance are spare part supplier C (St4), spare part supplier B (St3), automobile company (St5), spare part supplier A (St2), and company CX (St1). After implementing the product-service ecosystem, company CX has transformed from a MRO service provider in the automobile aftermarket to an ecosystem orchestrator. The proportion of life service provider in the ecosystem has increased gradually in comparison with a conventional automobile sales service. By mapping the relationship between product-service and stakeholders, Company CX has introduced more qualified partners into the ecosystem, such as spare part supplier C, who provides both a spare part and vehicle service. Although the importance degree of Company CX itself is not the highest, it plays the role of a leader to make the ecosystem as a whole. The value of the ecosystem is bigger than the sum of the individual value of the stakeholders, which demonstrates the competitiveness of the ecosystem.

5. Discussion

5.1. Theoretical Implication

Firstly, compared with the two-phase QFDforPSS methods, we took a step further based on previous studies by proposing a three-stage fuzzy ANP-QFD for PSS.
Secondly, this study investigated PSS stakeholders by using the ecosystem theory, the relationship between PSS offerings and stakeholders was identified, which contribute to the decision-making on the stakeholders’ selection in PSS development.
Thirdly, the ANP-QFD method was not new, but our methodology was developed from the quality management perspective. The inputs considered the product quality and service quality by using a modified SERVQUAL model. Customer requirements were translated into quality characteristics instead of engineering characteristics. The lifecycle quality BOM was presented in this study.
A comparison of our method with other QFDforPSS methodologies was conducted in Table 12.

5.2. Practical Implication

This work contributes to a sustainable PSS design by providing an ecosystem thinking that moves from product thinking or service system thinking. The design focus of practitioners is the quality of combined product and service. The design scope is enlarged from PSS to PSS stakeholders.
In the field of a PSS sustainable business model innovation, sustainable values co-created by social stakeholders throughout the lifecycle are emphasized by enterprises. The three-stage fuzzy ANP-QFD methodology can be used as references for focal enterprise in stakeholder configuration when constructing the PSS ecosystem. More economic and social values will be generated owing to the interaction of multiple actors.
In addition, the proposed model and approach of this paper can be applied in the stakeholder network configuration in PSS ecosystem design practices to improve the environmental and social performances of the PSS ecosystem.

6. Conclusions and Future Directions

In this paper, inspired by ecosystem thinking, a multi-QFD model for the PSS ecosystem was proposed. As such, a three-stage fuzzy ANP-QFD approach was employed through the identification of the relationship among customer requirements, QBOM, BOM, and stakeholders. A case study was presented to illustrate the proposed framework application in the automobile aftermarket.
The contributions of this paper are two-fold: (1) A model of PSS was proposed. (2) A three-stage fuzzy ANP-QFD and approach was proposed to identify the relationship between stakeholders and final PSS offerings.
The limitation of this paper was that it did not differentiate the types of product-service ecosystem (i.e., integration-oriented PSS ecosystem, product-oriented PSS ecosystem, service-oriented PSS ecosystem, use-oriented PSS ecosystem, and result-oriented PSS ecosystem).
Future research will focus on the following aspects: (1) Network analysis, such as stakeholder network, BOM attributes network, and customer requirements network, etc. (2) Information sharing and fusion among networks, including product-service networks, stakeholders networks, function networks, structure networks, etc. (3) Application of the proposed model and approach in different types of the PSS ecosystem (i.e., integration-oriented, product-oriented, service-oriented, use-oriented, and result-oriented PSS ecosystem).

Author Contributions

Conceptualization, D.Y. and Z.L.; Data curation, X.Z.; Formal analysis, X.Z.; Funding acquisition, X.M.; Investigation, X.M.; Methodology, D.Y.; Project administration, X.M.; Software, X.Z.; Supervision, X.M.; Validation, Z.L.; Writing—original draft, D.Y.; Writing—review & editing, D.Y. All authors have read and agreed to the published version of the manuscript.

Funding

This research was funded by the National Natural Science Foundation of China, grant number [71632008], and the National Science and Technology Major Project, grant number [2017-I-0007-0008] and [2017-I-0011-0012]. And The APC was funded by the National Natural Science Foundation of China, grant number [71632008], the National Science and Technology Major Project, grant number [2017-I-0007-0008] and [2017-I-0011-0012].

Acknowledgments

The authors would like to thank the SJTU Innovation Center of Producer Service Development, the Shanghai Research Center for industrial Informatics for the support to this research. The authors also would like to thank the reviewers and editors for their helpful and kindly suggestions.

Conflicts of Interest

The authors declare no conflict of interest.

References

  1. West, S.; Gaiardelli, P.; Resta, B.; Kujawski, D. Co-creation of value in product-service systems through transforming data into knowledge. IFAC-PapersOnLine 2018, 51, 1323–1328. [Google Scholar] [CrossRef]
  2. Zheng, M.; Ming, X.; Wang, L.; Yin, D.; Zhang, X. Status review and future perspectives on the framework of smart product service ecosystem. Procedia CIRP 2017, 64, 181–186. [Google Scholar] [CrossRef]
  3. Cibat, J.; Süße, T.; Wilkens, U. An ecosystem approach as a design principle for a PSS-specific business simulation. Procedia CIRP 2017, 64, 223–228. [Google Scholar] [CrossRef]
  4. Geng, X.; Chu, X.; Xue, D.; Zhang, Z. A systematic decision-making approach for the optimal product-service system planning. Expert Syst. Appl. 2011, 38, 11849–11858. [Google Scholar] [CrossRef]
  5. Bustinza, O.F.; Gomes, E.; Vendrell-Herrero, F.; Baines, T. Product-service innovation and performance: The role of collaborative partnerships and R&D intensity. R&D Manag. 2017, 49, 33–45. [Google Scholar] [CrossRef]
  6. Fargnoli, M.; Haber, N. A practical ANP-QFD methodology for dealing with requirements’ inner dependency in PSS development. Comput. Ind. Eng. 2019, 127, 536–548. [Google Scholar] [CrossRef]
  7. Haber, N.; Fargnoli, M.; Sakao, T. Integrating QFD for product-service systems with the Kano model and fuzzy AHP. Total Qual. Manag. Bus. Excel. 2018. [Google Scholar] [CrossRef]
  8. Geng, X.; Chu, X.; Xue, D.; Zhang, Z. An integrated approach for rating engineering characteristics’ final importance in product-service system development. Comput. Ind. Eng. 2010, 59, 585–594. [Google Scholar] [CrossRef]
  9. Neely, A.; Neely, A.D. Exploring the financial consequences of the servitization of manufacturing. Oper. Manag. Res. 2008, 1, 103–118. [Google Scholar] [CrossRef] [Green Version]
  10. Hockerts, K.; Weaver, N. Towards a theory of sustainable product service systems—What are the dependent and independent variables of S-PSS? In Proceedings of the INSEAD-CMER Research Workshop on Sustainable Product Service Systems—Key Definitions and Concepts, Fontainebleau, France, 9 May 2002. [Google Scholar]
  11. Song, W.; Sakao, T. Service conflict identification and resolution for design of product-service offerings. Comput. Ind. Eng. 2016, 98, 91–101. [Google Scholar] [CrossRef] [Green Version]
  12. Fargnoli, M.; Sakao, T. Uncovering differences and similarities among quality function deployment based methods in design for X: Benchmarking in different domains. Qual. Eng. 2016, 29, 690–712. [Google Scholar] [CrossRef]
  13. Jacobides, M.G.; Cennamo, C.; Gawer, A. Towards a theory of ecosystems. Strateg. Manag. J. 2018, 39, 2255–2276. [Google Scholar] [CrossRef] [Green Version]
  14. Durugbo, C. Collaborative networks: A systematic review and multi-level framework. Int. J. Prod. Res. 2015, 54, 3749–3776. [Google Scholar] [CrossRef]
  15. Teece, D.J. Explicating dynamic capabilities: The nature and microfoundations of (sustainable) enterprise performance. Strateg. Manag. J. 2007, 28, 1319–1350. [Google Scholar] [CrossRef] [Green Version]
  16. Alaimo, C.; Kallinikos, J.; Valderrama, E. Platforms as service ecosystems: Lessons from social media. J. Inf. Technol. 2019, 35, 25–48. [Google Scholar] [CrossRef] [Green Version]
  17. Acs, Z.J.; Stam, E.; Audretsch, D.B.; O’Connor, A. The lineages of the entrepreneurial ecosystem approach. Small Bus. Econ. 2017, 49, 1–10. [Google Scholar] [CrossRef]
  18. Spigel, B.; Harrison, R.J. Toward a process theory of entrepreneurial ecosystems. Strateg. Entrep. J. 2017, 12, 151–168. [Google Scholar] [CrossRef] [Green Version]
  19. Granstrand, O.; Holgersson, M. Innovation ecosystems: A conceptual review and a new definition. Technovation 2020. [Google Scholar] [CrossRef]
  20. Chen, Z.; Dahlgaard-Park, S.M.; Yu, L. Service quality management and ecosystem theory. Total Qual. Manag. Bus. Excel. 2014, 25, 1190–1205. [Google Scholar] [CrossRef]
  21. Fayoumi, A. Ecosystem-inspired enterprise modelling framework for collaborative and networked manufacturing systems. Comput. Ind. 2016, 80, 54–68. [Google Scholar] [CrossRef] [Green Version]
  22. Aarikka-Stenroos, L.; Ritala, P. Network management in the era of ecosystems: Systematic review and management framework. Ind. Mark. Manag. 2017, 67, 23–36. [Google Scholar] [CrossRef]
  23. Adner, R. Ecosystem as structure: An actionable construct for strategy. J. Manag. 2017, 43, 39–58. [Google Scholar] [CrossRef]
  24. Kuhlenkötter, B.; Wilkens, U.; Bender, B.; Abramovici, M.; Suesse, T.; Göbel, J.; Herzog, M.; Hypki, A.; Lenkenhoff, K. New perspectives for generating smart PSS solutions—Life cycle, methodologies and transformation. Procedia CIRP 2017, 64, 217–222. [Google Scholar] [CrossRef]
  25. Meier, H.; Roy, R.; Seliger, G. Industrial product-service systems—IPS 2. CIRP Ann. 2010, 59, 607–627. [Google Scholar] [CrossRef]
  26. Phillips, M.A.; Ritala, P. A complex adaptive systems agenda for ecosystem research methodology. Technol. Forecast. Soc. Chang. 2019, 148, 119739. [Google Scholar] [CrossRef]
  27. Parasuraman, A.; Zeithaml, V.A.; Berry, L.L. SERVQUAL: A multiple-item scale for measuring consumer perception of service quality. J. Retail. 1988, 64, 2–40. [Google Scholar]
  28. Ocampo, L.; Alinsub, J.; Casul, R.A.; Enquig, G.; Luar, M.; Panuncillon, N.; Bongo, M.; Ocampo, C.O. Public service quality evaluation with SERVQUAL and AHP-TOPSIS: A case of Philippine government agencies. Socio-Econ. Plan. Sci. 2019, 68, 100604. [Google Scholar] [CrossRef]
  29. Chang, D.-Y. Applications of the extent analysis method on fuzzy AHP. Eur. J. Oper. Res. 1996, 95, 649–655. [Google Scholar] [CrossRef]
  30. Mavi, R.K.; Standing, C. Critical success factors of sustainable project management in construction: A fuzzy DEMATEL-ANP approach. J. Clean. Prod. 2018, 194, 751–765. [Google Scholar] [CrossRef]
Figure 1. Scheme of the quality function deployment for product-service system (QFDforPSS) method and mapping of the relationship between integrated product-service offerings and stakeholders.
Sustainability 12 03329 g001
Figure 2. The conceptual structure of a PSS ecosystem.
Sustainability 12 03329 g002
Figure 3. An example of the relationship between stakeholders and bill of materials (BOM).
Sustainability 12 03329 g003
Figure 4. BOM and quality BOM (QBOM) throughout the product lifecycle in a PSS ecosystem.
Sustainability 12 03329 g004
Figure 5. A multi-QFD model of the mapping relationship between stakeholders and final product-service. (a) the HoQ for product quality characteristics, (b) the HoQ for service quality characteristics, (c) the HoQ for product BOM, (d) the HoQ for service BOM, (e) the HoQ for product-related stakeholders, (f) the HoQ for service-related stakeholders.
Sustainability 12 03329 g005
Figure 6. The general process for clarifying the relationship between customer requirements (CR) and stakeholders.
Sustainability 12 03329 g006
Figure 7. A schematic view of PSS ecosystem in the automobile aftermarket.
Sustainability 12 03329 g007
Figure 8. The network mapping the relationship between product-service and stakeholders.
Sustainability 12 03329 g008
Table 1. Literatures on QFDforPSS and the ecosystem theory for PSS.
LiteraturesResearch ThemePSS ModelingLinkage between PSS Offerings and StakeholdersMethods
Geng et al. [8]Relationship between customer requirements and engineering characteristics in PSS developmentANP network model of house of quality (HoQ)N/AFuzzy ANP-QFD
Geng et al. [4]Decision-making approach for PSS planningANP network model of house of quality (HoQ)N/AData envelopment analysis, fuzzy kano model
Fargnoli and Sakao [12]QFD-based methods in Design for XQFD for PSSN/AQFD-based DfX methods
Haber, Fargnoli, and Sakao [7]Customer requirements analysis for PSS developmentfuzzy ANP-QFD for PSSN/AFuzzy ANP-QFD, kano model
Fargnoli and Haber [6]ANP-QFD methodology for PSS developmentANP-QFD for PSSN/AANP-QFD
Chen, Dahlgaard-Park, and Yu [20]A framework model for service ecosystem based on value co-creation to manage service qualityService ecosystemN/AEcosystem theory
Zheng et al. [2]Framework of Smart Product Service EcosystemService ecosystemN/AConceptual framework
Kuhlenkötter et al. [24]Conceptualizing Smart PSS value creation as digital ecosystemDigital-based ecosystemN/ASmart engineering
Cibat, Süße, and Wilkens [3]PSS business simulationEcosystemN/ABusiness simulation
West et al. [1]Value co-creation in PSSEcosystemN/ASurvey
Table 2. Customer requirements for the final product-service from a product-service ecosystem.
DimensionSub-DimensionDescription
Goods inherent attributes (CR1)Functionality (CR11)The function and performance of components in PSS meet customers’ needs.
Durability (CR12)The lifetime under normal circumstances is long.
Appearance (CR13)The shape, color, and layout is beautiful and attractive.
Safety (CR14)The automobile has the capability to protect drivers.
Tangibility (CR2)Modern physical equipment or tools (CR21)The focal company has modern equipment or tools.
Good appearance of personnel (CR22)The appearance of the staff is elegant.
Cleanliness of the environment (CR23)The environment is clean and comfortable.
Additional services (CR24)Additional services (such as life service) are convenient.
Reliability (CR3)Accurate records (CR31)The maintenance records are up-to-date.
Delivery of promised service (CR32)The staff provide service as promised.
Consistent service delivery (CR33)Same service is provided to different customers in similar cases.
Dependable personnel (CR34)Qualified personnel is arranged to deliver service.
Responsiveness (CR4)Prompt service delivery (CR41)Service are provided without delay.
Immediate reponse (CR42)Speed handling request and respond immediately.
Willingness to help (CR43)Staffs are willing to help customers whenever needed.
Assurance (CR5)Trust to staff (CR51)Staff’s performance inspires trust.
Information safety and privacy (CR52)Security and privacy of personal infromation is assured.
Guidance (CR53)Knowledge or ability to deal with users’ problems.
Empathy (CR6)Special attention to the user (CR61)Staff pay special attention to customers’ needs.
Personalized attention to the user (CR62)Staff are concerned about customers’ individual requests.
Users value-centric (CR63)Customers’ compliants and suggestions taken into account.
Table 3. Scale of relative importance in pairwise comparison.
Linguistic VariablesScoresTriangle Fuzzy Number
Absolutely more important9(3,4,5)
Very strongly more important7(2,3,4)
More important5(1,2,3)
Weekly more important3(1,1,2)
Equally important1(0,0.5,1)
Table 4. Linguistic variables in comparison.
Linguistic VariablesTriangle Fuzzy Number
Very high infulence(0.8, 0.9, 1)
High influence(0.6, 0.7, 0.8)
Medium influence(0.4, 0.5, 0.6)
Low influence(0.05, 0.3, 0.4)
Very low influence(0, 0, 0.05)
Table 5. The multiple stakeholders of PSS ecosystem in the automobile aftermarket.
StakeholdersRoleResponsibility
Company CXPlatform Provider and RegulatorOrchestrating the product-service ecosystem in the automobile market.
CustomersConsumer and ProducerProviding requirements and evaluating the final product-service.
Spare part suppliersProduct SupplierProviding satisfactory spare part and component to the platform and assuring quality.
Automobile companyProduct SupplierProviding satisfactory new vehicle to Company CX and assuring quality.
Vehicle Service providerService SupplierProviding satisfactory MRO and refitting to the platform and assuring quality.
Life Service providerService PartnerProviding car sharing, rental, insurance to the customers, and assuring quality.
SocietyProduct PartnerProviding a second-hand car to the customers and assuring quality.
E-commerceChannel PartnerInformation acquisition and working as marketing channel.
Table 6. Aggregated relation fuzzy matrix of customer requirements.
CR1CR2CR14CR15
CR1(0, 0.5,1)(1.122,1.698,2.749)(1,1.26,2.289)(1,1.26,2.289)
CR2(0.364,0.589,0.891)(0, 0.5,1) (1,1,2)(1.122,1.201,2.245)
CR3(0.408, 0.707,1)(0.371,0.618,0.749) (1.122,1.201,2.245)(1.122,1.513,2.57)
CR4(0.467,0.891,1)(0.347,0.55,0.794) (1.906,2.942,1.122)(1.122,1.348,2.402)
CR5(0.389,0.661,0.891)(0.389,0.661,0.891) (1, 1,2)(1,1,2)
CR6(0.437,0.794,1)(0.35,0.561,0.833) (1, 2,3)(1,1.26,2.289)
CR14(0.437,0.794,1)(0.5, 1,1) (0, 0.5,1)(1,1.122,2.14)
CR15(0.437,0.794,1)(0.445,0.833,0.891)(0.467,0.891,1)(0, 0.5,1)
Table 7. The degree of possibility of S ˜ E i S ˜ E j .
S1S2S3S4S5S6S7S8S9S10S11S12S13S14S15
V ( S ˜ E 1 S ˜ E j ) *0.9870.979111111111111
V ( S ˜ E 2 S ˜ E j ) 1*0.992111111111111
V ( S ˜ E 3 S ˜ E j ) 11*111111111111
V ( S ˜ E 4 S ˜ E j ) 0.9790.9650.957*11111111111
V ( S ˜ E 5 S ˜ E j ) 0.9520.9370.9290.974*1111111111
V ( S ˜ E 6 S ˜ E j ) 0.9480.9330.9250.970.998*111111111
V ( S ˜ E 7 S ˜ E j ) 0.8770.8620.8550.90.9270.931*0.9891111111
V ( S ˜ E 8 S ˜ E j ) 0.8830.8670.860.9060.9350.941*1111111
V ( S ˜ E 9 S ˜ E j ) 0.8280.8120.8050.8520.8830.8890.9640.952*111111
V ( S ˜ E 10 S ˜ E j ) 0.8190.8030.7950.8450.8770.8830.9630.9511*11111
V ( S ˜ E 11 S ˜ E j ) 0.7170.7030.6970.7410.770.7790.8520.8410.8870.888*0.96210.9910.977
V ( S ˜ E 12 S ˜ E j ) 0.7160.70.6940.7410.7770.78710.859111*111
V ( S ˜ E 13 S ˜ E j ) 0.6410.6260.6220.6670.70.7120.7930.7820.8330.8360.9620.919*0.9530.937
V ( S ˜ E 14 S ˜ E j ) 0.6440.6440.6220.6730.710.7240.8160.8030.8620.86410.9621*0.981
V ( S ˜ E 15 S ˜ E j ) 0.620.6010.5970.6520.6930.7090.8120.7970.8650.86710.97811*
“*” means no value, where i = j; The numbers in bold means the minimum of V ( S ˜ E i S ˜ E j ) .
Table 8. The relationship between CR and quality characteristics (QC).
QC1QC2QC 7
CR1(0.755,0.856,0.956)(0.8,0.9,1)(0.05,0.3,0.4)
CR2(0.6,0.7,0.8)(0.4, 0.5,0.6) (0.05,0.3,0.4)
CR3(0.05,0.3,0.4)(0.05,0.3,0.4) (0.755,0.856,0.956)
CR4(0.05,0.3,0.4)(0.755,0.856,0.956) (0.05,0.3,0.4)
CR5(0.05,0.3,0.4)(0.05,0.3,0.4) (0.4, 0.5,0.6)
CR6(0.05,0.3,0.4)(0.05,0.3,0.4) (0.8,0.9,1)
CR14(0.05,0.3,0.4)(0.6,0.7,0.8) (0.8,0.9,1)
CR15(0.553,0.654,0.755)(0.553,0.654,0.755)(0.4, 0.5,0.6)
Table 9. The relationship between QCs in QBOM and BAs in BOM.
BA1BA2BA5BA6
QC1(0.8,0.9,1)(0.05, 0.3,0.4)(0.05, 0.3,0.4)(0.05, 0.3,0.4)
QC2(0.6,0.7,0.8)(0.755,0.856,0.956) (0.434,0.535,0.636)(0.05, 0.3,0.4)
QC3(0.05, 0.3,0.4)(0.05, 0.3,0.4) (0.8,0.9,1)(0.434,0.687,0.796)
QC4(0.51,0.612,0.713)(0.755,0.856,0.956) (0.755,0.856,0.956)(0.8,0.9,1)
QC5(0.553,0.654,0.755)(0.05, 0.3,0.4) (0.8,0.9,1)(0.434,0.535,0.636)
QC6(0.51,0.612,0.713)(0.05, 0.3,0.4) (0.755,0.856,0.956)(0.8,0.9,1)
QC7(0.553,0.654,0.755)(0.05, 0.3,0.4)(0.8,0.9,1)(0.05, 0.3,0.4)
Table 10. The relationship between BOM attributes and stakeholders.
St1St2St9St10
BA1(0.05, 0.3,0.4)(0.648,0.75,0.853)(0.05,0.3,0.4)(0.05,0.3,0.4)
BA2(0.05, 0.3,0.4)(0.763, 0.863,963) (0.05,0.3,0.4)(0.05,0.3,0.4)
BA3(0.05, 0.3,0.4)(0.05,0.3,0.4) (0.05,0.3,0.4)(0.05,0.3,0.4)
BA4(0.071,0.327,0.428)(0.648,0.75,0.853) (0.05,0.3,0.4)(0.34,0.536,0.641)
BA5(0.727,0.828,0.928)(0.05,0.3,0.4) (0.05,0.3,0.4)(0.224,0.465,0.571)
BA6(0.648,0.75,0.853)(0.05,0.3,0.4)(0.727,0.828,0.928)(0.071, 0.327,0.428)
Table 11. The correlation matrix between customer requirements and stakeholders in the fuzzy number form and crisp value.
St1CrispSt2CrispSt3CrispSt4CrispSt5Crisp
CR1(1.384, 5.966, 10.138)5.864(1.795, 6.503, 10.936)6.434(2.403, 7.297, 12.037)7.259(2.491, 7.392, 12.143)7.355(2.440, 7.169, 11.802)7.145
CR2(1.147, 4.861, 8.531)4.850(1.447, 5.259, 9.156)5.280(1.815, 5.837, 10.010)5.875(2.051, 6.027, 10.219)6.081(1.763, 5.690, 9.769)5.728
CR3(2.665, 6.846, 11.186)6.886(2.052, 6.914, 11.526)6.851(2.202, 7.569, 12.497)7.459(3.259, 8.124, 13.061)8.142(2.119, 7.311, 12.127)7.217
CR4(2.077, 6.335, 10.525)6.318(2.053, 6.683, 11.135)6.639(2.296, 7.307, 12.065)7.244(2.865, 7.649, 12.419)7.645(2.254, 7.102, 11.753)7.053
CR5(1.214, 4.457, 7.877)4.501(0.936, 4.583, 8.212)4.578(1.061, 5.046, 8.936)5.022(1.575, 5.345, 9.257)5.381(0.998, 4.896, 8.697)4.872
CR6(1.426, 5.313, 9.099)5.288(1.300, 5.532, 9.553)5.479(1.485,6.109, 10.412)6.029(2.176, 6.525, 10.846)6.518(1.338, 5.866, 10.072)5.786
CR7(1.785, 5.593, 9.468)5.610(1.457, 5.757, 9.872)5.710(1.658, 6.355, 10.758)6.281(2.453, 6.790, 11.210)6.811(1.503, 6.096, 10.400)6.024
CR8(1.753, 6.042, 10.188)6.006(1.761, 6.377, 10.787)6.325(1.899, 6.947, 11.665)6.865(2.481, 7.297, 12.026)7.275(2.083, 6.877, 11.486)6.831
CR9(2.853, 7.414, 12.096)7.445(2.873, 7.868, 12.844)7.863(3.436, 8.735, 14.049)8.739(4.189, 9.076, 14.393)9.183(3.350, 8.466, 13.659)8.485
CR10(3.692, 8.619, 13.680)8.652(3.206, 8.861, 14.242)8.793(3.548, 9.633, 15.373)9.547(4.624, 10.171, 15.909)10.219(3.567, 9.417, 15.027)9.357
CR11(2.331, 6.895, 11.326)6.862(2.228, 7.194, 11.900)7.129(2.737, 8.011, 13.037)7.949(3.263, 8.296, 13.330)8.296(2.614, 7.767, 12.680)7.707
CR12(1.708, 5.778, 9.750)5.753(1.884, 6.168, 10.386)6.151(1.874, 6.640, 11.151)6.576(2.328, 6.954, 11.480)6.929(1.905, 6.505, 10.915)6.458
CR13(2.813, 7.485, 12.140)7.481(2.613, 7.765, 12.711)7.713(3.278, 8.697, 13.977)8.662(4.041, 9.072, 14.356)9.135(3.112, 8.384, 13.545)8.356
CR14(3.199, 7.856, 12.646)7.889(2.788, 8.082, 13.172)8.031(3.465, 9.041,14.474)9.006(4.373, 9.457, 14.892)9.545(3.310,8.722, 14.032)8.697
CR15(2.857, 7.260, 11.870)7.312(2.744, 7.625, 12.525)7.630(3.154, 8.382, 13.614)8.383(3.958, 8.771, 14.010)8.877(3.134, 8.162, 13.276)8.183
St6CrispSt7CrispSt8CrispSt9CrispSt10Crisp
CR1(1.038, 5.106, 8.970)5.055(0.876, 4.642, 8.293)4.613(0.617, 0.720, 0.821)0.719(0.617, 4.701, 8.392)4.603(0.613, 4.528, 8.163)4.458
CR2(0.939, 4.179, 7.563)4.215(0.774, 3.780, 6.972)3.826(0.472, 3.635, 6.780)3.631(0.525, 3.808, 7.034)3.794(0.538, 3.683, 6.857)3.690
CR3(1.728, 5.733, 9.762)5.739(1.443, 5.167, 8.977)5.189(1.108, 4.982, 8.739)4.953(1.258, 5.240, 9.087)5.206(0.972, 5.028, 8.825)4.963
CR4(1.436, 5.379, 9.265)5.365(1.195, 4.858, 8.532)4.860(0.908, 4.698, 8.320)4.656(1.026, 4.934, 8.644)4.884(0.823, 4.732, 8.391)4.669
CR5(0.830, 3.751, 6.896)3.807(0.690, 3.388, 6.351)3.454(0.481, 3.267, 6.186)3.300(0.545, 3.432, 6.427)3.459(0.462, 3.298, 6.245)3.326
CR6(1.183, 4.583, 8.079)4.607(0.968, 4.115, 7.414)4.153(0.461, 3.841, 7.091)3.809(0.513, 4.020, 7.353)3.976(0.640, 3.993, 7.277)3.976
CR7(1.334, 4.785, 8.367)4.818(1.097, 4.298, 7.680)4.343(0.678, 4.064, 7.397)4.051(0.765, 4.263, 7.679)4.242(0.733, 4.174, 7.542)4.156
CR8(0.997, 5.025, 8.865)4.978(0.868, 4.574, 8.202)4.555(0.716, 4.480, 8.056)4.433(0.804, 4.703, 8.367)4.644(0.594, 4.464, 8.076)4.400
CR9(2.051, 6.355, 10.710)6.368(1.706, 5.736, 9.859)5.760(1.190, 5.502, 9.570)5.441(1.337, 5.769, 9.933)5.702(1.171, 5.585, 9.694)5.509
CR10(2.343, 7.176, 11.896)7.148(1.977, 6.499, 10.973)6.487(1.551, 6.328, 10.743)6.238(1.755, 6.653, 11.169)6.557(1.346, 6.334, 10.796)6.202
CR11(1.648, 5.835, 9.949)5.817(1.363, 5.276, 9.168)5.271(1.058, 5.144, 8.985)5.083(1.196, 5.407, 9.340)5.337(0.946, 5.143, 9.021)5.063
CR12(1.128, 4.872, 8.547)4.855(0.940, 4.411, 7.883)4.411(0.817, 4.319, 7.741)4.299(0.926, 4.540, 8.048)4.513(0.659, 4.302, 7.759)4.255
CR13(2.120, 6.410, 10.741)6.420(1.759, 5.777, 9.877)5.798(1.049, 5.466, 9.512)5.373(1.172, 5.724, 9.866)5.622(1.187, 5.615, 9.703)5.530
CR14(2.284, 6.685, 11.145)6.700(1.902, 6.028, 10.252)6.053(1.247, 5.740, 9.908)5.659(1.401, 6.017, 10.284)5.930(1.286, 5.862, 10.074)5.771
CR15(1.918, 6.139, 10.424)6.155(1.606, 5.552, 9.607)5.579(1.228, 5.386, 9.385)5.346(1.385, 5.656, 9.751)5.612(1.104, 5.410, 9.451)5.344
Table 12. Comparison between this study with the other research on analytic network process (ANP)-QFD for PSS.
Research StudyThis StudyFargnoli and Haber [6]Fargnoli and Sakao [12]Haber, Fargnoli, and Sakao [7]
Input of phase 1Customer requirementsReciver state parametersCustomer valuesCustomer requirements
Output of phase 1Quality characteristicsProduct characteristics, service characteristicImportant characteristics of product and serviceImportance of Reciver state parameters
Output of phase 2BOM attributesProduct components, service componentsImportant components of product and serviceImportance of product and service characteristics
Output of phase 3StakeholdersN/AN/AImportance of product and service components