Article

Flood Susceptibility and Sediment Transport Analysis of Stromboli Island after the 3 July 2019 Paroxysmal Explosion

by
Omar S. Areu-Rangel
1,
Rosanna Bonasia
2,*,
Federico Di Traglia
3,
Matteo Del Soldato
3 and
Nicola Casagli
3
1
Instituto de Ingeniería, Universidad Nacional Autónoma de México, Mexico City 04510, Mexico
2
CONACYT-Instituto Politécnico Nacional, ESIA, UZ, Miguel bernard, S/N, Edificio de Posgrado, Mexico City 07738, Mexico
3
Dipartimento di Scienze della Terra, Università degli Studi di Firenze, 50121 Firenze, Italy
*
Author to whom correspondence should be addressed.
Sustainability 2020, 12(8), 3268; https://doi.org/10.3390/su12083268
Submission received: 11 March 2020 / Revised: 6 April 2020 / Accepted: 14 April 2020 / Published: 17 April 2020

Abstract

:
On 3 July 2019, Stromboli volcanic island experienced a paroxysmal explosion that triggered wildfires on vegetated areas in the south, southwestern, and eastern part of the island. This study analyzes the runoff and the transport of sediment originating from rainfall, to verify whether the vegetation loss due to wildfire changed the hydrogeological structure of the affected area and the flooding hazard. A preliminary hydrological study was conducted to analyze the superficial runoff due to rainfall. According to local planning, the hydrogeological study and flood risk assessment were carried out for the return periods corresponding to 50, 100, and 300 years. The flooding levels were calculated using the hydrodynamic module of the IBER software. The IBER sediment transport module was applied in a non-stationary regime for erosion and sedimentation analysis. The results showed that the fire caused an increase of the water discharge rates between 0.06 and 0.16 m2/s, for the 50 year return period, in the Ginostra inhabited area. The great differences of the flood levels between pre- and post-eruptive scenarios, for the highest return periods, were recognized. The analysis of sediment transport showed that rains could exert an erosion and re-sedimentation effect that would transport from 0.1 m to more than 1 m of re-mobilized material in the Ginostra area, which could cause inconvenience in the inhabited area of the island.

1. Introduction

Mass-wasting may cause a long-lasting hazard factor in a volcanic setting due to the persistence of non-equilibrium slope conditions [1,2,3]. Explosive eruptions can severely disrupt the environment around volcanoes by depositing large volumes of erodible fragmental material or inducing wildfires on vegetated volcano slopes, altering the boundary conditions of fluvial systems, increasing the erosion rate and the drainage mass flux (water and sediment) in the affected basin (i.e., [4,5,6]), and altering river water quality [7]. Wildfires can be followed by sediment transport in superficial streams [8]. The pattern, timing, and scale of the re-mobilization of volcaniclastic deposits varies between different eruptions and differs also in the watersheds affected by the same eruption [9], which depend on various factors including the grain size distribution, thickness, stratigraphy, and spatial distribution of the source material in addition to the topography, land cover, and rainfall conditions [10]. Lava flows typically have a minor effect at the basin scale, dislocating rivers’ paths and producing temporary damming, changing the hydrology and sediment transport [11].
Although the effect of wildfires on sediment transport, streamwater chemistry, landscape disturbances, and debris flows has been studied in various geological and geomorphological contexts [12,13,14,15], currently, there is no documentation of basin disturbance due to wildfires in volcanic zones, except for an analysis of the hydrological structure and sediment transport in volcanic river systems after an eruption [16]. While vegetation has positive effects on the water interception, suction, evapotranspiration, and infiltration strongly affect the runoff processes. Areas affected by wildfires are prone to accelerated erosion, due to the increased surface runoff [17,18,19] and the development of soil water repellency [20].
In this paper, the possible effects of wildfires on the increase in hydraulic hazard (related to floods from streamflows in volcanic areas) are investigated. As the test site, the island of Stromboli (Italy) (Figure 1a,b) was chosen, being affected by recent eruption-induced wildfires.
Stromboli island is the 916 m high emerged part of an ≈3000 m high active volcano in the southern Tyrrhenian sea. Stromboli’s persistent activity consists of frequent, small-scale explosions [21]. This activity, showing intensity and frequency fluctuations over time [22,23], is often punctuated by higher intensity explosions (locally called “major” or “paroxysmal” explosions, based on the intensity [21]), lava overflows from the crater, and/or by flank eruptions, with the outpouring of lava flows from ephemeral vents, as occurred in 2002–2003, 2007, and 2014 [24,25,26].
On 3 July 2019, a Strombolian paroxysm occurred at the onset of a two month long eruption, characterized by lava effusion from the crater area, strong Strombolian activity (in terms of frequency and intensity), and a second paroxysmal explosion (28 August 2019) [27]. The 3 July 2019 tephra fallout (lapilli and ash) impacted the southwestern and southern part of the island, including the village of Ginostra, triggering wildfires (Figure 1c,d) [28].
This work is aimed at carrying out the first study of the effect of an eruption-induced wildfire on the hydraulic structure of a volcanic area. The study hypothesis is that the change in land use caused by the fire can increase the surface runoff due to rainfall and generate erosion and re-mobilization of the eroded material. Rainfall scenarios for different return periods are calculated based on a hydrological study aimed at processing the annual maximum rainfall in 24 h, obtained from a weather station located on the island. Precipitation scenarios are numerically simulated with the 2D flood inundation model IBER [29]. The results of flood discharge rates are calculated for the pre- and post-eruptive scenarios and compared. Flood susceptibility maps are also calculated for the selected return periods. Finally, a sediment transport analysis is carried out with the software IBER with the aim of identifying the areas that could be more exposed to erosion, and consequently, the re-mobilization of the granular material resulting from the fire is simulated. Results show that the risk of flooding on the island is low to moderate; however, the absence of vegetation produced by the fire could cause a considerable re-mobilization of sediment and/or soil, which could have effects on the inhabited areas of the island.

2. Material and Methods

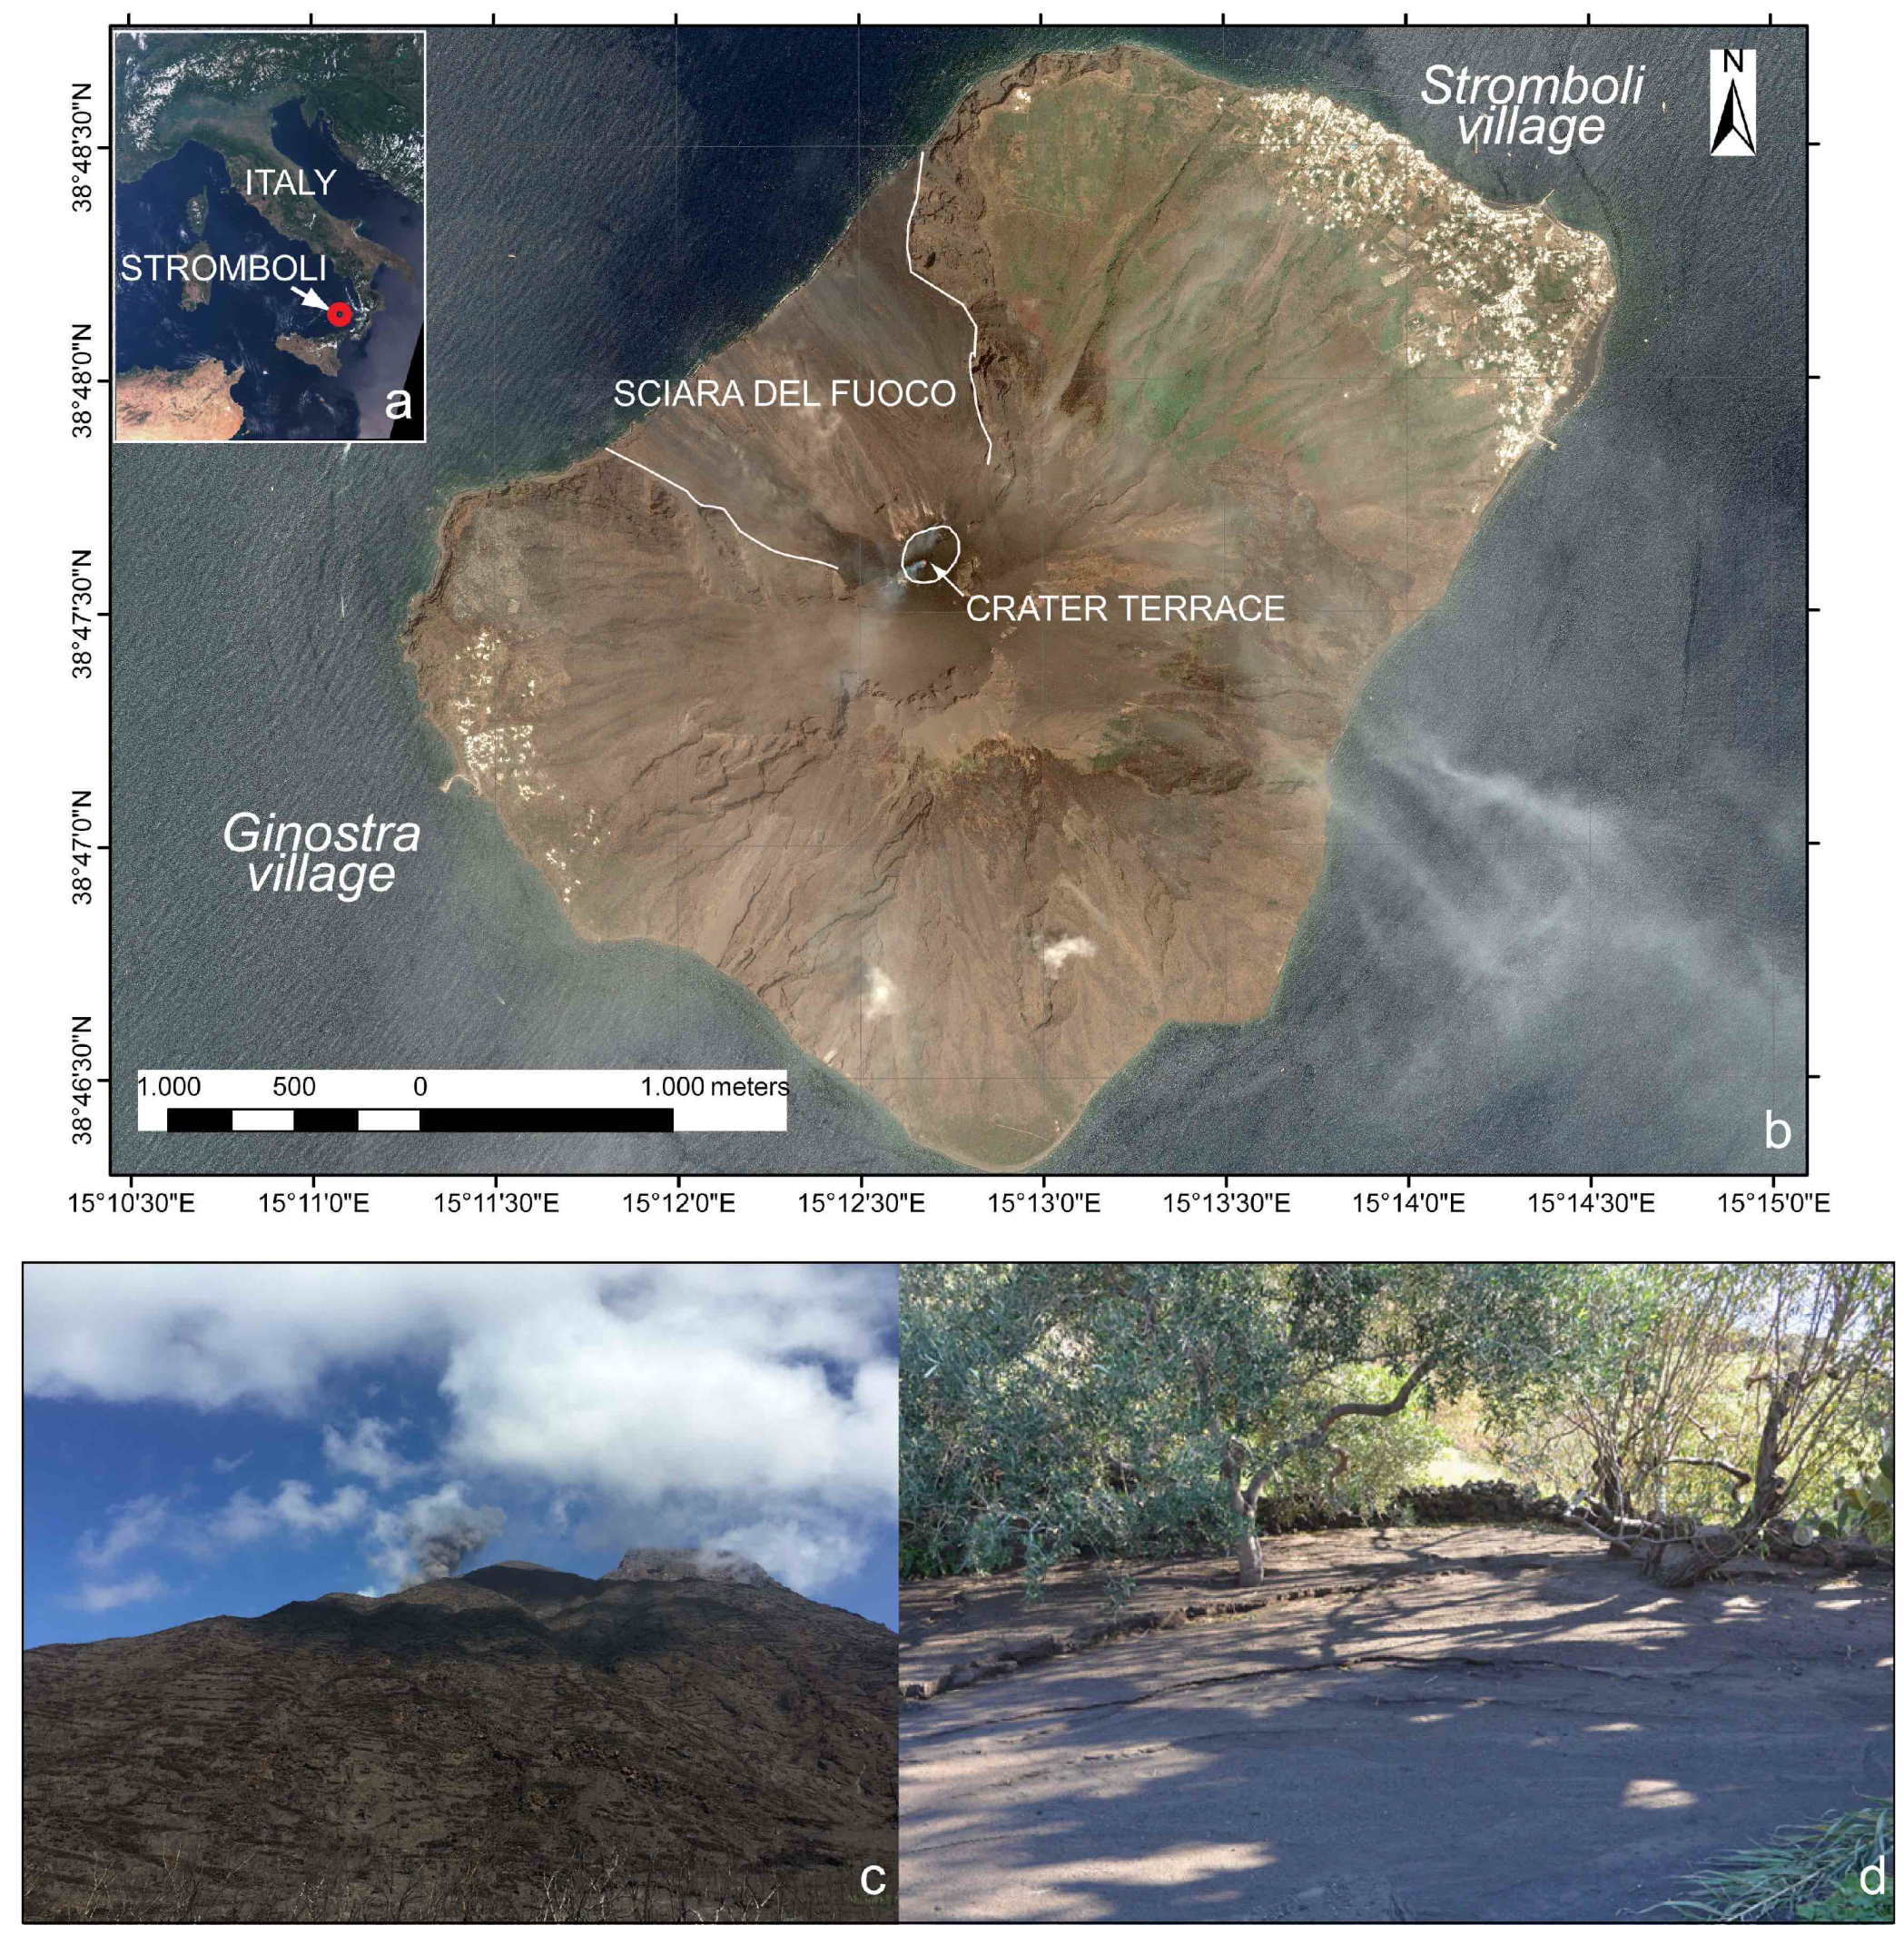
2.1. Slope Instability and Material Properties at Stromboli Island

The lithotechnical characterization of Stromboli volcanic products has been presented by different authors [30,31,32,33], based on in situ and laboratory experimental investigations, although most of the work has focused on the Sciara del Fuoco (SdF) area. Apuani et al. [30] proposed a lithotechnical map based on field surveys and rock mechanics characterization (52 sites), conducted following the International Society for Rock Mechanics procedure [34], in order to define the Geological Strength Index (GSI) [35]. The lithotechnical classification was defined on the basis of the relative percentage of the breccia fraction vs. lava, as well as on the distinction between rocks and soils (loose volcaniclastic material). The four main lithotechnical units were defined as [30,36]:
  • Lava unit (L): alternation of lava layers (more than 65%) and autoclastic breccia layers;
  • Lava-Breccia unit (LB): alternation of lava layers (ranging from 35–65%) and breccia layers;
  • Breccia unit (B): alternation of lava layers (less than 35%) and autoclastic breccia layers;
  • Pyroclastic deposits (P) (poorly welded): prevailing pyroclastic breccias alternating with tuff and lapillistones.
This classification has been frequently used for the analysis of the SdF stability [36,37], even in conditions of active deformation [38]. Furthermore, based on Apuani et al. [30], landslide susceptibility and the intrusion-induced landslide susceptibility, combined with volcanic susceptibility (probability of opening of volcanic mouths [39]), were assessed [40]. With the exception of the geomorphological evidence of the great sectoral collapses and of the slope deformations active in the SdF area, in the Landslides Inventory Map [40], dry gravel/debris slides are mainly located within the SdF and scattered throughout the island. Sea-cliffs are affected by rock-falls, related to strong coastal regression, mainly in the northwestern side of the island. Considering this, the areas affected by high to very high landslide susceptibility (dry gravel/debris flows and rock-falls) include the SdF, the upper part of the volcanic edifice, and the coastal cliffs [40]. Detailed analyses of the loose deposits showed that the volcaniclastic soils were characterized by a high porosity related to the continuous solid skeleton texture, controlling the mechanical behavior of the material in static tests [32]. Grain-size analysis revealed large heterogeneity and, specifically, the presence of fine material [33]. The volcaniclastic soils showed relatively high strength and high friction angles, measured at low confining pressure, that could be explained by the angular shape and high surface roughness of the grains [32].
On Stromboli, a detailed map of the volcaniclastic cover deposit thickness [41,42], in terms of depth to bedrock and distribution of loose deposits, is missing. During the inspection of 27 July, it was possible to observe the complete destruction of the spontaneous vegetation (small shrubs), which also affected the roots, and the diffusion of volcaniclastic material in the burnt area.

2.2. Hydrological Study for the Estimation of Flood Discharges

A preliminary hydrological study was conducted with the aim of calculating and analyzing the superficial flows that can occur on the island as a consequence of rainfall. The methodology adopted for the runoff analysis, as well as the consequent risk of flooding, followed the criteria established in the “Basin excerpt plan for the hydrogeological structure of the Sicily Region” [43]. The EU Flood Directive 2007/60/CE in Italy was implemented by Legislative Decree 49/2010 and for the Sicily Region by the cited Flood Risk Management Plan. In accordance with what was indicated in the report, the hydrogeological study and flood risk assessment were carried out, in this work, for the return periods corresponding to 50, 100, and 300 years. The return periods were selected on the basis of the D.P.C.M. (Prime Ministerial Decree, for its initials in Italian) of 29 September 1998 that established risk areas upon three different flood probabilities: high probability (with return periods of 20–50 years), moderate probability (with return periods of 100–200 years), low probability (with return periods of 300–500 years).
Rainfall associated with each return period was calculated by processing the annual maximum rainfall in 24 h, obtained from the SICAM (“Integrated Climatological System of the Italian Air Force”, for its initials in Italian) weather station located on the island. The analysis of annual maximum rainfall in 24 h was conducted using the formulation of Chen [44]:
I t T r = a P 1 10 log ( 10 2 - F × T r F - 1 ) ( t + b ) c
where I t T r corresponds to the rainfall intensity associated with a duration (t) and return period Tr in mm/h, P 1 10 is the rainfall with a duration of 1 h and a return period of 10 years, and a, b, c, and F are parameters that depend on the annual maximum rainfall in 24 h associated with the return periods ( P T r ). The generalized equation proposed by Chen allows the processing of the most common type of rainfall record (maximum annual rains in 24 h), the ones that were available for Stromboli island. Moreover, the Chen formulation, proven to be suitable for return periods greater than 10 years, is supported by the rainfall-duration and rainfall-frequency coefficients, which allow the best fit to local rain parameters. Annual maximum rainfall is calculated using a least squares logarithmic fit:
P T r = A + B log T r
where A and B are the regression parameters that depend on the annual maximum rainfall in 24 h obtained from the weather station data. Rainfall intensities were calculated for the selected return periods and considering a concentration time of 15 min. The concentration time was estimated after performing several previous rainfall simulations, which showed that, after 15 min, the simulated outflow could be approximated to the maximum rain volume precipitated per unit of time. In order to consider a decrease in surface runoff due to the infiltration, a reduction to rainfall intensity was applied. The effective rainfall intensity (Ie) was then calculated as the product of rainfall intensity to the runoff coefficient. The runoff coefficient depends on the soil type and the slope of a basin. In this study, a runoff coefficient of 0.5 was selected taking into account the high slope (which reaches up to 87%) and the combination of the different types of soil: burnt soil, urban area, rock, volcanic ash, and vegetation. Table 1 shows calculated rainfall (I) and effective rainfall intensities (Ie) for the three return periods.

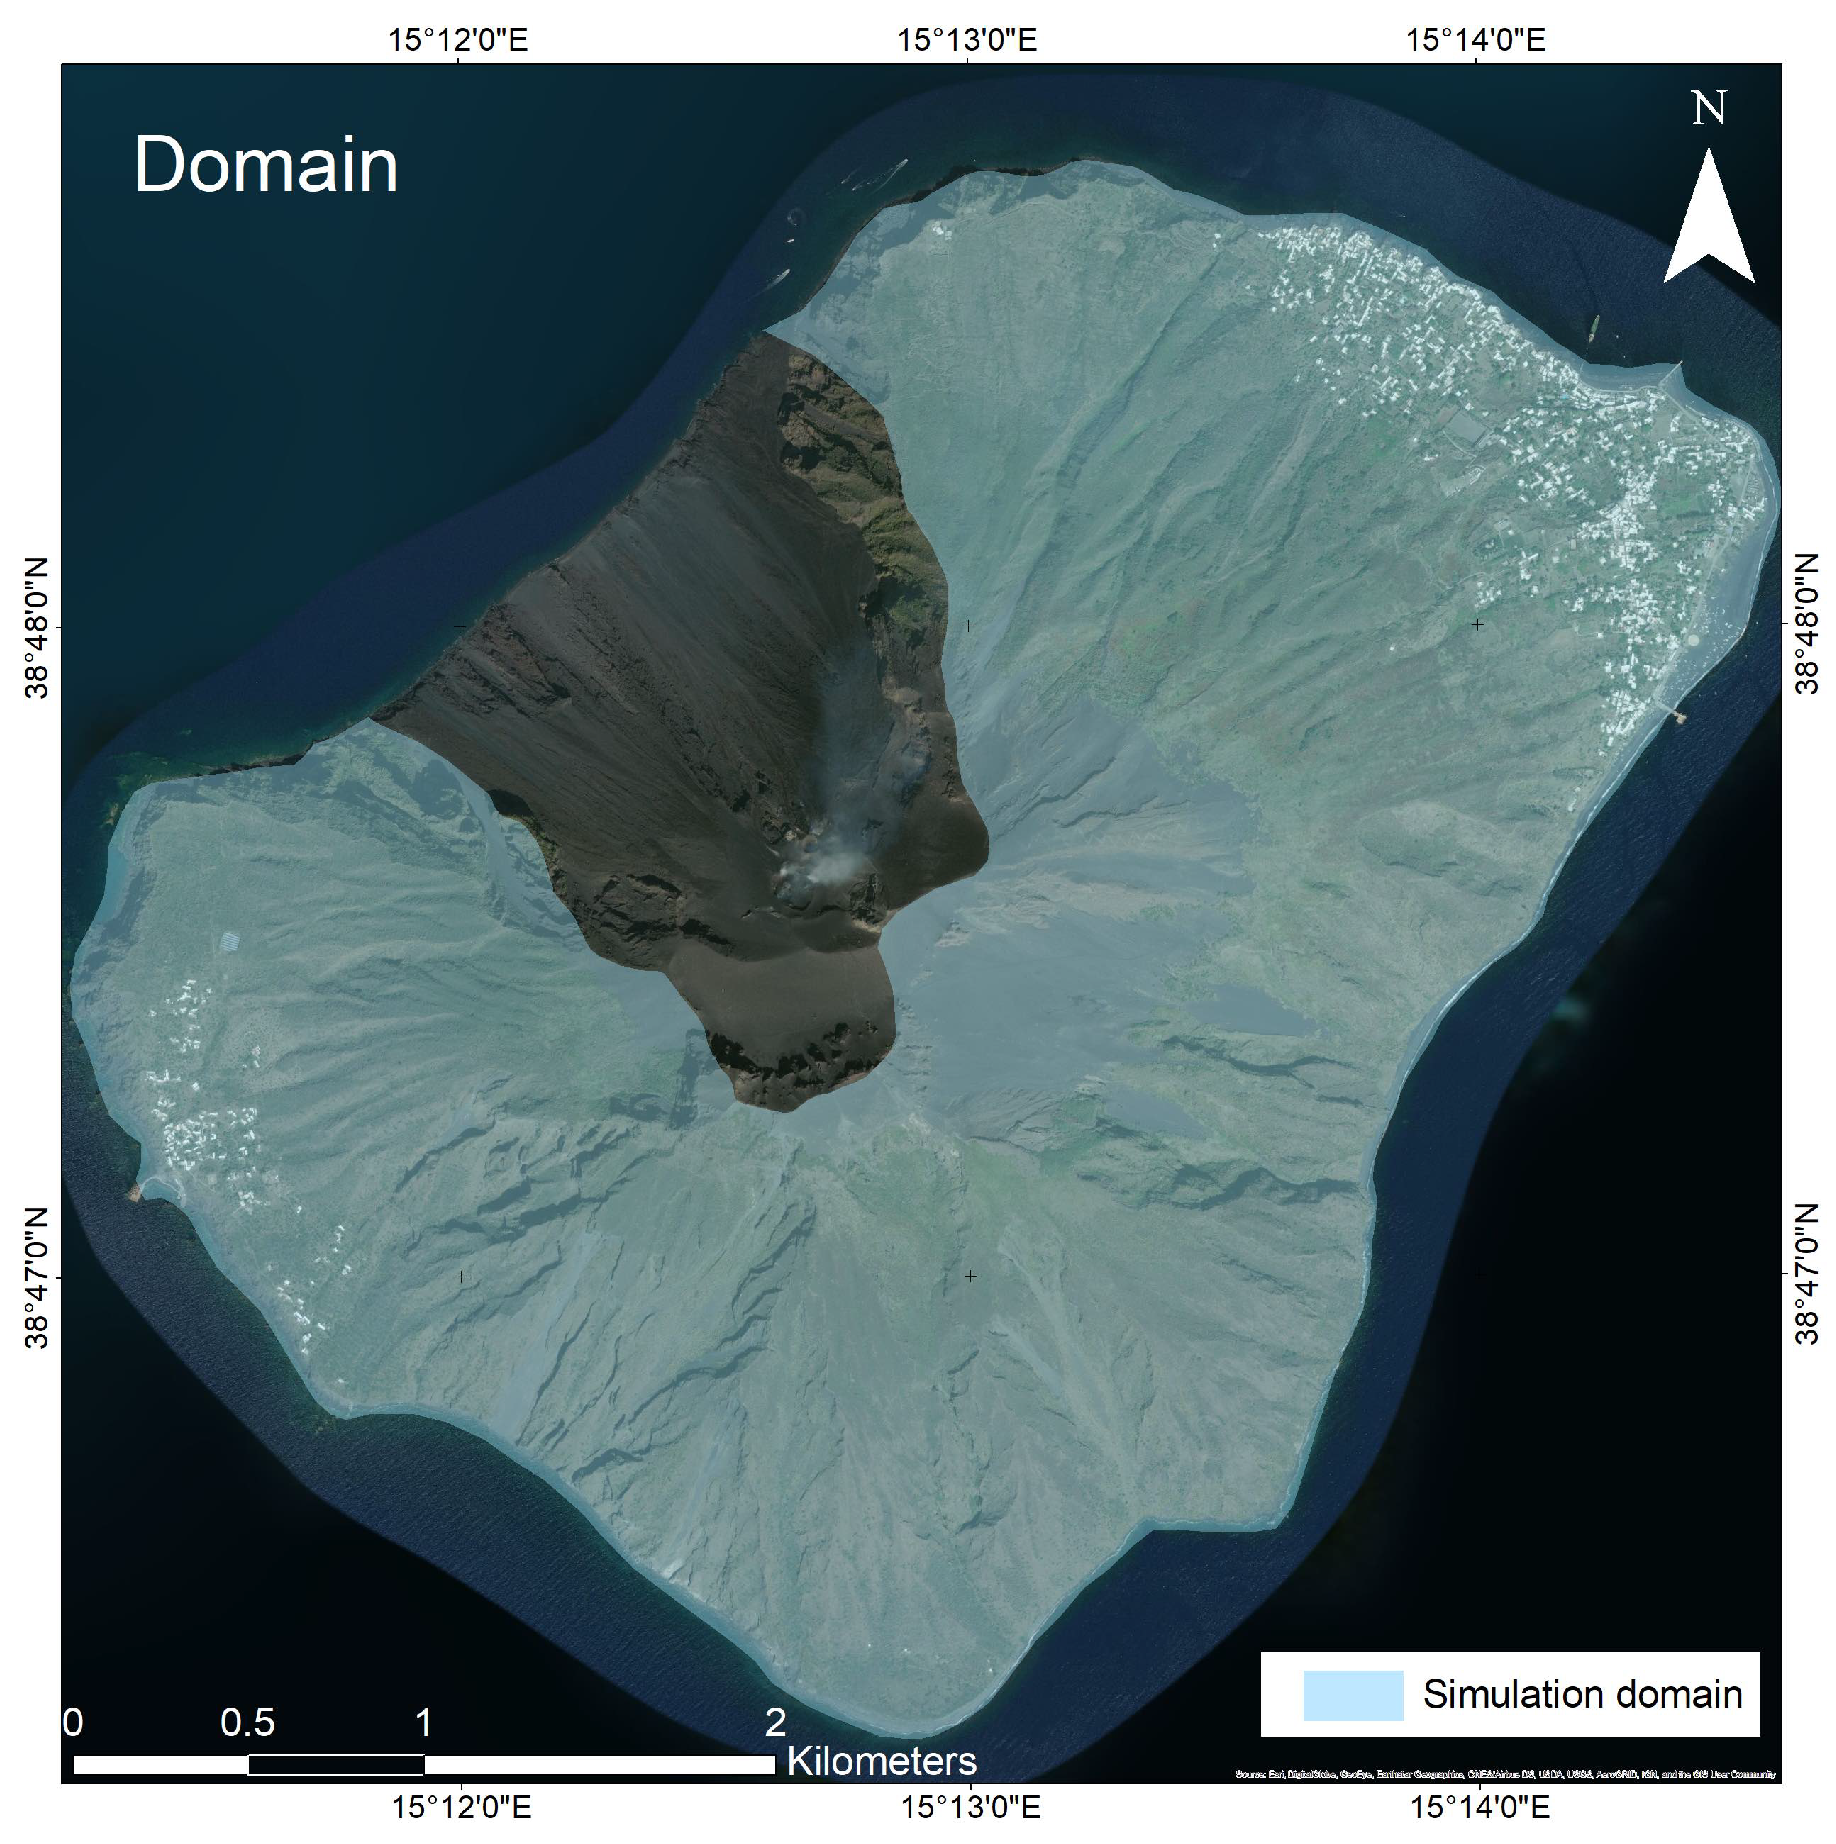
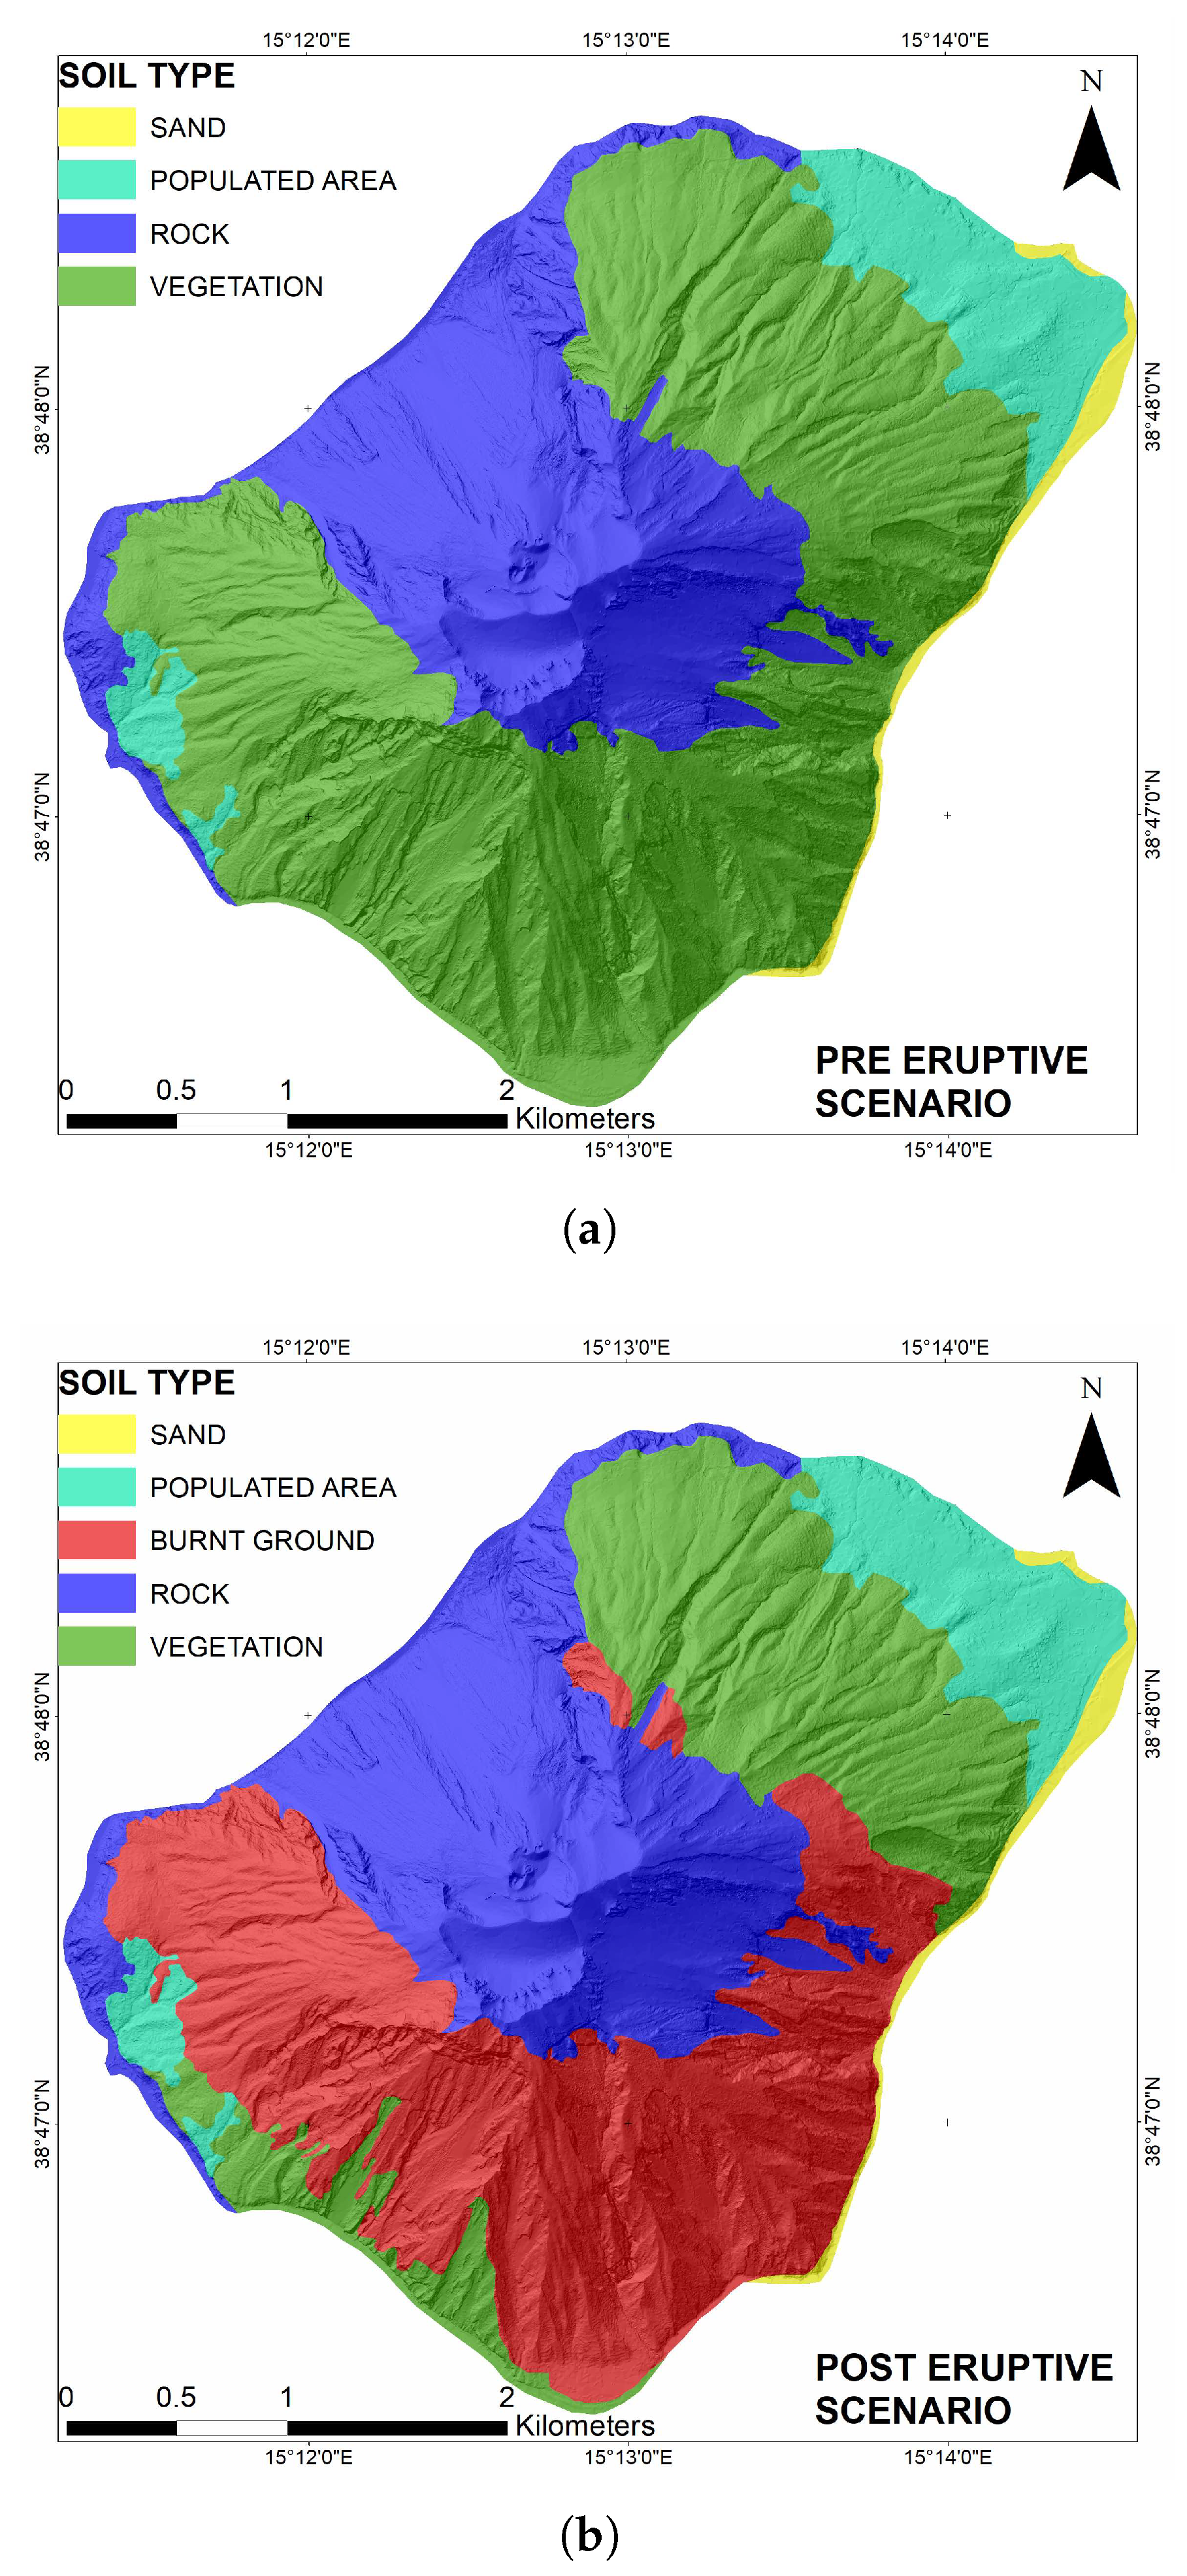
2.3. Flood Model with the Software IBER

Flooding levels were calculated using the IBER model, which numerically simulates the non-steady, turbulent-free surface flow [29,45]. Three calculation modules (hydrodynamic, turbulence, and sediment transport module) are implemented in the software that works on structured and unstructured finite volume meshes. In this study, the hydrodynamic module was used for the flooding level calculations. This module solves the depth-averaged shallow water equations, also known as two-dimensional Saint Venant equations. These equations assume a hydrostatic pressure distribution and a relative uniform in depth velocity distribution. The hypotheses of the hydrostatic pressure and uniform distribution of velocity in depth are reasonably fulfilled in rivers and estuaries. The hydrodynamic module solves the conservation of mass and momentum equations in the two horizontal directions, where the bottom friction has a double effect on the flow equations: it produces a friction force that is opposed to the average speed, and on the other hand, it produces turbulence. In the hydrodynamic calculations, the software allows the use of two types of boundary conditions: open or closed, where closed boundaries are waterproof, while for open boundaries, different conditions can be imposed depending on the flow regime (subcritical or supercritical). The methodology used for the simulations has been widely described in previous works by Bonasia et al. [46] and Areu-Rangel et al. [47], among others. The computational domain considered for the study area is shown in Figure 2.
It covers an area of 10.73 km2, which does not consider the northwestern side slope of the volcano (SdF). It has been observed that the SdF, for its topography and soil characteristics, has no effect on water surface flows and sediment transport on the inhabited areas of the island. The study area was discretized with an unstructured triangular mesh of 243,139 elements with a size of 8 m. The optimal size of the triangular elements was chosen following the implementation of various iterative tests with different triangles sizes. The tests were aimed at meeting the dimension that produced the best results with the shortest calculations time. The 8 m size allowed a calculation time of 2.3 h for each simulation. It is worth considering that, in order to verify whether the fire that hit the area above Ginostra may have caused an increase in the flood levels, simulations of the surface runoff due to rainfall were made considering the pre- and post-eruptive scenarios, for the different return periods. To this end, in order to characterize the surface roughness, different soil types were considered within the simulation domain, each one corresponding to a different value of the Manning coefficient: 0.025 for burnt soil, 0.15 for urban area, 0.015 for rock, 0.023 for volcanic ashes, and 0.12 for vegetation. The distribution of each of the soil types on the island, before and after the wildfire, is shown in Figure 3.

2.4. Sediment Transport Model with the Software IBER

For the calculation of the sediment transport due to water runoff, the IBER sediment transport module was used. The module solves the non-cohesive sediment transport equations with uniform granulometries, in a non-stationary regime. According to theoretical and experimental studies [48], the critical parameter that controls the material movement threshold is the bottom shear stress, which strongly depends on the sediment grain roughness, as well as on the bed morphology (i.e., the bottom slope, the friction angle, and the particle diameter). However, only the grain shear stress contributes to the sediment transport due to the bottom loading. For this reason, before calculating the solid flow rate, IBER estimates the bottom shear stress due to the grain (τbs) using the Einstein stress partition:
τ b s * = τ b * n s n 1.5
n s K s 1 / 6 25
K s 2 3 D s
where n is the total Manning coefficient, ns the equivalent Manning coefficient due to the grain, D s the sediment diameter, K s the grain roughness calculated based on the sediment diameter, and τ b * and τ b s * the dimensionless total and grain shear stresses, respectively. Shear stresses are calculated as follows:
τ b * = τ b ( ρ s - ρ ) g D s
τ b s * = τ b s ( ρ s - ρ ) g D s
where ρs is the sediment density and ρ is the water density.
In IBER, the solid flow rate can be calculated choosing between two empirical formulations widely used in the field of sediment transport theory: the Meyer–Peter and Müller [49] and the Van-Rijn [50] methods. According to Pinto et al. [51], the key physical parameters that influence the sediment transport formulas and consequently the error in calculating the sediment movement are the current speed and the particle average diameter. According to the mentioned study, the Van-Rijn formula is the most sensitive to the physical properties of the material rather than the limitations of the formula itself. Considering that the sediment physical parameters used in the present work, and discussed below in this section, were derived from a previous study based on Stromboli sediment field and laboratory analysis, the solid flow rate (qsb) is calculated here using the Meyer–Peter and Müller equation:
q s b * = 3.97 τ b s * - τ c * 3 / 2
In this study, the suspended sediment transport was not considered in the calculations. Suspended sediment transport is a phenomenon that mainly characterizes large, ancient rivers with low slopes, where it has greater influence if compared with the bottom sediment transport. In the case study of the present work, intermittent currents generated by short duration rains in high slopes were the elements that characterized the hydrodynamics of the study area. Here, the bottom transport of fine material was more relevant than the transport in suspension. The formulation used in this work derives from the correction, proposed by Wong [52] and Wong and Parker [53], to the original Meyer–Peter and Müller [49] equation. In the case of a flat bottom, the critical bottom shear stress τ c * was considered equal to 0.0495. Otherwise, as for our study area, when the bottom slope was high, a correction factor was considered that took into account the effect of gravity [54].
The sediment transport simulations were carried out considering the soil burnt during the fire as possible re-mobilized material. Parameters used for the simulations are shown in Table 2.
Parameters used for the calculation of bed shear stress, related to grain properties, were selected on the basis of Verrucci et al. [55]. As mentioned before, most of the previous works aimed at the classification of geotechnical properties of sediment on Stromboli focused on the Sciara del Fuoco, and a general map of the thicknesses and the total sediment distribution is lacking. However, some studies highlighted the great heterogeneity of the material deposited on the island and indicated the widespread presence of fine sand [33]. For this reason, for our sediment transport calculations, we considered the characteristics of the sandy horizons (SH) characterized by Verrucci et al. [55]. According to the authors, this horizon is one of the two typical components of the volcaniclastic sequences that characterize the deposits of the island. The peak friction angle chosen for our calculation was equal to 38.4° (0.67 rad) and derived from triaxial tests on sandy volcaniclastic layers (SH). For the diameter value, the average diameter of sand grains was considered (D50 = 1.5 mm). According to Verrucci et al. [55], there was a great variability in the percentage of porosity (13.4% to 32.9%). For our simulations, we considered the maximum value that corresponded to a porosity of 0.33.

3. Results

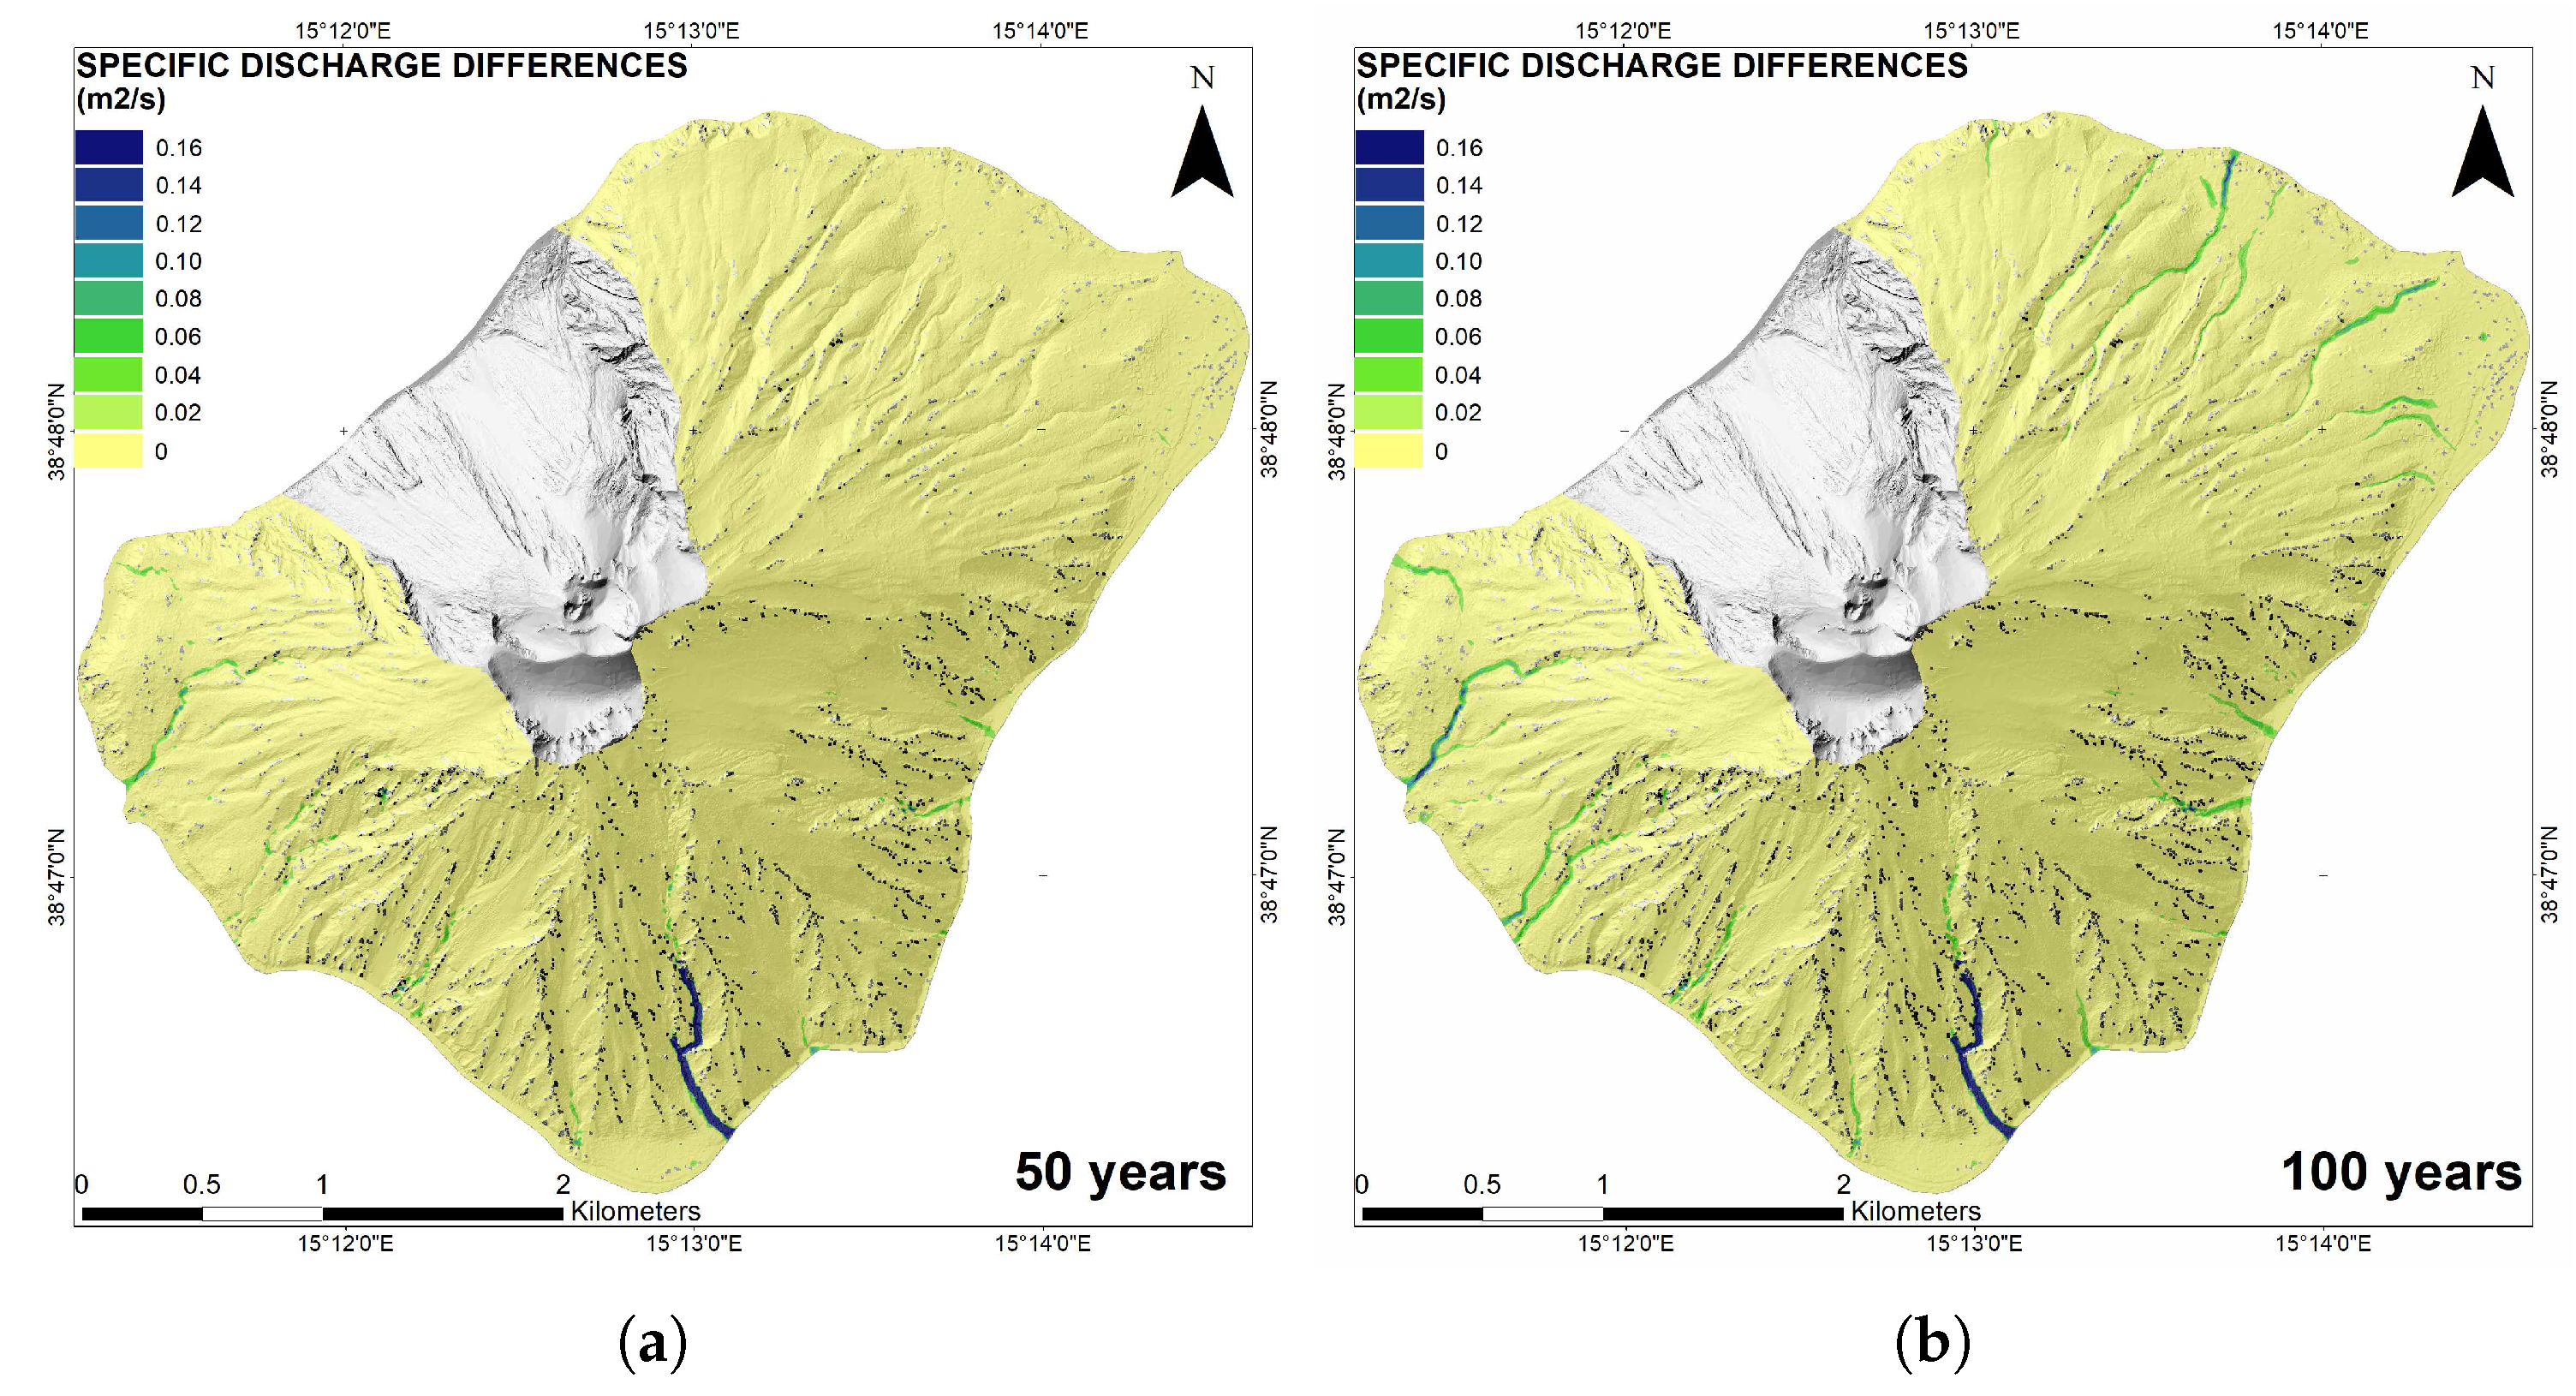
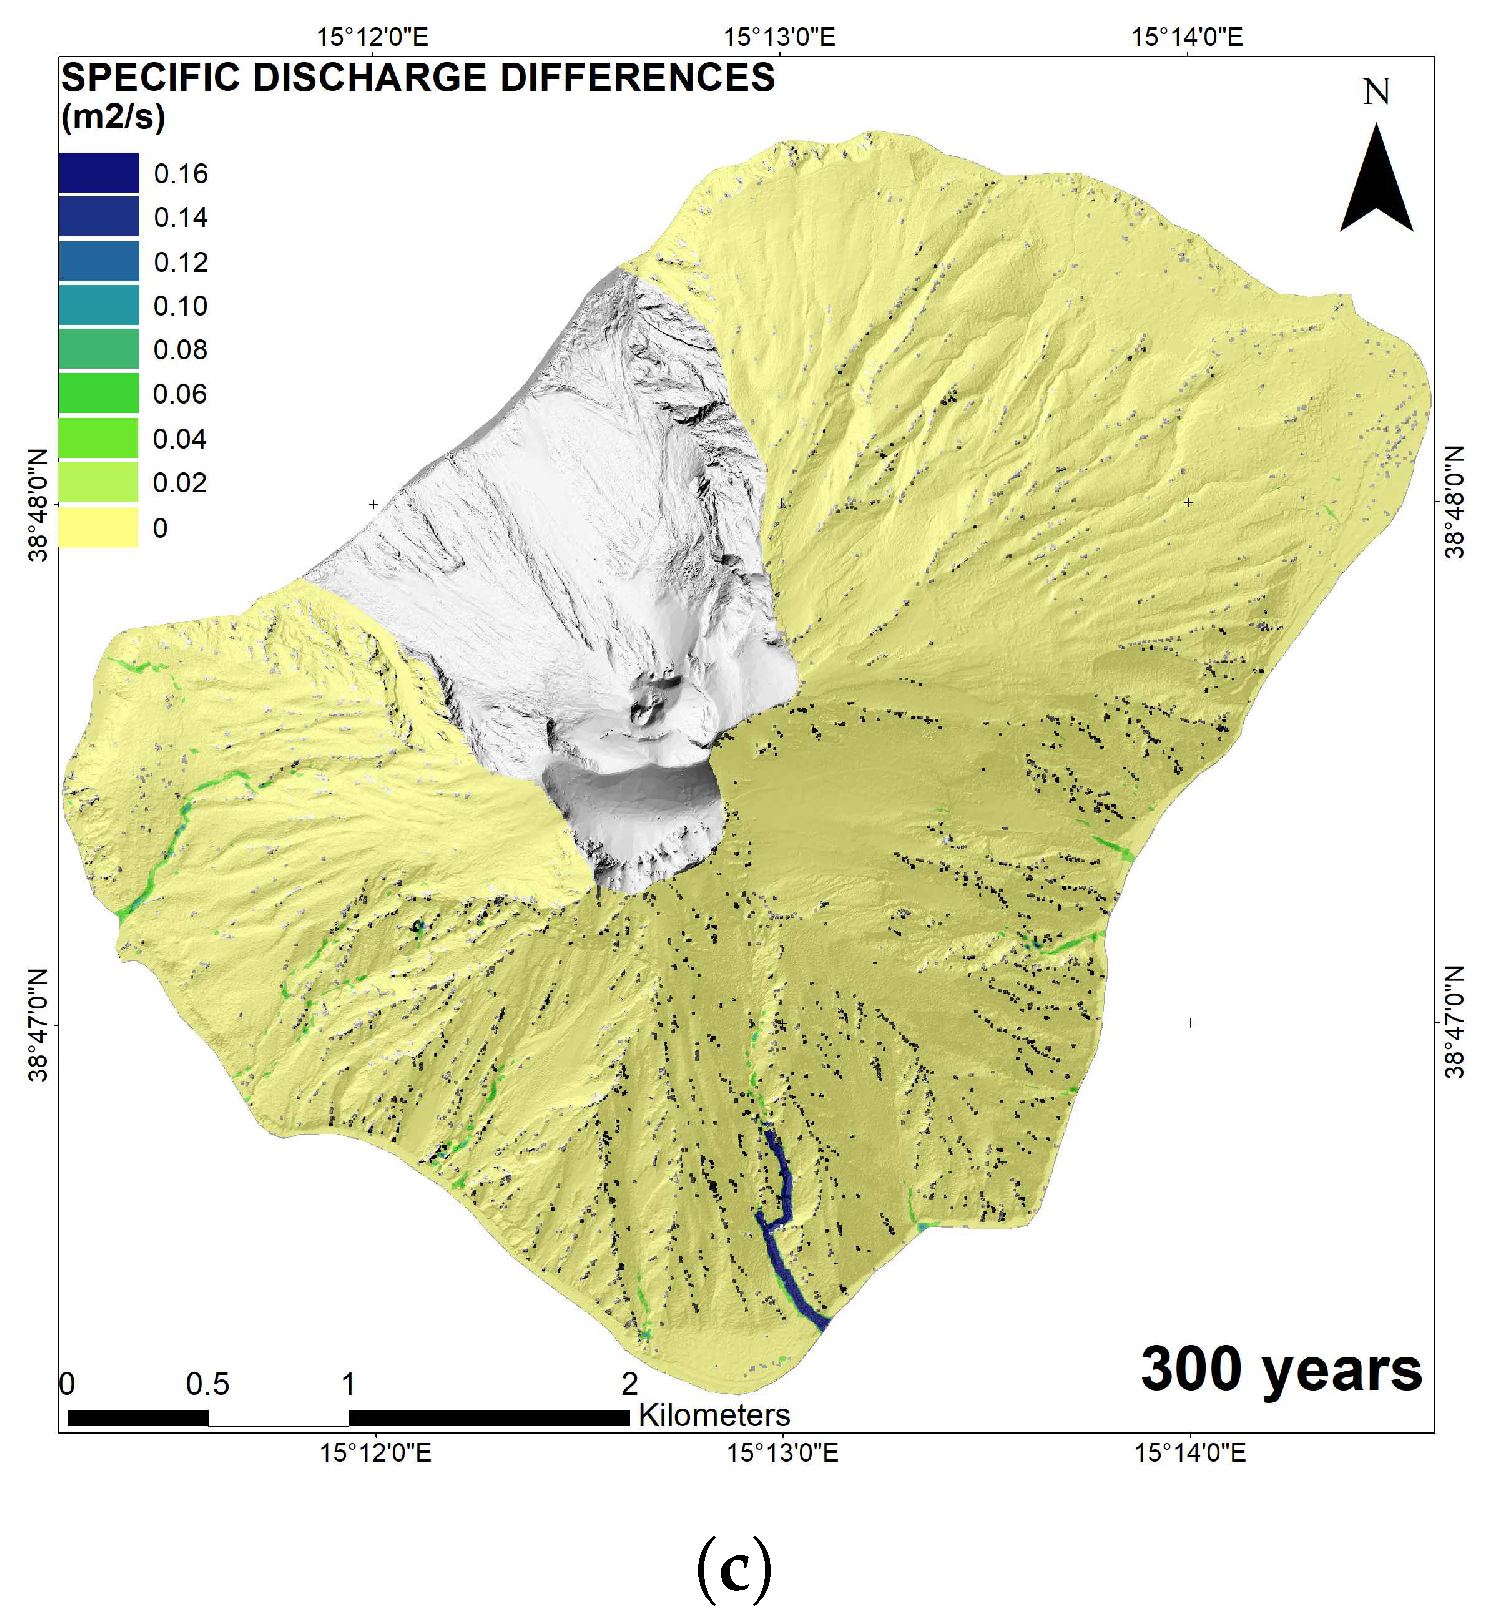
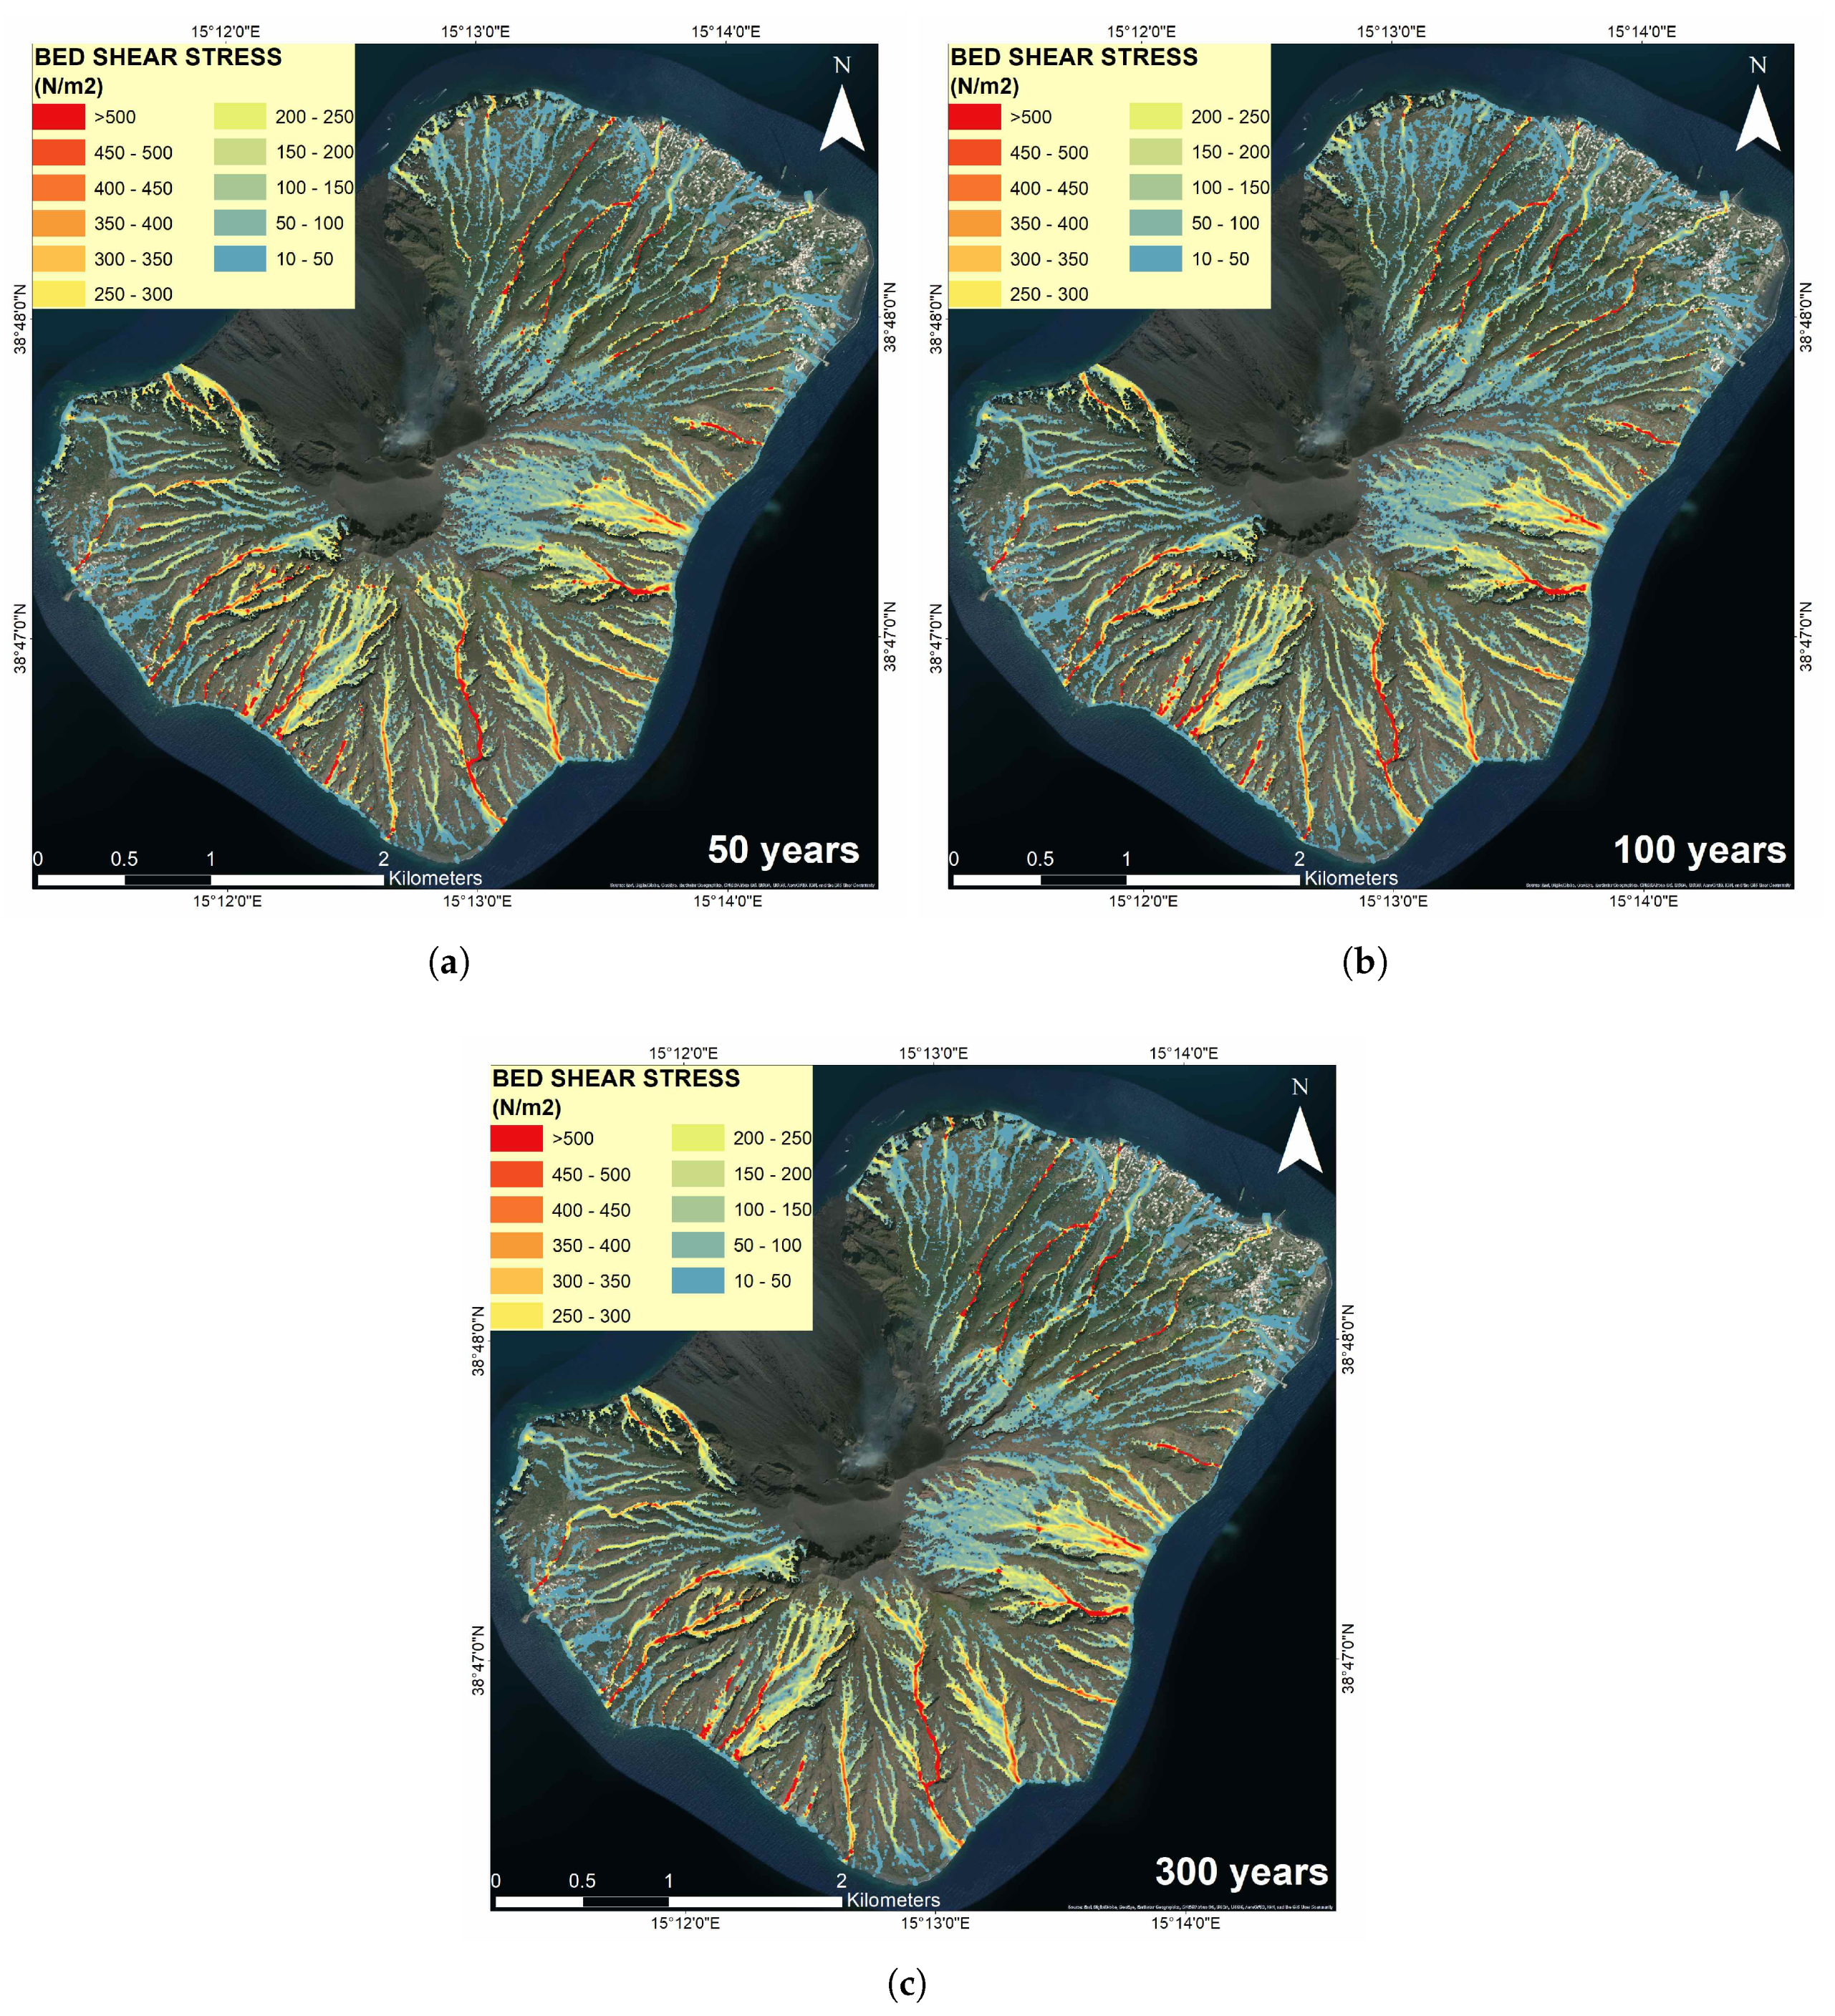
3.1. Flood Discharge and Hazard Assessment

To better understand if the fire produced by the eruption effectively changed the hydrological structure of the area under study, differences between flood discharges were calculated by comparing runoff scenarios before and after the eruptive event, for the three return periods (Figure 4).
It can be observed that, for the lower return period (50 years), an increase in the flood discharges may occur especially in Ginostra, with maximum values between 0.06 and 0.16 m2/s. A lower impact was observed in the Stromboli marina area, where the increase in the flood rate reached a maximum of 0.10–0.12 m2/s. The difference in flood levels increased in inhabited areas for the 100 year return period, while it decreased again in the 300 year return period.
Flood susceptibility maps were calculated in order to quantify the hazard associated with the increase of flood discharge rates. IBER performs the flood hazard assessment considering the impact that the flood can have on people, buildings, cultivated fields, etc., when a certain hydraulic parameter (i.e., flow rate, velocity, flow depth) exceeds pre-established critical conditions. The methodology used for the definition of the hydraulic hazard levels in the “Basin excerpt plan for the hydrogeological structure of the Sicily Region” [43] considered flood depths as the hydraulic parameter for the construction of hazard maps. The report specified that up to 0.3 m, the damage was still contained, while for higher flood levels, a significant increase in both damage and perceived discomfort was manifested. For the hydrological context of Stromboli island originated after the wildfire, the flood level was not the proper parameter to be used for the assessment of the hydraulic hazard. The fire left a very extended burnt soil on which the runoff coefficient increased compared to the situation before the fire. The increasing of the runoff coefficient, as the effect of the reduction of Manning’s coefficient, caused an increase in the water flow velocity, which in turn caused a rapid decrease in the flood depths passing over the mesh cells in the numerical simulations. For this reason, instead of the flood depths, in this work, the flow rate was considered as a critical parameter for the hazard maps’ calculation. Three flow rate thresholds were considered, each one corresponding to a different degree of hazard: low (Q < 0.25 m2/s), moderate (0.25 < Q < 1 m2/s), high (Q > 1 m2/s). The choice of the critical flood rate thresholds was made after the analysis of the discharge rate distribution and on the basis of the specific characteristics of the territory under study. Susceptibility maps for the three return periods are shown in Figure 5.

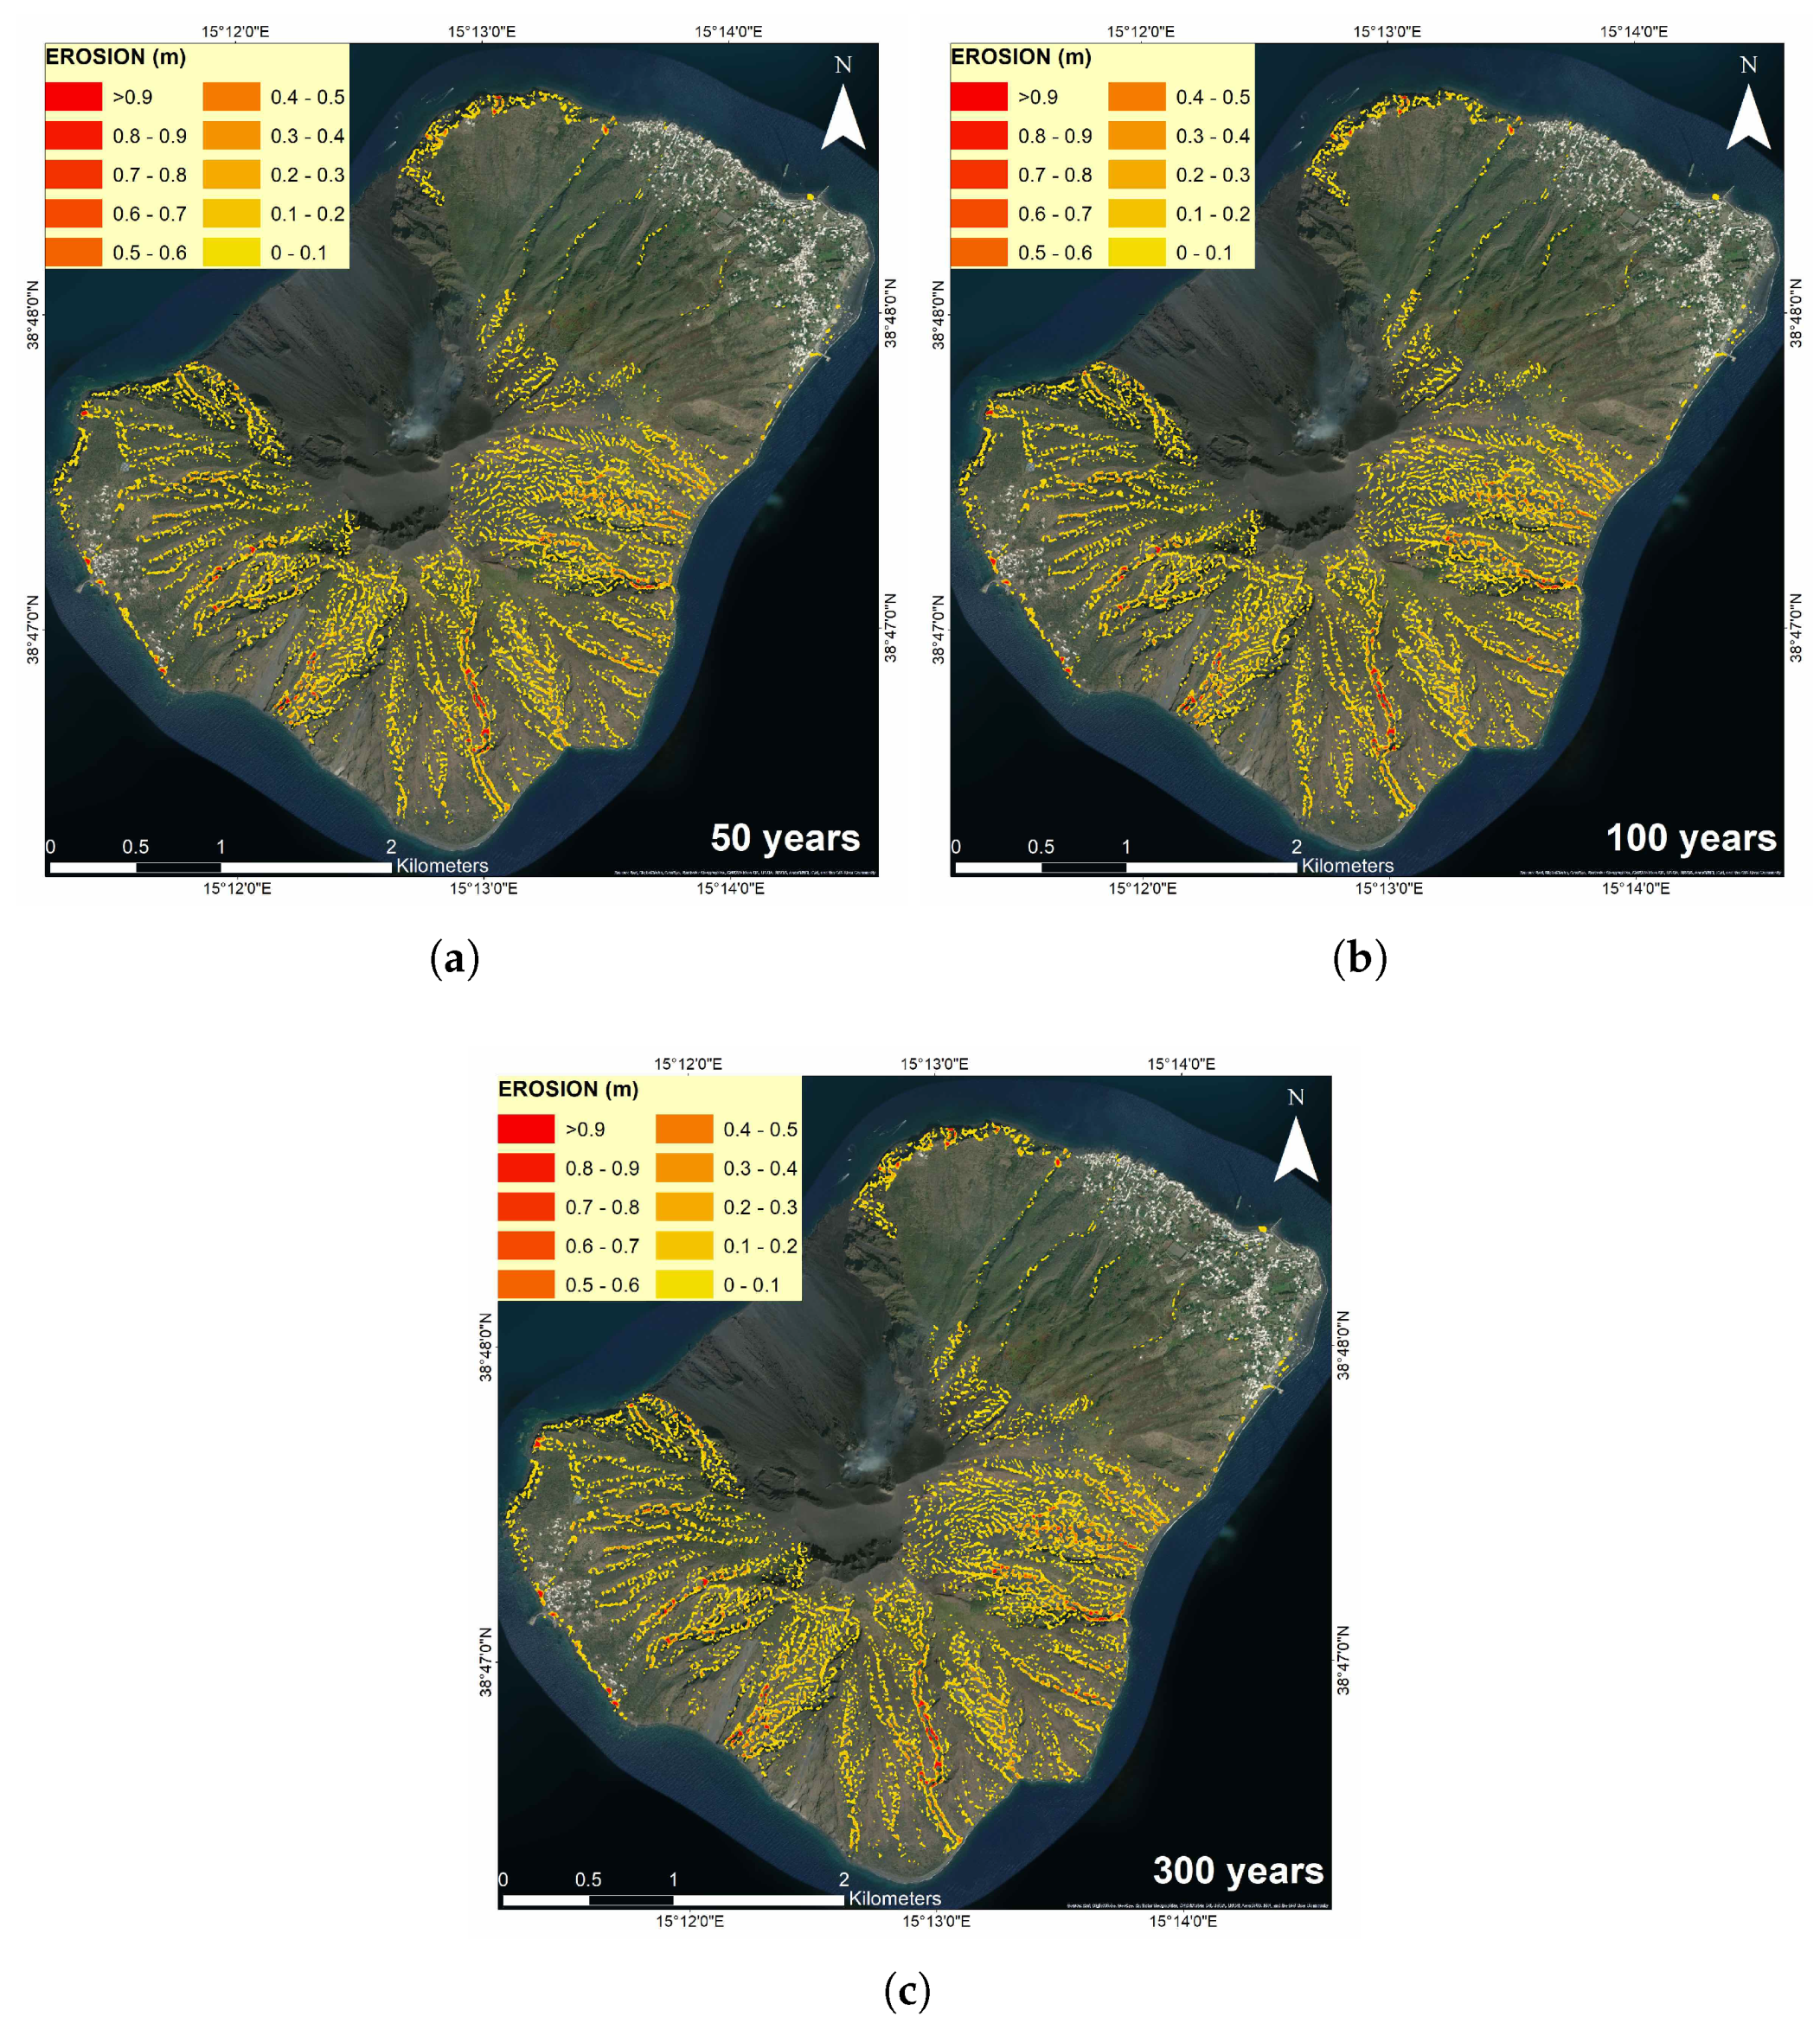
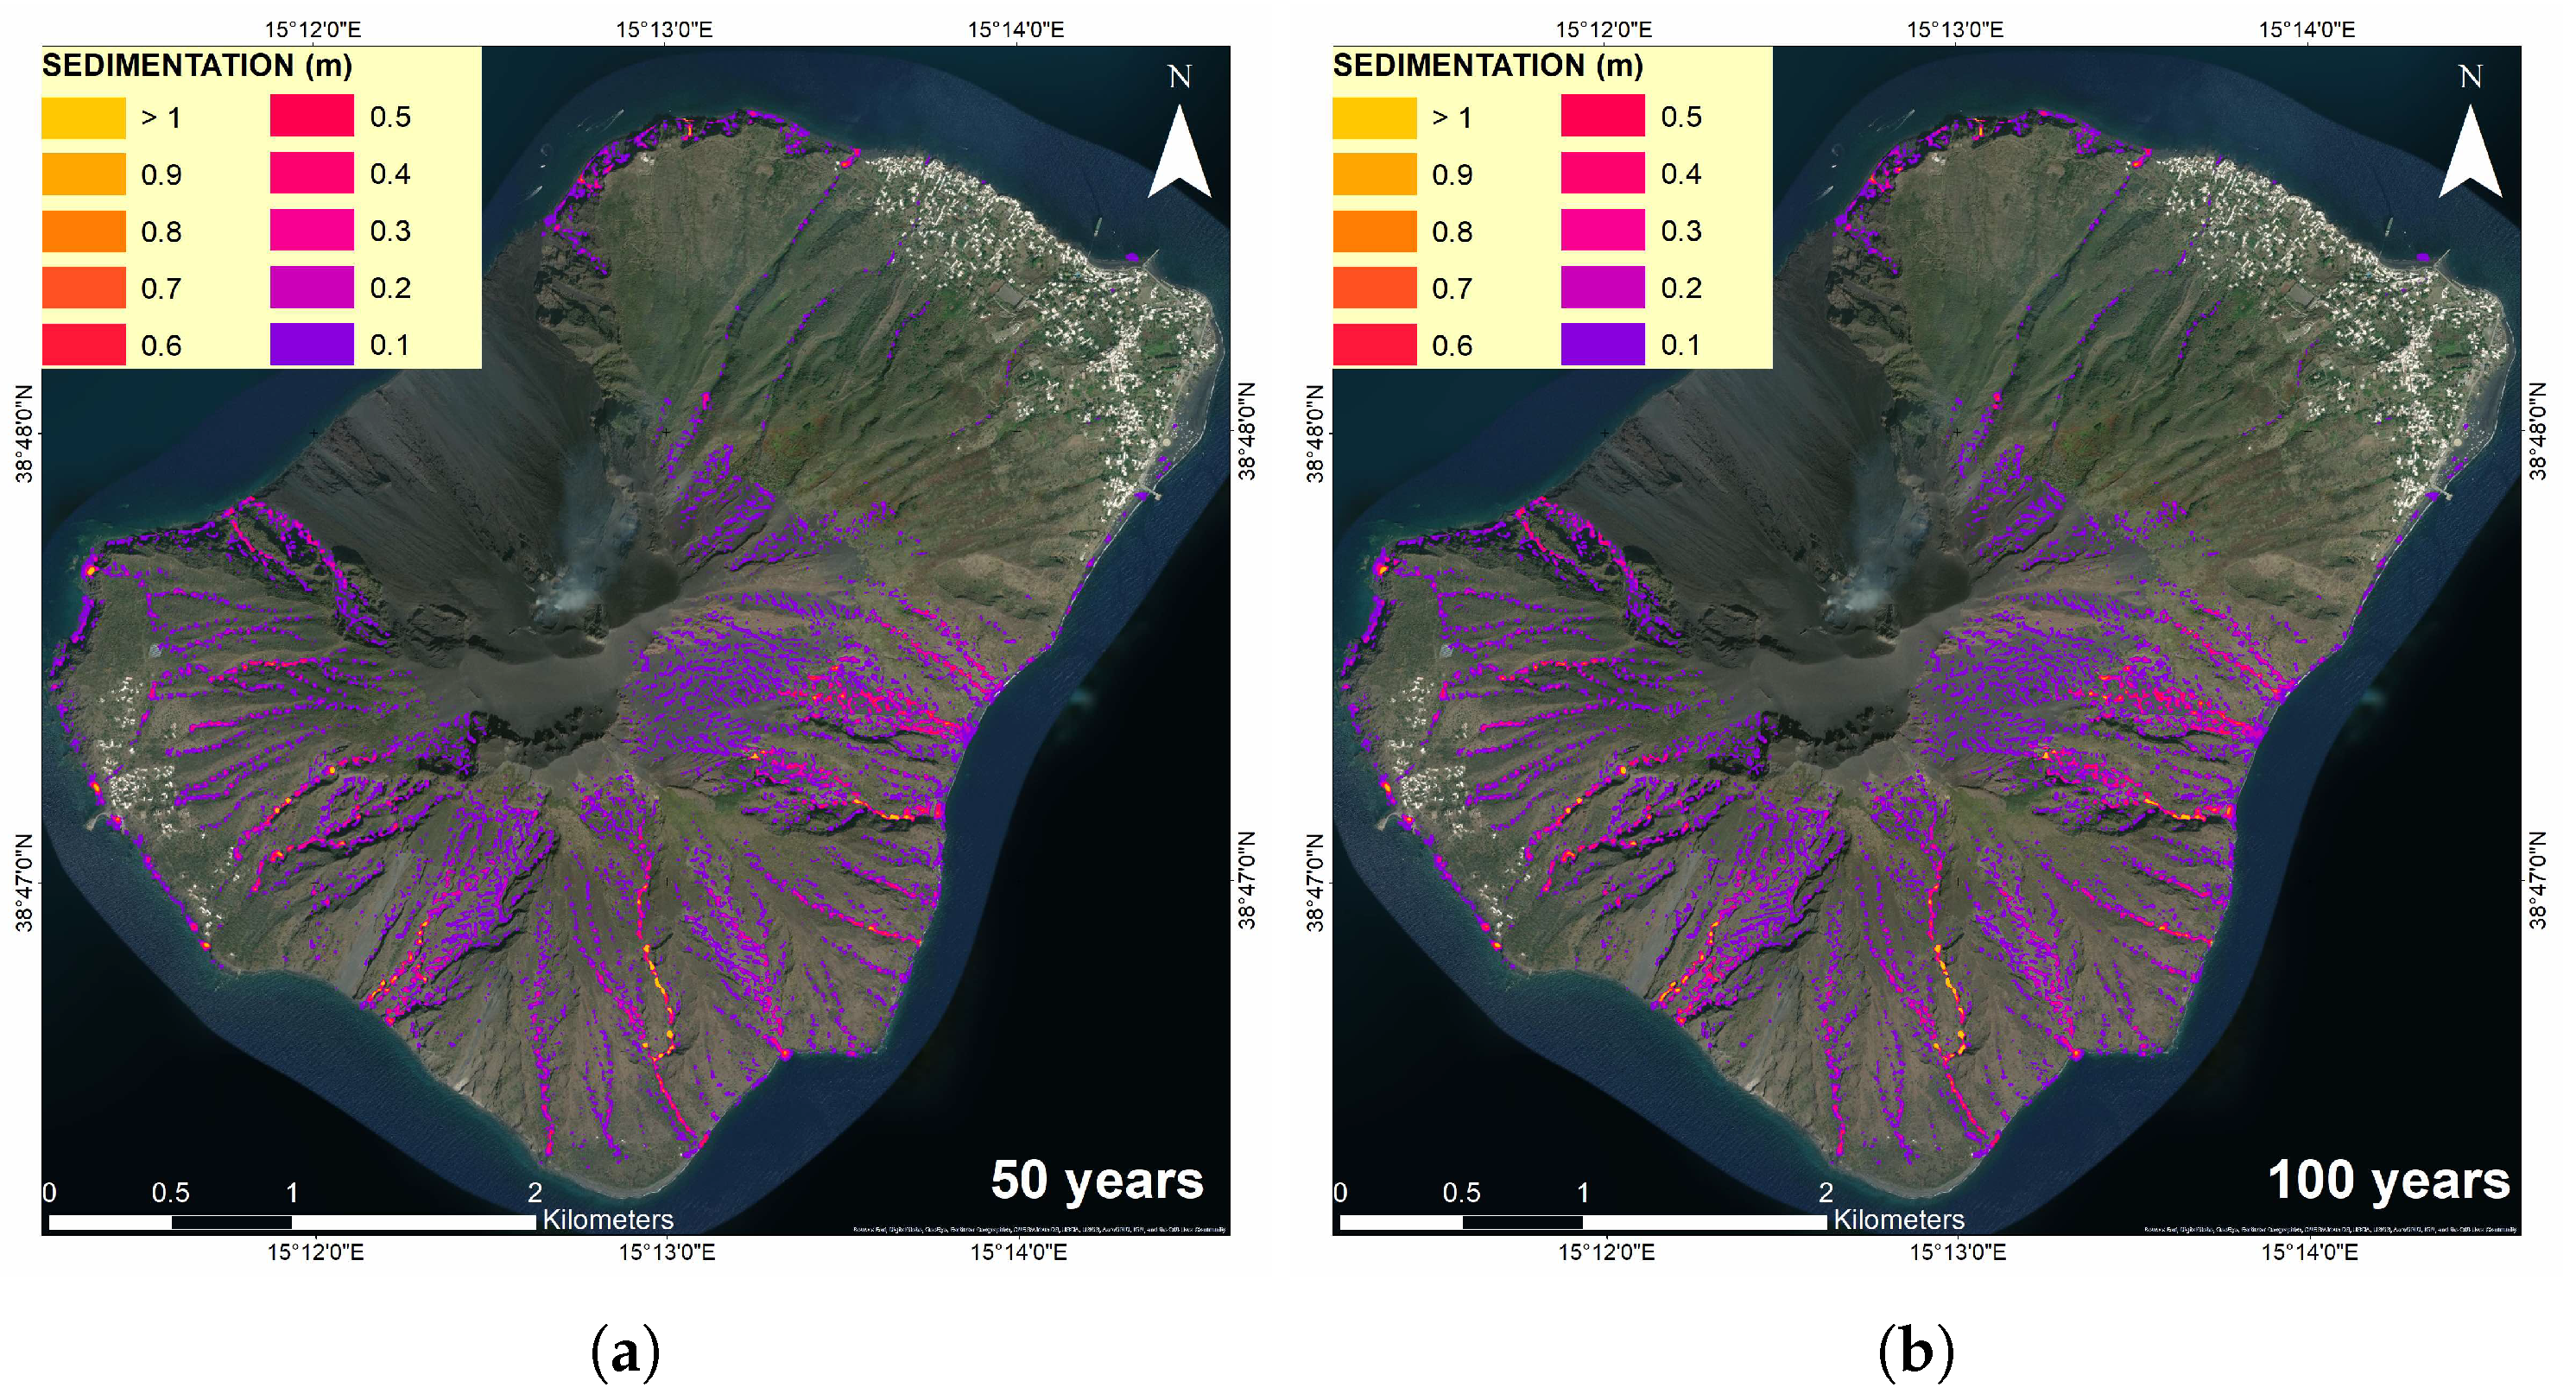
3.2. Sediment Erosion and Deposition

The bed load sediment transport depends on the shear stress at the bottom, which is a measure of the friction force from a fluid acting on the sediment. The accurate estimation of the bottom shear stress is pivotal to predict the erosion and deposition. Calculated maps of the bottom shear stress for each return period are shown in Figure 6, where values vary from a minimum range of 10–50 N/m2 up to values greater than 500 N/m2.
Erosion maps (Figure 7) are represented in terms of erosion depth ranges from 0–0.1 m to >0.9 m, while sedimentation (Figure 8) varied from 0.1 m to values greater than 1 m.

4. Discussion

The main effect of the wildfires caused by the paroxysmal eruption of 3 July 2019 was to almost completely eliminate the vegetation that used to cover the areas southwest and east of the volcanic island. As is known, large fires can cause direct and indirect impacts on soils, as a result of the combustion of organic matter, in the first case, and as a result of the reduction of the plant cover and deposition of ash and burnt plants, in the second case. The most immediate consequence of fire is the creation of water repellency in soils, which is responsible for post-fire runoff and erosion [56]. Very severe fires can generate modification in the hydrological functioning of a drainage system [57]. The fire-induced changes on catchment hydrology depends on the spatial connection of the runoff sources [20], since fires can generate connected areas of soil, which can induce post-fire runoff and erosion. Although a connectivity study was not applied in the present work, the results of the runoff and sediment transport simulations indicated that the soil modification induced by the fire on the island caused a change in the hydrological structure of the burnt area. Numerical simulations of the superficial runoff showed that the flood velocities and, in turn, flood discharge rates could increase if compared to the pre-eruptive scenario. The biggest differences in flow rates were mainly observed for Ginostra, where for a 50 year return period, runoff due to rainfall could increase up to 0.16 m2/s (Figure 4a). The surface flow rates increased over most of the island territory for the 100 year return period (Figure 4b). The calculated maximum differences could imply surface flow rates that could exceed 0.5 m2/s on the Ginostra inhabited area.
Flood susceptibility maps (Figure 5) showed that overall, the island was characterized by a low flood susceptibility. However, there were limited areas where moderate floods could occur, with flow rates between 0.25 and 1 m2/s. These areas were present especially in Ginostra and the tourist zone of Stromboli. This information could be very useful for civil protection purposes since the morphology and the particular road network of the island could cause a relevant channeling of floods with possible higher consequences. In addition, the knowledge of the susceptible flooded area could help with the identification of safe zones in case of different types of events, e.g., floods or eruptions that can have flood consequences in the case of rainfall.
Although numerical simulations of flood levels on the island led to defining a low to moderate flood susceptibility, surface water flows could determine a considerable sediment transport phenomenon. The calculated bottom shear stresses (Figure 6) showed that, starting from the south edge of the volcanic structure up to the area north of Ginostra, the values of shear stress were high, ranging from 200 to more than 450 N/m2. In the inhabited area, the force was reduced to values in the range of 10–100 N/m2. From the north edge of the volcano to the tourist area of Stromboli, the shear stress values varied from 10 up to a maximum of 400 N/m2. No noticeable variations were observed with the increase in the return period. From the numerically calculated shear stress values derived the erosion and sedimentation maps discussed below.
Erosion maps showed that for the 50 year return period (Figure 7a), granular material could be eroded by the water flow up to a maximum depth of 0.7–0.8 m in the southwest area of the island. To the south, erosion could reach up to 0.9 m, while to the southeast, the maximum erosion range could be 0.6–0.7 m. For longer return periods (Figure 7b,c), erosion levels increased up to 0.8–0.9 m above Ginostra and 1 m to the southeast. The eroded material could be re-mobilized and transported downstream from the source. The sedimentation maps (Figure 8) showed that in the inhabited area of Ginostra, the rains could lead to the flow and sedimentation of the eroded material up to thicknesses ranging from 0.1 to 0.3 m. However, the pathways above Gnostra could be affected by sedimentation of up to 1 m. To the north of the island, although the portion of burnt soil was limited in comparison to the southern area, heavy rains could cause a discreet transport of sediments, with the sedimentation of up to 0.2 m of material near the Stromboli tourist zone. It is important to note that, if erosion and sedimentation levels seemed to overlap in our calculated maps, this was actually an effect of the display resolution. Erosion occurred mainly within the center of the drainage channels, while sedimentation on the edge of them. A higher resolution image would show the local character of erosion and deposition within the drainage channels.
The eroded areas, mainly in the upper portion of the volcano, were strictly connected with the main dispersion of the pyroclastic plume. The principal resulting problem could be the outcropping of rocks, usually with joint/cracks due to the cooling process. The exposition of these rocks to the atmospheric agents and runoff could worsen the geotechnical properties with possible consequences in the loss of stability and an increase in rock-fall risk. In addition, the erosion in the upper part of the volcano could involve the trail network, relevant resources for the economy of the island.

5. Conclusions

Explosive eruptions can disrupt the environment around volcanoes by inducing wildfires on vegetated volcano slopes, altering the boundary conditions of fluvial systems, increasing the erosion rate and drainage mass flux (water and sediment) in the affected basin. In this study, the effect on the water runoff and sediment transport of the 3 July 2019 Stromboli explosion-triggered wildfires was analyzed. After a preliminary hydrological study conducted for calculating and analyzing the superficial flows that could occur on the island because of rainfall, a flood susceptibility assessment and a sediment transport analysis were carried out for the return periods corresponding to 50, 100, and 300 years. Modeling was performed using IBER, calculating flooding levels, soil erosion, and sediment transport. Results showed that the fire caused a decrease in the Manning friction coefficient in the area under study, determining an increase of the discharge rates of superficial runoff. Large differences of flooding between unburnt and burnt landscape, mainly for the 100 year return period, were recognized. The prevalent differences in flow rates were mainly observed in the town of Ginostra, where the water flow could increase up to 0.16 m2/s for the 50 year return period. Although this increase in runoff levels did not imply a significant increase in flood susceptibility, which was demonstrated by the flood susceptibility maps showing that the flood hazard on the island remained low to moderate, transport of material from burnt areas could occur and could affect the inhabited areas of the island. In fact, above Ginostra, rainfall could transport from 0.1 to 1 m of granular material, with evident consequences on the trail network used as communication routes.
Although there are many published studies on the effects of volcanic eruptions on watersheds, the effect that eruption-induced wildfires generate on surface re-emergence had never been addressed. This work showed that even in volcanic areas with little predisposition to trigger floods and debris flows, eruption-induced wildfires could alter the hydrological conditions and increase the hazard related to these phenomena. The results obtained have a further important impact on communities and local authorities, since they allow defining flood hazard scenarios. In fact, the methodology presented here is useful to obtain high spatial and temporal resolution for flood hazard assessment, since it was based on the use of a solid model that solved the 2D Saint Venant hydrodynamic equations for high precision water depth, velocity, and flow rate calculations. A possible further development could be the estimation of the probability of inundation, vulnerability, and the exposed value in order to produce flood risk maps, which could be a valuable tool for urban and regional planning on the island of Stromboli. Having conducted a hazard analysis based on the national recommendations for identifying flood risk areas, this work could be considered as the local flood risk assessment.

Author Contributions

Conceptualization, R.B. and F.D.T.; data curation, O.S.A.-R., R.B. and F.D.T.; formal analysis, O.S.A.-R., R.B., F.D.T. and M.D.S.; funding acquisition, R.B. and N.C.; investigation, R.B. and F.D.T.; methodology, O.S.A.-R., R.B. and F.D.T.; project administration, R.B. and F.D.T.; resources, R.B. and F.D.T.; supervision, R.B.; validation, O.S.A.-R., R.B. and F.D.T.; visualization, O.S.A.-R. and R.B.; writing, original draft, O.S.A.-R., R.B., F.D.T. and M.D.S.; writing, review and editing, O.S.A.-R., R.B., F.D.T. and M.D.S. All authors have read and agree to the published version of the manuscript.

Funding

This work was partially supported by the “Presidenza del Consiglio dei Ministri–Dipartimento della Protezione Civile” (Presidency of the Council of Ministers-Department of Civil Protection); this publication, however, does not reflect the position and the official policies of the Department.

Acknowledgments

For technical and logistic support during the 2019 Stromboli eruption, we thank Salvatore Zaia (Presidenza del Consiglio dei Ministri–Dipartimento della Protezione Civile), Nicola Alleruzzo (Regione Siciliana-Dipartimento della Protezione Civile), and Filippo Bovegna (Regione Siciliana-Dipartimento della Protezione Civile). We also thank Aeronautica Militare (Italian Air Force) and Dipartimento della Protezione Civile (Department of Civil Protection), for the rainfall data provided for the hydrological study.

Conflicts of Interest

The authors declare no conflict of interest.

References

  1. Pierson, T.C.; Scott, K.M. Downstream dilution of a lahar: Transition from debris flow to hyperconcentrated streamflow. Water Resour. Res. 1985, 21, 1511–1524. [Google Scholar] [CrossRef]
  2. Bisson, M.; Pareschi, M.T.; Zanchetta, G.; Supizio, R.; Santacroce, R. Volcaniclastic debris-flow occurrences in the Campania region (Southern Italy) and their relation to Holocene-Late Pleistocene pyroclastic fall deposits: Implications for large-scale hazard mapping. Bull. Volcanol. 2007, 70, 157–167. [Google Scholar] [CrossRef] [Green Version]
  3. Pierson, T.C.; Major, J.J. Hydrogeomorphic effects of explosive volcanic eruptions on drainage basins. Annu. Rev. Earth Planet. Sci. 2014, 42, 469–507. [Google Scholar] [CrossRef]
  4. Gran, K.B.; Montgomery, D.R. Spatial and temporal patterns in fluvial recovery following volcanic eruptions: Channei response to basin-wide sediment loading at Mount Pinatubo, Philippines. Geol. Soc. Am. Bull. 2005, 117, 195–211. [Google Scholar] [CrossRef] [Green Version]
  5. Major, J.J.; Mark, L.E. Peak flow responses to landscape disturbances caused by the cataclysmic 1980 eruption of Mount St. Helens, Washington. Geol. Soc. Am. Bull. 2006, 118, 938–958. [Google Scholar] [CrossRef]
  6. Panagoulia, D.; Zarris, D.; Maggina, K. An Assessment of the Interaction Between Storm Events and Sediment Transport. In Proceedings of the 5th International Synposium on Ecohydraulics, Aguatic Habitats: Analysis & Restoration, Madrid, Spain, 12–17 September 2004; pp. 281–286. [Google Scholar]
  7. Son, J.H.; Kim, S.; Carlson, K.H. Effects of wildfire on river water quality and riverbed sediment phosphorus. Water Air Soil Pollut. 2015, 226, 26. [Google Scholar] [CrossRef]
  8. Malmon, D.V.; Reneau, S.L.; Katzman, D.; Lavine, A.; Lyman, J. Suspended sediment transport in an ephemeral stream following wildfire. J. Geophys. Res. Earth Surf. 2007, 112, 1–16. [Google Scholar] [CrossRef]
  9. Major, J.; Bertin, D.; Pierson, T.C.; Amigo, Á.; Iroumé, A.; Ulloa, H.; Castro, J. Extraordinary sediment delivery and rapid geomorphic response following the 2008–2009 eruption of Chaitén Volcano, Chile. Water Resour. Res. 2016, 52, 5075–5094. [Google Scholar] [CrossRef]
  10. Jones, R.; Thomas, R.E.; Peakall, J.; Manville, V. Rainfall-runoff properties of tephra: Simulated effects of grain-size and antecedent rainfall. Geomorphology 2017, 282, 39–51. [Google Scholar] [CrossRef]
  11. Branca, S. Geological and geomorphological evolution of the Etna volcano NE flank and relationships between lava flow invasions and erosional processes in the Alcantara Valley (Italy). Geomorphology 2003, 53, 147–161. [Google Scholar] [CrossRef]
  12. Rhoades, C.C.; Entwistle, D.; Butler, D. The influence of wildfire extent and severity on streamwater chemistry, sediment and temperature following the Hayman Fire, Colorado. Int. J. Wild. Fire 2011, 20, 430–442. [Google Scholar] [CrossRef]
  13. Warrick, J.A.; Hatten, J.A.; Pasternack, G.B.; Gray, A.B.; Goni, M.A.; Wheatcroft, R.A. The effects of wildfire on the sediment yield of a coastal California watershed. Bull. Geol. Soc. Am. 2012, 124, 1130–1146. [Google Scholar] [CrossRef] [Green Version]
  14. Lane, P.N.; Sheridan, G.J.; Noske, P.J. Changes in sediment loads and discharge from small mountain catchments following wildfire in south eastern Australia. J. Hydrol. 2006, 331, 495–510. [Google Scholar] [CrossRef]
  15. Parise, M.; Cannon, S.H. Wildfire impacts on the processes that generate debris flows in burned watersheds. Nat. Haz. 2012, 61, 217–227. [Google Scholar] [CrossRef]
  16. Major, J.J. Post-eruption hydrology and sediment transport in volcanic river systems. Water Resour. Impact 2003, 5, 10–15. [Google Scholar]
  17. Cannon, S.H.; Reneau, S.L. Conditions for generation of fire-related debris flows, Capulin Canyon, New Mexico. Earth Surf. Process. Landforms 2000, 25, 1103–1121. [Google Scholar] [CrossRef]
  18. Cannon, S.H.; Gartner, J.E. Wildfire-related debris flow from a hazards perspective. In Debris-fLow Hazards and Related Phenomena; Springer: Berlin/Heidelberg, Germany, 2005; pp. 363–385. [Google Scholar]
  19. Panagoulia, D. Hydrological modeling of a medium-size mountainous catchment from incomplete meteorological data. J. Hydrol. 1992, 137, 279–310. [Google Scholar] [CrossRef]
  20. Ortíz-Rodríguez, A.J.; Muñoz-Robles, C.; Borselli, L. Changes in connectivity and hydrological efficiency following wildland fires in Sierra Madre Oriental, Mexico. Sci. Total Environ. 2019, 655, 112–128. [Google Scholar] [CrossRef]
  21. Barberi, F.; Rosi, M.; Sodi, A. Volcanic hazard assessment at Stromboli based on review of historical data. Acta Vulcanol. 1993, 3, 173–187. [Google Scholar]
  22. Blackbum, E.A.; Wilson, L.; Sparks, R.J. Mechanisms and dynamics of strombolian activity. J. Geol. Soc. 1976, 132, 429–440. [Google Scholar] [CrossRef]
  23. Calvari, S.; Bonaccorso, A.; Madonia, P.; Neri, M.; Liuzzo, M.; Salerno, G.G.; Behncke, B.; Caltabiano, T.; Cristaldi, A.; Giuffrida, G.; et al. Major eruptive style changes induced by structural modifications of a shallow conduit system: The 2007–2012 Stromboli case. Bull. Volcanol. 2014, 76, 841. [Google Scholar] [CrossRef]
  24. Calvari, S.; Spampinato, L.; Lodato, L.; Harris, A.J.; Patrick, M.R.; Dehn, J.; Burton, M.; Andronico, D. Chronology and complex volcanic processes during the 2002–2003 flank eruption at Stromboli volcano (Italy) reconstructed from direct observations and surveys with a handheld thermal camera. J. Geophys. Res. Solid Earth 2005, 110. [Google Scholar] [CrossRef] [Green Version]
  25. Calvari, S.; Lodato, L.; Steffke, A.; Cristaldi, A.; Harris, A.J.L.; Spampinato, L.; Boschi, E. The 2007 Stromboli flank eruption: Chronology of the events, and effusion rate measurements from thermal images and satellite data. J. Geophys. Res. Solid Earth 2010, 115, B04201. [Google Scholar] [CrossRef] [Green Version]
  26. Di Traglia, F.; Calvari, S.; D’Auria, L.; Nolesini, T.; Bonaccorso, A.; Fornaciai, A.; Esposito, A.; Cristaldi, A.; Favalli, M.; Casagli, N. The 2014 effusive eruption at Stromboli: New insights from in situ and remote-sensing measurements. Remote Sens. 2018, 10, 2035. [Google Scholar] [CrossRef] [Green Version]
  27. Plank, S.; Marchese, F.; Filizzola, C.; Pergola, N.; Neri, M.; Nolde, M.; Martinis, S. The July/August 2019 Lava Flows at the Sciara del Fuoco, Stromboli–Analysis from Multi-Sensor Infrared Satellite Imagery. Remote Sens. 2019, 11, 2879. [Google Scholar] [CrossRef] [Green Version]
  28. Turchi, A.; Di Traglia, F.; Luti, T.; Olori, D.; Zetti, I.; Fanti, R. Environmental Aftermath of the 2019 Stromboli Eruption. Remote Sens. 2020, 12, 994. [Google Scholar] [CrossRef] [Green Version]
  29. Bladé, E.; Cea, L.; Corestein, G.; Escolano, E.; Puertas, J.; Vázquez-Cendón, J.; Dolz, J.; Coll, A. IBER: Herramienta de simulación numérica de flujo en ríos. Rev. Int. Métodos Numéricos Para Cálculo Diseño Ing. 2014, 30, 1–10. [Google Scholar] [CrossRef] [Green Version]
  30. Apuani, T.; Corazzato, C.; Cancelli, A.; Tibaldi, A. Physical and mechanical properties of rock masses at Stromboli: A dataset for volcano instability evaluation. Bull. Eng. Geol. Environ. 2005, 64, 419. [Google Scholar] [CrossRef]
  31. Boldini, D.; Wang, F.; Sassa, K.; Tommasi, P. Application of large-scale ring shear tests to the analysis of tsunamigenic landslides at the Stromboli volcano, Italy. Landslide 2009, 6, 231–240. [Google Scholar] [CrossRef] [Green Version]
  32. Rotonda, T.; Tommasi, P.; Boldini, D. Geomechanical characterization of the volcaniclastic material involved in the 2002 landslides at Stromboli. J. Geotech. Geoenviron. Eng. 2010, 136, 389–401. [Google Scholar] [CrossRef]
  33. Nolesini, T.; Di Traglia, F.; Del Ventisette, C.; Moretti, S.; Casagli, N. Deformations and slope instability on Stromboli volcano: Integration of GBInSAR data and analog modeling. Geomorphology 2013, 180, 242–254. [Google Scholar] [CrossRef]
  34. International Society for Rock Mechanics. Rock Characterization Testing & [and] Monitoring: ISRM Suggested Methods; Pergamon Press: Oxford, UK, 1981. [Google Scholar]
  35. Hoek, E.; Carranza-Torres, C.; Corkum, B. Hoek-Brown failure criterion-2002 edition. Proc. NARMS-Tac 2002, 1, 267–273. [Google Scholar]
  36. Apuani, T.; Corazzato, C.; Cancelli, A.; Tibaldi, A. Stability of a collapsing volcano (Stromboli, Italy): Limit equilibrium analysis and numerical modelling. J. Volcanol. Geotherm. Res. 2005, 144, 191–210. [Google Scholar] [CrossRef]
  37. Corazzato, C.; Francalanci, L.; Menna, M.; Petrone, C.M.; Renzulli, A.; Tibaldi, A.; Vezzoli, L. What controls sheet intrusion in volcanoes? Structure and petrology of the Stromboli sheet complex, Italy. J. Volcanol. Geotherm. Res. 2008, 173, 26–54. [Google Scholar] [CrossRef]
  38. Casagli, N.; Tibaldi, A.; Merri, A.; Del Ventisette, C.; Apuani, T.; Guerri, L.; Fortuny-Guasch, J.; Tarchi, D. Deformation of Stromboli Volcano (Italy) during the 2007 eruption revealed by radar interferometry, numerical modelling and structural geological field data. J. Volcanol. Geotherm. Res. 2009, 182, 182–200. [Google Scholar] [CrossRef]
  39. Bartolini, S.; Cappello, A.; Martí, J.; Del Negro, C. QVAST: A new Quantum GIS plugin for estimating volcanic susceptibility. Nat. Hazards Earth Syst. Sci. 2013, 13, 3031–3042. [Google Scholar] [CrossRef] [Green Version]
  40. Di Traglia, F.; Bartolini, S.; Artesi, E.; Nolesini, T.; Ciampalini, A.; Lagomarsino, D.; Martí, J.; Casagli, N. Susceptibility of intrusion-related landslides at volcanic islands: The Stromboli case study. Landslides 2018, 15, 21–29. [Google Scholar] [CrossRef] [Green Version]
  41. Del Soldato, M.; Segoni, S.; De Vita, P.; Pazzi, V.; Tofani, V.; Moretti, S. Thickness model of pyroclastic soils along mountain slopes of Campania (southern Italy). In Landslides and Engineered Slopes. Experience, Theory and Practice; Associazione Geotecnica Italaiana: Rome, Italy, 2016. [Google Scholar]
  42. Del Soldato, M.; Pazzi, V.; Segoni, S.; De Vita, P.; Tofani, V.; Moretti, S. Spatial modeling of pyroclastic cover deposit thickness (depth to bedrock) in peri-volcanic areas of Campania (southern Italy). Earth Surf. Process. Landforms 2018, 43, 1757–1767. [Google Scholar] [CrossRef] [Green Version]
  43. Lucchesi, T.; Arnone, G. Relazione Generale. In Piano Stralcio di Bacino per l’Assetto Idrogeologico della Regione Siciliana; Assessorato Territorio e Ambiente Dipartimento Territorio e Ambiente: Regione Siciliana, Italy, 2004; pp. 1–183. [Google Scholar]
  44. Chen, I. Rainfall intensity-duration-frequency formulas. J. Hydraul. Eng. 1983, 109, 1603. [Google Scholar] [CrossRef]
  45. Bladé, E.; Cea, L.; Corestein, G. Modelización numérica de inundaciones fluviales. Ing. Del Agua 2014, 18, 71–82. [Google Scholar]
  46. Bonasia, R.; Areu-Rangel, O.S.; Tolentino, D.; Mendoza-Sanchez, I.; González-Cao, J.; Klapp, J. Flooding hazard assessment at Tulancingo (Hidalgo, Mexico). J. Flood Risk Manag. 2014, 11, S1116–S1124. [Google Scholar] [CrossRef]
  47. Areu-Rangel, O.S.; Cea, L.; Bonasia, R.; Espinosa-Echavarria, V.J. Impact of urban growth and changes in land use on river flood hazard in Villahermosa, Tabasco (Mexico). Water 2019, 11, 304. [Google Scholar] [CrossRef] [Green Version]
  48. Chiew, Y.M.; Parker, G. Incipient motion on non-horizontal slopes. Jou Hydraul. Res. 1994, 32, 649–660. [Google Scholar] [CrossRef]
  49. Meyer-Peter, E.; Müller, R. Formulas for bedload transport. In Proceedings of the 2nd Congress, IAHR, Stockholm, Sweden, 7–9 June 1948; pp. 39–64. [Google Scholar]
  50. Van Rijn, L.C. Mathematical Modelling of Morphological Processes in the Case of Suspended Sediment Transport. 1987. Available online: https://pdfs.semanticscholar.org/551e/4a238e9fa0651c5e44558c27f7a56d490aee.pdf (accessed on 17 April 2020).
  51. Pinto, L.; Fortunato, A.B.; Freire, P. Sensitivity analysis of non-cohesive sediment transport formulae. Cont. Shelf Res. 2006, 26, 1826–1839. [Google Scholar] [CrossRef]
  52. Wong, M. Does the Bedload Equation of Meyer-Peter and Mu¨ller Fit Its Own Data? International Association of Hydraulic Research: Thessaloniki, Greece, 2003; pp. 73–80. [Google Scholar]
  53. Wong, M.; Parker, G. Reanalysis and Correction of Bed-Load Relation of Meyer-Peter and Müller Using Their Own Database. J. Hydraul. Eng. 2006, 132, 1159–1168. [Google Scholar] [CrossRef] [Green Version]
  54. Apsley, D.D.; Stansby, P.K. Bed-Load Sediment Transport on Large Slopes: Model Formulation and Implementation with a RANS Solver. J. Hydraul. Eng. ASCE 2008, 134, 1440–1451. [Google Scholar] [CrossRef]
  55. Verrucci, L.; Tommasi, P.; Boldini, D.; Graziani, A.; Rotonda, T. Modeling the instability phenomena on the NW flank of Stromboli Volcano (Italy) due to lateral dyke intrusion. J. Volcanol. Geoth. Res. 2019, 371, 245–262. [Google Scholar] [CrossRef]
  56. Neary, D.G.; Ryan, K.C.; DeBano, L.F. Wildland fire in ecosystems: Effects of fires on soils and water. In General Technical Report RMRS-GTR-41-vol.4; USDA, Forest Service, Rocky Mountain Research Station: Ogden, UT, USA, 2005. [Google Scholar]
  57. Ebel, B.A.; Mirus, B.B. Disturbance hydrology: Challenges and opportunities. Hydrol. Process 2014, 28, 5140–5148. [Google Scholar] [CrossRef]
Figure 1. The island of Stromboli: (a) geographic location of the island; (b) the island as detected by the PLÉIDES-1 satellite after the 3 July 2019 explosion (the main geographic and geologic elements are also reported); (c) the slope upstream of the town of Ginostra after the wildfire triggered by the explosion of 3 July 2019 (photo taken on 27 July 2019); (d) terraced olive grove affected by debris re-sedimentation (photo taken on January 2020).
Sustainability 12 03268 g001
Figure 2. Computational domain. The northwest flank of the volcano, the Sciara del Fuoco (SdF), is not considered in the simulations.
Sustainability 12 03268 g002
Figure 3. Maps of soil types distribution on Stromboli, before (a) and after (b) the 3 July 2019 eruption.
Sustainability 12 03268 g003
Figure 4. Maps of flood discharge rate differences between flood scenarios constructed with the land use information referring to the pre- and post-eruptive scenarios. Maps are constructed for the return periods: (a) 50 years, (b) 100 years, and (c) 300 years.
Sustainability 12 03268 g004aSustainability 12 03268 g004b
Figure 5. Flood susceptibility maps of Stromboli for the return periods: (a) 50 years, (b) 100 years, and (c) 300 years.
Sustainability 12 03268 g005
Figure 6. Bottom shear stress maps for the return periods: (a) 50 years, (b) 100 years, and (c) 300 years.
Sustainability 12 03268 g006
Figure 7. Erosion maps for the return periods: (a) 50 years, (b) 100 years, and (c) 300 years.
Sustainability 12 03268 g007
Figure 8. Sedimentation maps for the return periods: (a) 50 years, (b) 100 years, and (c) 300 years.
Sustainability 12 03268 g008aSustainability 12 03268 g008b
Table 1. Rainfall intensities (I) and effective rainfall intensities ( I e ) calculated for different return periods and a concentration time of 15 min.
T r (Years)I (mm/h) I e (mm/h)
50127.8963.95
100142.4671.23
300165.5582.78
Table 2. Parameters used for sediment transport simulations.
ParameterValue
Maximum simulation time1500 s
Results time interval12 s
Numerical schemeFirst order
Courant–Friedrichs–Lewy number0.45
Wet-dry limit0.01 m
Grain diameter D 50 0.0015 m
Bed porosity0.33
Friction angle0.67 rad
Bed relative density2.65

