Spatial-Temporal Characteristics of Coastline Changes in Indonesia from 1990 to 2018


Abstract
1. Introduction
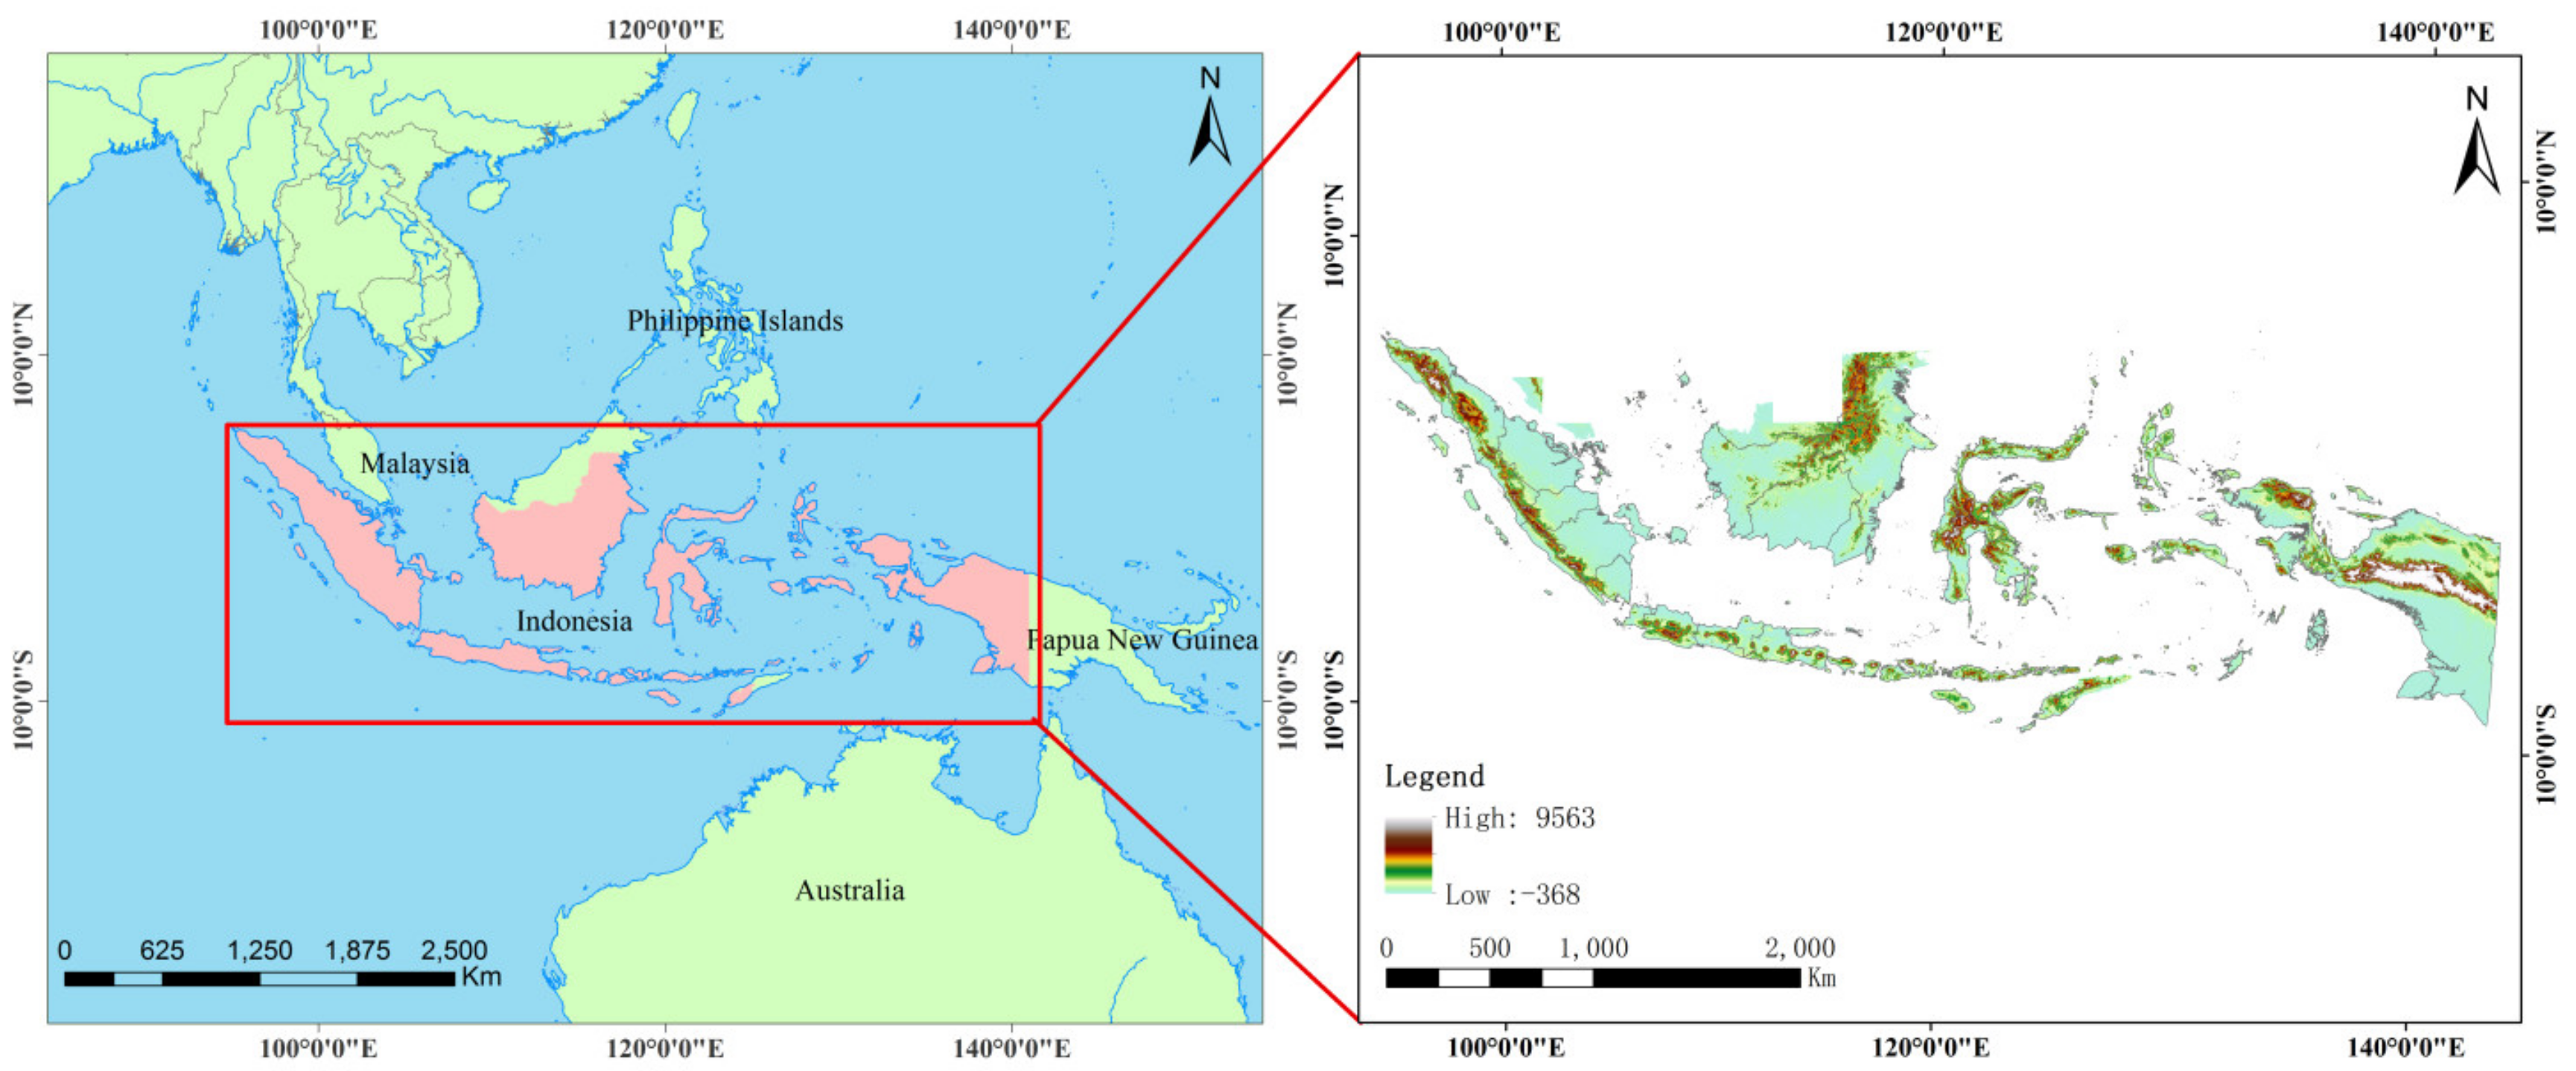
2. Study on the Area and Data Source
2.1. Study on the Situation of Area
2.2. Data Source and Preprocessing
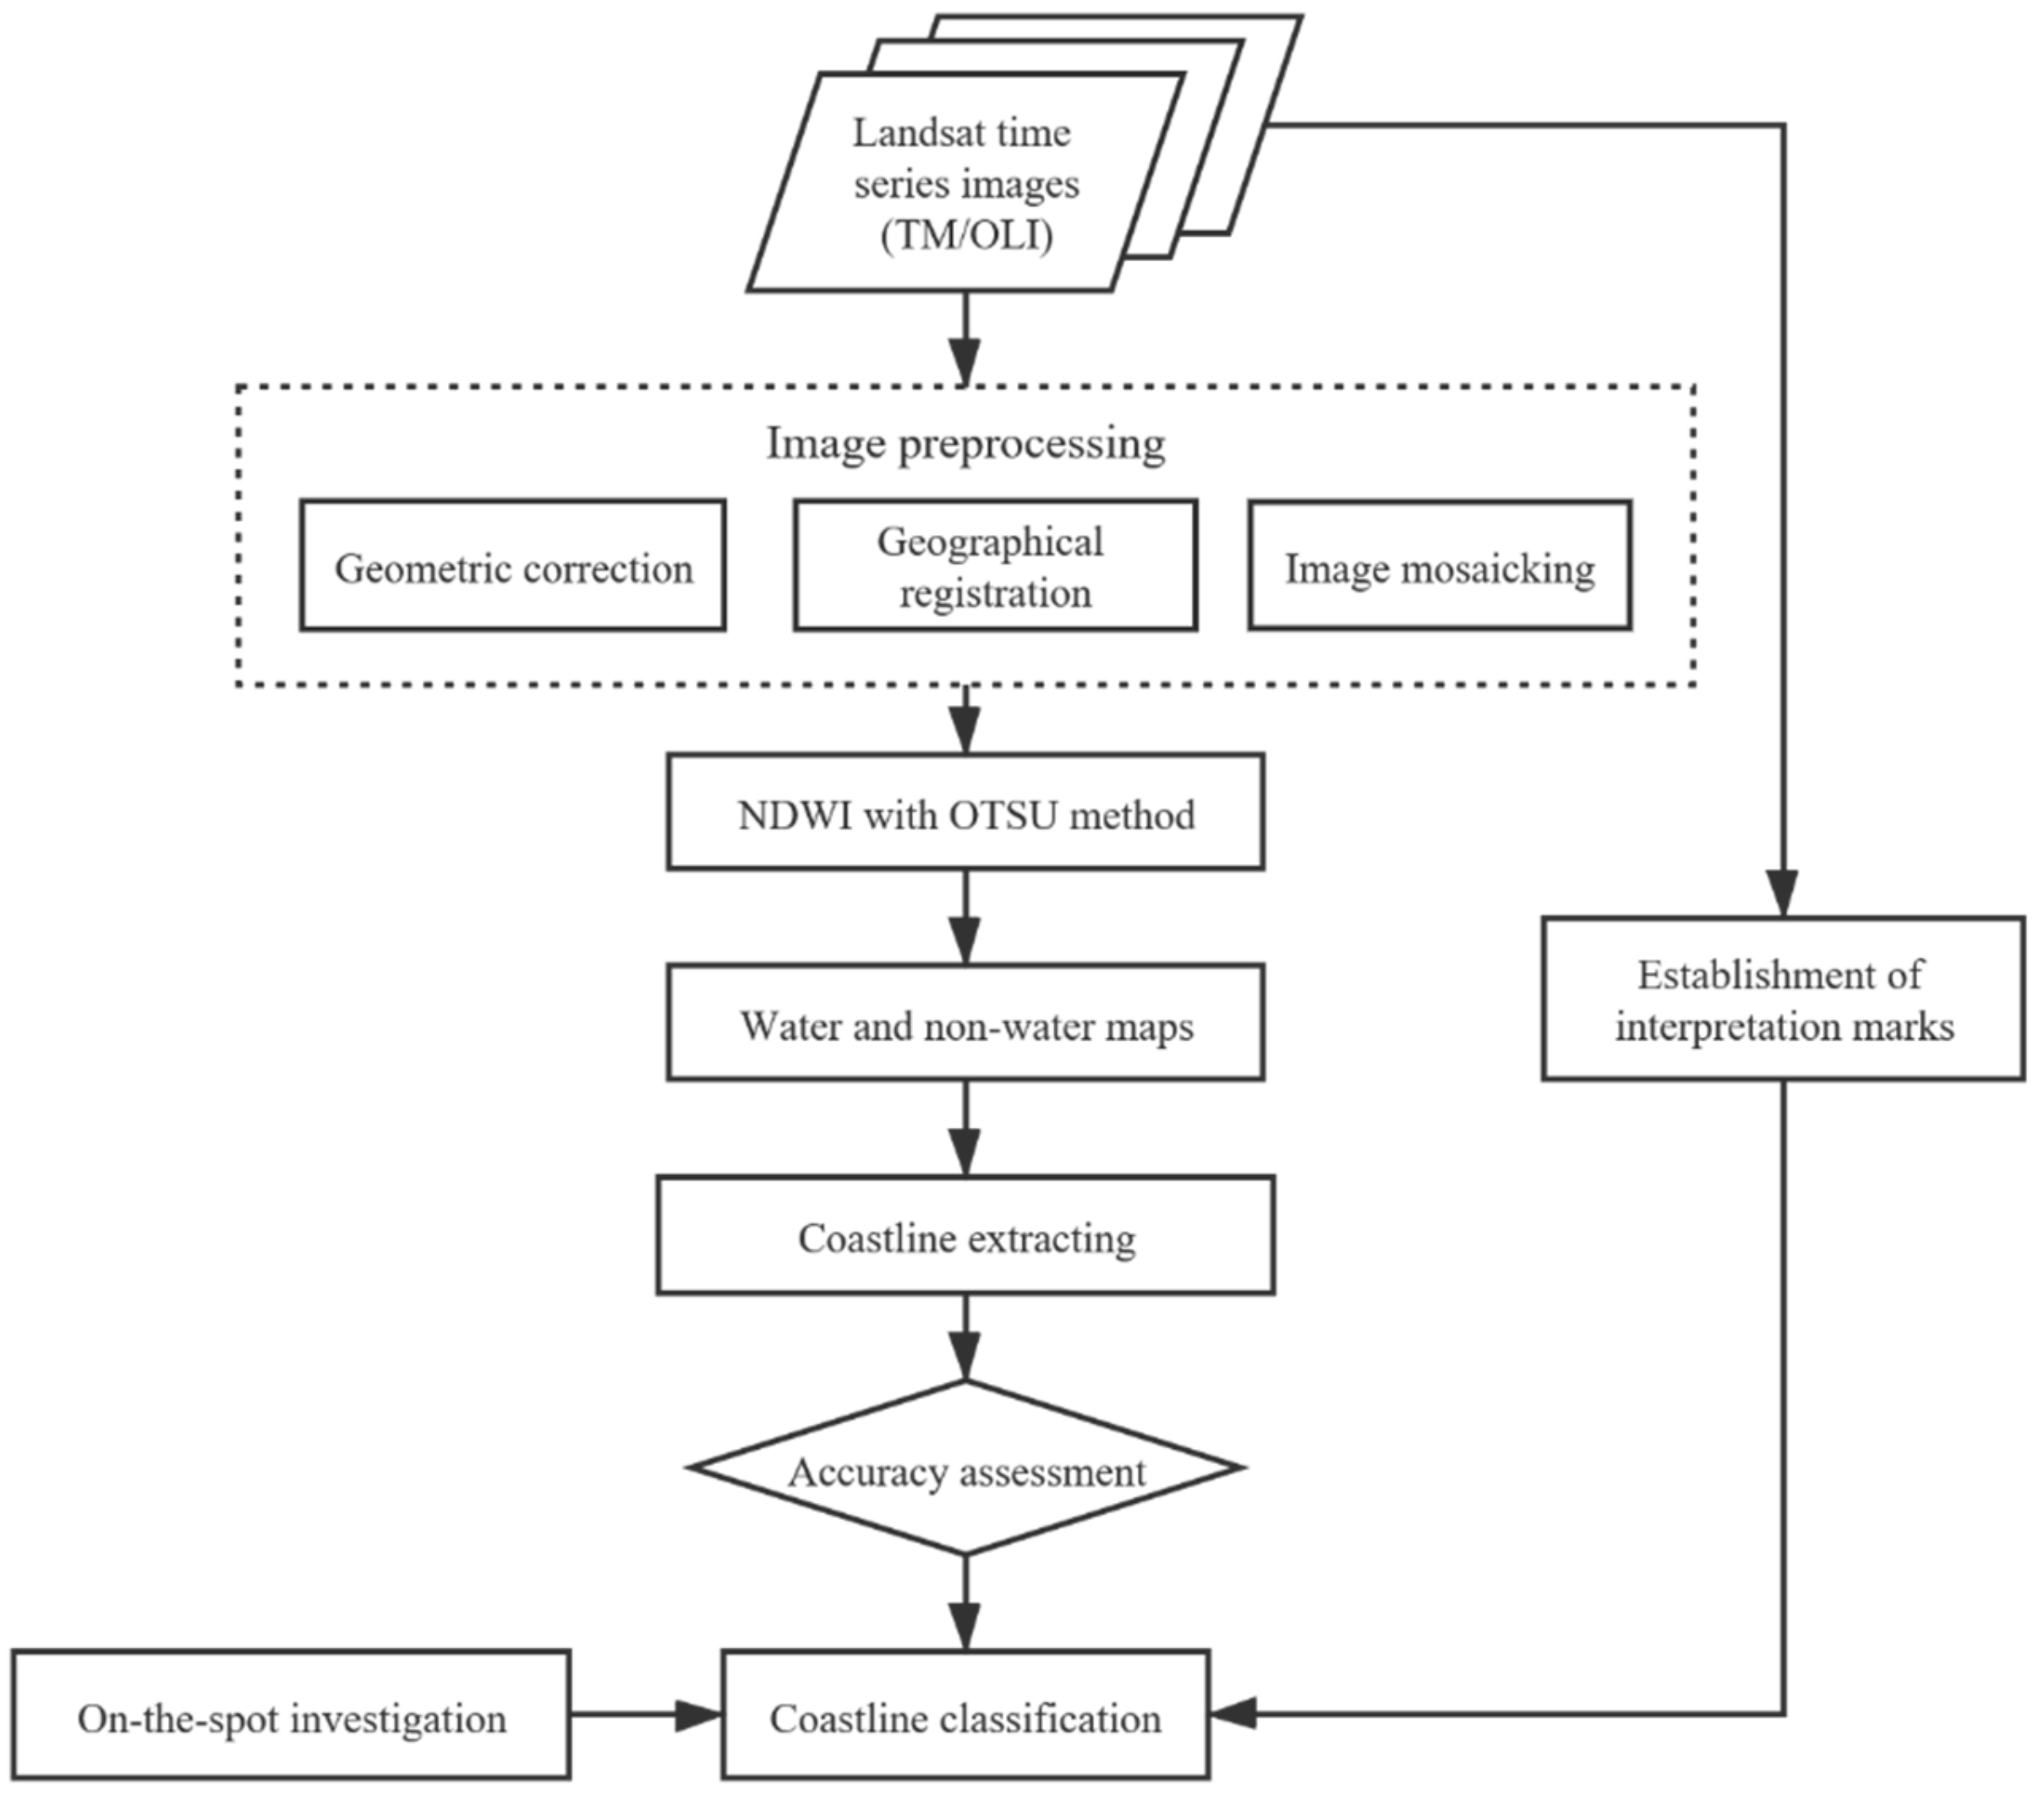
3. Method
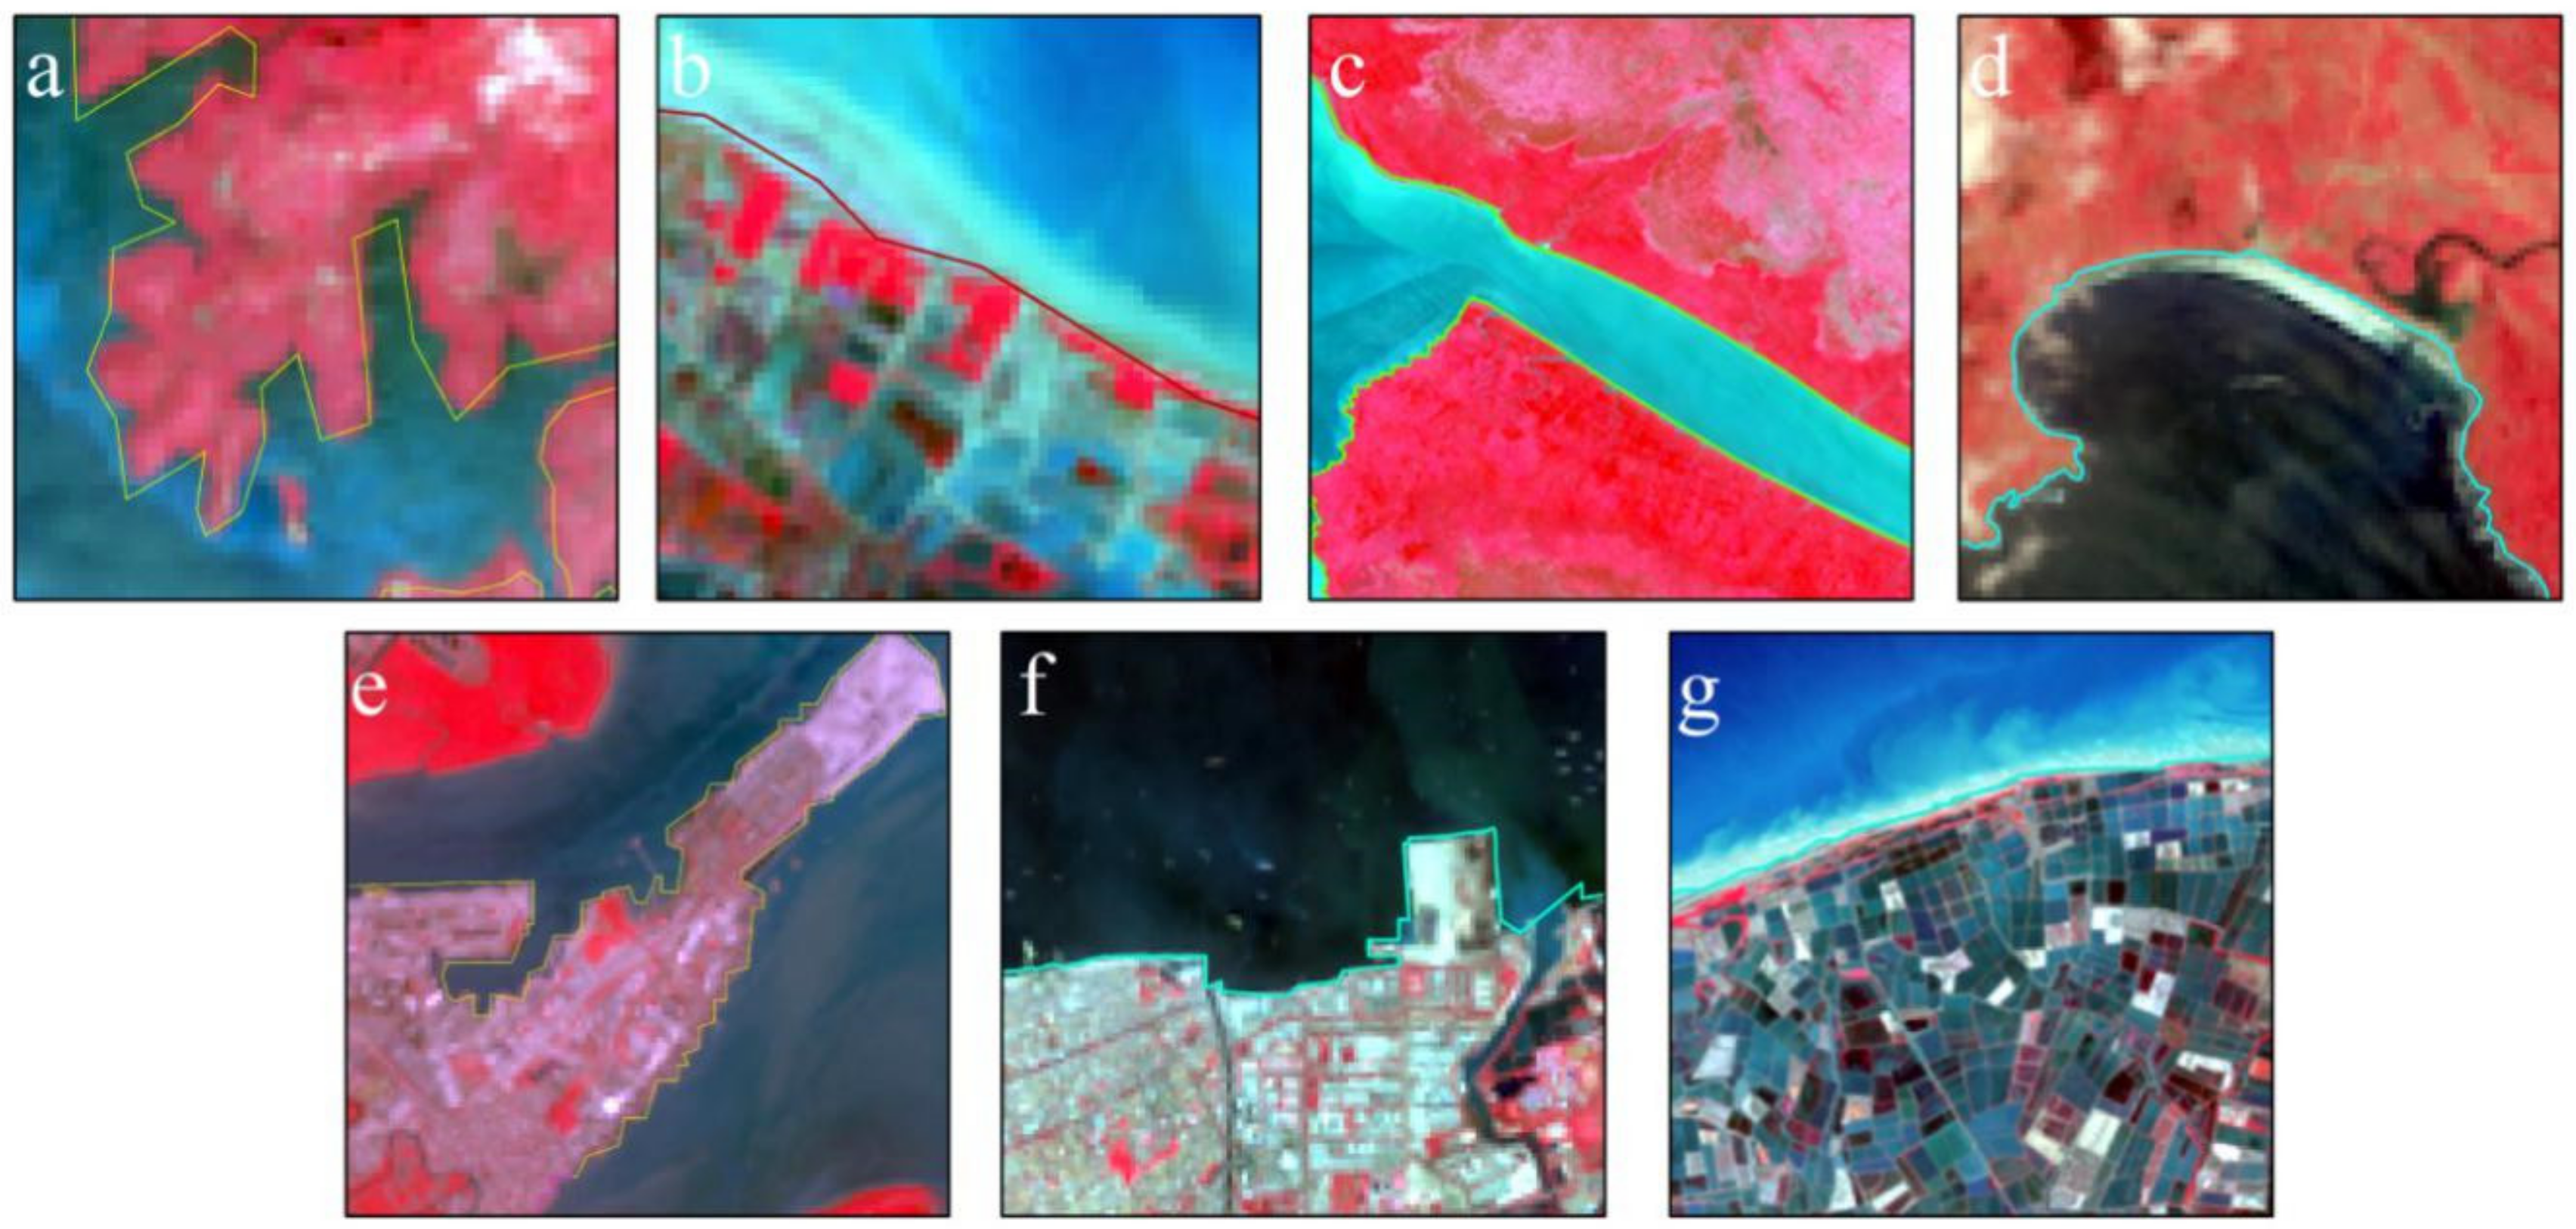
3.1. Extraction and Classification of Coastline
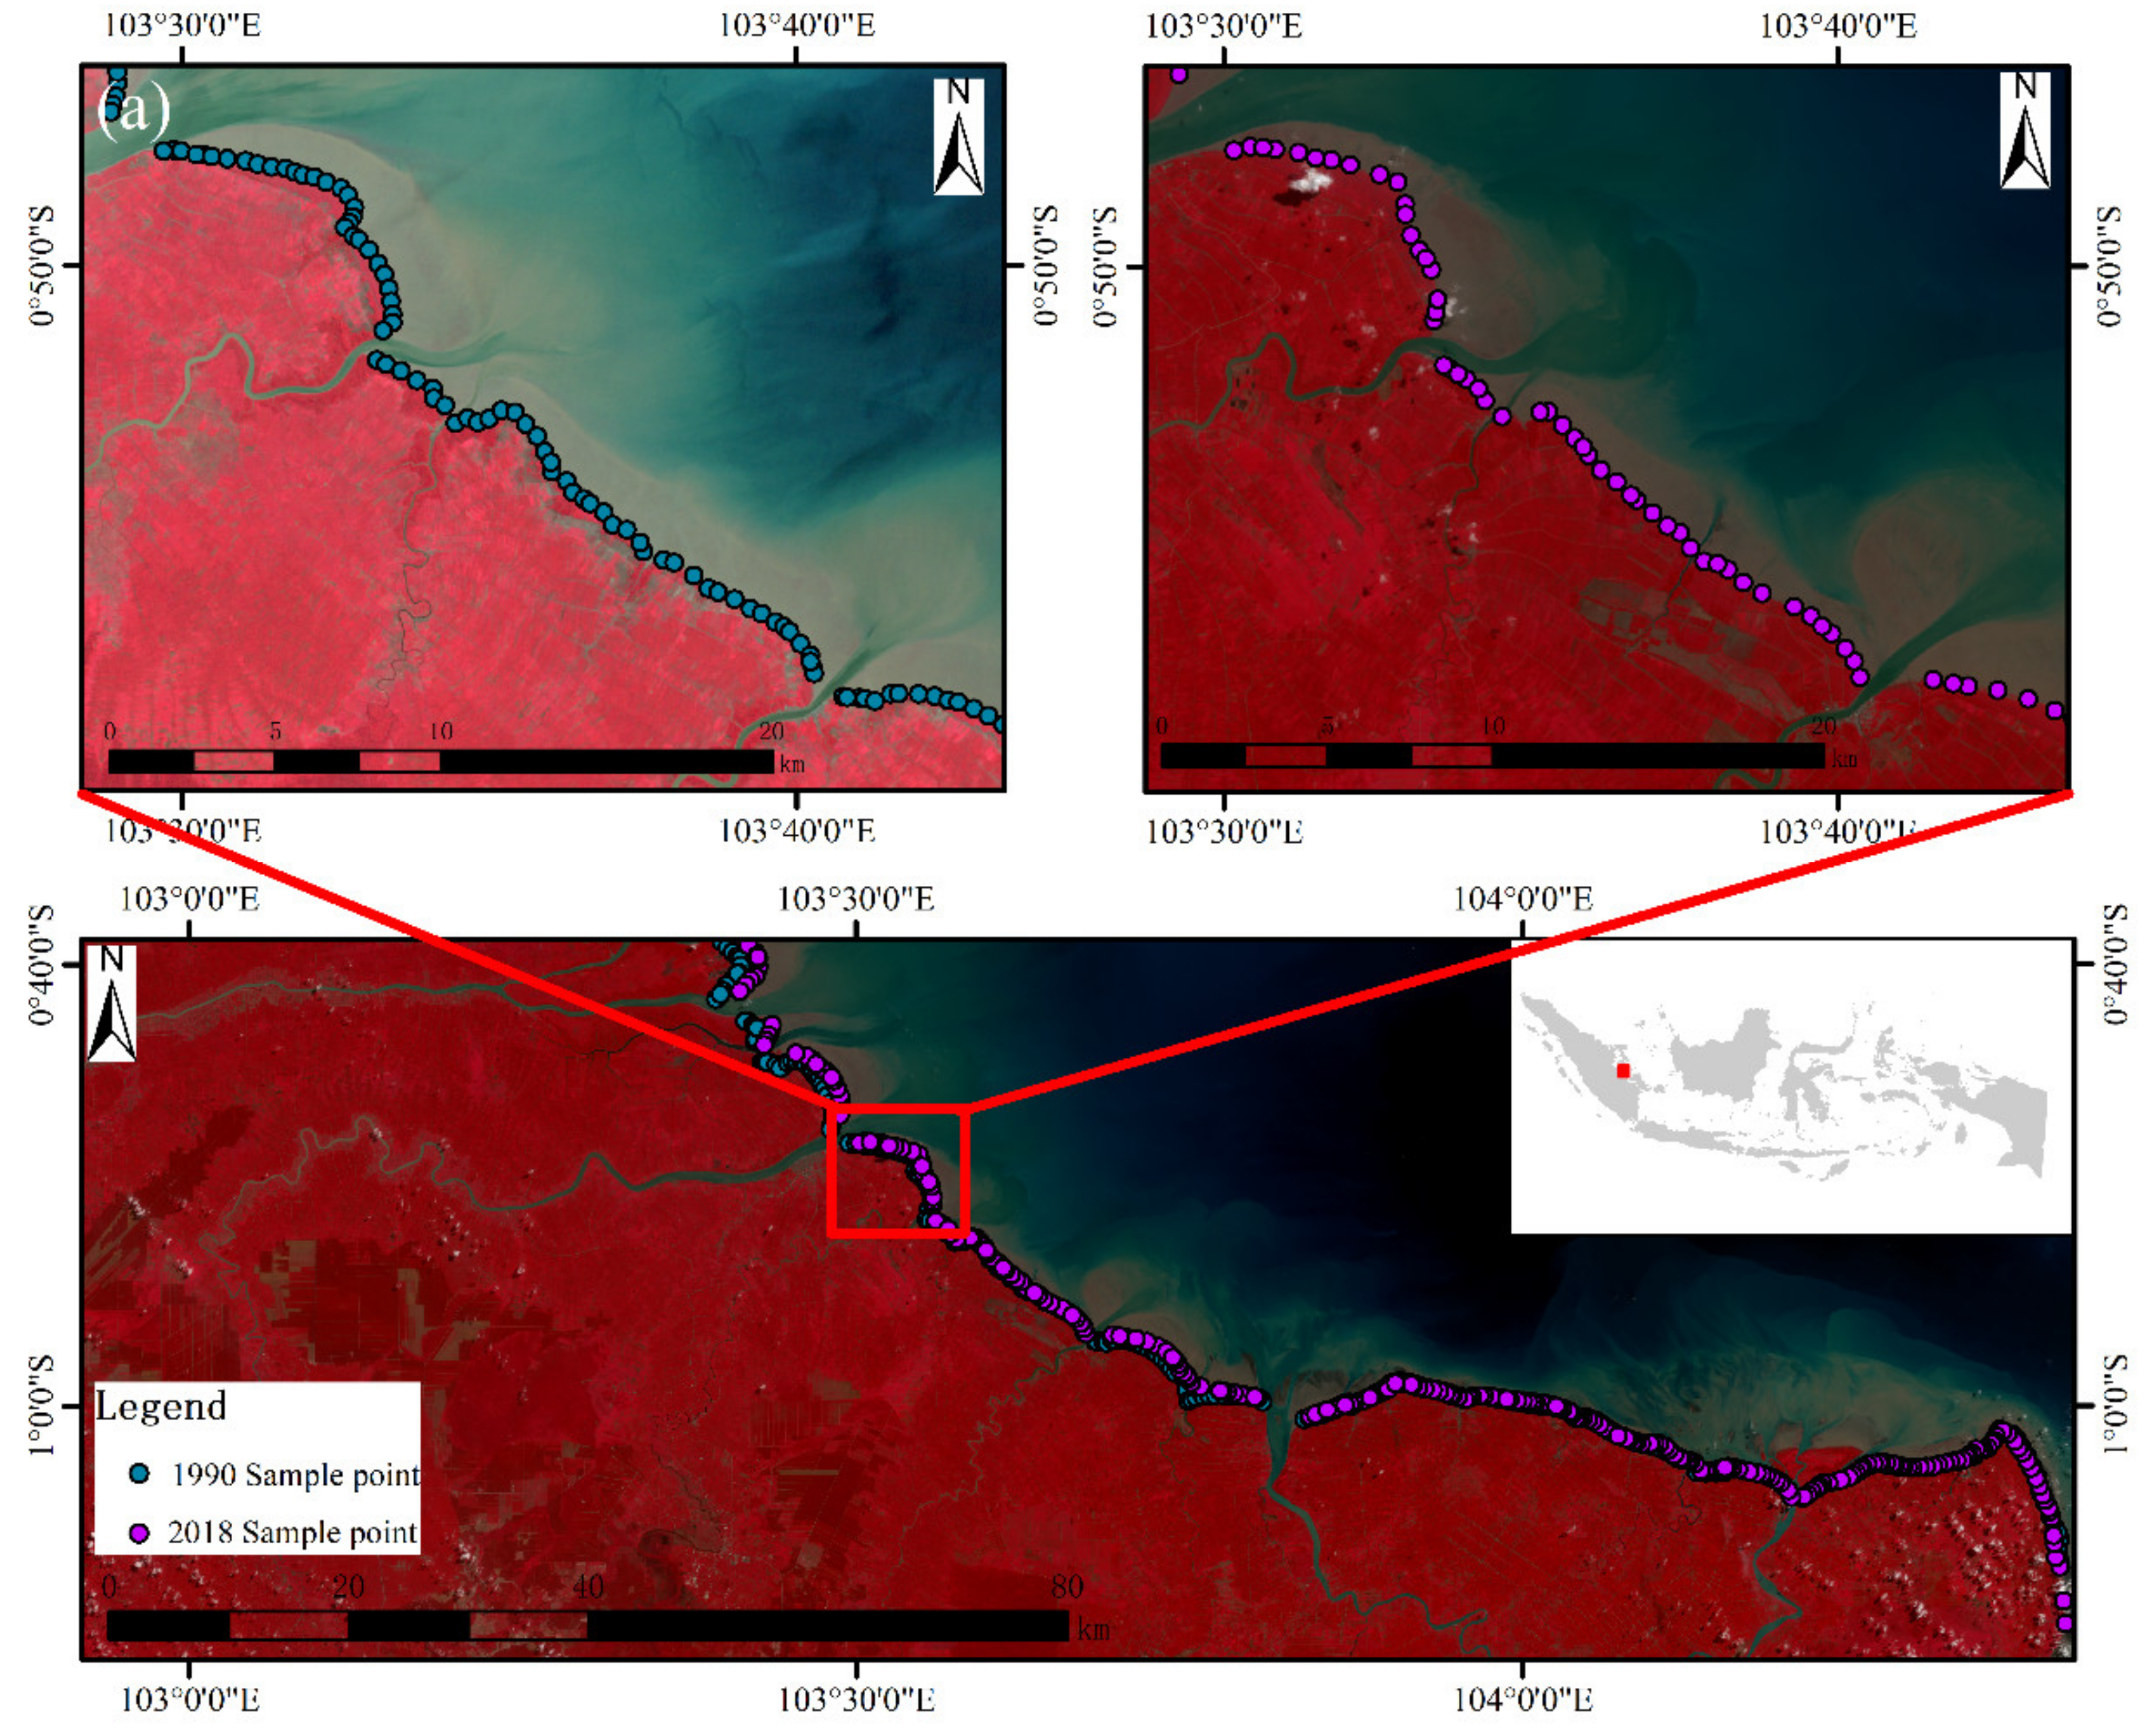
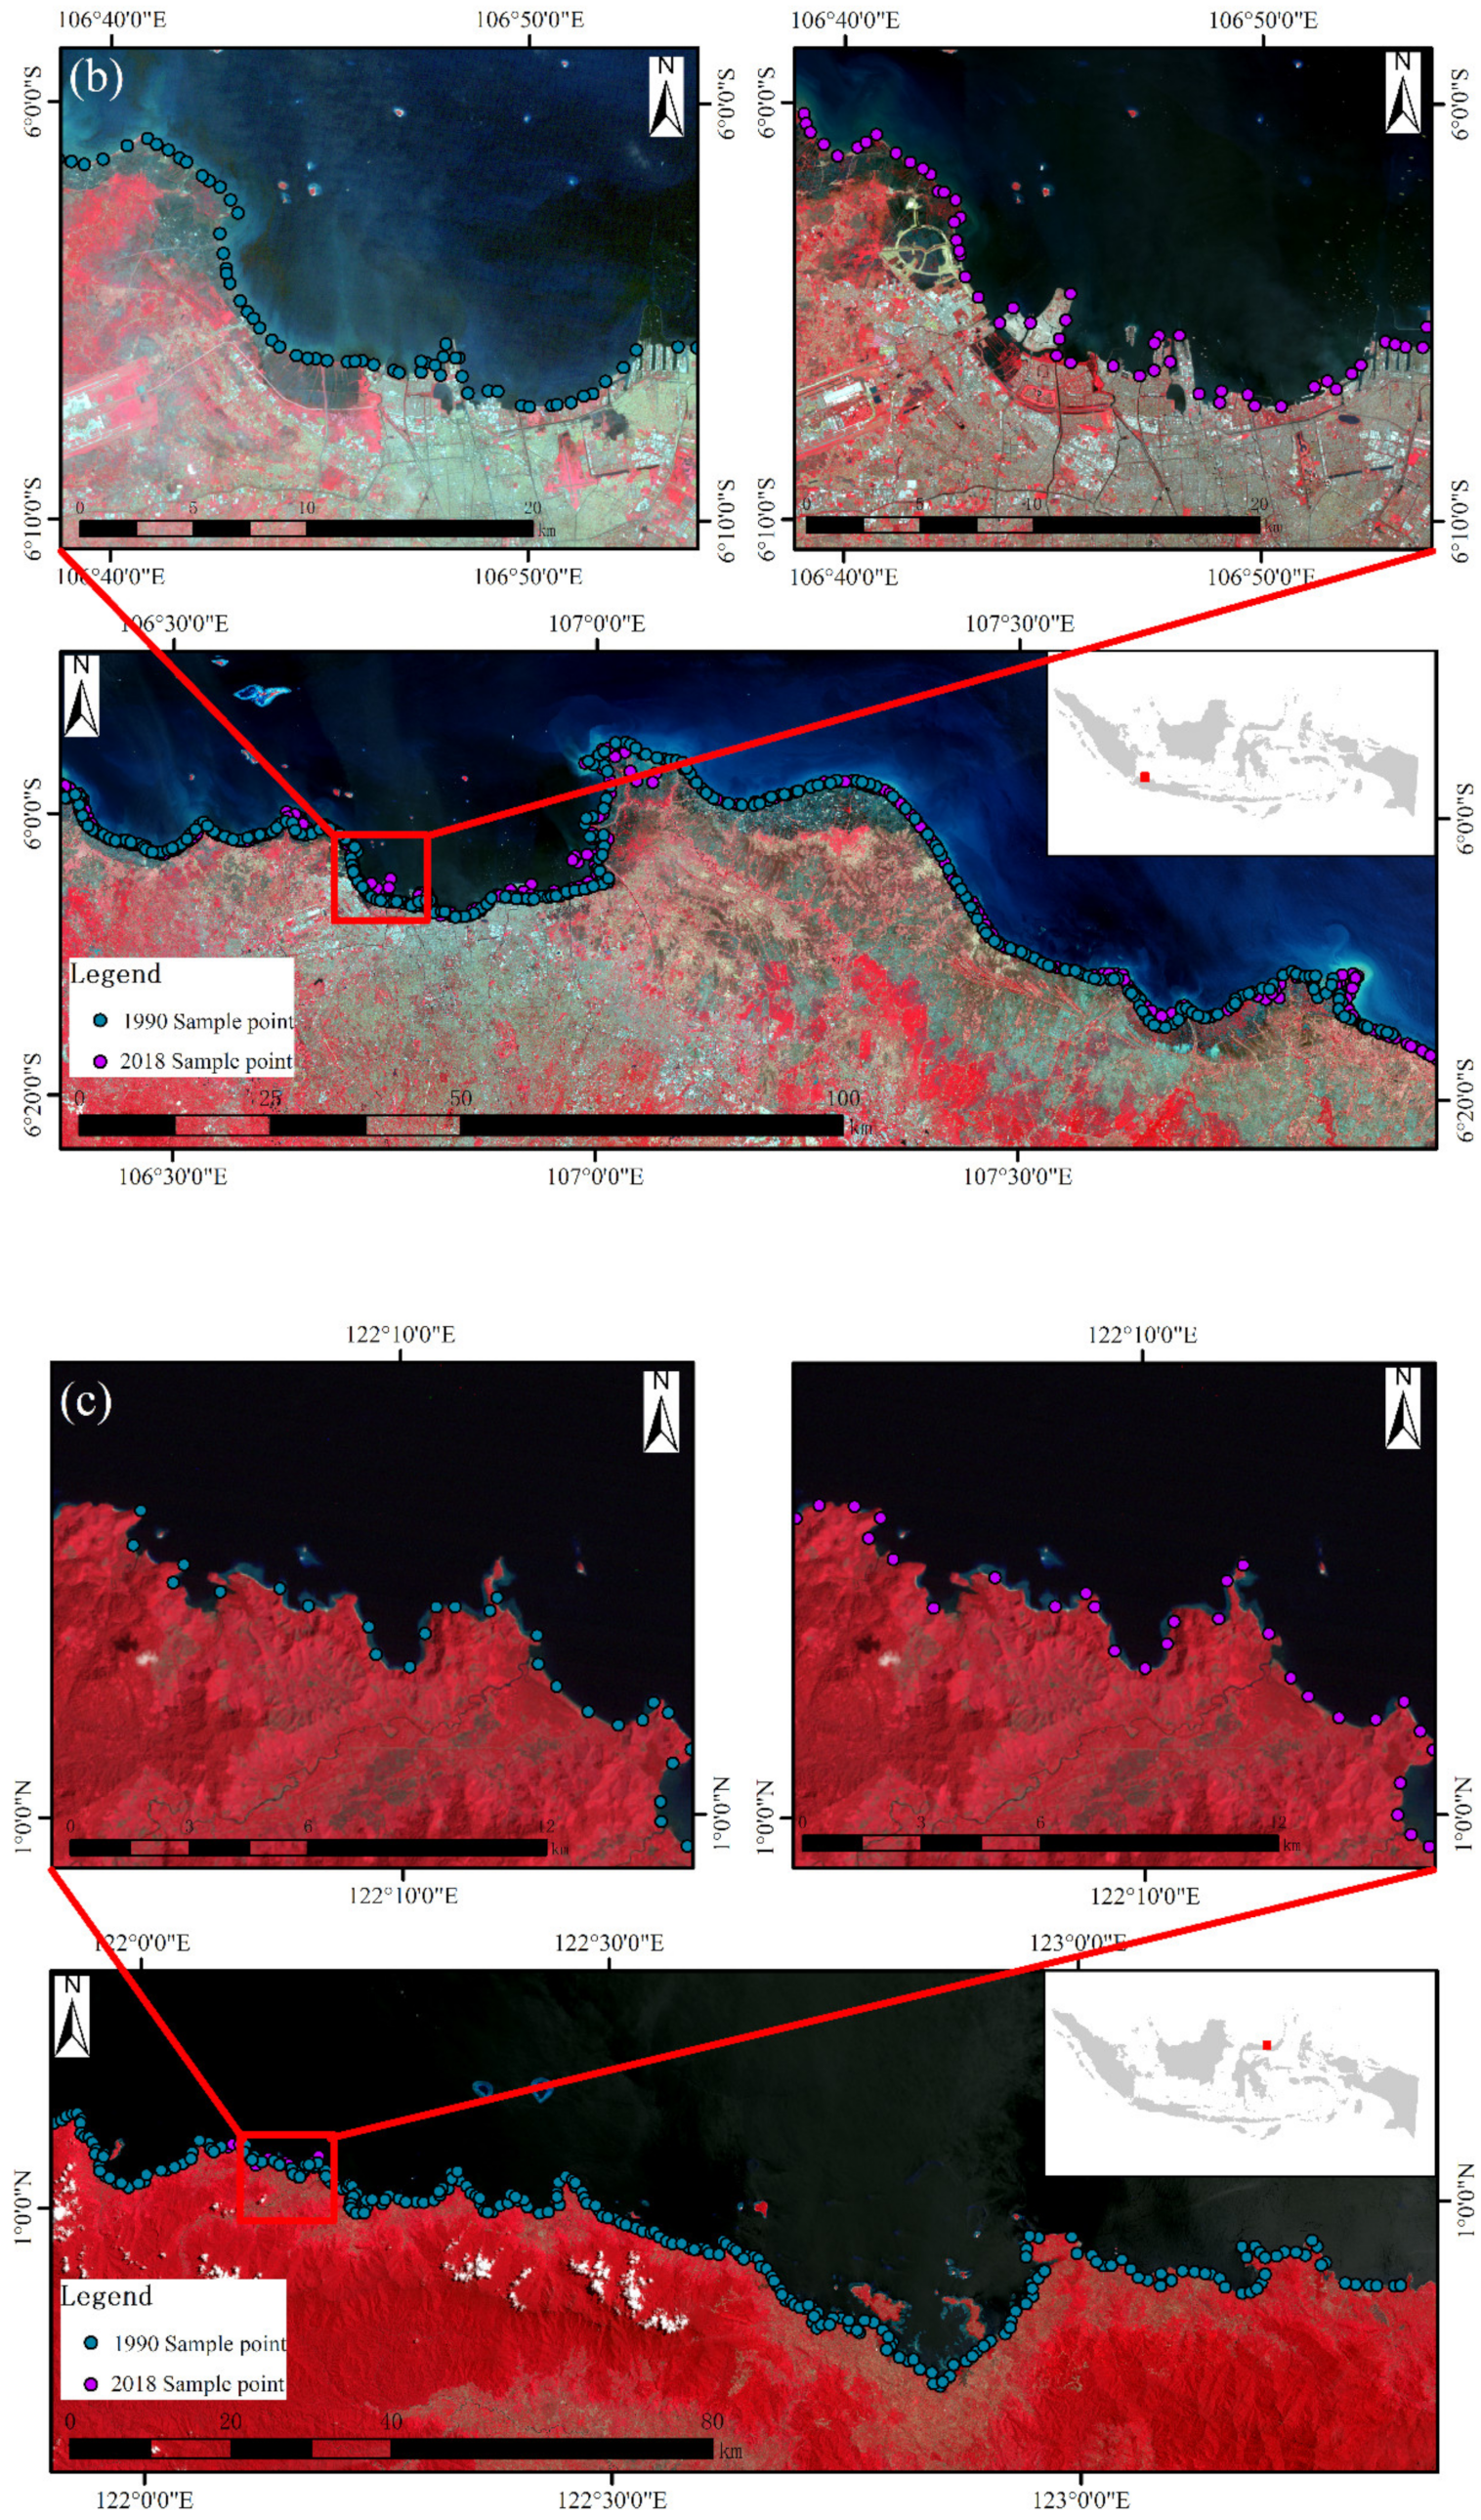
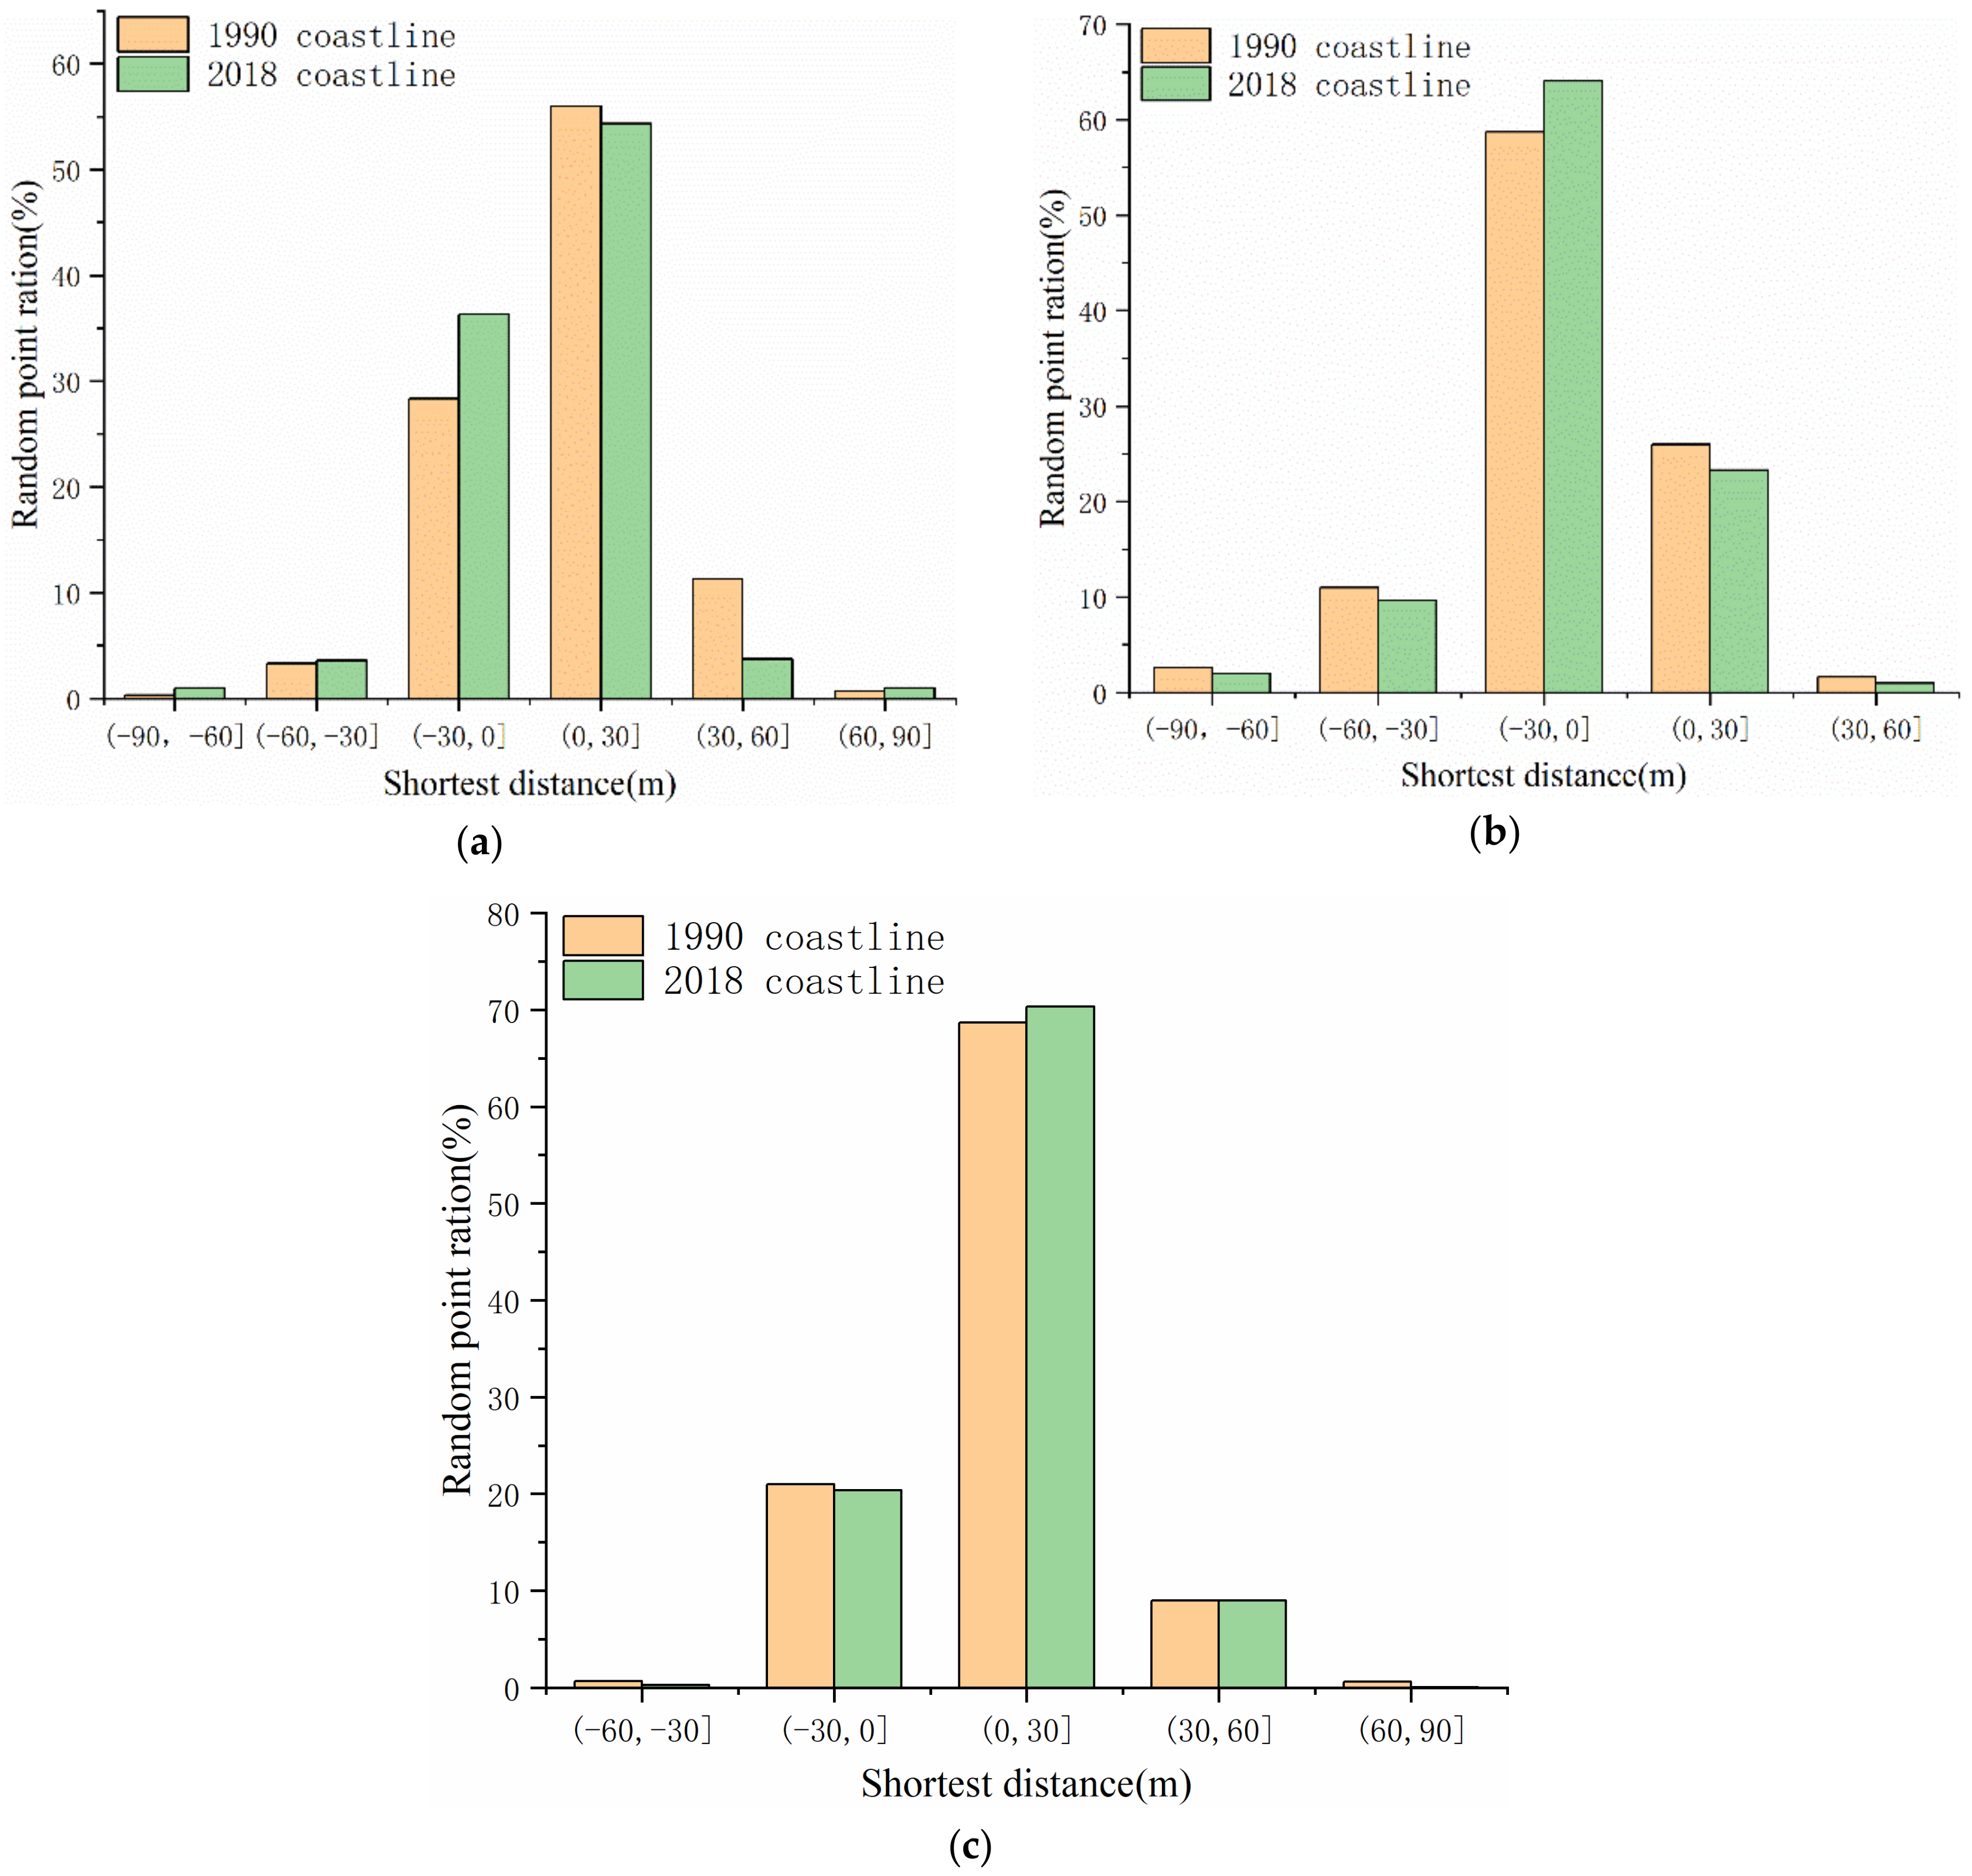
3.2. Coastline Accuracy Evaluation
3.3. Space-Time Analysis Method for Coastlines
3.3.1. Index of Coastline Utilization Degree
3.3.2. Changes in Land and Sea Patterns
3.3.3. ICUD Analysis at Different Scales
4. Results
4.1. Spatial Distribution Characteristics of Coastlines and ICUD
4.2. Temporal and Spatial Dynamics of ICUD on the Island Scale
4.3. Temporal and Spatial Dynamics of ICUD Degree at the Provincial Scale
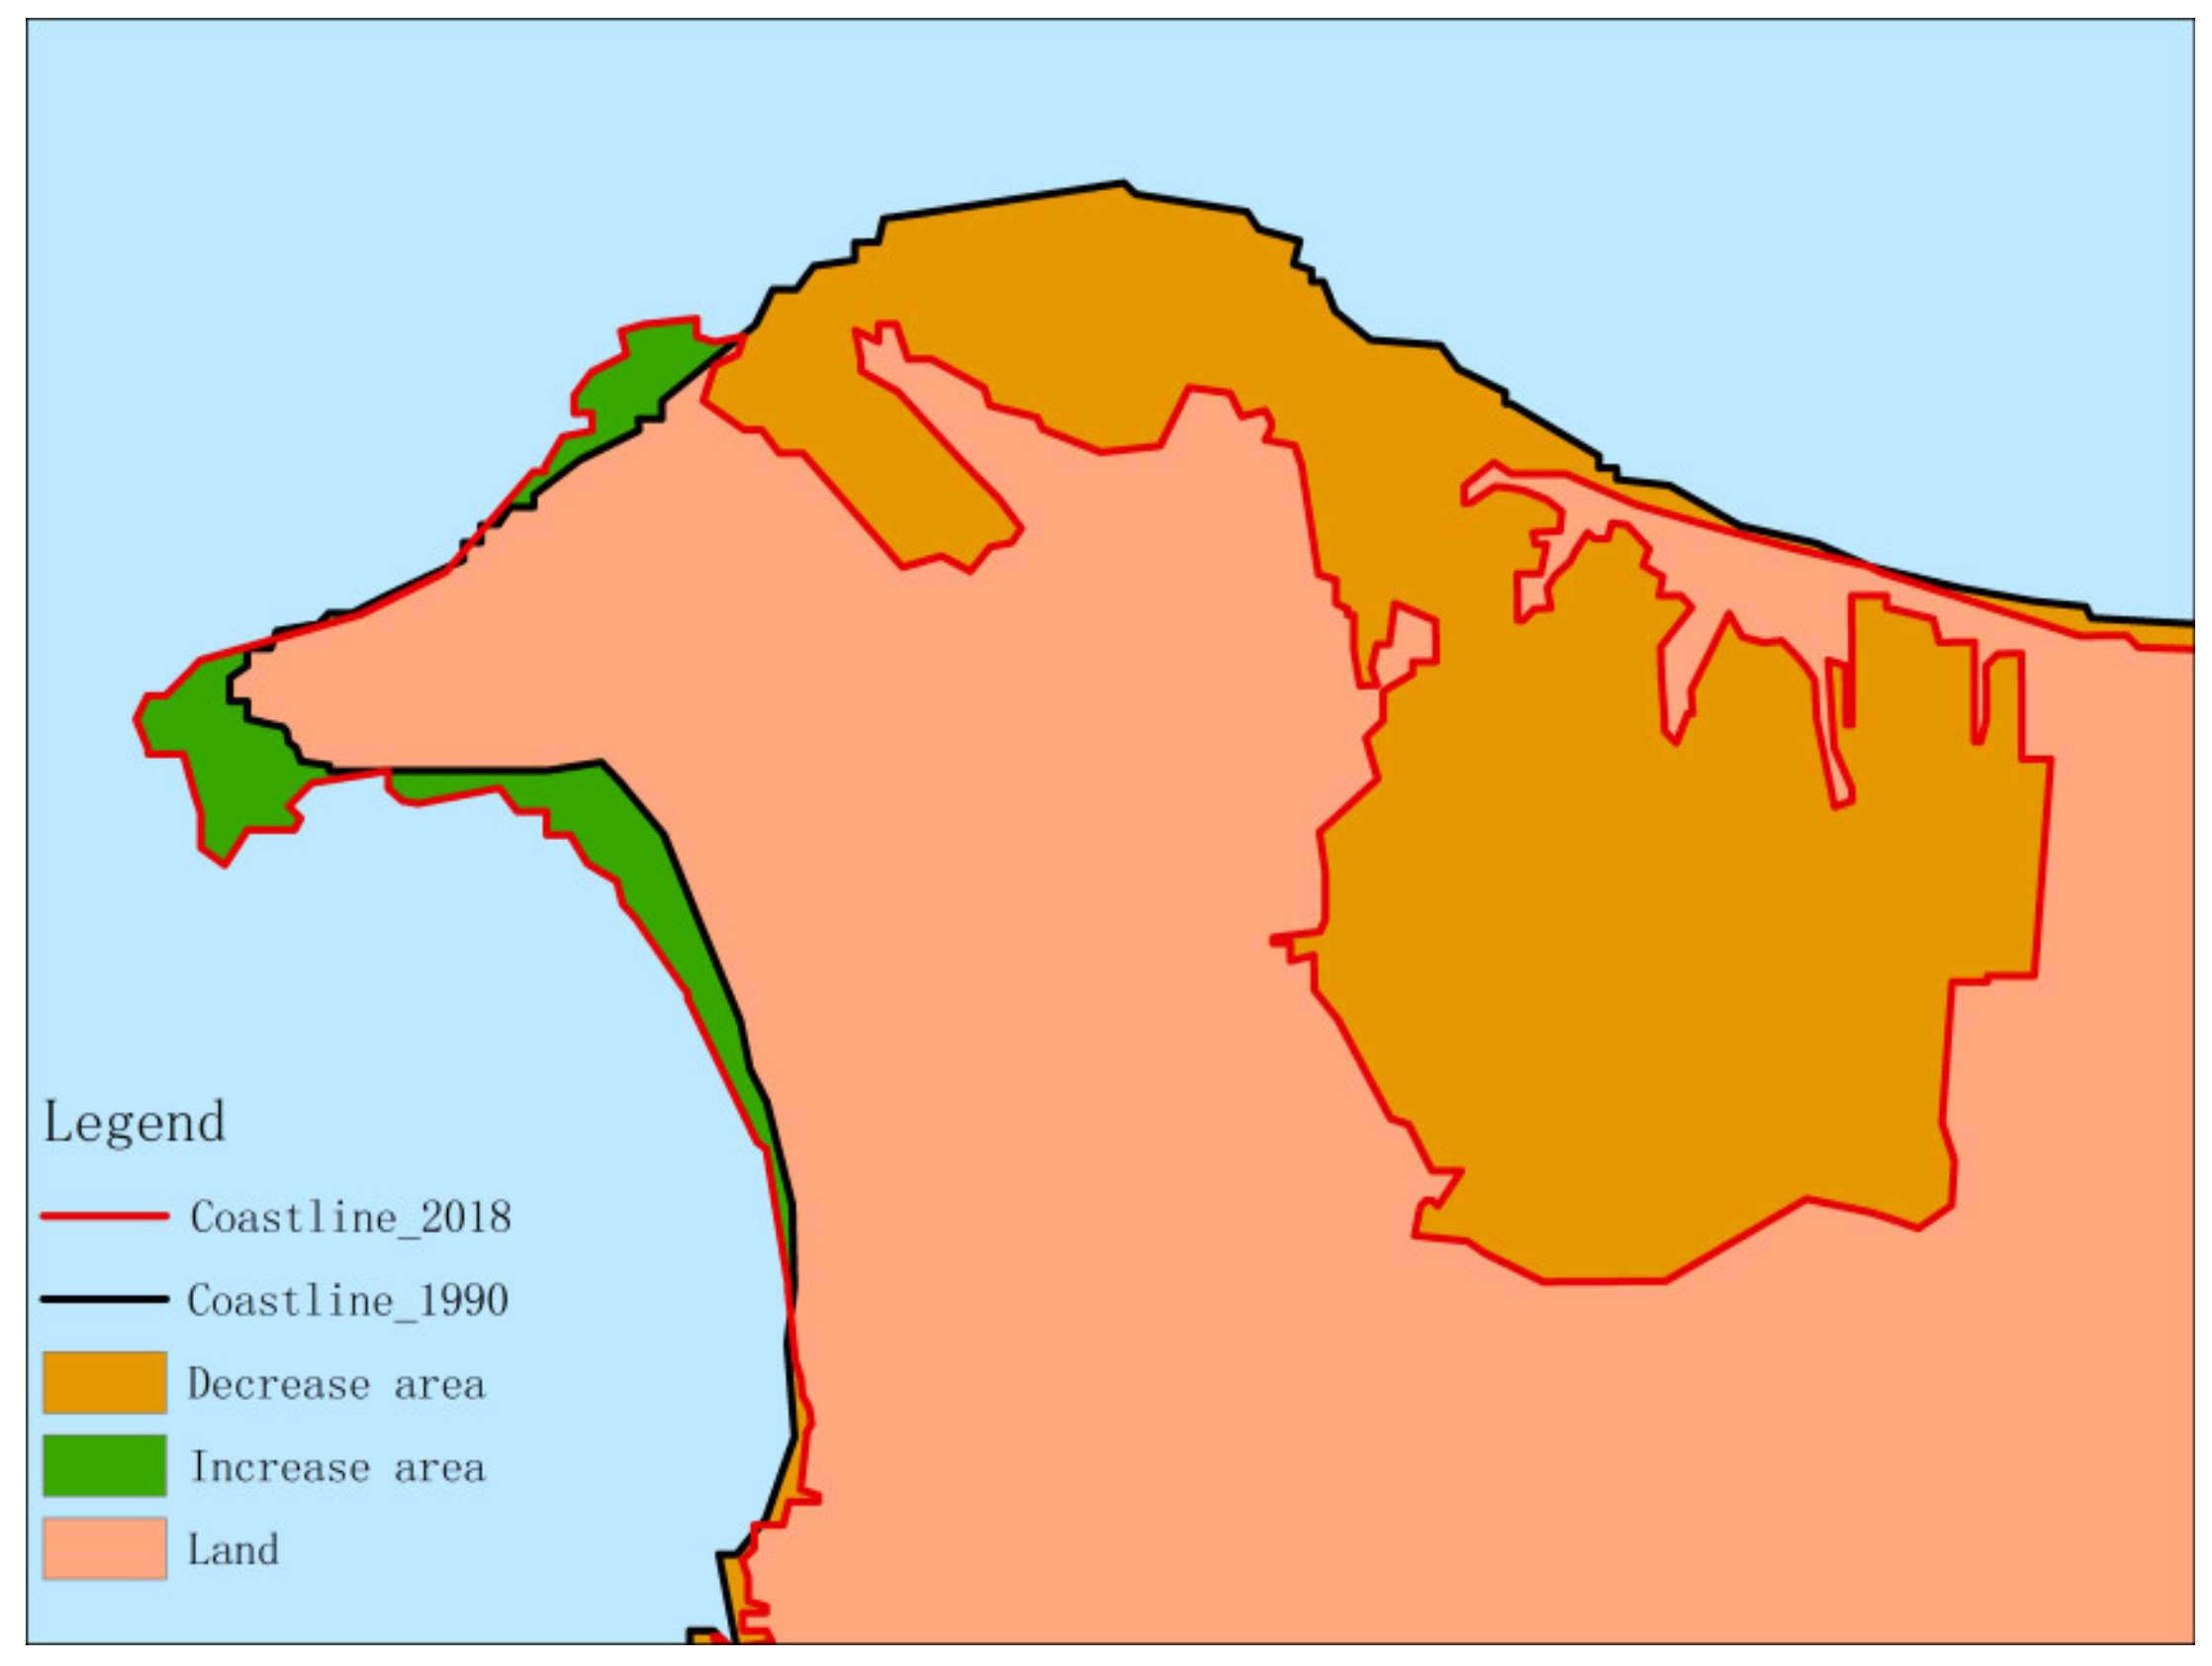
4.4. Spatiotemporal Changes in the Land–Sea Pattern
5. Discussion
5.1. Natural Factors of Coastline Change
5.1.1. Impact of Climate Change on Coastline Changes
5.1.2. Geographical Environment’s Influence on Coastline Changes
5.2. Social Factors of Coastline Change
- (1)
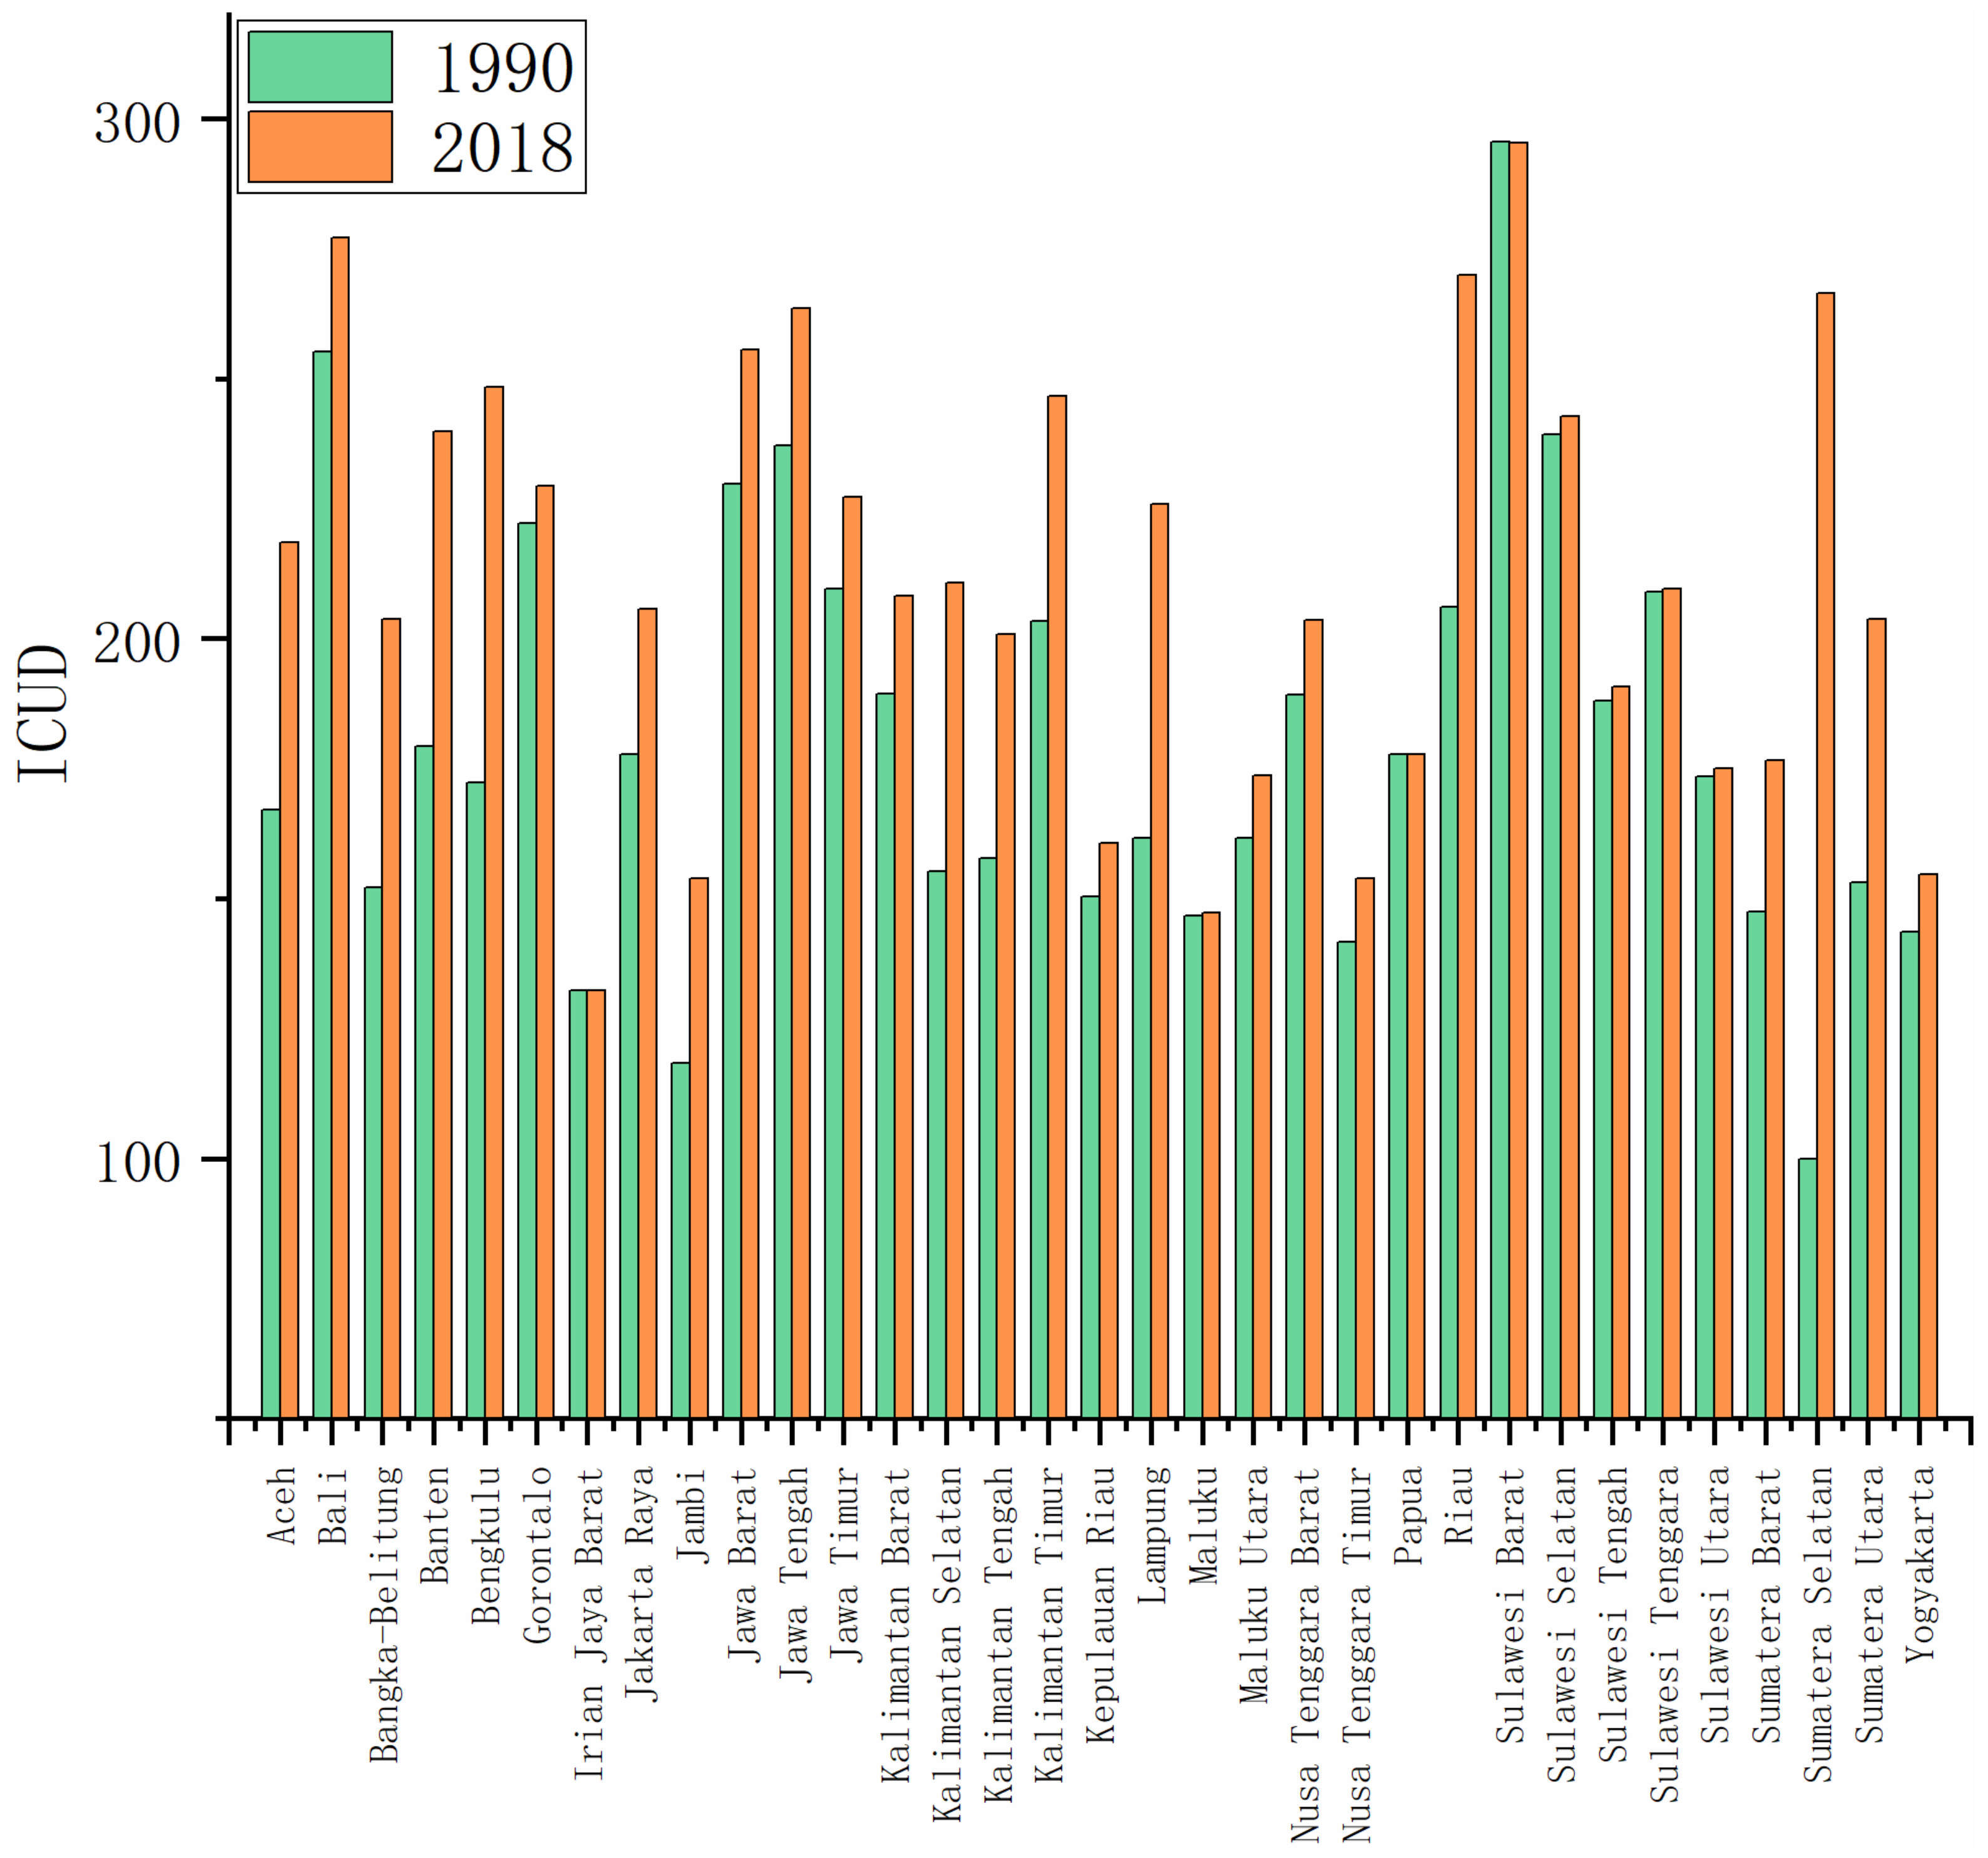
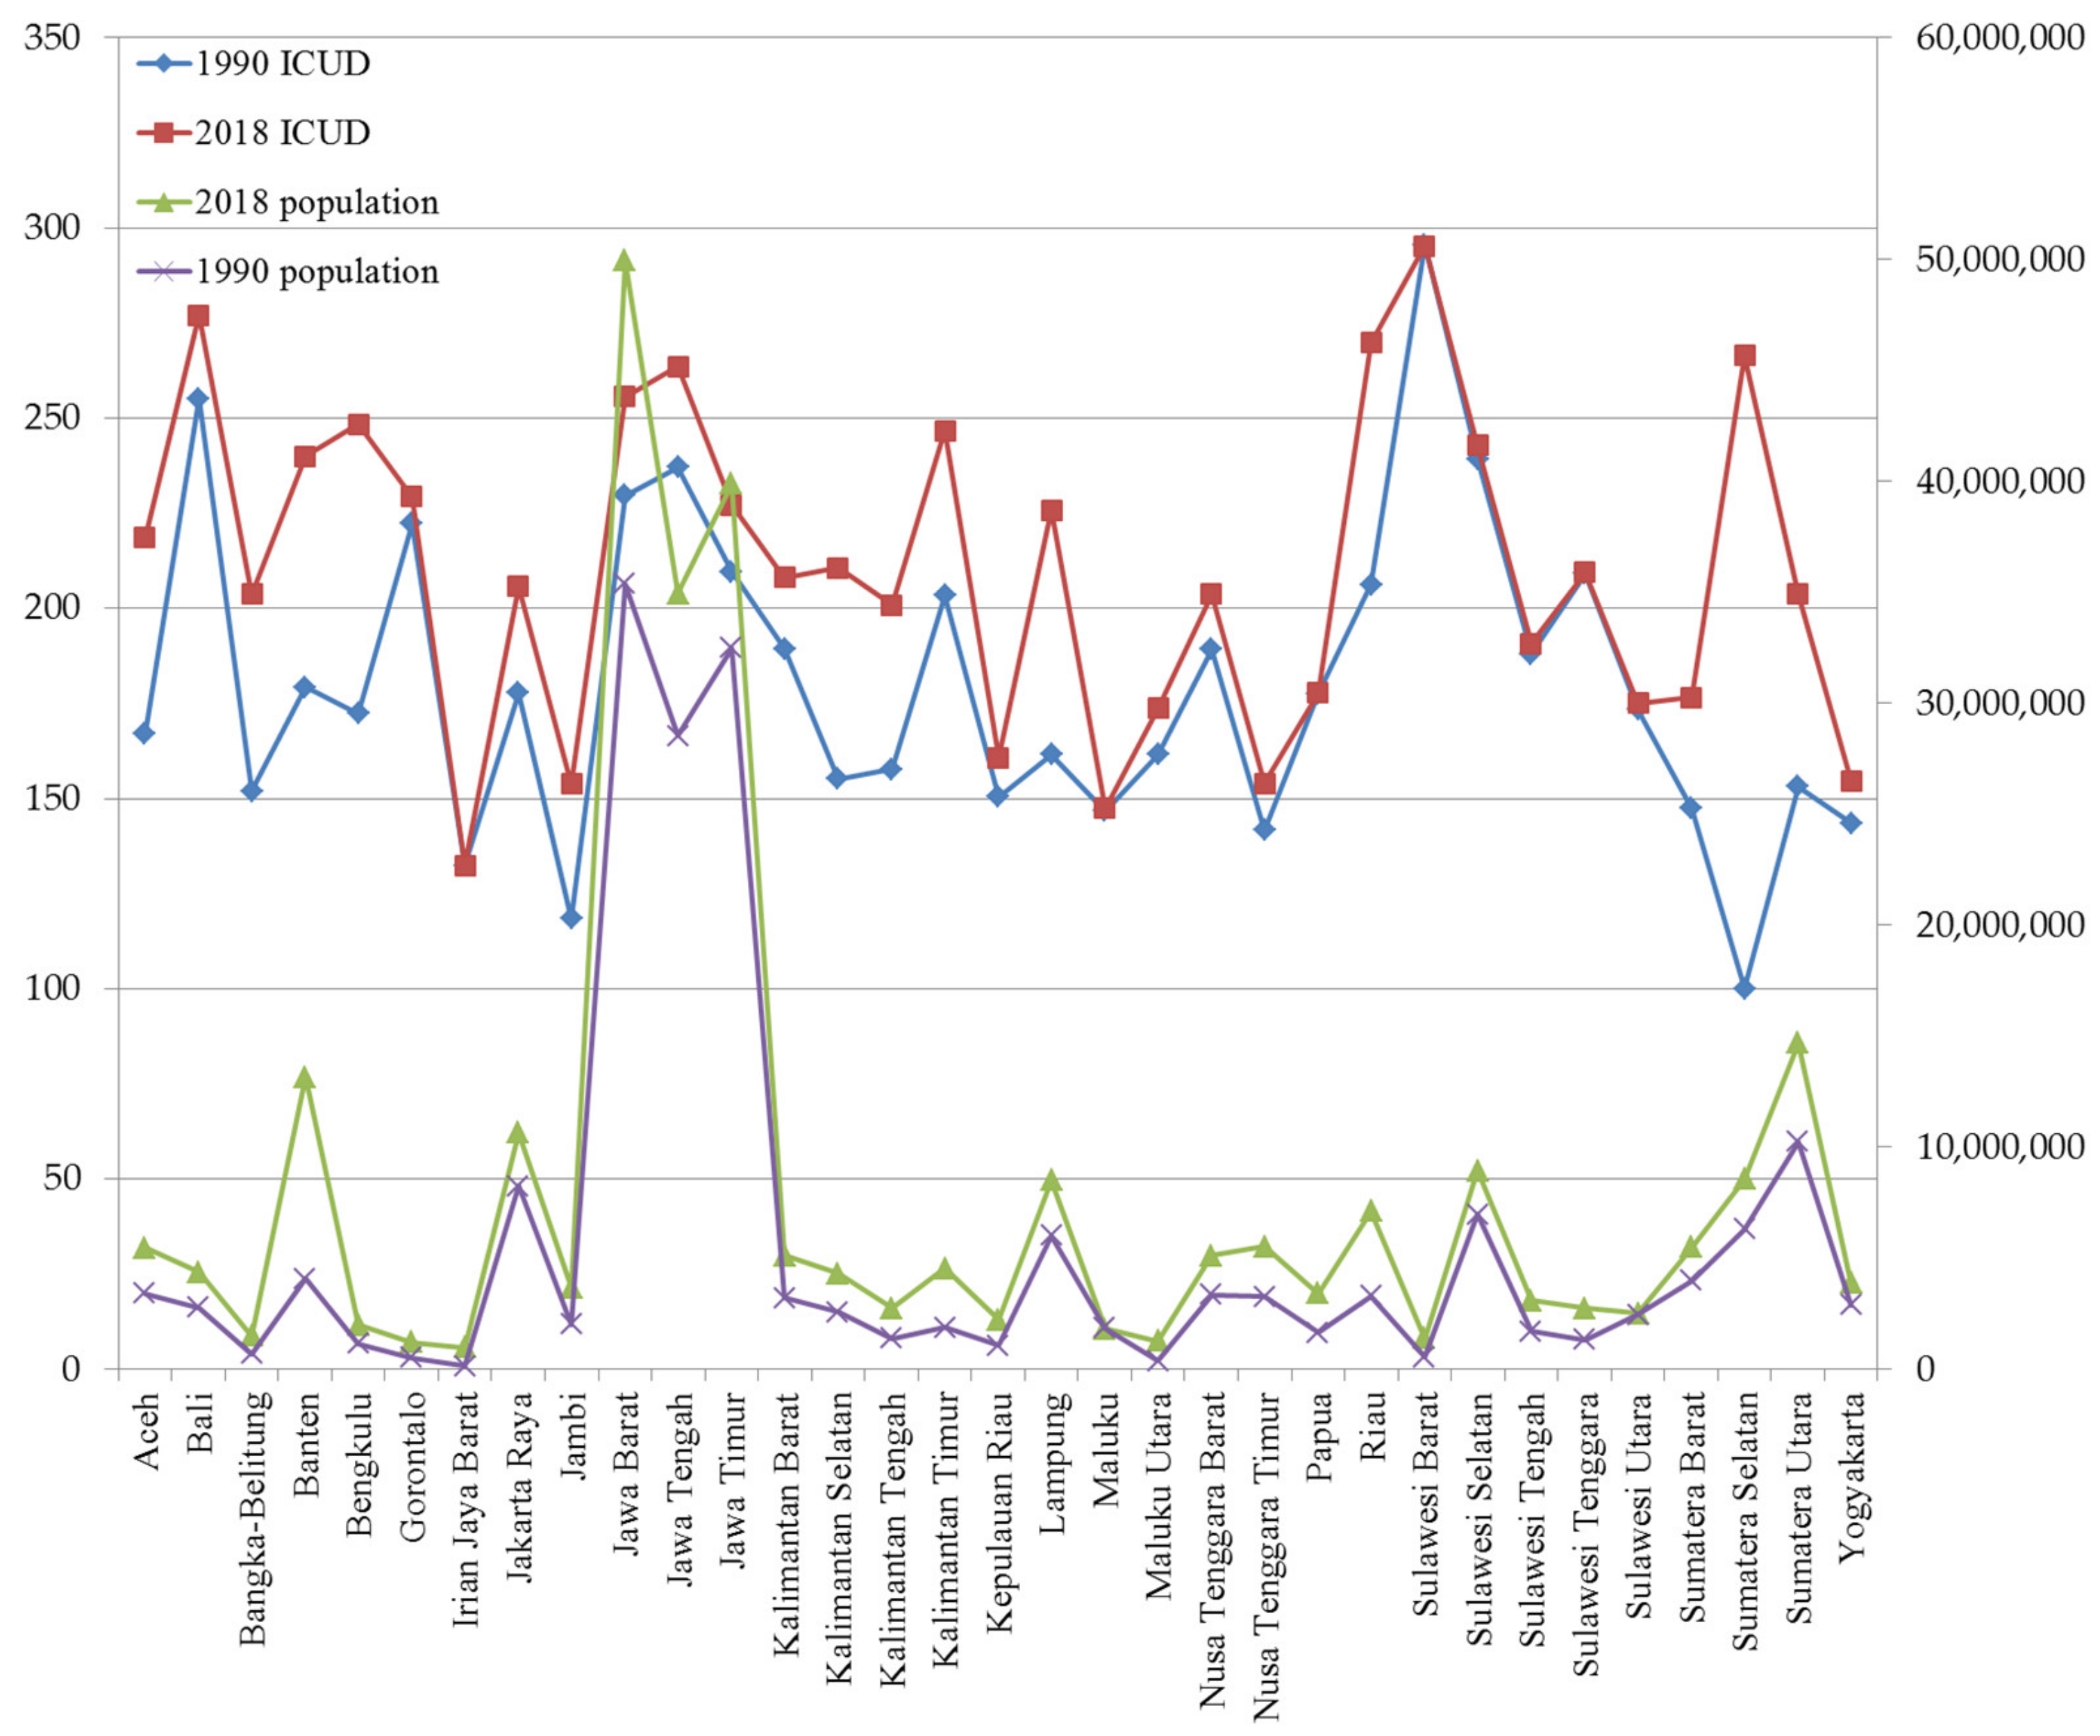
- Jawa Barat, Jawa Timur, and Jawa Tengah provinces were the top three provinces in Indonesia in terms of population distribution over the years, but the region’s coastline development and utilization were not the highest. For the third-ranked Jawa Tengah, the coastline ICUD was higher than the top two of Jawa Barat and Jawa Timur provinces. The population of Sulawesi Barat province in 2018 was only 1,405,000, but the coastline development and utilization index of 295.29 in the province was the highest over the years. The second was Bali province, with a population of 4,380,800 and a coastline development and utilization index of 277.08 in 2018. The above phenomenon indicated that the provinces with the largest populations did not have high ICUD, while the relatively small populations of the Sulawesi Barat and Bali provinces had higher ICUD. This shows that the degree of ICUD in Indonesia is mainly related to the low-lying flat areas for human habitation along the coast. And the habitability of coastal geographical conditions is more important than the number of populations in determining the ICUD of the coastline.
- (2)
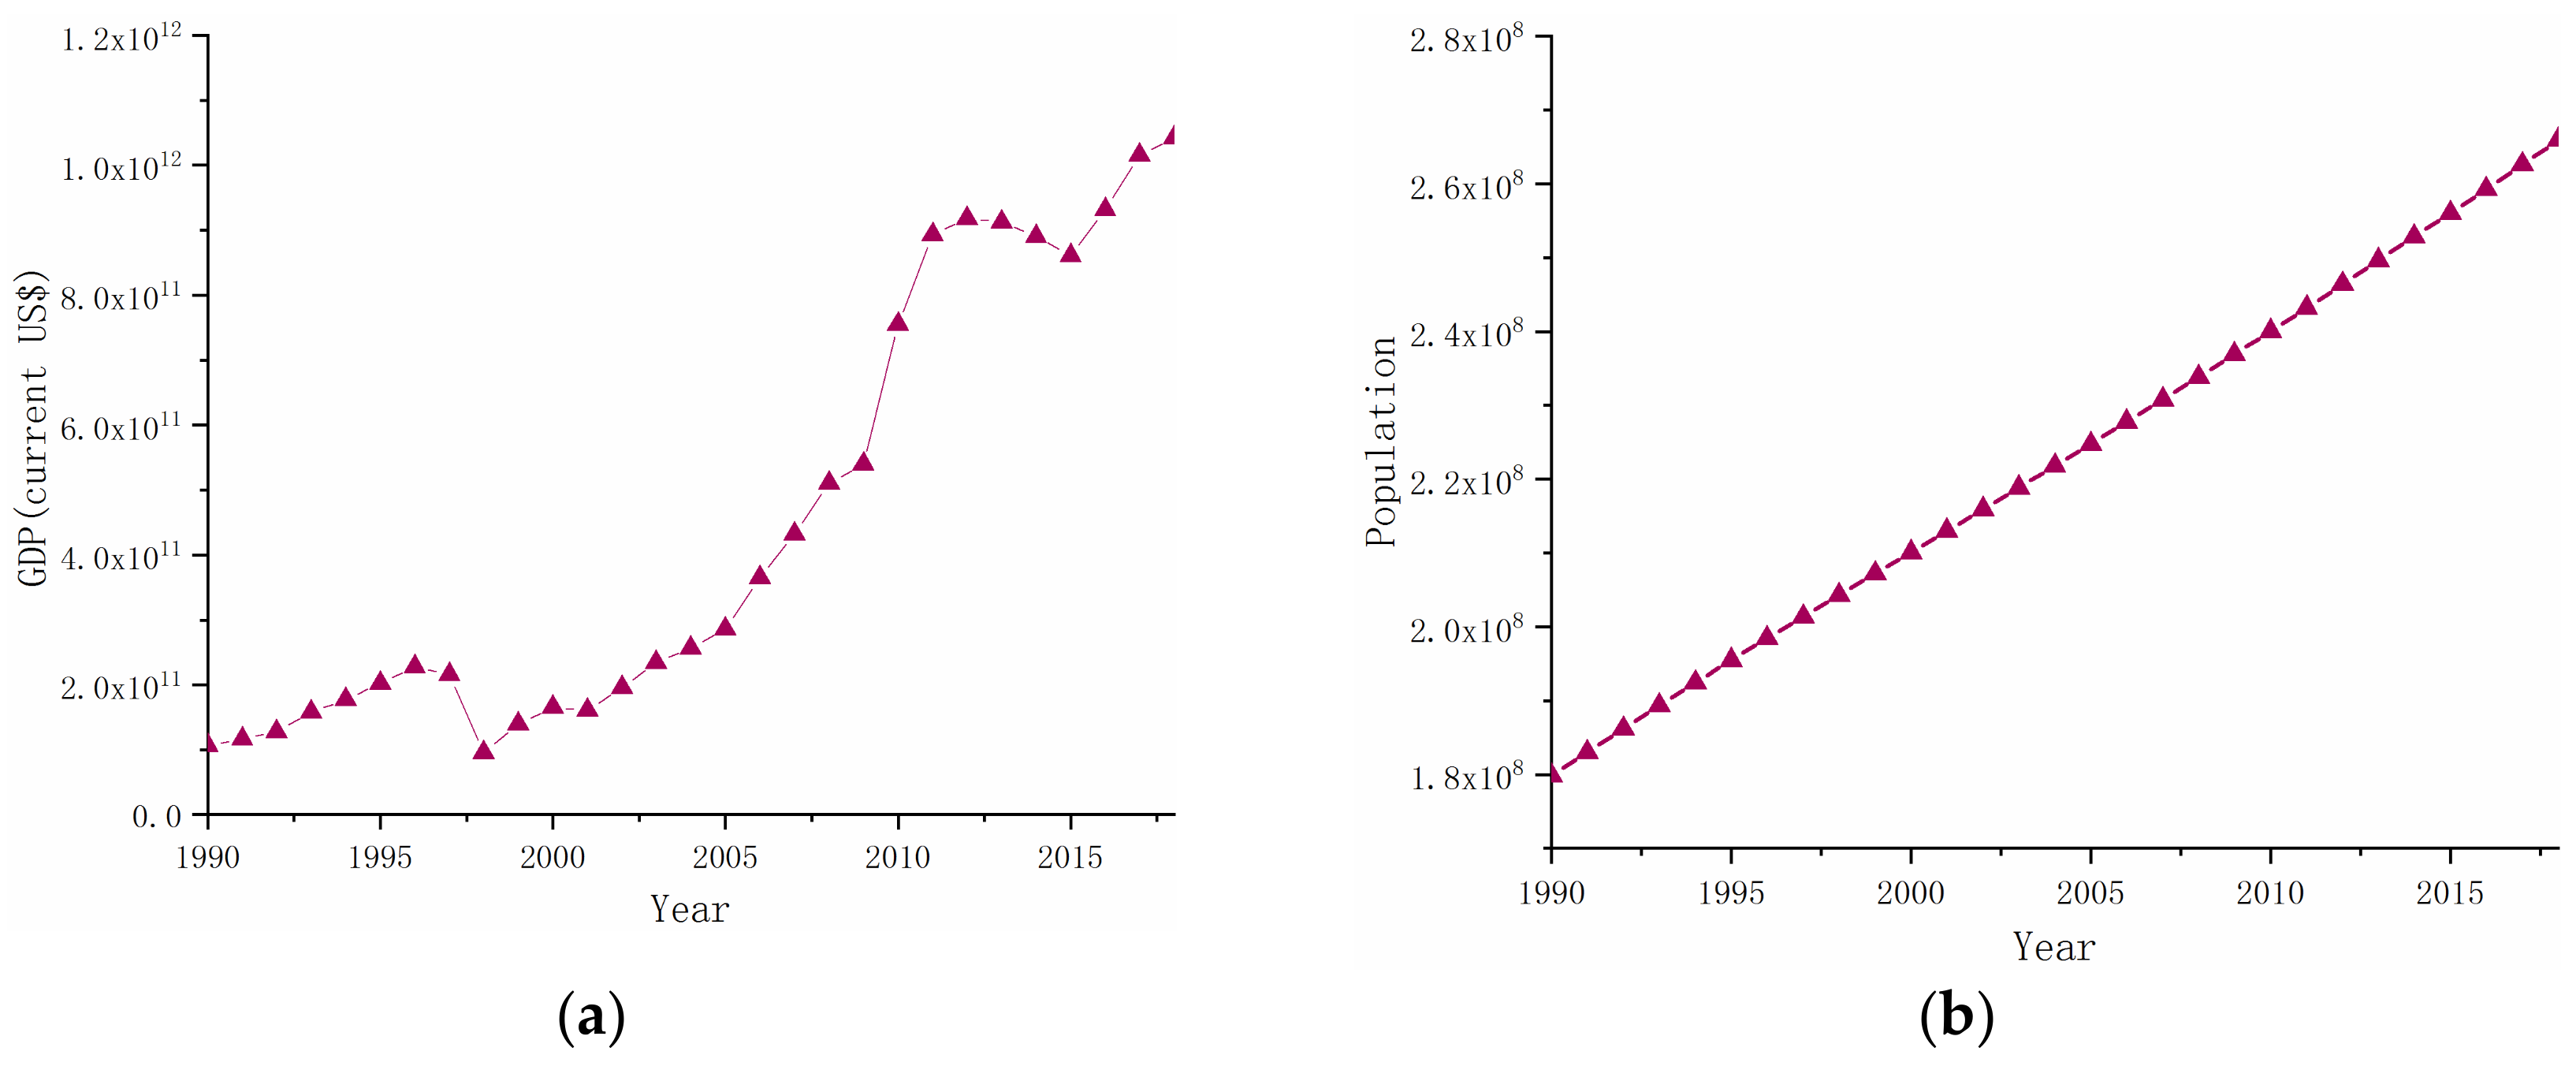
- Over time, the province with the largest population increase was Jawa Barat, but the ICUD in the region only increased by 26.01. The population in the Irian Jaya Barat and Sulawesi Barat provinces increased by 821,378 and 846,349, respectively. However, the ICUD of these two provinces showed a downward trend. Irian Jaya Barat is located in the northwest of Papua. Most of the mountains and plateaus are above 4000 m in altitude. It is the highest island in the world. It can be seen that the difficulties caused by natural topography are the biggest reason for the poor development of the province and city. Sulawesi Barat province, whose economy relies mainly on mining, agriculture, and fishing, is in western Sulawesi. Since the central part of the province is dominated by mountainous terrain and only has low elevations in coastal areas, the population, economy, and agriculture of this region are mostly distributed in coastal areas. As seen in Section 4.3, the province and city had a large ICUD in 1990. With the increase in population, the general phenomenon that the ICUD in the region decreased instead of rose indicates that the region’s coastline development had reached the maximum.
5.3. Advantages and Disadvantages of Monitoring Coastline Change by Remote Sensing
6. Conclusions
- (1)
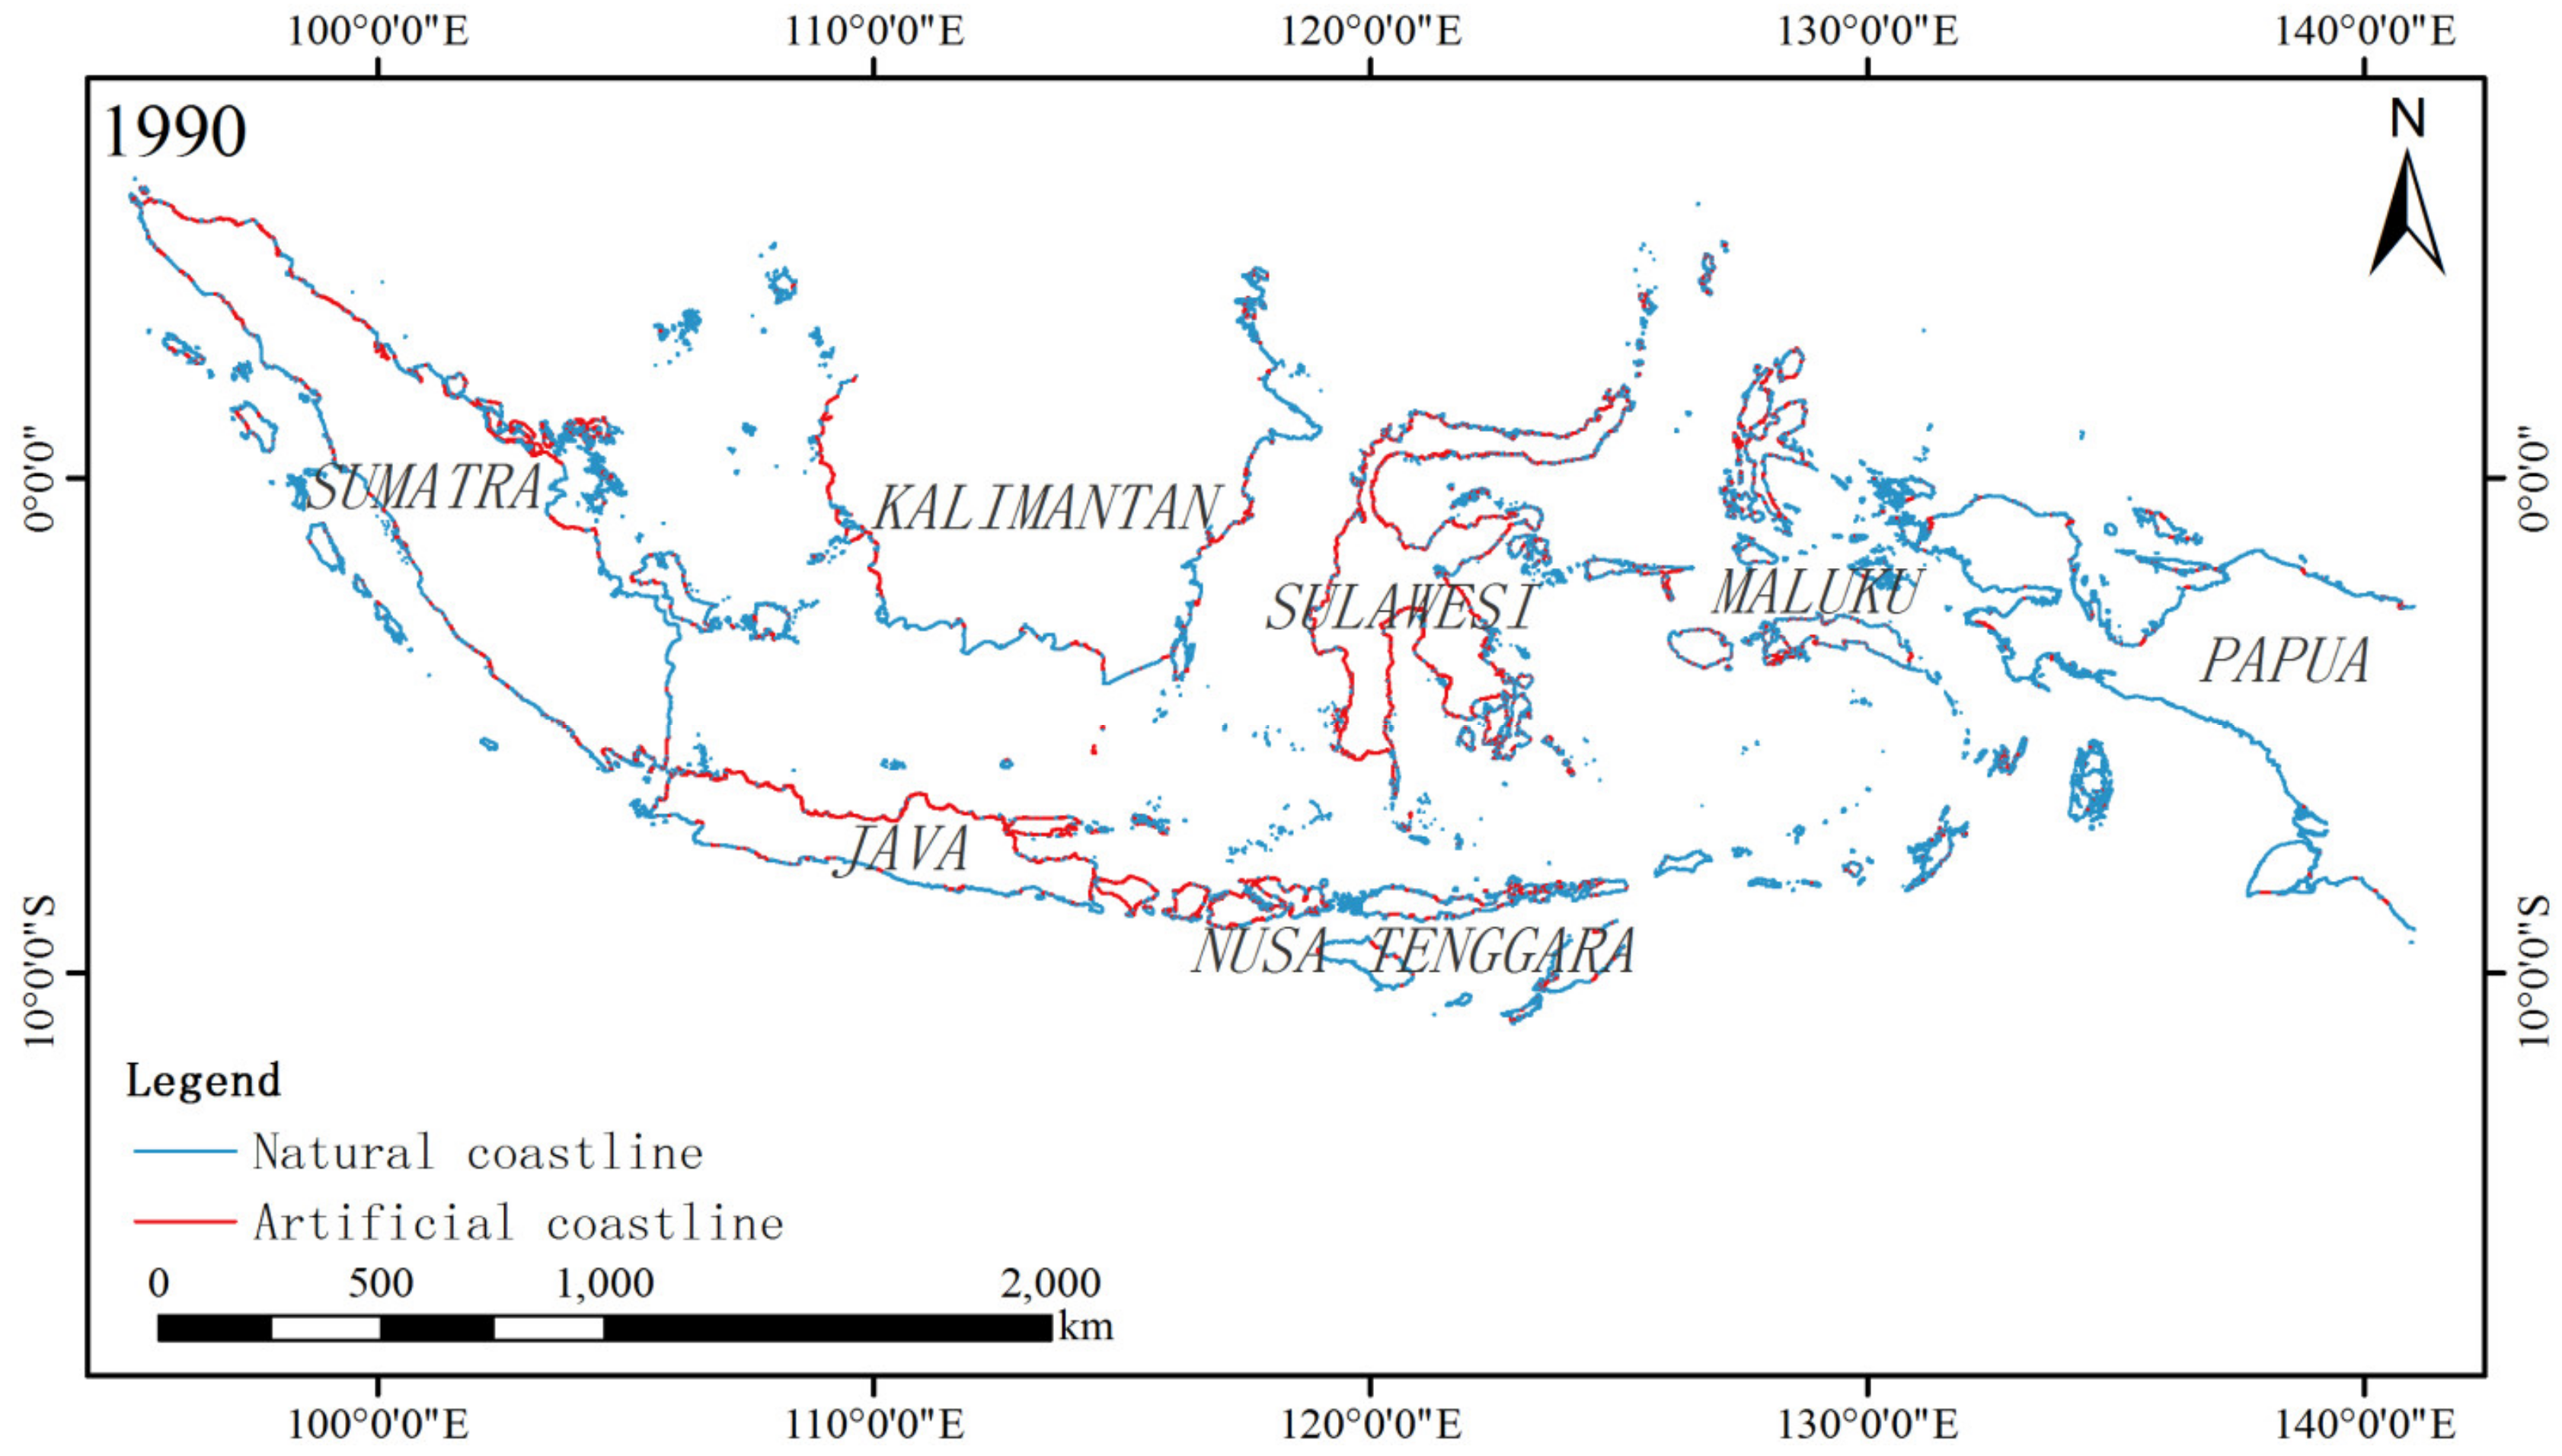
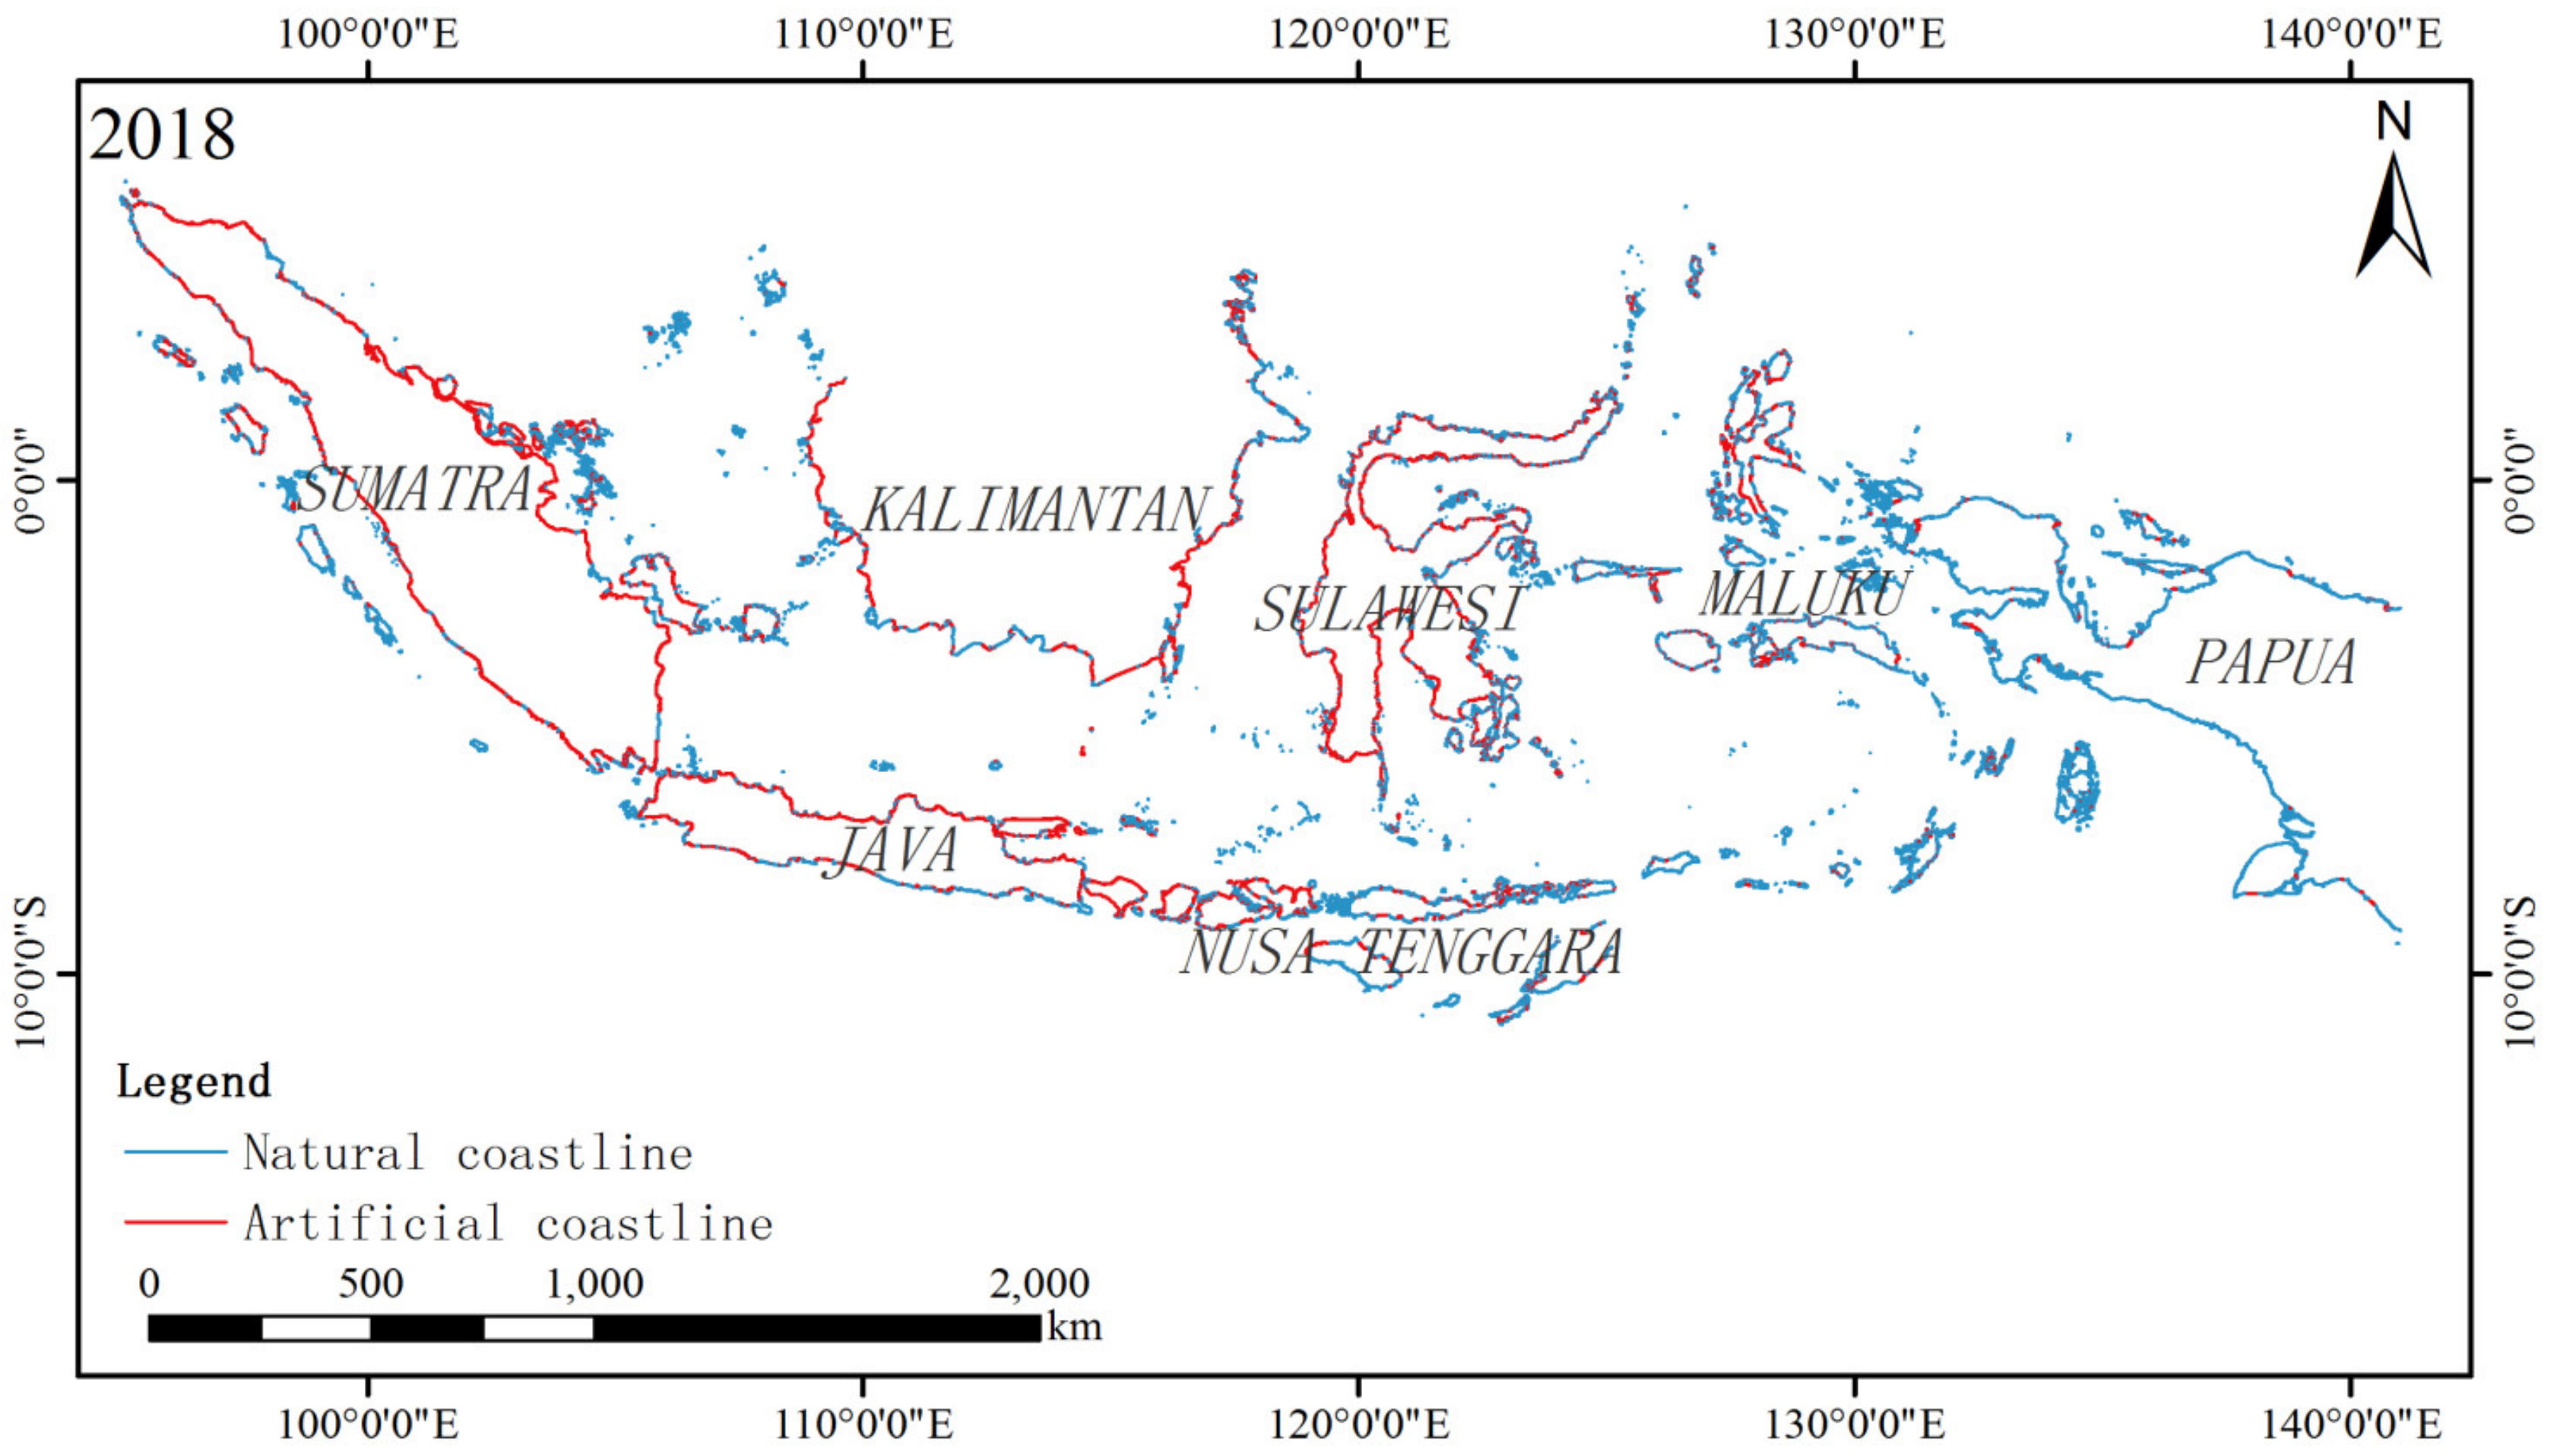
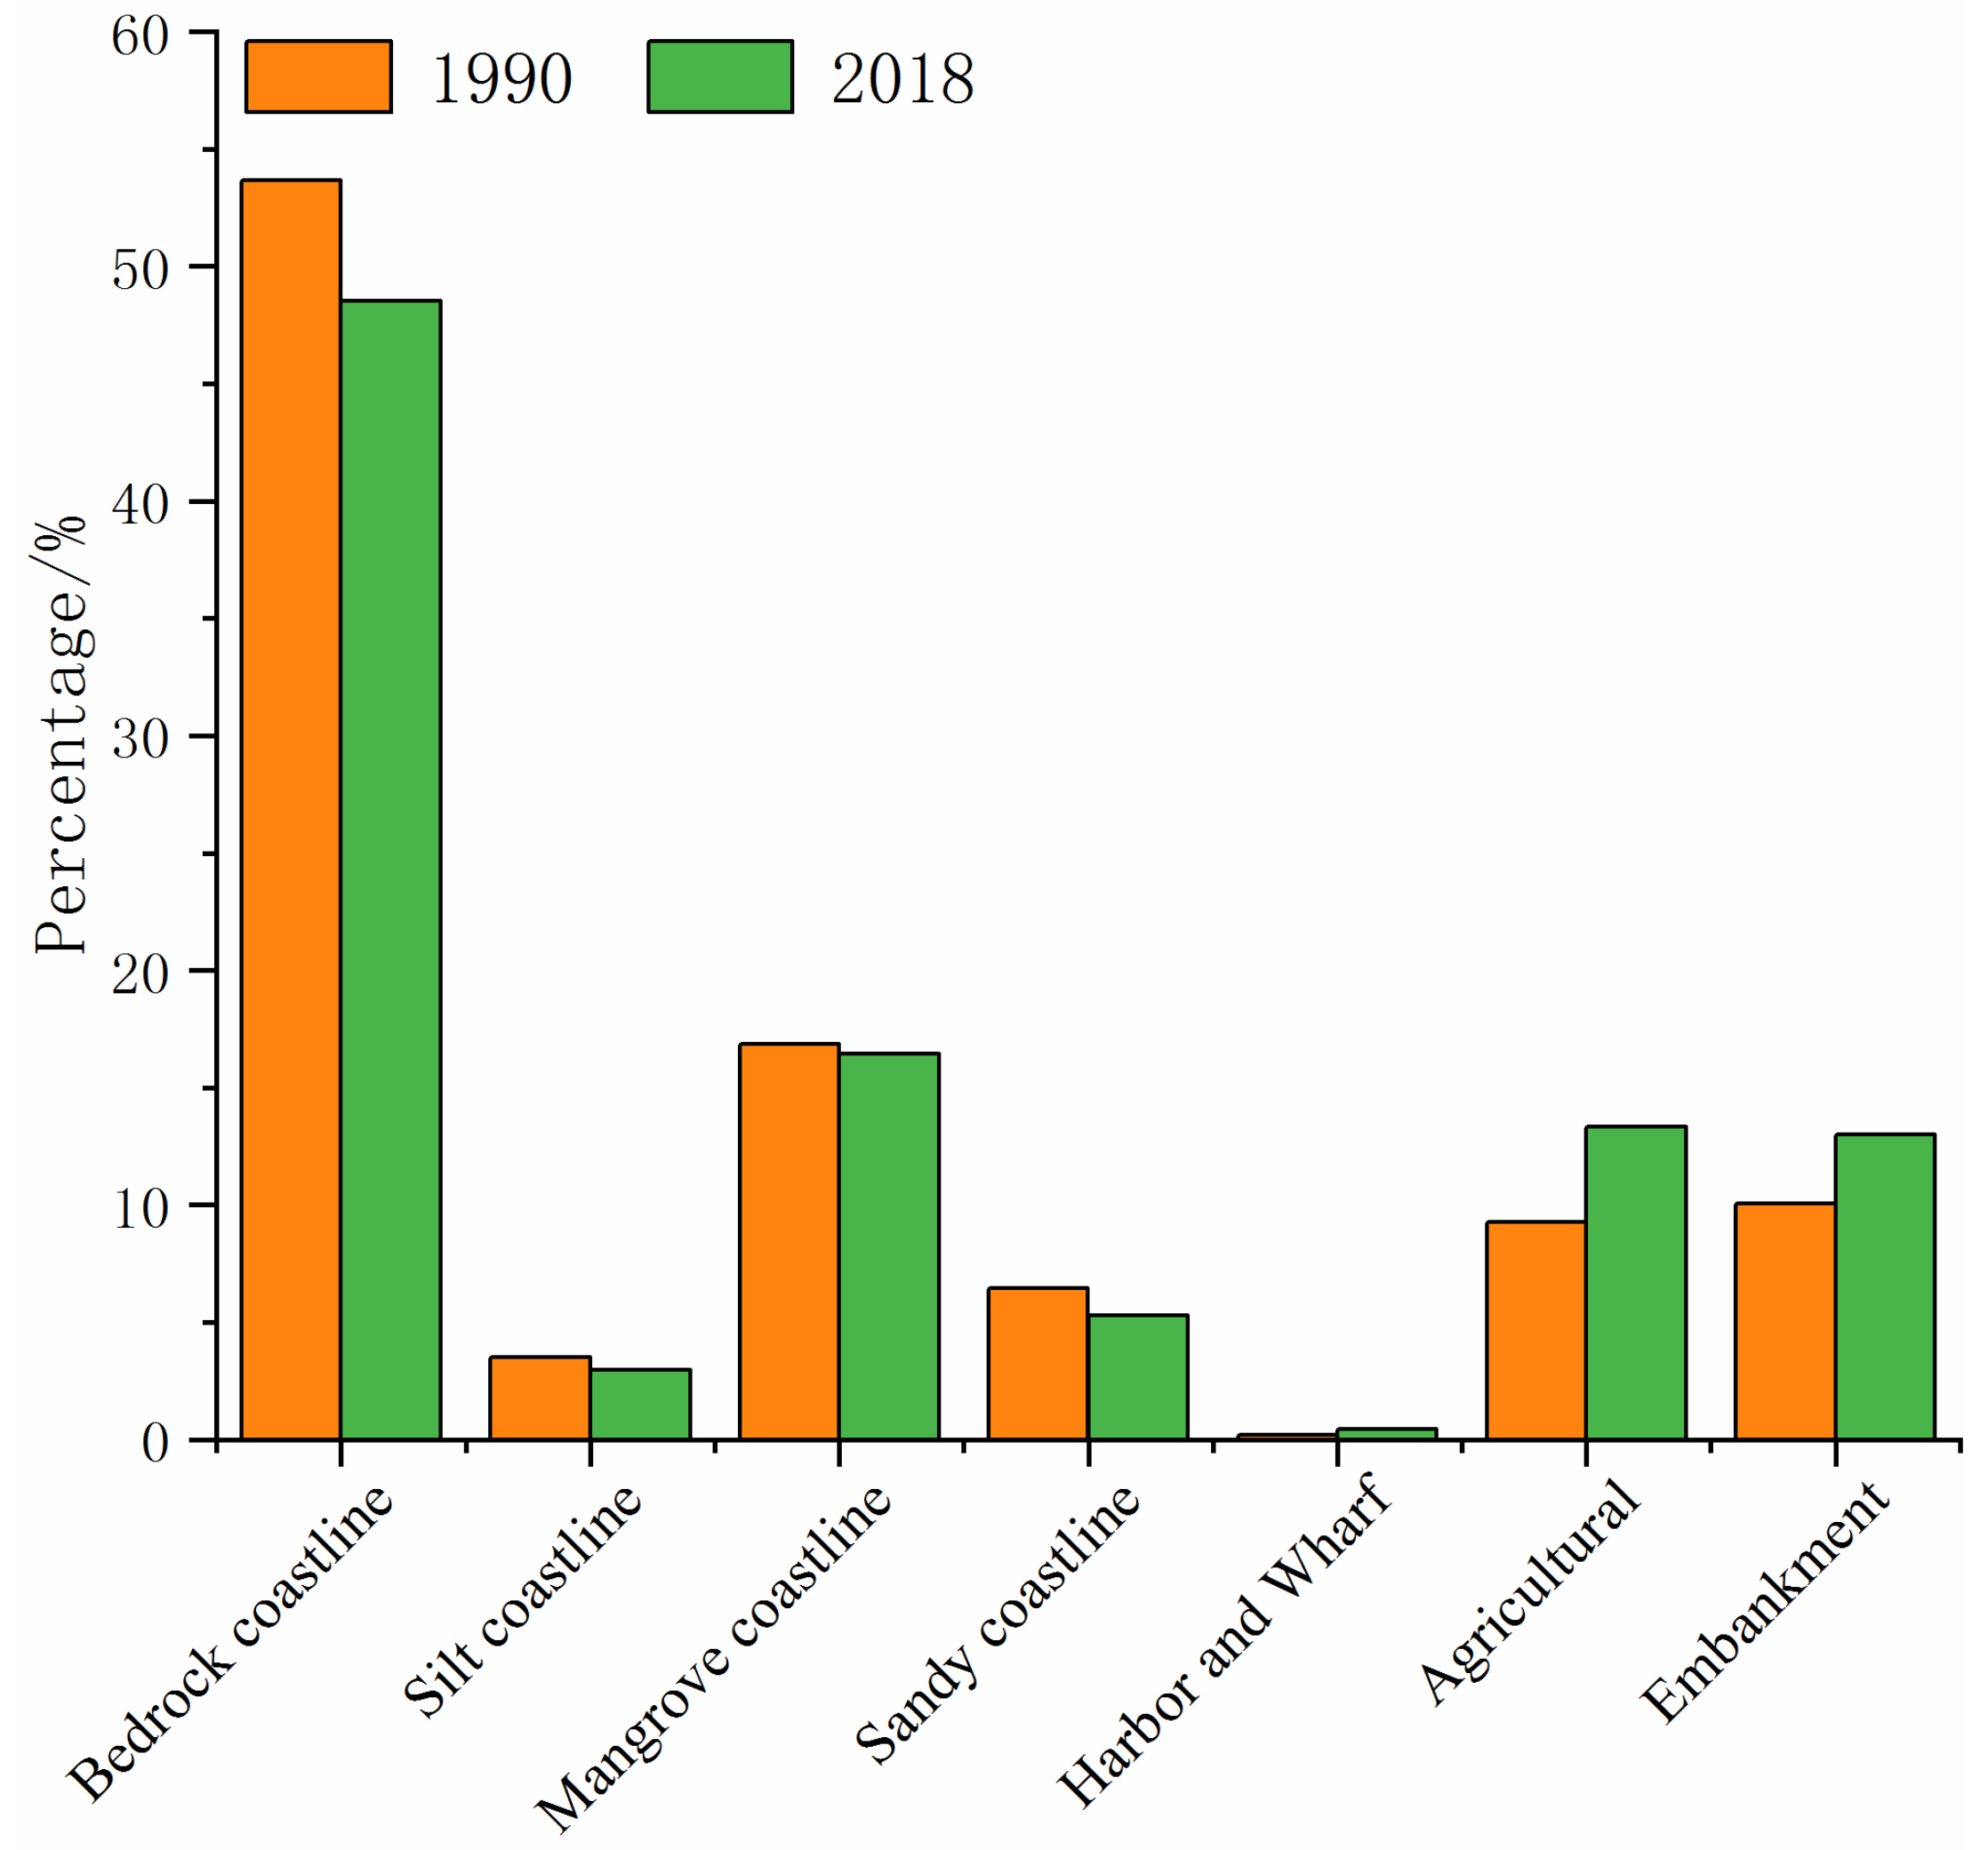
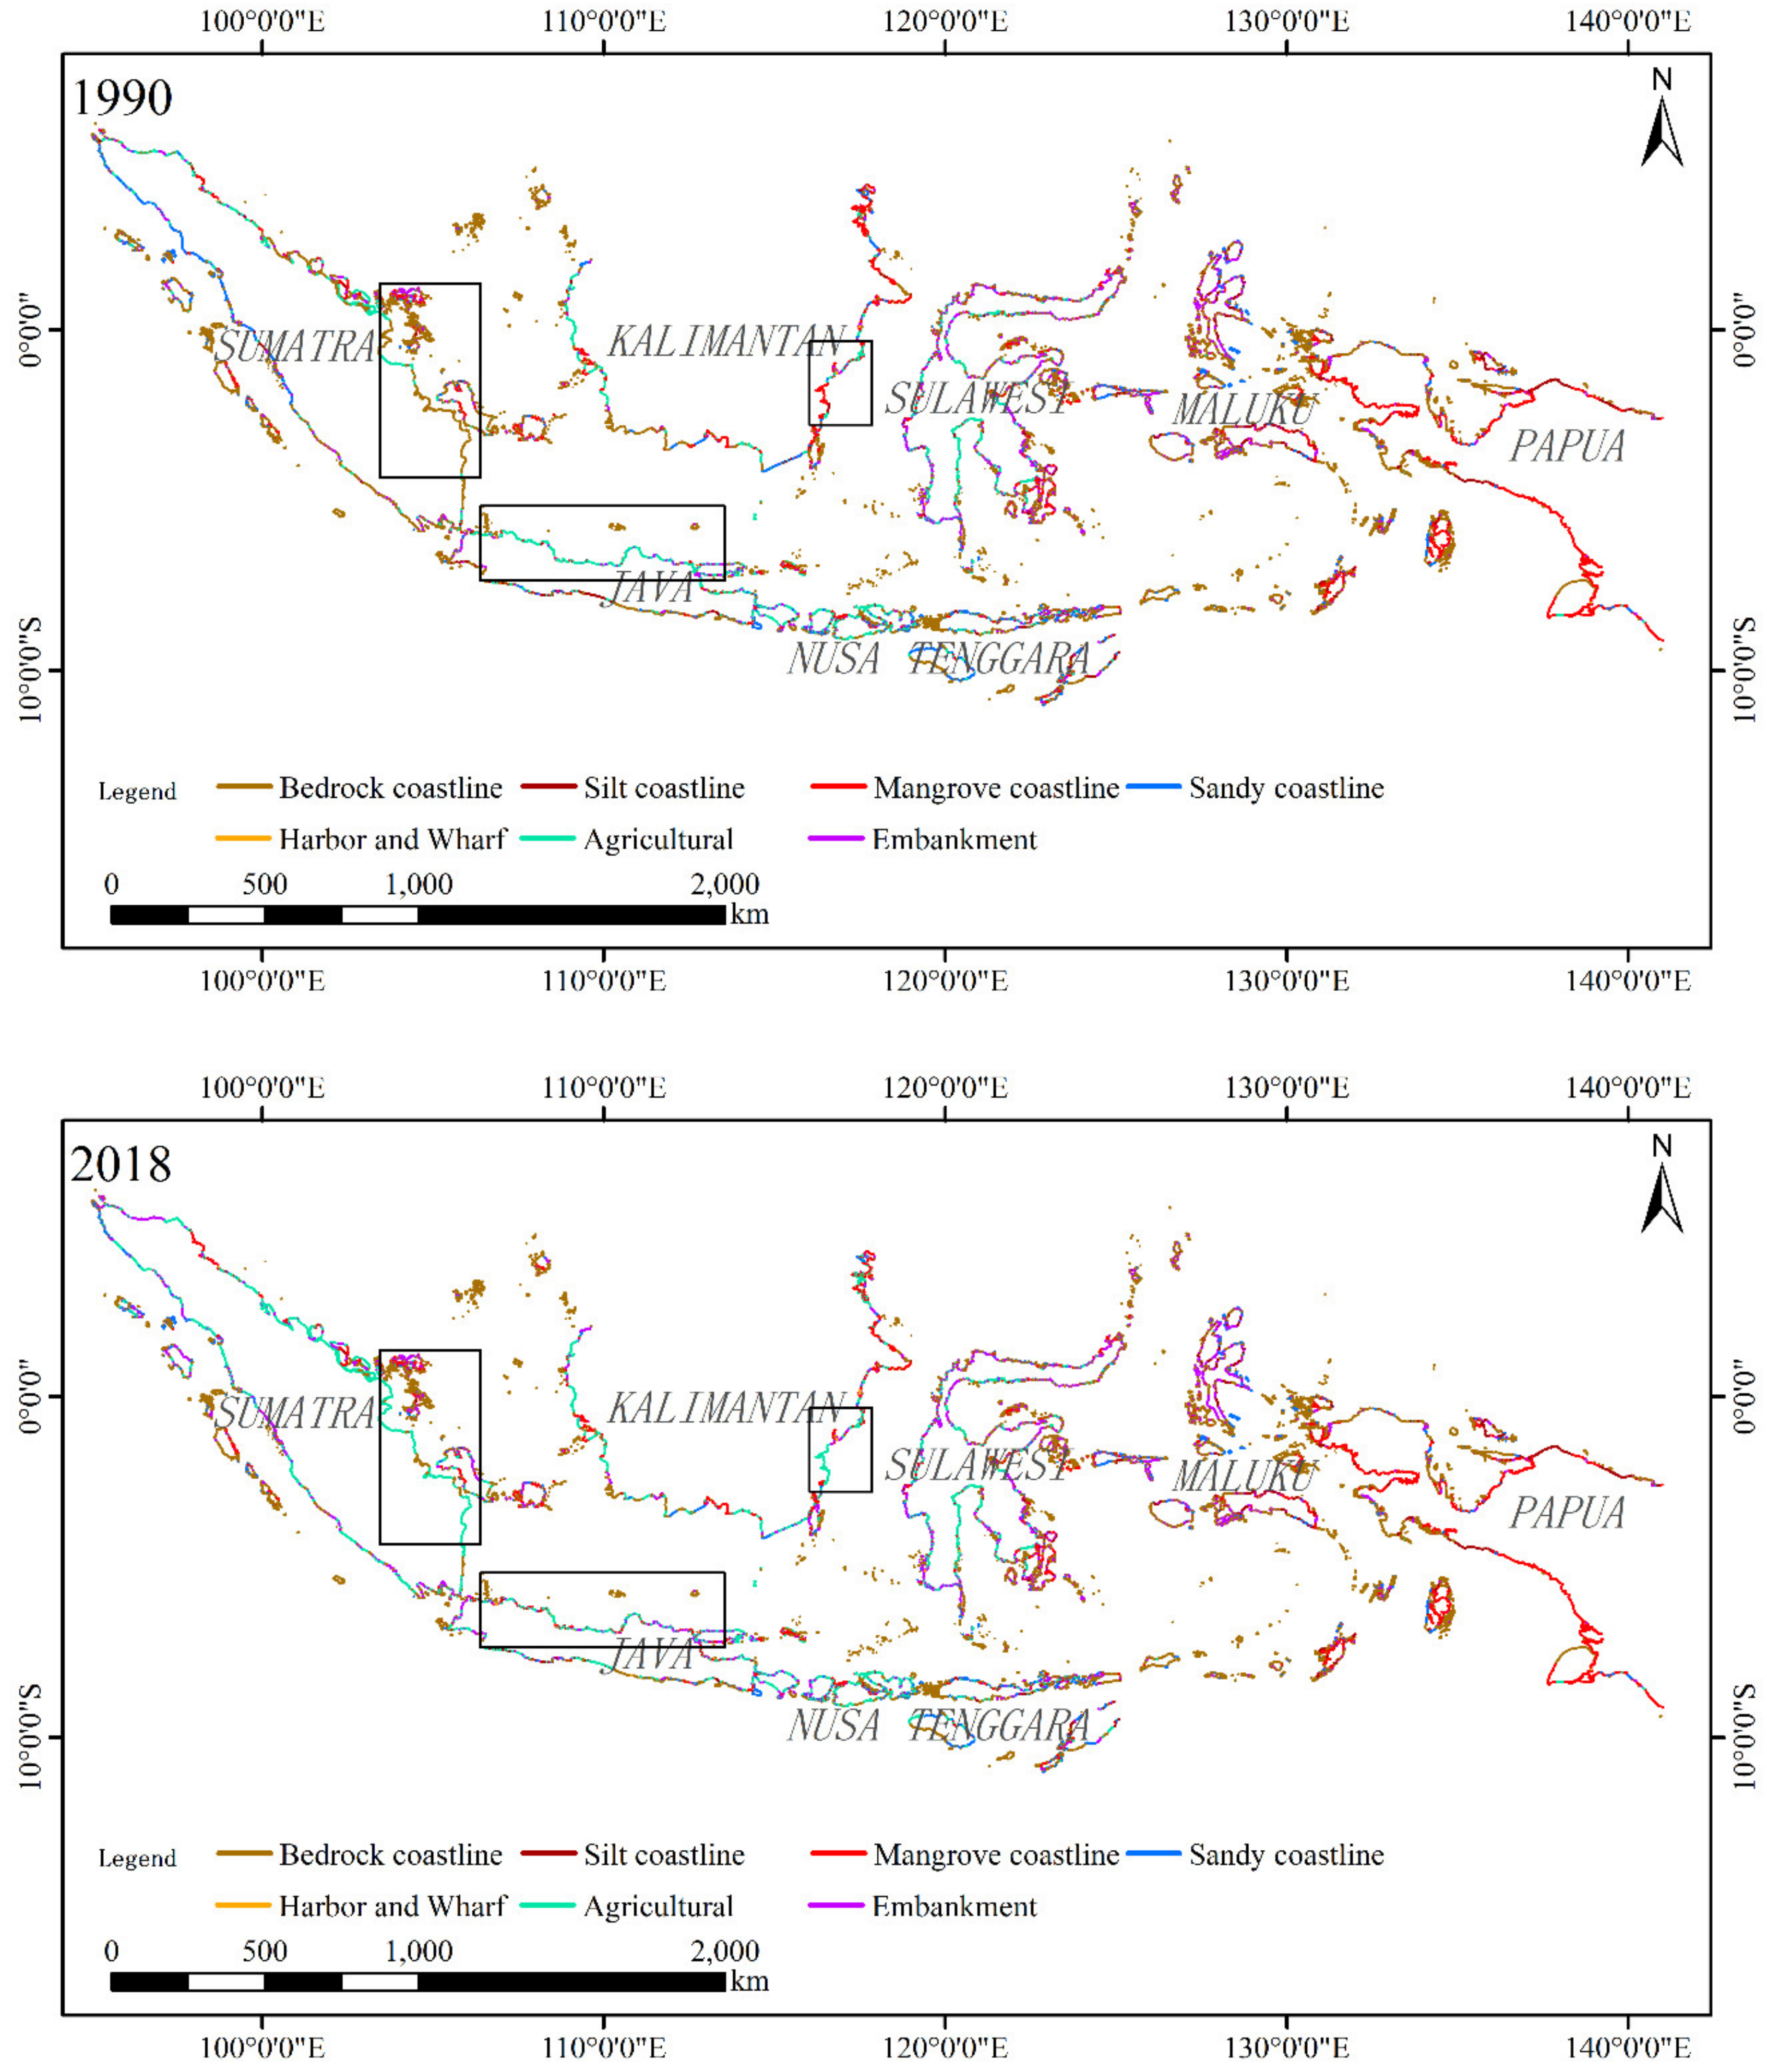
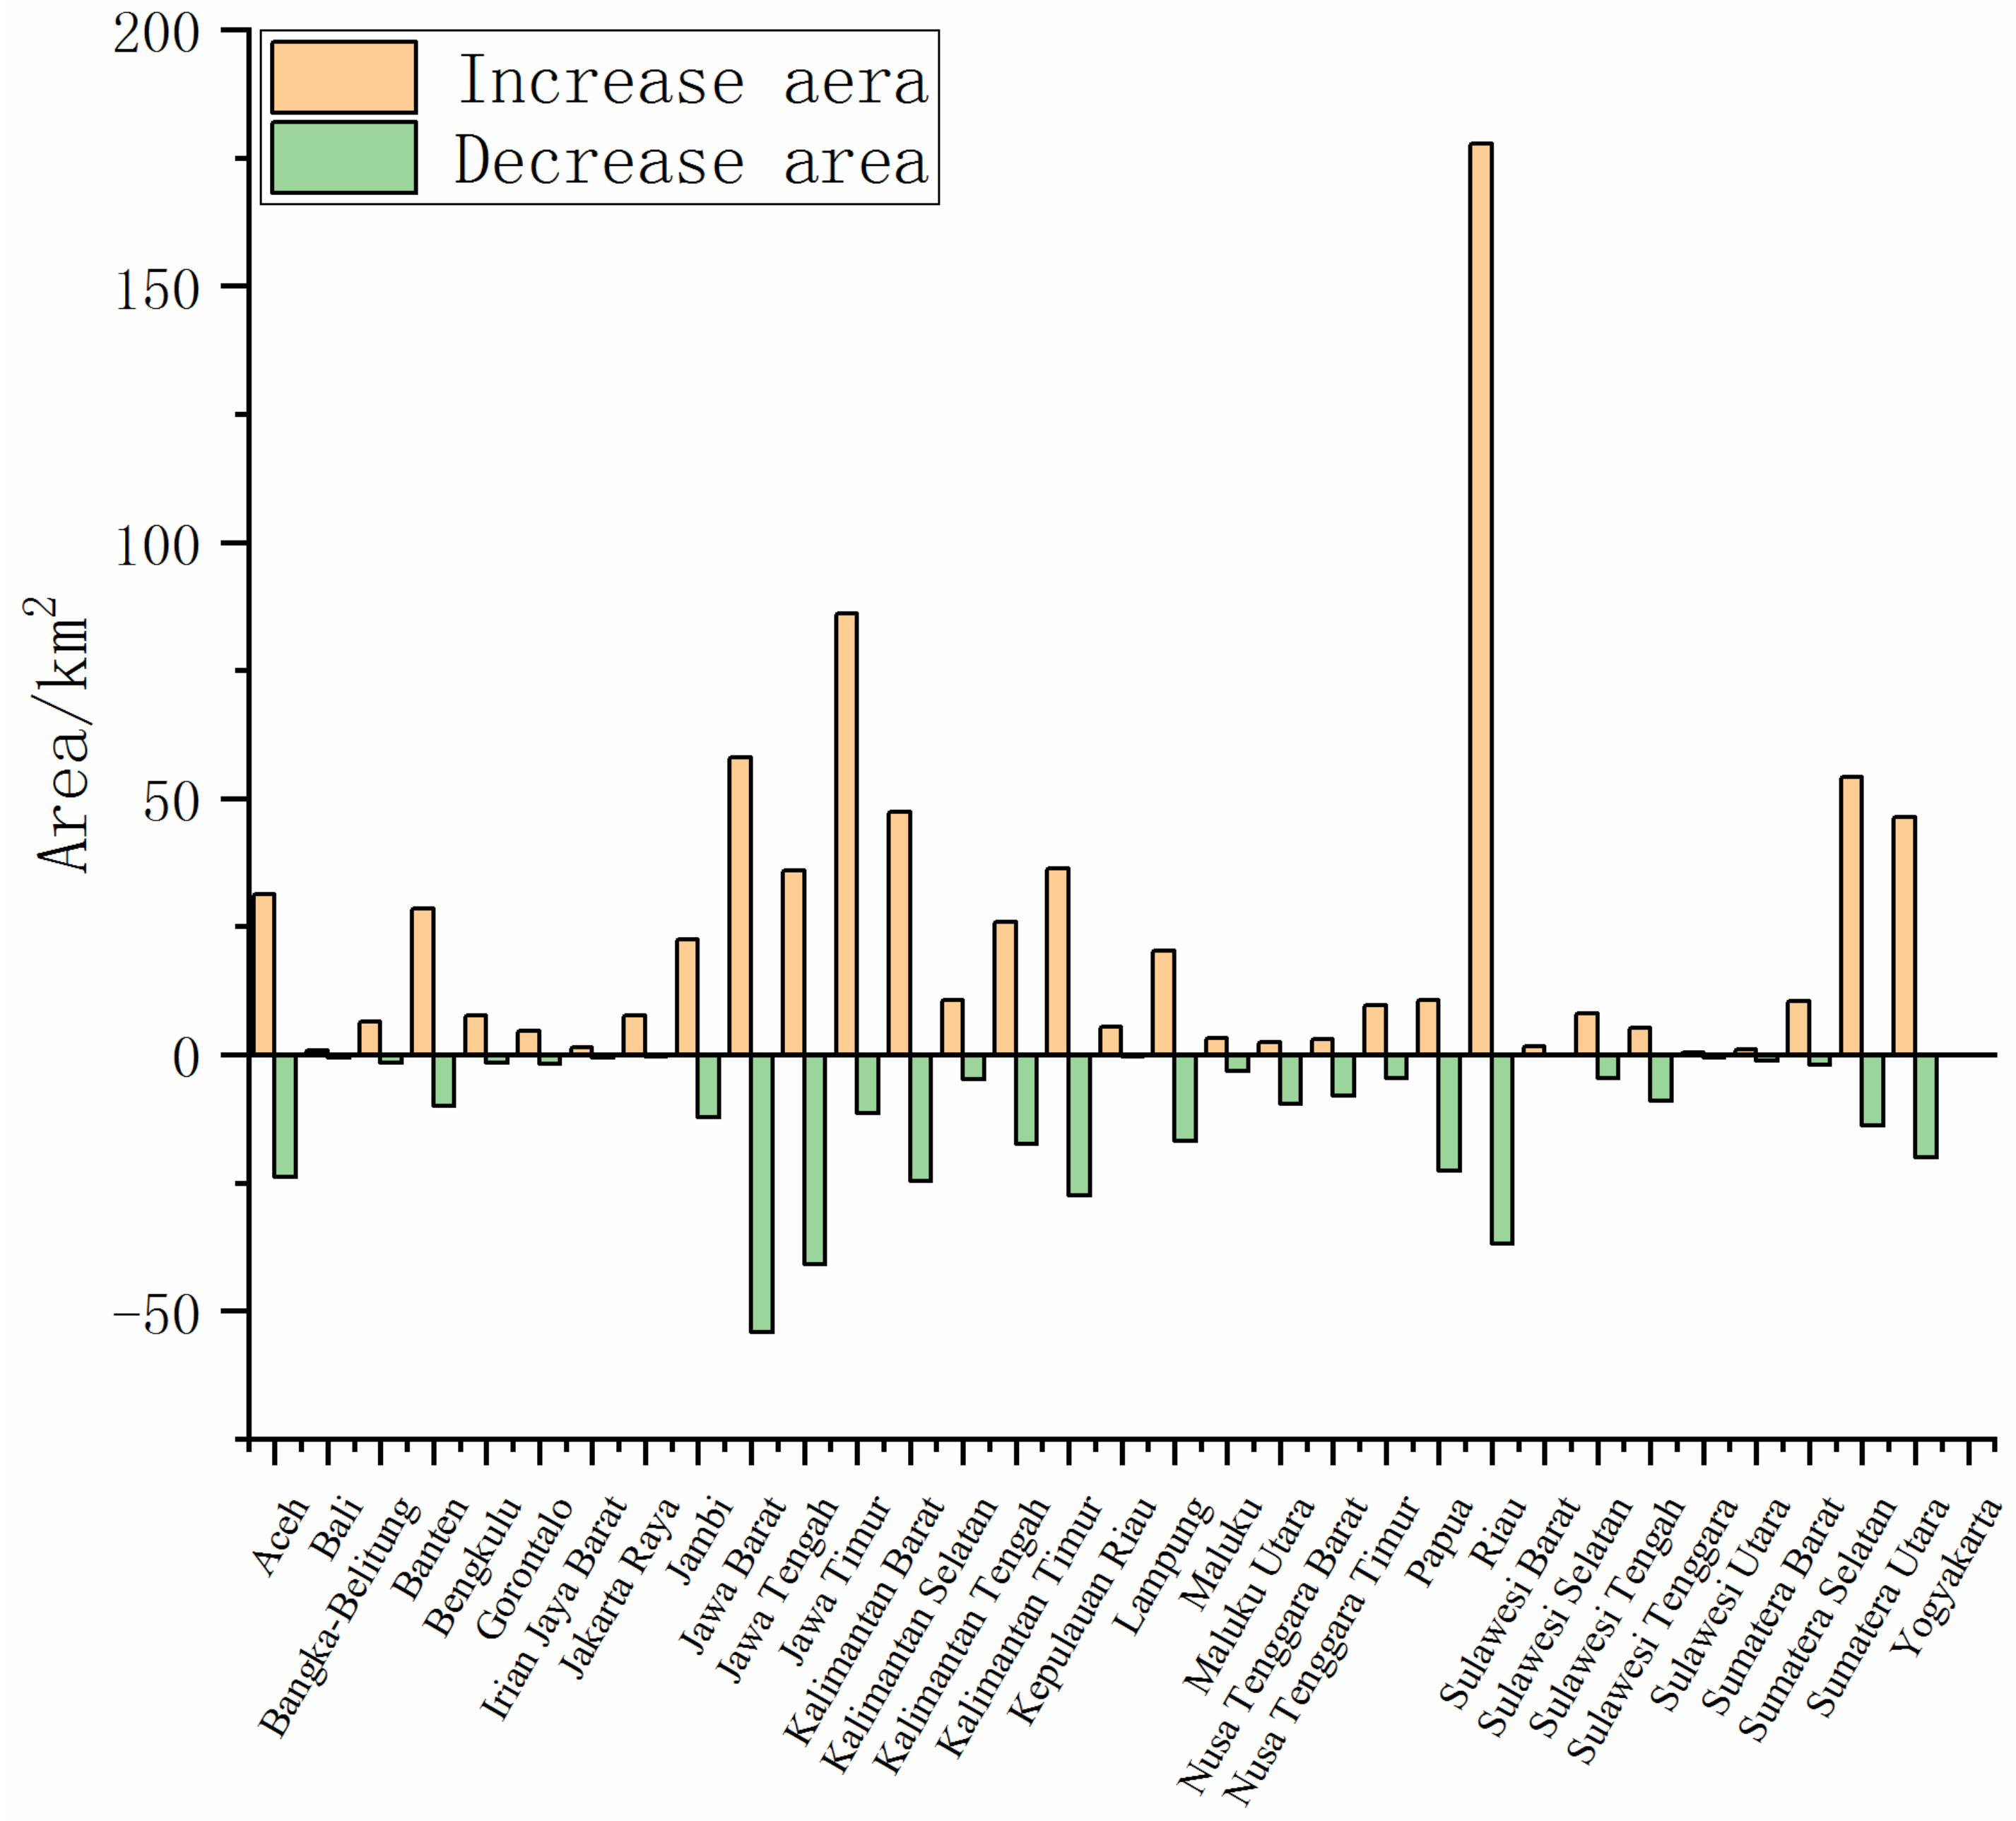
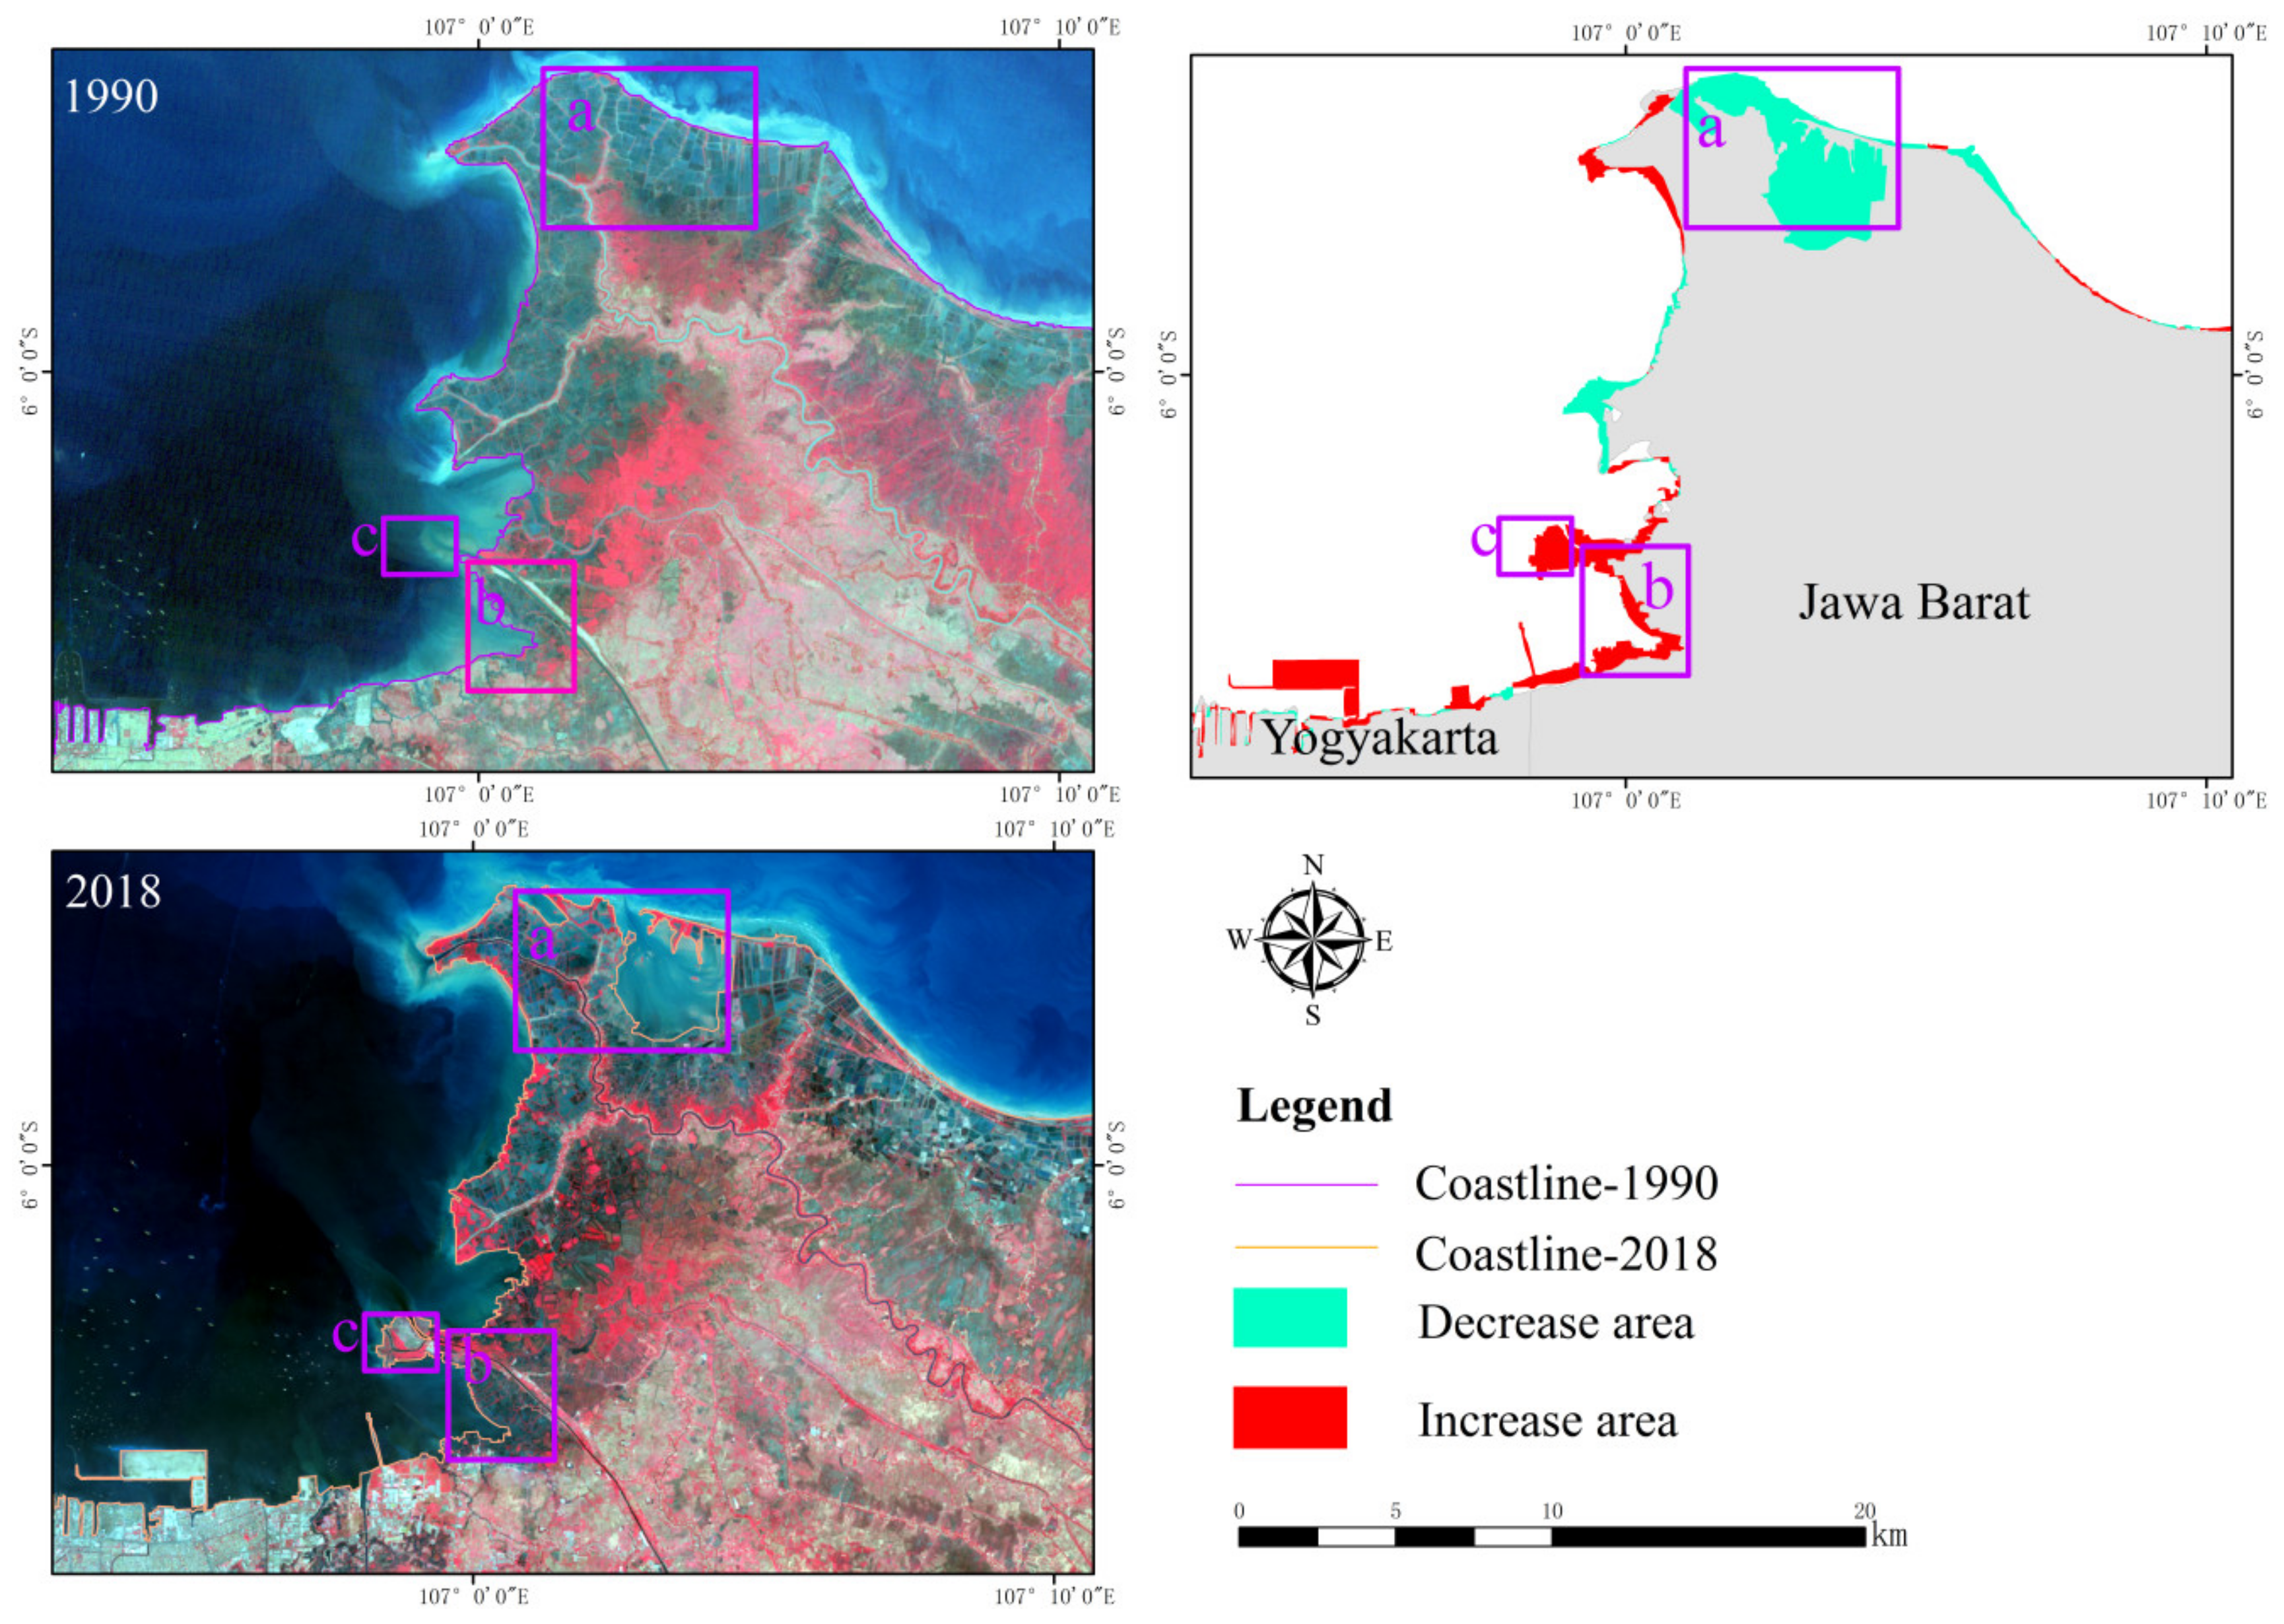
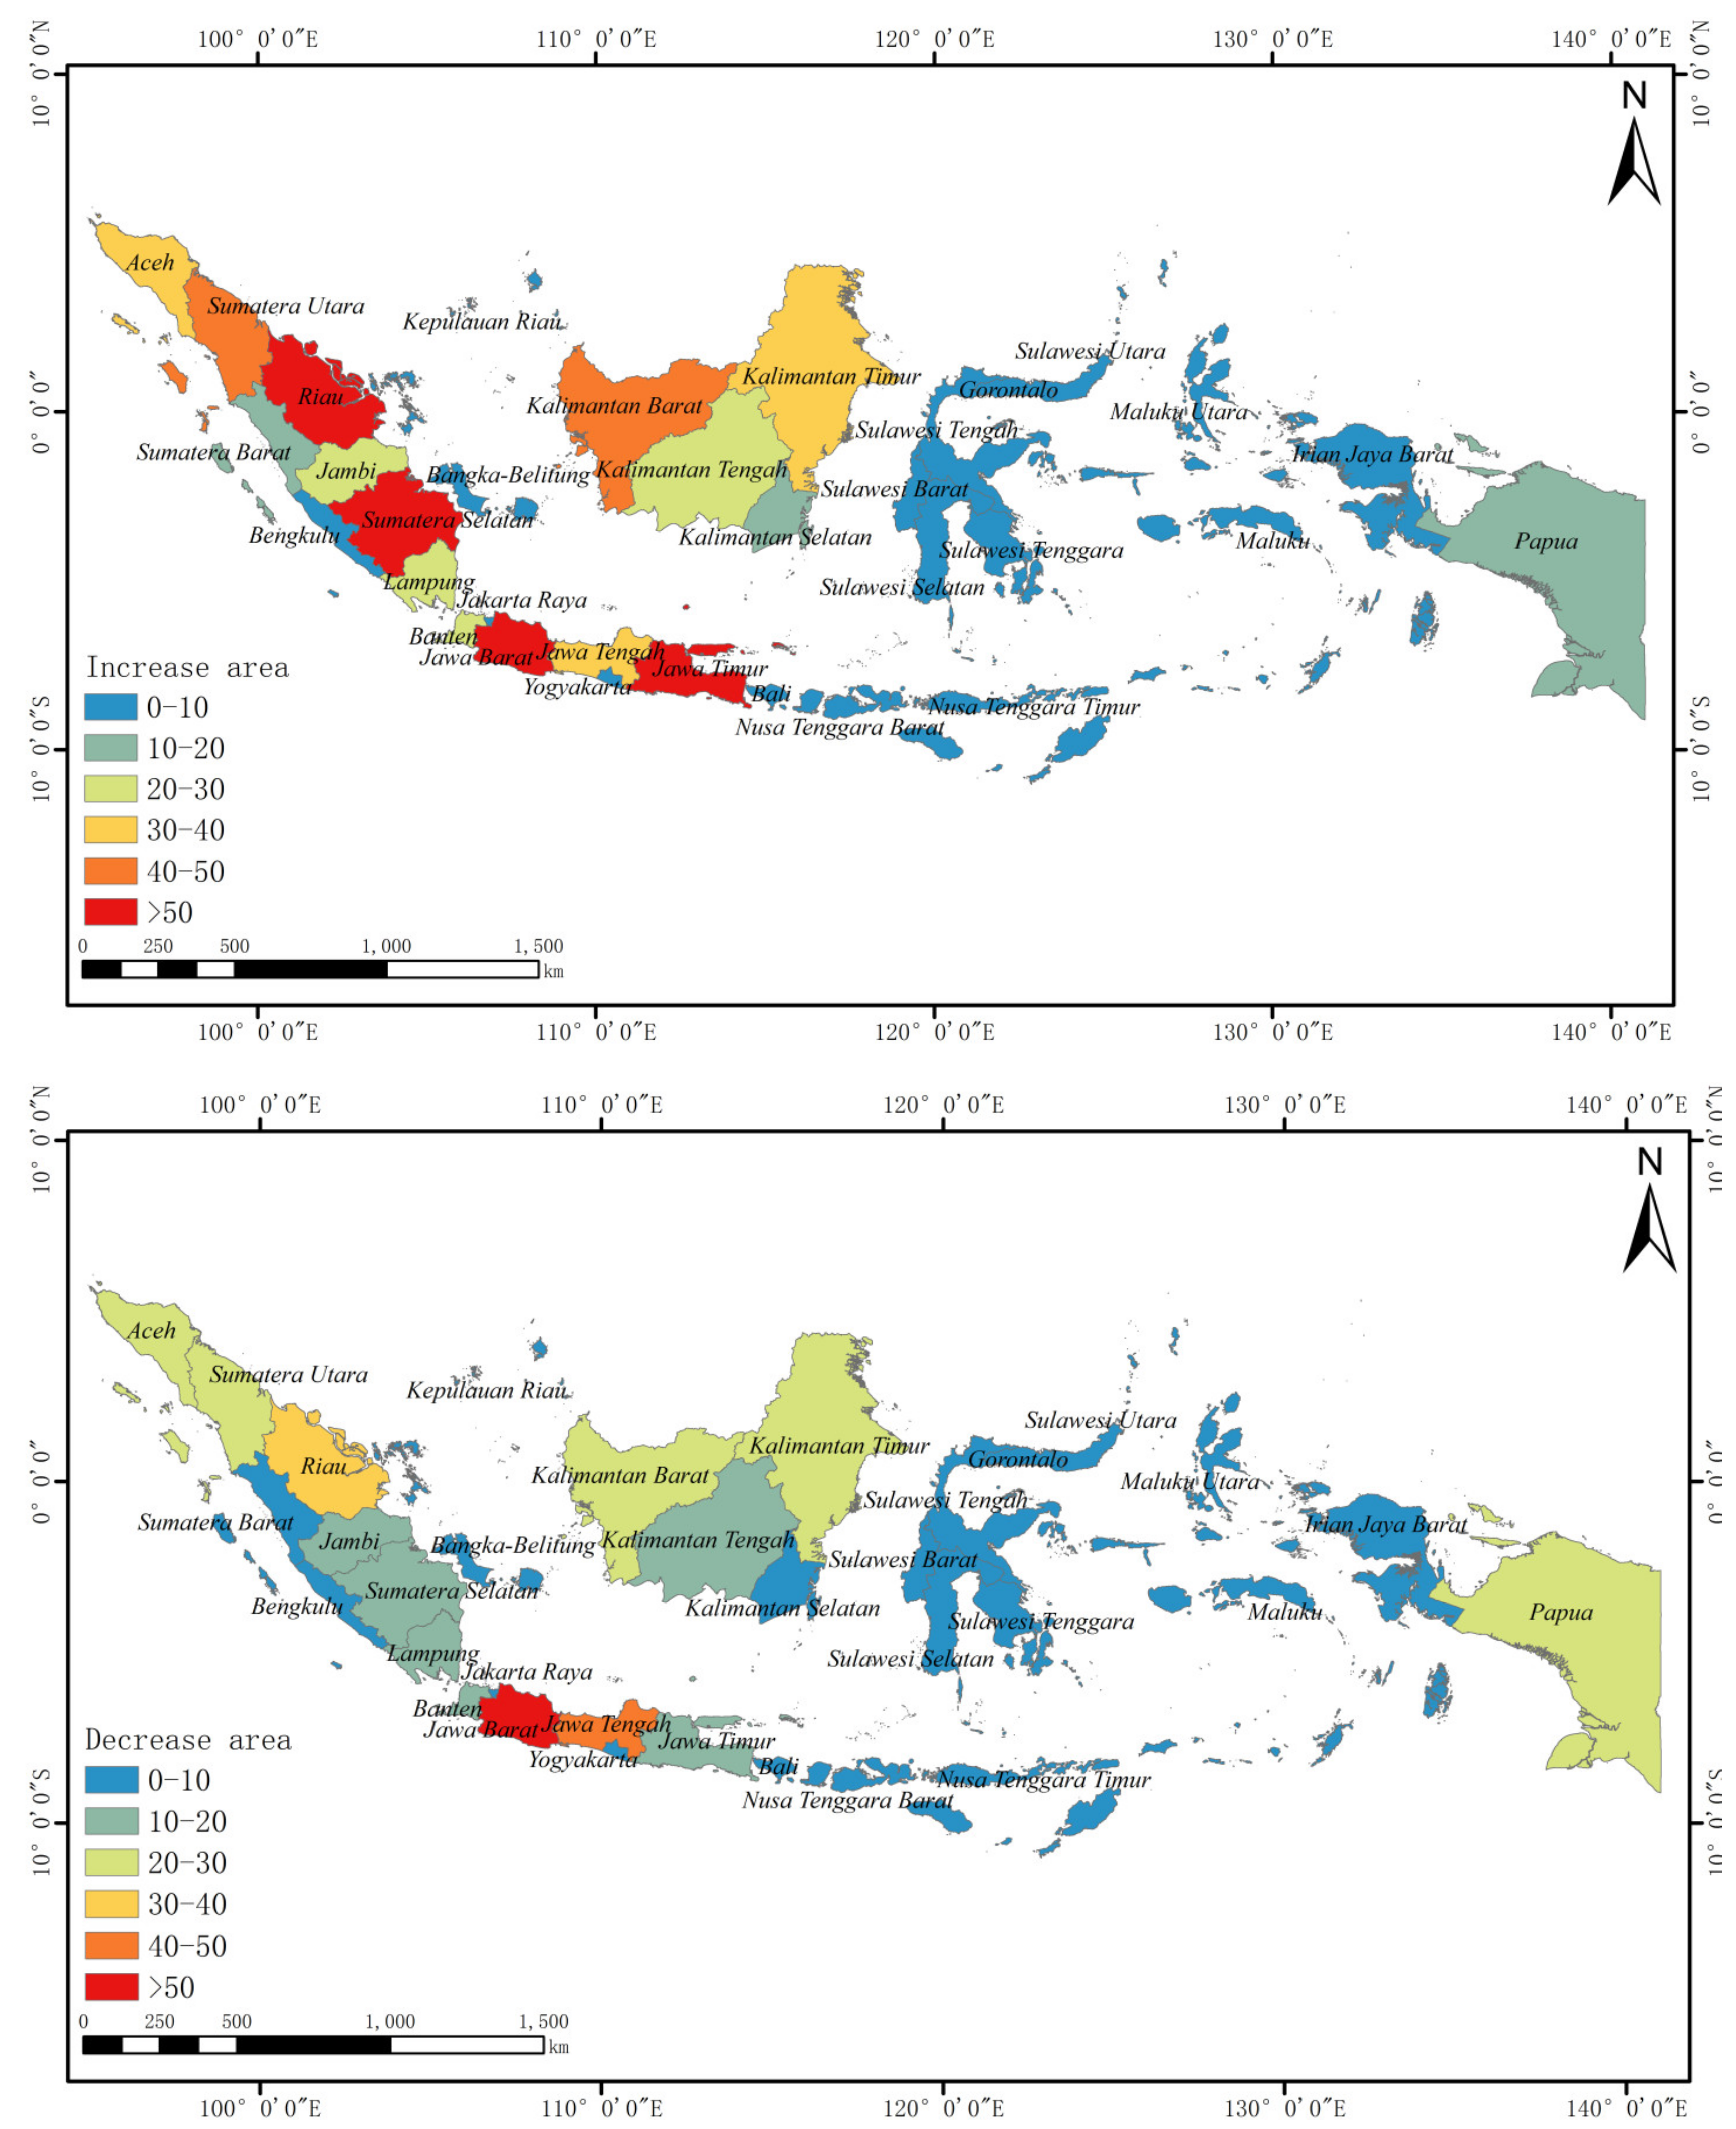
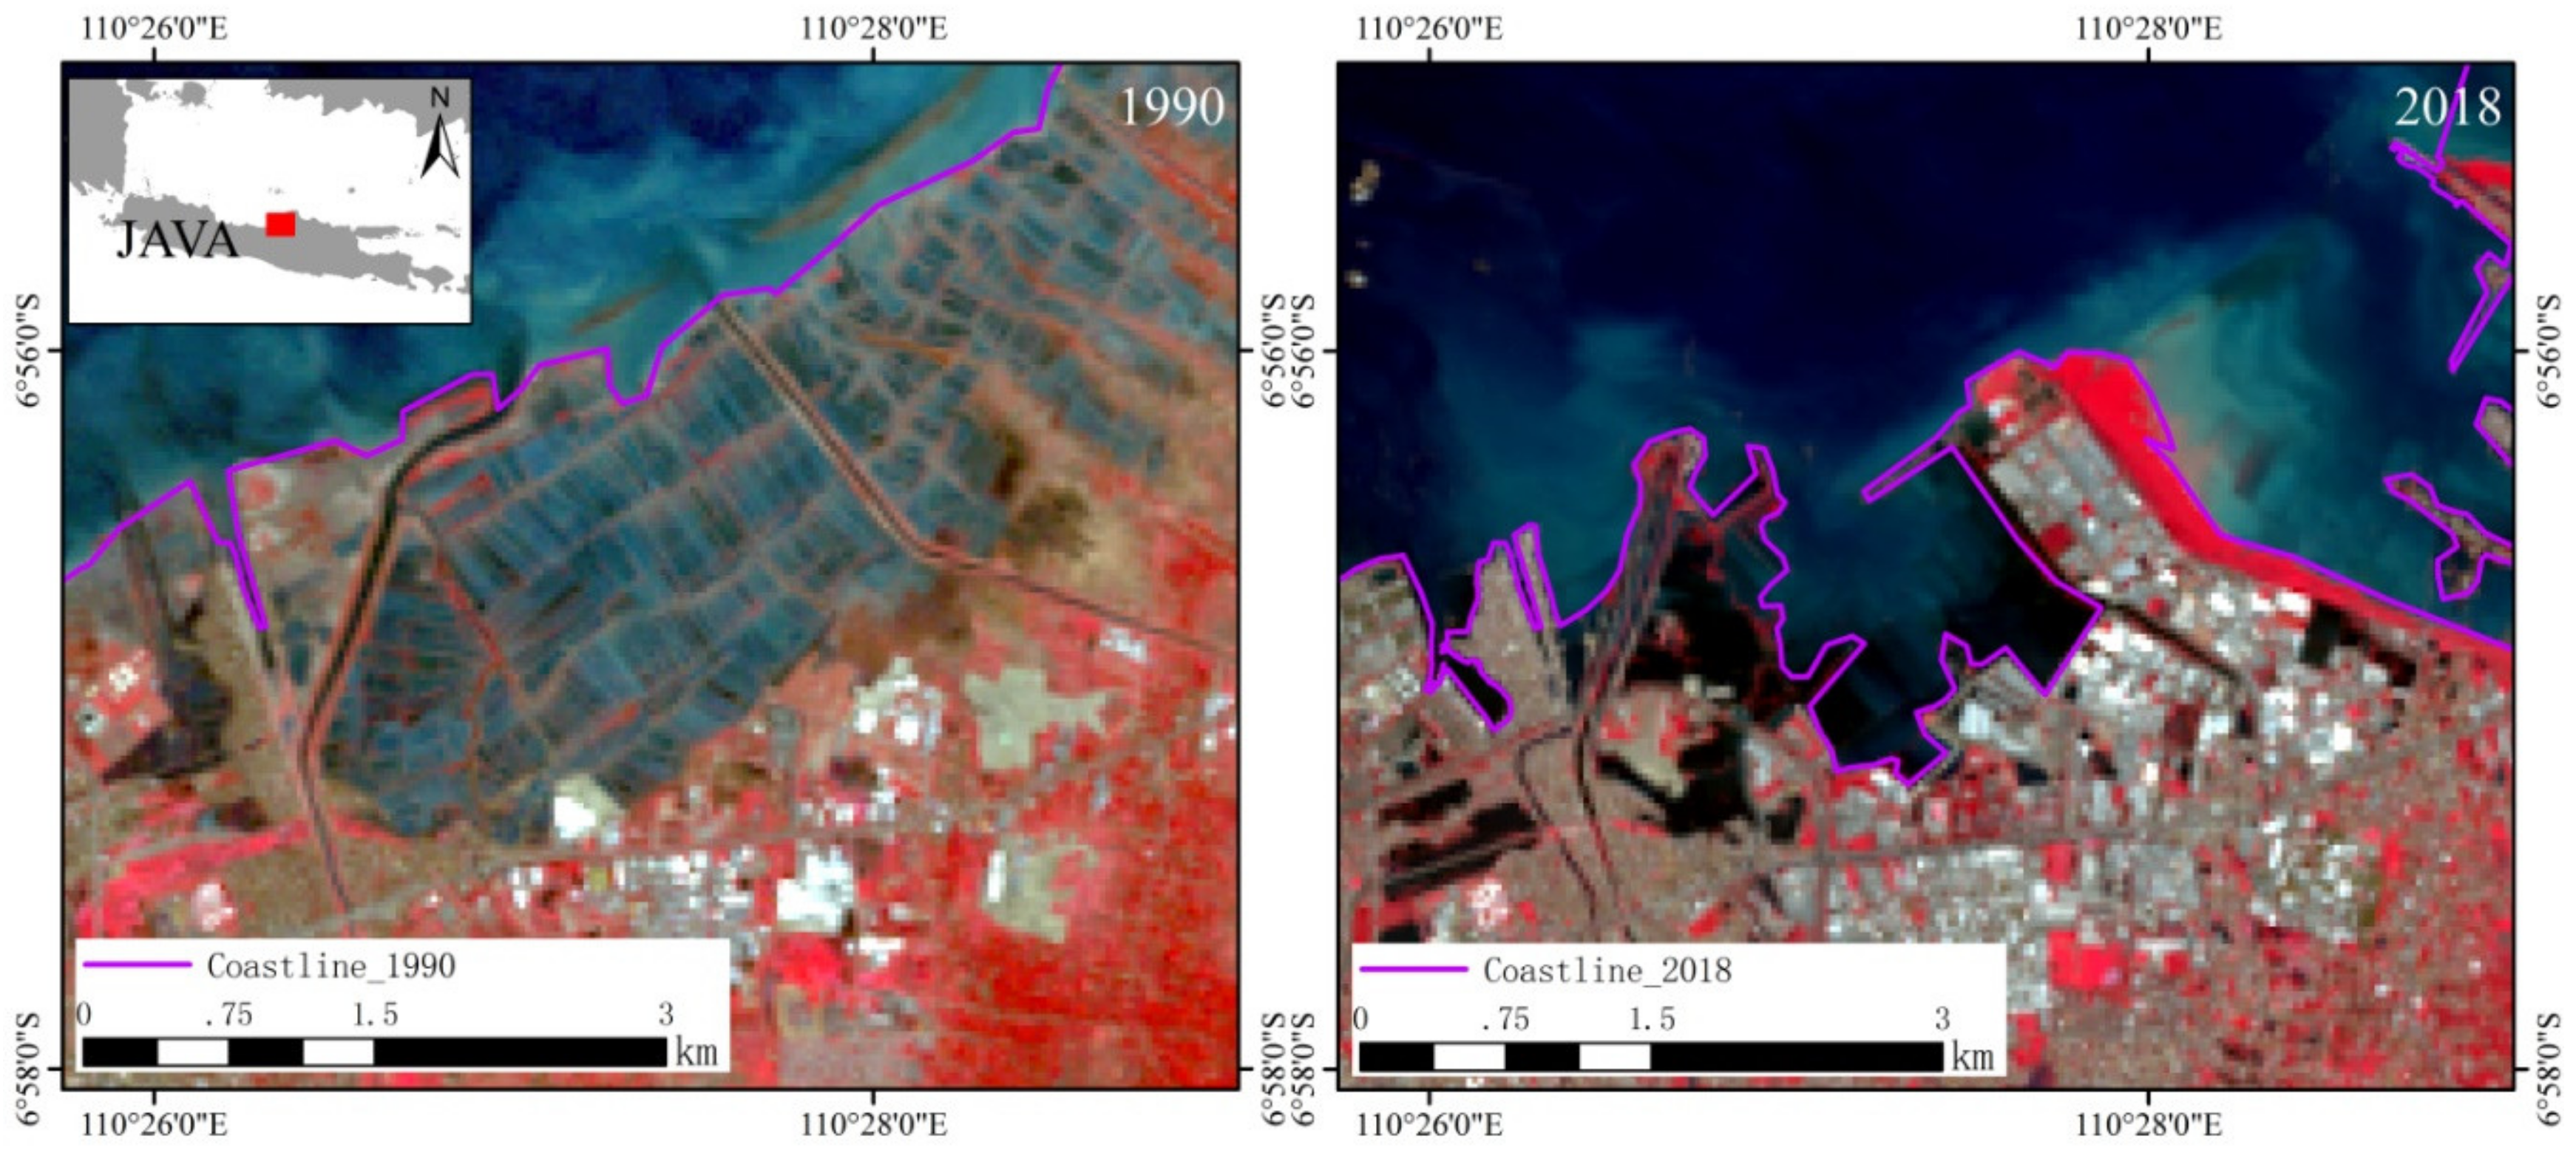
- The overall trend of Indonesia’s coastline changes in the past 28 years was the increase in the total length of the coastline, including a decrease in natural coastline, an increase in artificial coastline, and few changes in the overall type of the secondary types. In 1990, artificial coastlines in Indonesia were mainly distributed on the north coast of Sumatra and Java, the west coast of Kalimantan, and Sulawesi. In 2018, the artificial coastline coverage of the entire Sumatra Island was 90%, and Java Island was also fully developed. The change in land–sea pattern was mainly land-to-sea retreat, of which 770.14 km2 has expanded to the sea in the past 28 years. The land expansion in Riau Province was the most serious, and the seawater erosion in Jawa Barat Province was the most serious.
- (2)
- The main constraint factor that causes the dynamic change of Indonesia’s coastline is the terrain, which causes Indonesia’s population and industry to be mostly distributed in the coastal plains. The result also confirm that in different provinces a larger the population does not correspond to a higher ICUD. The main driving factor is the increase in population, which has led to the intensification of human activities related to coastal engineering, including the construction of port terminals and the reclamation of agricultural facilities. However, the intensification of human activities has also led to the degradation of mangrove ecological coastlines, which will have a certain impact on the coastal ecological environment.
- (3)
- The use of remote sensing technology can quickly monitor the history and current status of long-term serial coastlines in large regions and provide objective data for rational coastal planning. This article takes the dynamic changes in the coastline of Indonesia as a research object and shows the great potential of remote sensing monitoring. In the future, we will use the advantages of the high frequency and wide range of remote sensing to carry out larger-scale and more detailed research on coastline remote sensing monitoring applications, in order to provide effective technical support for coastal area planning and management.
Author Contributions
Funding
Conflicts of Interest
References
- Mujabar, P.S.; Chandrasekar, N. Shoreline change analysis along the coast between Kanyakumari and Tuticorin of India using remote sensing and GIS. Arab. J. Geosci. 2011, 6, 647–664. [Google Scholar] [CrossRef]
- Huang, X. Resource Economics; Nanjing University Press: Nanjing, China, 2010; Volume 1–3. [Google Scholar]
- Hou, X.; Liu, J.; Song, Y.; Li, X. Environmental-ecological Effect of Development and Utilization of China’s Coastline and Policy Recommendations. Bull. Chin. Acad. Sci. 2016, 31, 1143–1150. [Google Scholar]
- Salmon, C.; Duvat, V.; Laurent, V. Human- and climate-driven shoreline changes on a remote mountainous tropical Pacific Island: Tubuai, French Polynesia. Anthropocene 2019, 25, 100191. [Google Scholar] [CrossRef]
- List, J.H.; Farris, A.; Sullivan, C.M. Reversing storm hotspots on sandy beaches: Spatial and temporal characteristics. Mar. Geol. 2006, 226, 261–279. [Google Scholar] [CrossRef]
- Umar, Z.; Akib, W.A.A.W.M.; Ahmad, A. Monitoring shoreline change using Remote sensing and GIS: A case study of padang coastal area, Indonesia. In Proceedings of the IEEE 9th International Colloquium on Signal Processing and its Applications, Kuala Lumpur, Malaysia, 8–10 March 2013; pp. 280–284. [Google Scholar] [CrossRef]
- Ranasinghe, R.; Duong, T.M.; Uhlenbrook, S.; Roelvink, D.; Stive, M.J.F. Climate-change impact assessment for inlet-interrupted coastlines. Nat. Clim. Chang. 2012, 3, 83–87. [Google Scholar] [CrossRef]
- Liao, T.; Cai, T.; Liu, Y.; Xia, X. Continental shoreline change in Zhejiangduringthe last one hundred years. J. Mar. Sci 2016, 34, 25–33. [Google Scholar]
- Wang, B.; Liang, L.; Hui, F.; Cheng, X.; Gong, P.; Chen, Z.; Huang, H. Spatiotemporal changes of the Chinese coastlines: Landsat imagery from 1975 to 2015. J. Beijing Norm. Univ. Nat. Sci. 2019, 55, 83–100. [Google Scholar]
- Sun, X.; Wu, M.; Tian, J.; Lu, J.; Yu, H.; Song, F.; Liang, F. Driving forces and spatio-temporal variation of Weihai coastline in recent 30 years. J. Appl. Oceanogr. 2019, 38, 206–213. [Google Scholar]
- Li, J.; Ye, M.; Pu, R.; Liu, Y.; Guo, Q.; Feng, B.; Huang, R.; He, G. Spatiotemporal Change Patterns of Coastlines in Zhejiang Province, China, Over the Last Twenty-Five Years. Sustainability 2018, 10, 477. [Google Scholar] [CrossRef]
- Switzer, A.D.; Sloss, C.R.; Horton, B.P.; Zong, Y.Q. Preparing for coastal change Introduction. Quat. Sci. Rev. 2012, 54, 1–3. [Google Scholar] [CrossRef]
- Yan, Y.; Zhang, Z.; Wang, C.; Zhang, L.; Huang, Y.; Zhang, J. Analysis of recent coastline evolution due to marine reclamation projects in the Qinzhou Bay. Pol. Marit. Res. 2017, 24, 188–194. [Google Scholar] [CrossRef][Green Version]
- Sener, E.; Davraz, A.; Şener, S. Investigation of Aksehir and Eber Lakes (SW Turkey) Coastline Change with Multitemporal Satellite Images. Water Resour. Manag. 2009, 24, 727–745. [Google Scholar] [CrossRef]
- Zhu, G.; Xu, X. Annual Processes of Land Reclamation from the Sea Along the Northwest Coast of Bohai Bay During 1974 to 2010. Sci. Geogr. Sin. 2012, 32, 1006–1012. [Google Scholar]
- Alesheikh, A.A.; Ghorbanali, A.; Nouri, N. Coastline change detection using remote sensing. Int. J. Environ. Sci. Technol. 2007, 4, 61–66. [Google Scholar] [CrossRef]
- Moore, L.J. Shoreline mapping techniques. J. Coast. Res. 2000, 16, 111–124. [Google Scholar]
- Saleem, A.; Awange, J. Coastline shift analysis in data deficient regions: Exploiting the high spatio-temporal resolution Sentinel-2 products. Catena 2019, 179, 6–19. [Google Scholar] [CrossRef]
- Nassar, K.; Fath, H.; Mahmod, W.E.; Masria, A.; Nadaoka, K.; Negm, A. Automatic detection of shoreline change: Case of North Sinai coast, Egypt. J. Coast. Conserv. 2018, 22, 1057–1083. [Google Scholar] [CrossRef]
- Pradhan, B.; Rizeei, H.M.; Abdulle, A. Quantitative Assessment for Detection and Monitoring of Coastline Dynamics with Temporal RADARSAT Images. Remote Sens. 2018, 10, 1705. [Google Scholar] [CrossRef]
- Liu, H.; Jezek, K.C. Automated extraction of coastline from satellite imagery by integrating Canny edge detection and locally adaptive thresholding methods. Int. J. Remote Sens. 2004, 25, 937–958. [Google Scholar] [CrossRef]
- He, B.-J.; Zhao, Z.-Q.; Shen, L.-D.; Wang, H.-B.; Li, L.-G.; He, B.-J. An approach to examining performances of cool/hot sources in mitigating/enhancing land surface temperature under different temperature backgrounds based on landsat 8 image. Sustain. Cities Soc. 2019, 44, 416–427. [Google Scholar] [CrossRef]
- Li, X.; Damen, M.C. Coastline change detection with satellite remote sensing for environmental management of the Pearl River Estuary, China. J. Mar. Syst. 2010, 82, S54–S61. [Google Scholar] [CrossRef]
- Mishra, M.; Chand, P.; Pattnaik, N.; Kattel, D.B.; Panda, G.K.; Mohanti, M.; Baruah, U.D.; Chandniha, S.K.; Achary, S.; Mohanty, T. Response of long- to short-term changes of the Puri coastline of Odisha (India) to natural and anthropogenic factors: A remote sensing and statistical assessment. Environ. Earth Sci. 2019, 78, 338. [Google Scholar] [CrossRef]
- Kale, M.M.; Ataol, M.; Tekkanat, I.S. Assessment of shoreline alterations using a Digital Shoreline Analysis System: A case study of changes in the Yeşilırmak Delta in northern Turkey from 1953 to 2017. Environ. Monit. Assess. 2019, 191, 398. [Google Scholar] [CrossRef] [PubMed]
- Thoai, D.T.; Dang, A.N.; Oanh, N.T.K. Analysis of coastline change in relation to meteorological conditions and human activities in Ca mau cape, Viet Nam. Ocean Coast. Manag. 2019, 171, 56–65. [Google Scholar] [CrossRef]
- Wu, X.; Liu, C.; Wu, G. Spatial-Temporal Analysis and Stability Investigation of Coastline Changes: A Case Study in Shenzhen, China. IEEE J. Sel. Top. Appl. Earth Obs. Remote Sens. 2018, 11, 45–56. [Google Scholar] [CrossRef]
- Kuleli, T.; Guneroglu, A.; Karsli, F.; Dihkan, M. Automatic detection of shoreline change on coastal Ramsar wetlands of Turkey. Ocean Eng. 2011, 38, 1141–1149. [Google Scholar] [CrossRef]
- Romine, B.M.; Fletcher, C.; Frazer, L.; Genz, A.S.; Barbee, M.; Lim, S.-C. Historical Shoreline Change, Southeast Oahu, Hawaii; Applying Polynomial Models to Calculate Shoreline Change Rates. J. Coast. Res. 2009, 256, 1236–1253. [Google Scholar] [CrossRef]
- Ashton, A.; Donnelly, J.P.; Evans, R.L. A discussion of the potential impacts of climate change on the shorelines of the Northeastern USA. Mitig. Adapt. Strat. Glob. Chang. 2007, 13, 719–743. [Google Scholar] [CrossRef]
- Klein, M.; Lichter, M. Monitoring changes in shoreline position adjacent to the Hadera power station, Israel. Appl. Geogr. 2006, 26, 210–226. [Google Scholar] [CrossRef]
- Robertson, W.; Zhang, K.; Whitman, D. Hurricane-induced beach change derived from airborne laser measurements near Panama City, Florida. Mar. Geol. 2007, 237, 191–205. [Google Scholar] [CrossRef]
- Ruggiero, P.; Buijsman, M.; Kaminsky, G.M.; Gelfenbaum, G. Modeling the effects of wave climate and sediment supply variability on large-scale shoreline change. Mar. Geol. 2010, 273, 127–140. [Google Scholar] [CrossRef]
- Kermani, S.; Boutiba, M.; Guendouz, M.; Guettouche, M.S.; Khelfani, D. Detection and analysis of shoreline changes using geospatial tools and automatic computation: Case of jijelian sandy coast (East Algeria). Ocean Coast. Manag. 2016, 132, 46–58. [Google Scholar] [CrossRef]
- Ciritci, D.; Turk, T. Automatic Detection of Shoreline Change by Geographical Information System (GIS) and Remote Sensing in the Göksu Delta, Turkey. J. Indian Soc. Remote Sens. 2019, 47, 233–243. [Google Scholar] [CrossRef]
- Ozturk, D.; Beyazit, I.; Kilic, F. Spatiotemporal Analysis of Shoreline Changes of the Kizilirmak Delta. J. Coast. Res. 2015, 316, 1389–1402. [Google Scholar] [CrossRef]
- Mentaschi, L.; Vousdoukas, M.; Pekel, J.-F.; Voukouvalas, E.; Feyen, L. Global long-term observations of coastal erosion and accretion. Sci. Rep. 2018, 8, 12876. [Google Scholar] [CrossRef]
- Zhang, Y.; Hou, X. Characteristics of Coastline Changes on Southeast Asia Islands from 2000 to 2015. Remote Sens. 2020, 12, 519. [Google Scholar] [CrossRef]
- Storlazzi, C.; Gingerich, S.B.; Van Dongeren, A.; Cheriton, O.M.; Swarzenski, P.W.; Quataert, E.; Voss, C.; Field, D.W.; Annamalai, H.; Piniak, G.A.; et al. Most atolls will be uninhabitable by the mid-21st century because of sea-level rise exacerbating wave-driven flooding. Sci. Adv. 2018, 4, eaap9741. [Google Scholar] [CrossRef]
- Giardino, A.; Nederhoff, K.; Vousdoukas, M. Coastal hazard risk assessment for small islands: Assessing the impact of climate change and disaster reduction measures on Ebeye (Marshall Islands). Reg. Environ. Chang. 2018, 18, 2237–2248. [Google Scholar] [CrossRef]
- Dedekorkut-Howes, A.; Torabi, E.; Howes, M. When the tide gets high: A review of adaptive responses to sea level rise and coastal flooding. J. Environ. Plan. Manag. 2020, 1–42. [Google Scholar] [CrossRef]
- Romine, B.M.; Fletcher, C. A Summary of Historical Shoreline Changes on Beaches of Kauai, Oahu, and Maui, Hawaii. J. Coast. Res. 2013, 288, 605–614. [Google Scholar] [CrossRef]
- Connell, J. Losing ground? Tuvalu, the greenhouse effect and the garbage can. Asia Pac. Viewp. 2003, 44, 89–107. [Google Scholar] [CrossRef]
- Collen, J.; Garton, D.W.; Gardner, J.P.A. Shoreline Changes and Sediment Redistribution at Palmyra Atoll (Equatorial Pacific Ocean): 1874–Present. J. Coast. Res. 2009, 253, 711–722. [Google Scholar] [CrossRef]
- Sandhyavitri, A.; Fatnanta, F.; Husaini, R.R.; Suprayogi, I. Combination of a Coastal Vulnerability Index (CVI) and social economic approaches in prioritizing the development of Riau Coastlines, Indonesia. In Proceedings of the MATEC Web of Conferences, Bali, Indonesia, 24–25 October 2018; EDP Sciences: Les Ulis, France, 2019; Volume 276, p. 02006. [Google Scholar]
- Reese, S.; Cousins, W.J.; Power, W.L.; Palmer, N.G.; Tejakusuma, I.G.; Nugrahadi, S. Tsunami vulnerability of buildings and people in South Java—Field observations after the July 2006 Java tsunami. Nat. Hazards Earth Syst. Sci. 2007, 7, 573–589. [Google Scholar] [CrossRef]
- Borrero, J.C. Field Survey of Northern Sumatra and Banda Aceh, Indonesia after the Tsunami and Earthquake of 26 December 2004. Seism. Res. Lett. 2005, 76, 312–320. [Google Scholar] [CrossRef]
- Saatcioglu, M.; Ghobarah, A.; Nistor, I. Performance of Structures in Indonesia during the December 2004 Great Sumatra Earthquake and Indian Ocean Tsunami. Earthq. Spectra 2006, 22, 295–319. [Google Scholar] [CrossRef]
- Borrero, J.C.; Weiss, R.; Okal, E.A.; Hidayat, R.; Arcas, D.; Titov, V. The tsunami of 2007 September 12, Bengkulu province, Sumatra, Indonesia: Post-tsunami field survey and numerical modelling. Geophys. J. Int. 2009, 178, 180–194. [Google Scholar] [CrossRef]
- Paulik, R.; Gusman, A.; Williams, J.H.; Pratama, G.M.; Lin, S.-L.; Prawirabhakti, A.; Sulendra, K.; Zachari, M.Y.; Fortuna, Z.E.D.; Layuk, N.B.P.; et al. Tsunami Hazard and Built Environment Damage Observations from Palu City after the September 28 2018 Sulawesi Earthquake and Tsunami. Pure Appl. Geophys. 2019, 176, 3305–3321. [Google Scholar] [CrossRef]
- Marfai, M.A.; Almohamad, H.; Dey, S.; Susanto, B.; King, L. Coastal dynamic and shoreline mapping: Multi-sources spatial data analysis in Semarang Indonesia. Environ. Monit. Assess. 2007, 142, 297–308. [Google Scholar] [CrossRef]
- Dewi, R.S.; Bijker, W. Dynamics of shoreline changes in the coastal region of Sayung, Indonesia. Egypt. J. Remote Sens. Space Sci. 2019. [Google Scholar] [CrossRef]
- Julzarika, A. Utilization of LAPAN Satellite (TUBSAT, A2, and A3) in supporting Indonesia’s potential as maritime center of the world. In 3rd International Symposium on Lapan-Ipb Satellite for Food Security and Environmental Monitoring 2016; Setiawan, Y., Ed.; Iop Publishing Ltd.: Bristol, UK, 2017; Volume 54. [Google Scholar]
- Yu, C.; Wang, J.; Xu, J.; Peng, R.; Cheng, Y.; Wang, M. Advance of Coastline Extraction Technology. J. Geomat. Sci. Technol. 2014, 31, 305–309. [Google Scholar]
- Esmail, M.; Mahmod, W.E.; Fath, H. Assessment and prediction of shoreline change using multi-temporal satellite images and statistics: Case study of Damietta coast, Egypt. Appl. Ocean Res. 2019, 82, 274–282. [Google Scholar] [CrossRef]
- Zhou, M.; Wu, M.; Zhang, G.; Zhao, L.; Hou, X.; Yang, Y. Analysis of Coastal Zone Data of Northern Yantai Collected by Remote Sensing from 1990 to 2018. Appl. Sci. 2019, 9, 4466. [Google Scholar] [CrossRef]
- Deng, S. ENVI Remote Sensing Image Processing Method; Higher Education Press: Beijing, China, 2014. [Google Scholar]
- McFeeters, S.K. The use of the Normalized Difference Water Index (NDWI) in the delineation of open water features. Int. J. Remote Sens. 1996, 17, 1425–1432. [Google Scholar] [CrossRef]
- Otsu, N. A Threshold Selection Method from Gray-Level Histograms. IEEE Trans. Syst. Man Cybern. 1979, 9, 62–66. [Google Scholar] [CrossRef]
- Liu, B.; Meng, W.; Zhao, J.; Hu, B.; Liu, L.; Zhang, F. Variation of Coastline Resources Utilization in China from 1990 to 2013. J. Nat. Resour. 2015, 30, 2033–2044. [Google Scholar]
- Hou, X.; Wu, T.; Wang, Y.; Xu, X.; Chen, Q.; Yu, L. Extraction and accuracy evaluation of multi-temporal coastl-ines of mainland China since 1940s. Mar. Sci. 2014, 38, 66–73. [Google Scholar]
- Suo, A.; Cao, K.; Ma, H.; Wang, Q.; Yu, Y. Discussion on Classification System of Coastline. Sci. Geogr. Sin. 2015, 35, 933–937. [Google Scholar]
- Sun, W.; Ma, Y.; Zhang, J.; Liu, S.; Ren, G. Study of Remote Sensing Interpretation Keys and Extraction Technique of Different types of Shoreline. Bull. Surv. Mapp. 2011, 41–44. [Google Scholar]
- Ge, X.; Sun, X.; Liu, Z. Object-oriented coastline classification and extraction from remote sensing imagery. In Remote Sensing of the Environment: 18th National Symposium on Remote Sensing of China; Tong, Q., Shan, J., Zhu, B., Eds.; Spie-Int Soc Optical Engineering: Bellingham, WA, USA, 2014; Volume 9158. [Google Scholar] [CrossRef]
- Wu, T.; Hou, X.; Xu, X. Spatio-temporal characteristics of the mainland coastline utilization degree over the last 70 years in China. Ocean Coast. Manag. 2014, 98, 150–157. [Google Scholar] [CrossRef]
- Wu, C. An Analysis of the Rise of Indonesia’s Economy and the Challenges it Faces; Crossroads Southeast Asian Studies: Guangxi, China, 2013. [Google Scholar]
- Torresan, S.; Critto, A.; Valle, M.D.; Harvey, N.; Casini, M. Assessing coastal vulnerability to climate change: Comparing segmentation at global and regional scales. Sustain. Sci. 2008, 3, 45–65. [Google Scholar] [CrossRef]
- Rao, K.N.; Subraelu, P.; Rao, T.V.; Malini, B.H.; Ratheesh, R.; Bhattacharya, S.; Rajawat, A.S. Ajai Sea-level rise and coastal vulnerability: An assessment of Andhra Pradesh coast, India through remote sensing and GIS. J. Coast. Conserv. 2008, 12, 195–207. [Google Scholar] [CrossRef]
- Yin, J.; Yin, Z.; Wang, J.; Xu, S. National assessment of coastal vulnerability to sea-level rise for the Chinese coast. J. Coast. Conserv. 2012, 16, 123–133. [Google Scholar] [CrossRef]
- Islam, A.; Mitra, D.; Dewan, A.; Akhter, S.H. Coastal multi-hazard vulnerability assessment along the Ganges deltaic coast of Bangladesh—A geospatial approach. Ocean Coast. Manag. 2016, 127, 1–15. [Google Scholar] [CrossRef]
- Zhang, K.; Douglas, B.C.; Leatherman, S.P. Global Warming and Coastal Erosion. Clim. Chang. 2004, 64, 41–58. [Google Scholar] [CrossRef]
- Lentz, E.; Thieler, E.; Plant, N.G.; Stippa, S.R.; Horton, R.M.; Gesch, D. Evaluation of dynamic coastal response to sea-level rise modifies inundation likelihood. Nat. Clim. Chang. 2016, 6, 696–700. [Google Scholar] [CrossRef]
- Watson, C.S.; White, N.J.; Church, J.A.; King, M.; Burgette, R.J.; Legresy, B. Unabated global mean sea-level rise over the satellite altimeter era. Nat. Clim. Chang. 2015, 5, 565–568. [Google Scholar] [CrossRef]
- Domingues, C.; Church, J.A.; White, N.J.; Gleckler, P.J.; Wijffels, S.E.; Barker, P.M.; Dunn, J.R. Improved estimates of upper-ocean warming and multi-decadal sea-level rise. Nature 2008, 453, 1090–1093. [Google Scholar] [CrossRef]
- Borrero, J.C. Field Data and Satellite Imagery of Tsunami Effects in Banda Aceh. Science 2005, 308, 1596. [Google Scholar] [CrossRef]
- Marfai, M.A.; King, L. Monitoring land subsidence in Semarang, Indonesia. Environ. Earth Sci. 2007, 53, 651–659. [Google Scholar] [CrossRef]
- Murdiyarso, D.; Purbopuspito, J.; Kauffman, J.B.; Warren, M.; Sasmito, S.D.; Donato, D.C.; Manuri, S.; Krisnawati, H.; Taberima, S.; Kurnianto, S. The potential of Indonesian mangrove forests for global climate change mitigation. Nat. Clim. Chang. 2015, 5, 1089–1092. [Google Scholar] [CrossRef]
- Wang, J.; Sui, L.; Yang, X.; Wang, Z.; Liu, Y.; Kang, J.; Lu, C.; Yang, F.; Liu, B. Extracting Coastal Raft Aquaculture Data from Landsat 8 OLI Imagery. Sensors 2019, 19, 1221. [Google Scholar] [CrossRef] [PubMed]
- Wang, Z.; Yang, X.; Su, F.; Zhang, H.; Yan, F.; Zhang, J. Remote Sensing Application in China’s Coastal Zones and Islands: Recent Progress and Some Suggestions. Chin. J. Eng. Sci. 2019, 21, 59–63. [Google Scholar] [CrossRef]
- Wang, Z.; Yang, X.; Liu, Y.; Lu, C. Extraction of coastal raft cultivation area with heterogeneous water background by thresholding object-based visually salient NDVI from high spatial resolution imagery. Remote Sens. Lett. 2018, 9, 839–846. [Google Scholar] [CrossRef]
- Wang, Z.; Yang, X.; Lü, C.; Yang, F. A scale self-adapting segmentation approach and knowledge transfer for automatically updating land use/cover change databases using high spatial resolution images. Int. J. Appl. Earth Obs. Geoinf. 2018, 69, 88–98. [Google Scholar] [CrossRef]
- Lü, C.; Yang, X.; Wang, Z.; Li, Z. Using multi-level fusion of local features for land-use scene classification with high spatial resolution images in urban coastal zones. Int. J. Appl. Earth Obs. Geoinf. 2018, 70, 1–12. [Google Scholar] [CrossRef]


| Primary Categories | Secondary Categories | Description |
|---|---|---|
| Natural coastline | Bedrock coastline | The coastline is tortuous, the waterway is clearly demarcated, and the tone is darker |
| Silt coastline | Beach broad smooth surface, to the roadside vegetation lush, sparse vegetation seaward side | |
| Mangrove coastline | Distributed in pieces, mostly branch-like water systems, reddish hue, brighter than land vegetation | |
| Sandy coastline | Generally composed of loose, very soft, very fine materials such as sand, silt, and sludge, consisting of relatively straight coastline and relatively wide, relatively long beaches, there is generally sand in the bay at high tide | |
| Artificial coastline | Harbor and Wharf | Convex embankment, harbor pool markers, smooth texture |
| Embankment | The boundary between the outer edge of the sea, such as ports, docks, storage land, towns, and industrial land, and the waterway of the ocean is generally distributed on a large scale with certain brightness, but this is not uniform. | |
| Agricultural | A rectangular grid arrangement, color red, uniform texture |
| Landsat 5 | Landsat 8 | ||||
|---|---|---|---|---|---|
| Band Name | Band Width (μm) | Resolution(m) | Band Name | Band Width (μm) | Resolution(m) |
| Band 1 Coastal | 0.43–0.45 | 30 | |||
| Band 1 Blue | 0.45–0.52 | 30 | Band 2 Blue | 0.45–0.51 | 30 |
| Band 2 Green | 0.52–0.60 | 30 | Band 3 Green | 0.53–0.59 | 30 |
| Band 3 Red | 0.63–0.69 | 30 | Band 4 Red | 0.64–0.67 | 30 |
| Band 4 NIR | 0.76–0.90 | 30 | Band 5 NIR | 0.85–0.88 | 30 |
| Band 5 SWIR | 1.55–1.75 | 30 | Band 6 SWIR 1 | 1.57–1.65 | 30 |
| Band 6 LWIR | 10.40–12.5 | 120 | Band 7 SWIR 2 | 2.11–2.29 | 30 |
| Band 7 SWIR | 2.08–2.35 | 30 | Band 8 Pan | 0.50–0.68 | 15 |
| Band 9 Cirrus | 1.36–1.38 | 30 | |||
| Band 10 TIRS1 | 10.6–11.19 | 100 | |||
| Band 11 TIRS2 | 11.5–12.51 | 100 | |||
| Utilization | Bedrock Coastline | Silt Coastline | Mangrove Coastline | Sandy Coastline | Harbor and Wharf | Embankment | Agricultural |
|---|---|---|---|---|---|---|---|
| Index | 1 | 2 | 2 | 1 | 4 | 4 | 3 |
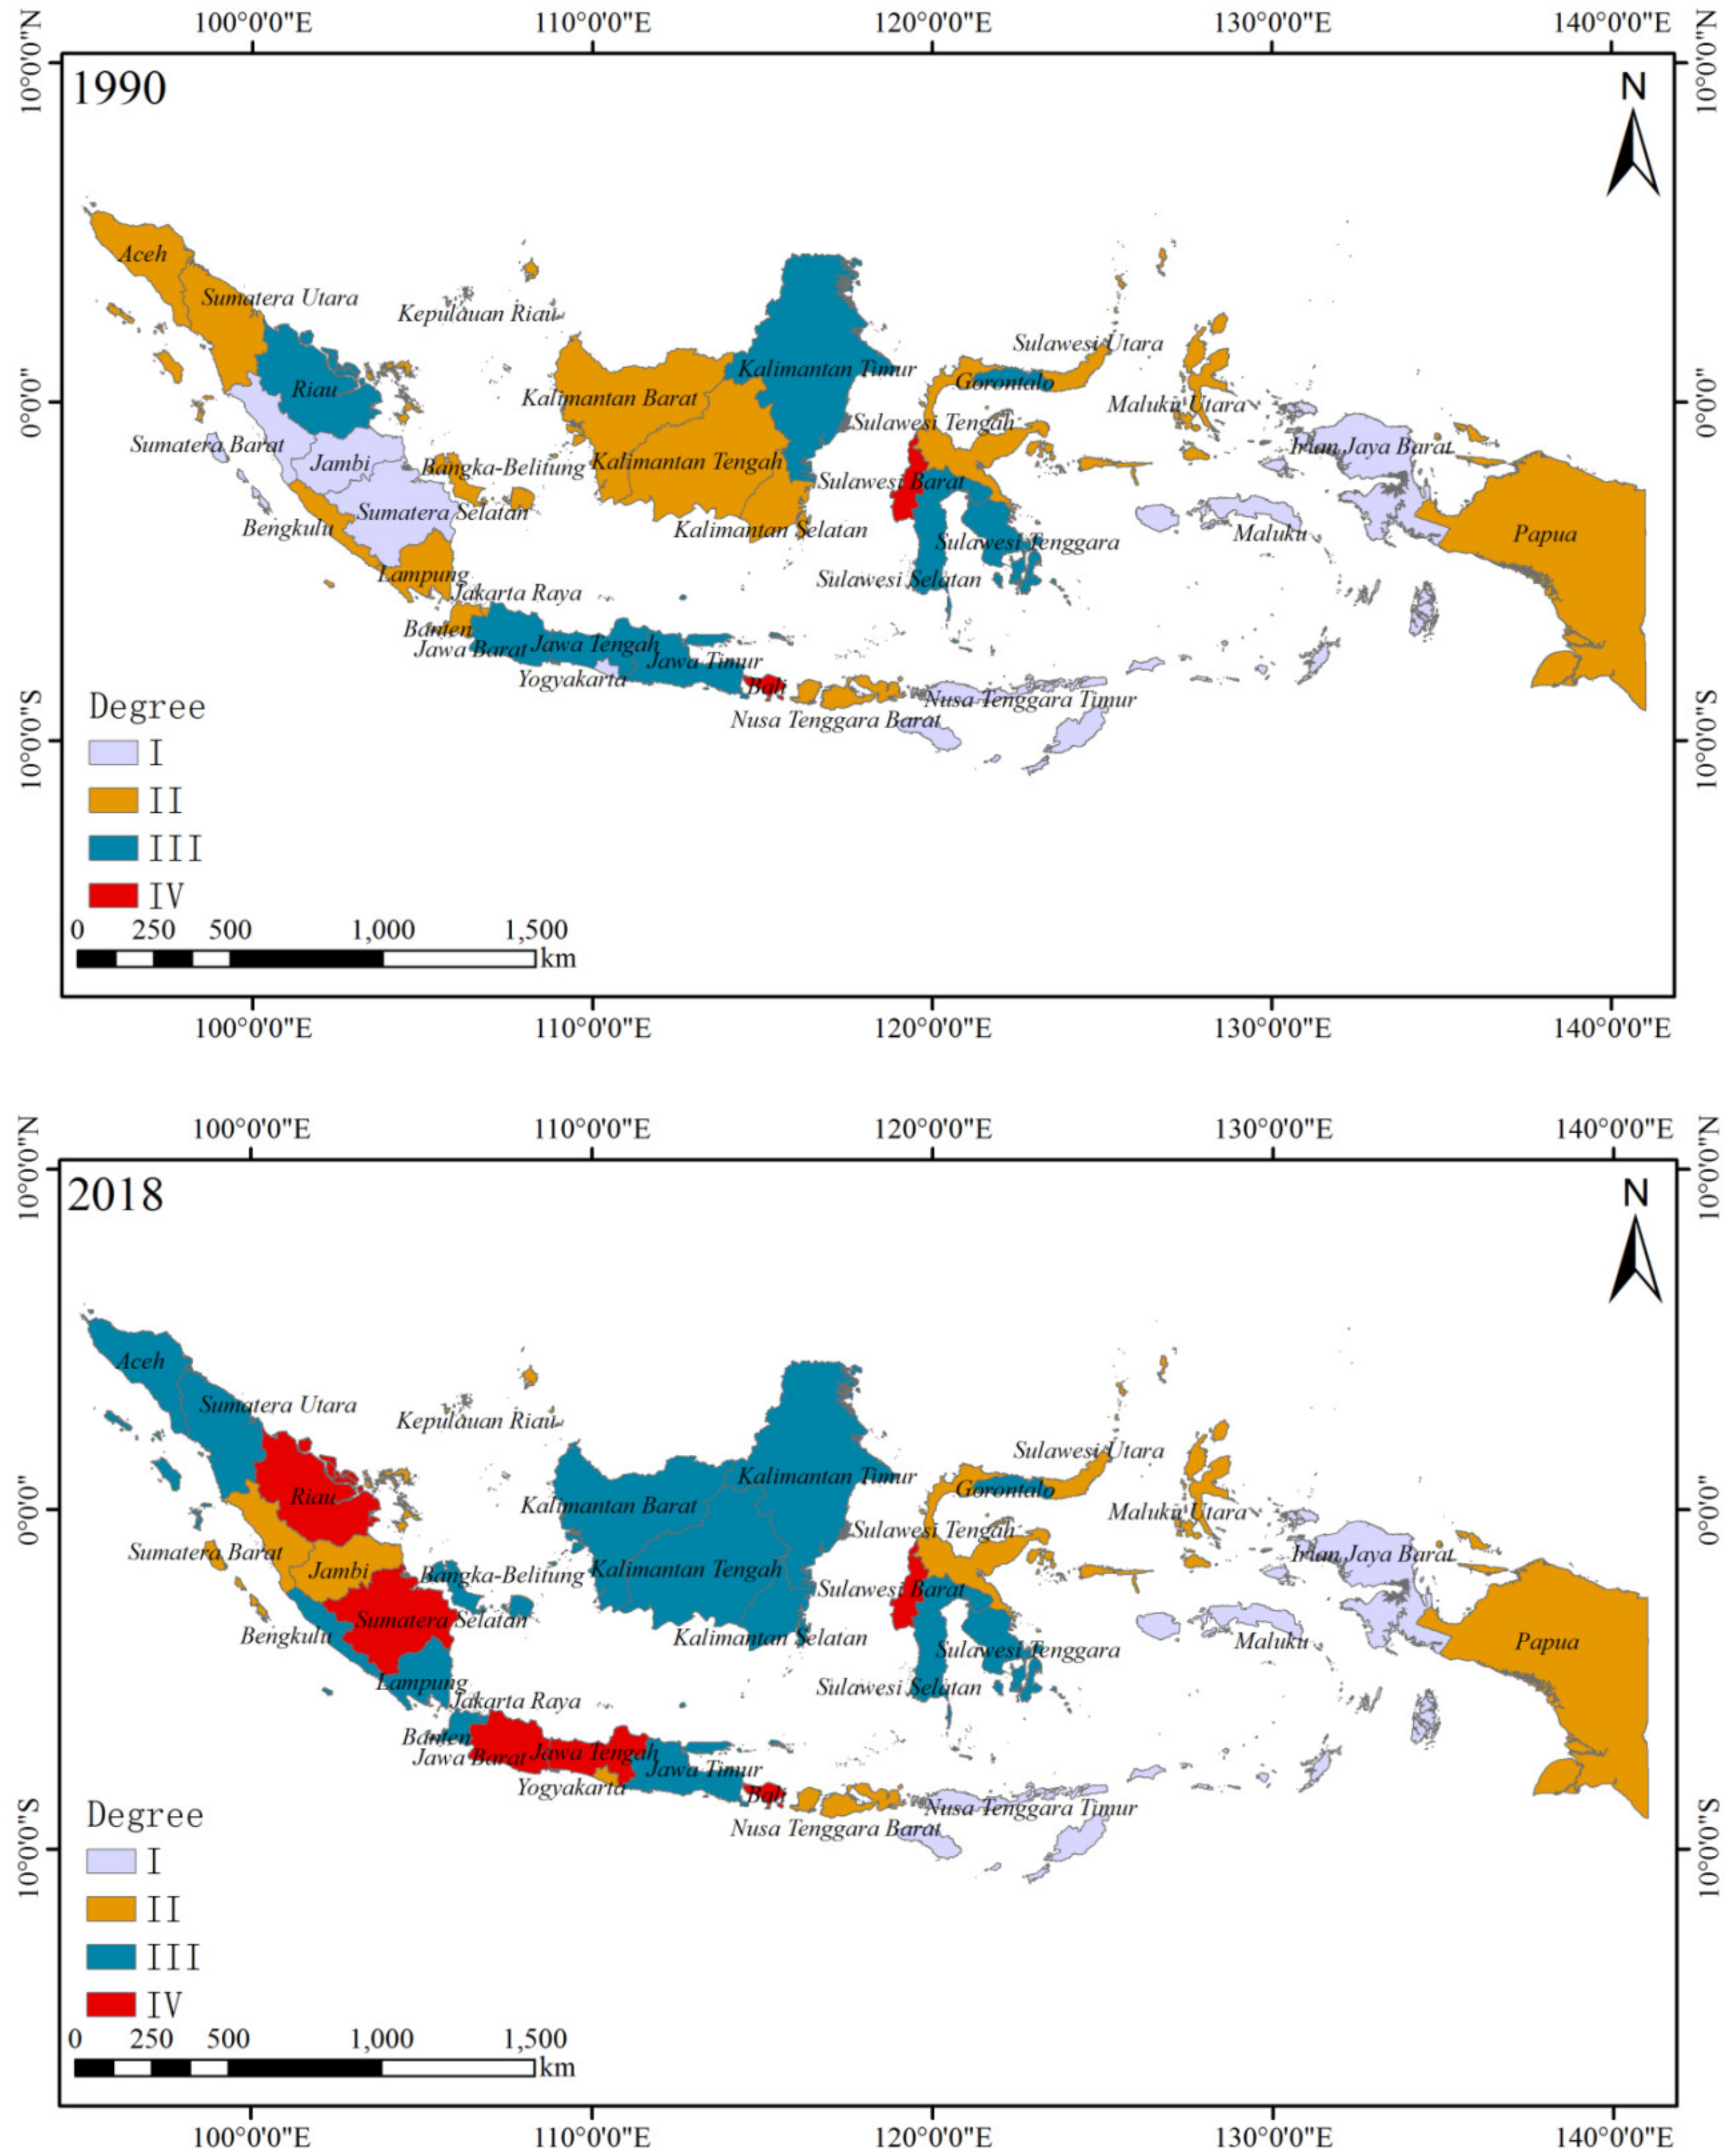
| Degree | I | II | III | IV |
|---|---|---|---|---|
| ICUD | <150 | 150–200 | 200–250 | >250 |
© 2020 by the authors. Licensee MDPI, Basel, Switzerland. This article is an open access article distributed under the terms and conditions of the Creative Commons Attribution (CC BY) license (http://creativecommons.org/licenses/by/4.0/).
Share and Cite
Sui, L.; Wang, J.; Yang, X.; Wang, Z. Spatial-Temporal Characteristics of Coastline Changes in Indonesia from 1990 to 2018. Sustainability 2020, 12, 3242. https://doi.org/10.3390/su12083242
Sui L, Wang J, Yang X, Wang Z. Spatial-Temporal Characteristics of Coastline Changes in Indonesia from 1990 to 2018. Sustainability. 2020; 12(8):3242. https://doi.org/10.3390/su12083242
Chicago/Turabian StyleSui, Lichun, Jun Wang, Xiaomei Yang, and Zhihua Wang. 2020. "Spatial-Temporal Characteristics of Coastline Changes in Indonesia from 1990 to 2018" Sustainability 12, no. 8: 3242. https://doi.org/10.3390/su12083242
APA StyleSui, L., Wang, J., Yang, X., & Wang, Z. (2020). Spatial-Temporal Characteristics of Coastline Changes in Indonesia from 1990 to 2018. Sustainability, 12(8), 3242. https://doi.org/10.3390/su12083242