Nitrous Oxide Emissions and Methane Uptake from Organic and Conventionally Managed Arable Crop Rotations on Farms in Northwest Germany


Abstract
1. Introduction
2. Materials and Methods
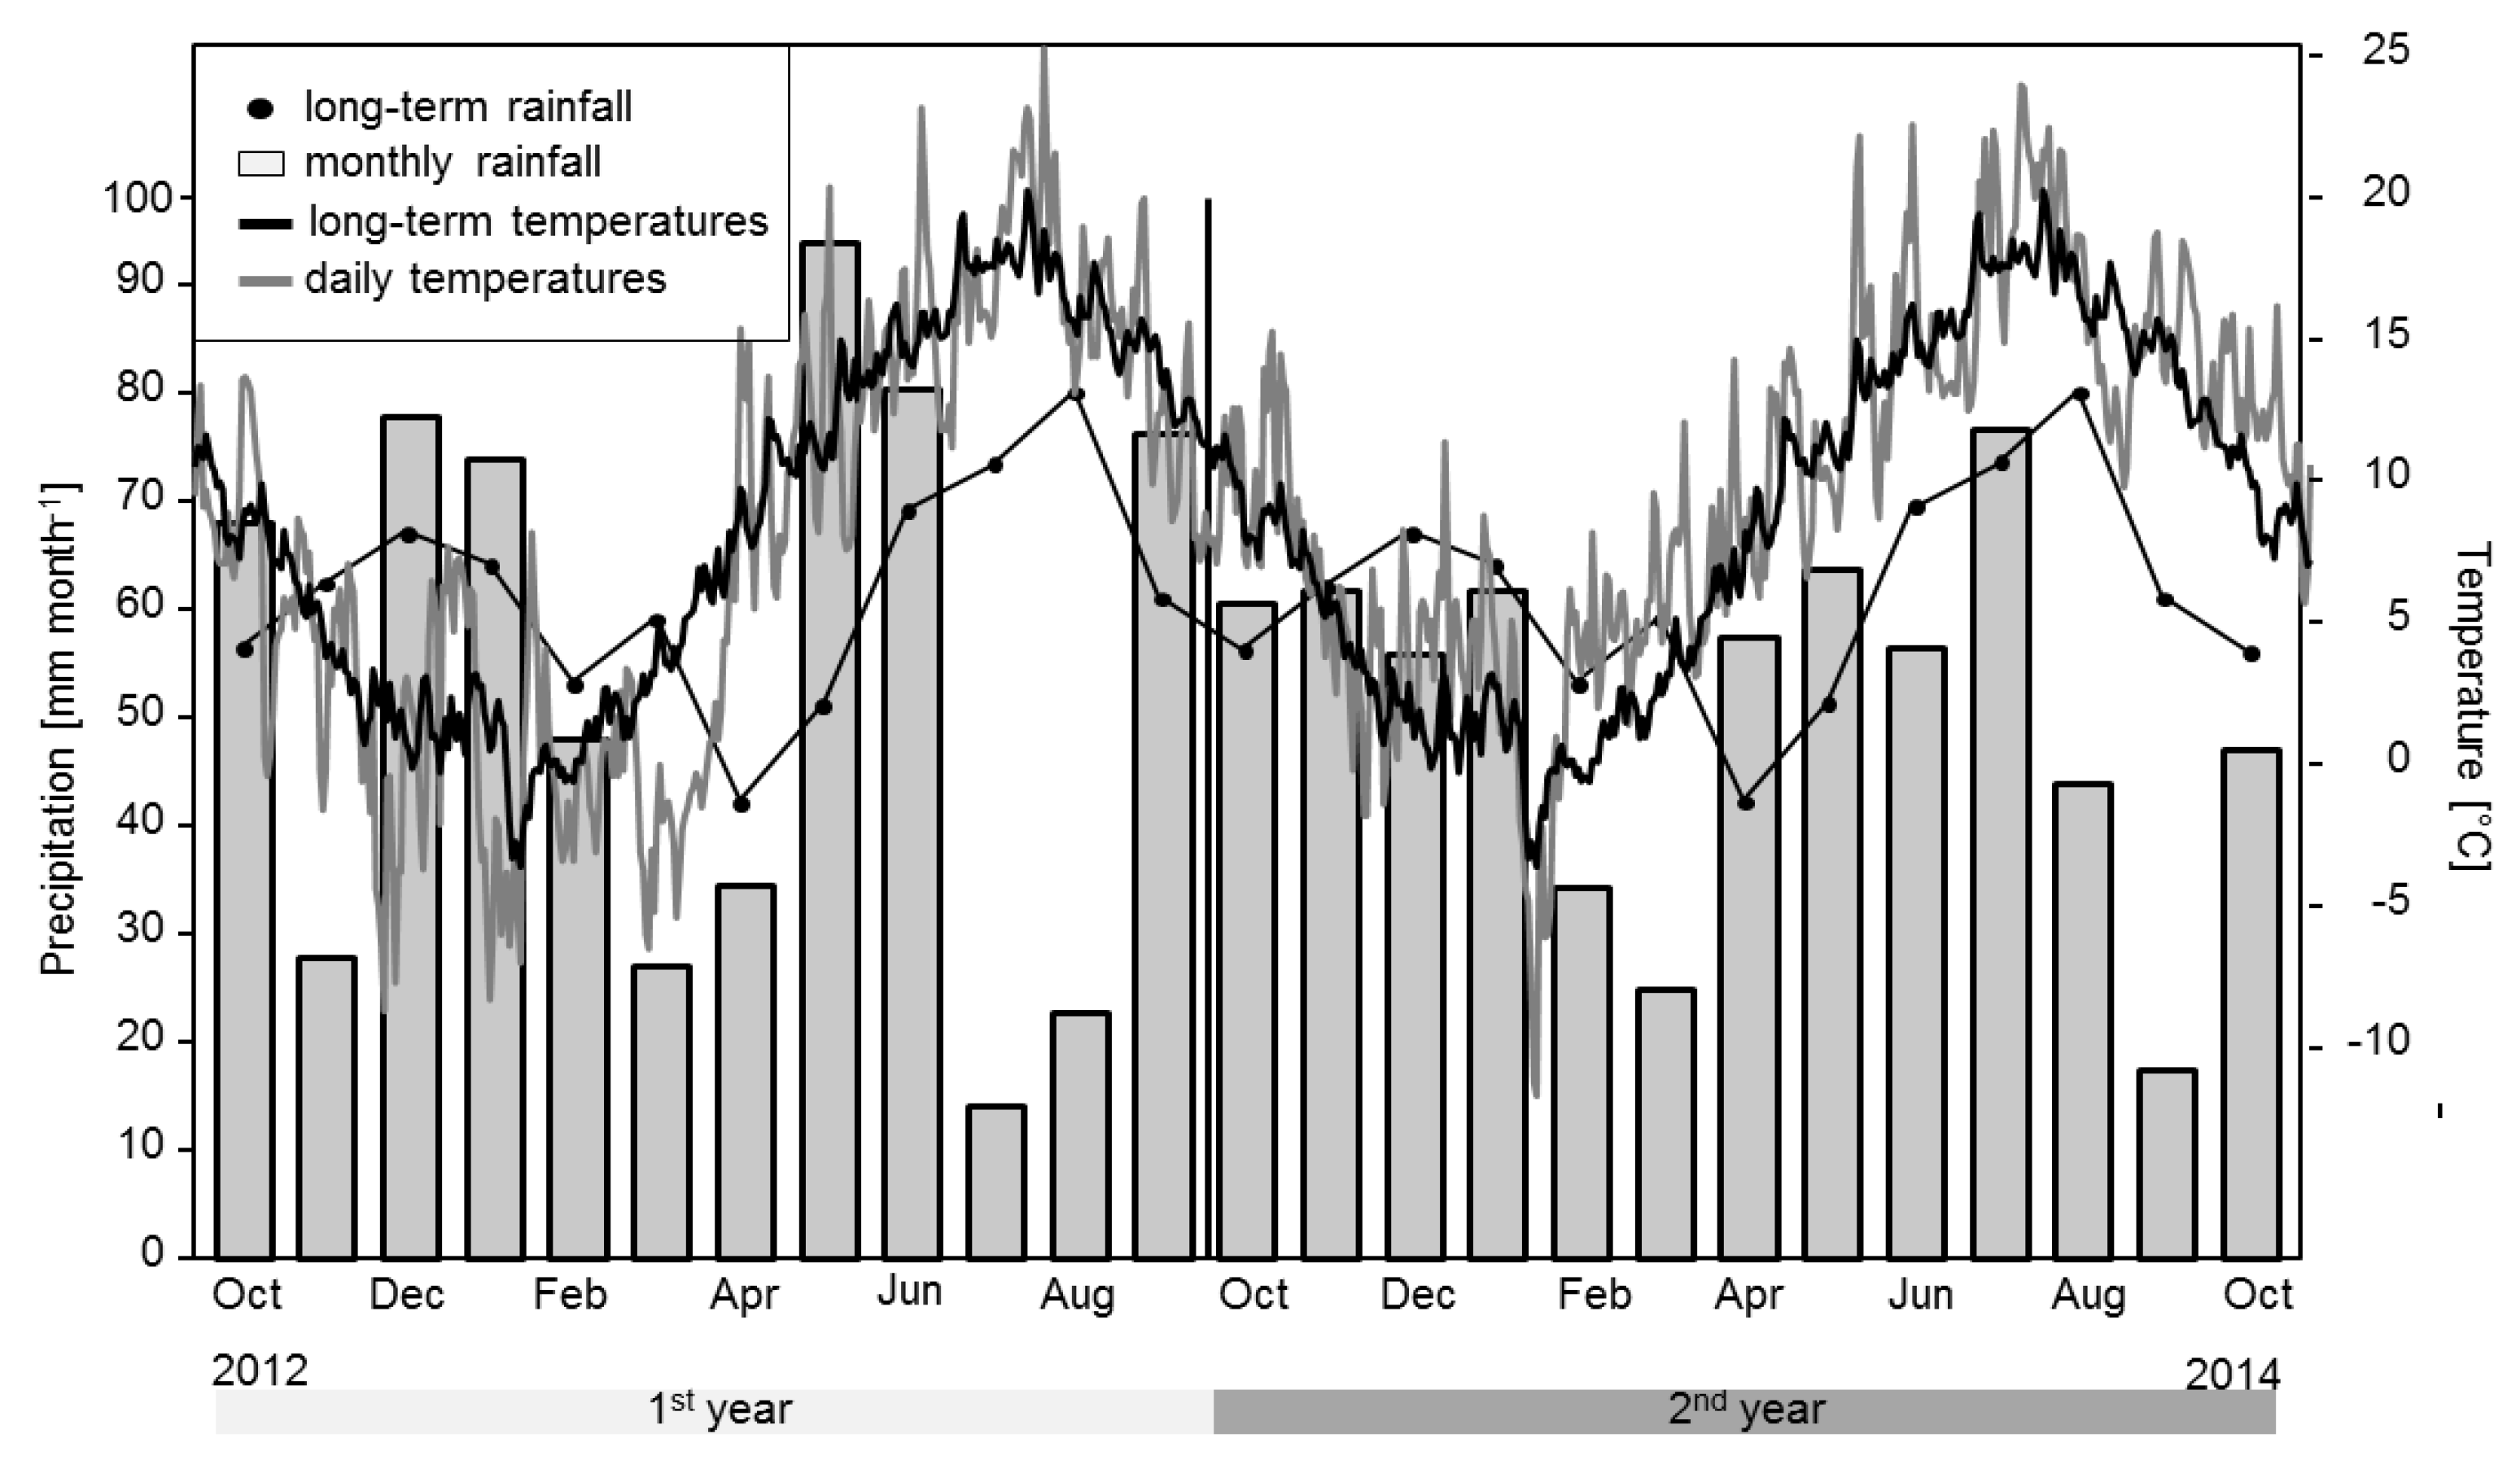
2.1. Research Area
2.2. On-Farm Research Design
2.3. Crop Rotations, N Inputs and Crop Management
2.4. Flux-Measurements
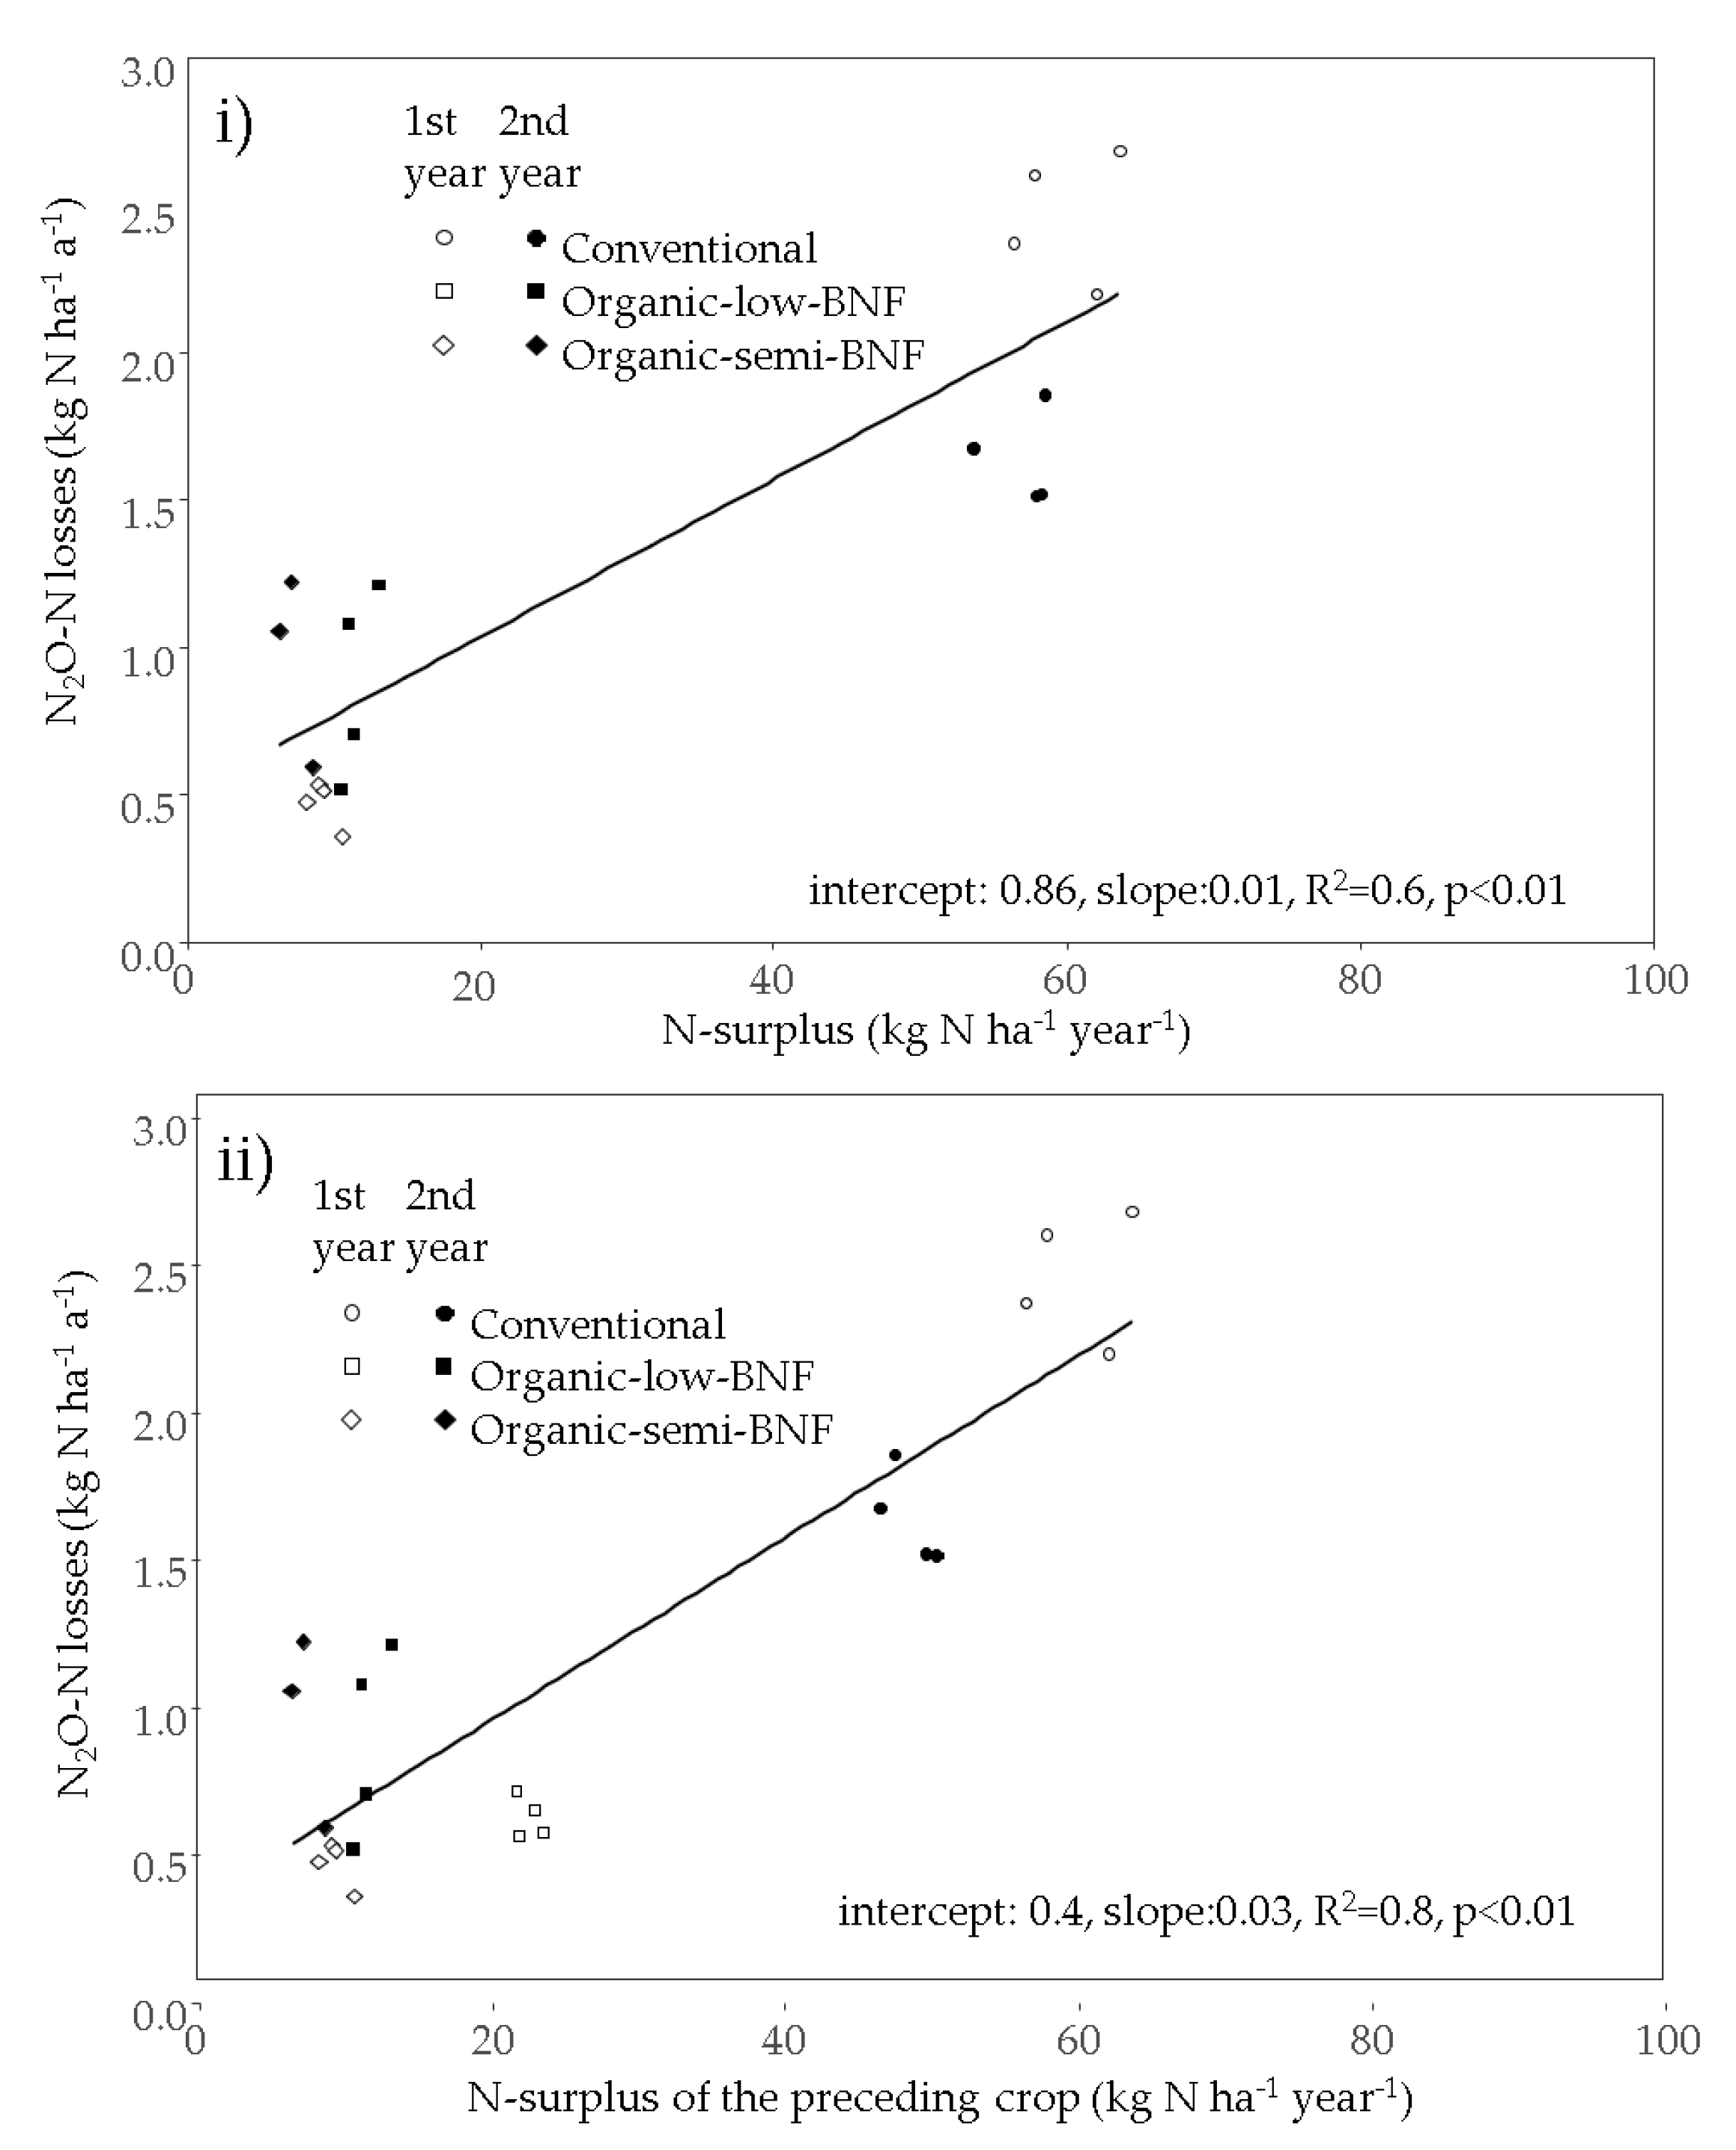
2.5. Determination of Yield and N-Balance
2.6. Statistical Analysis
3. Results
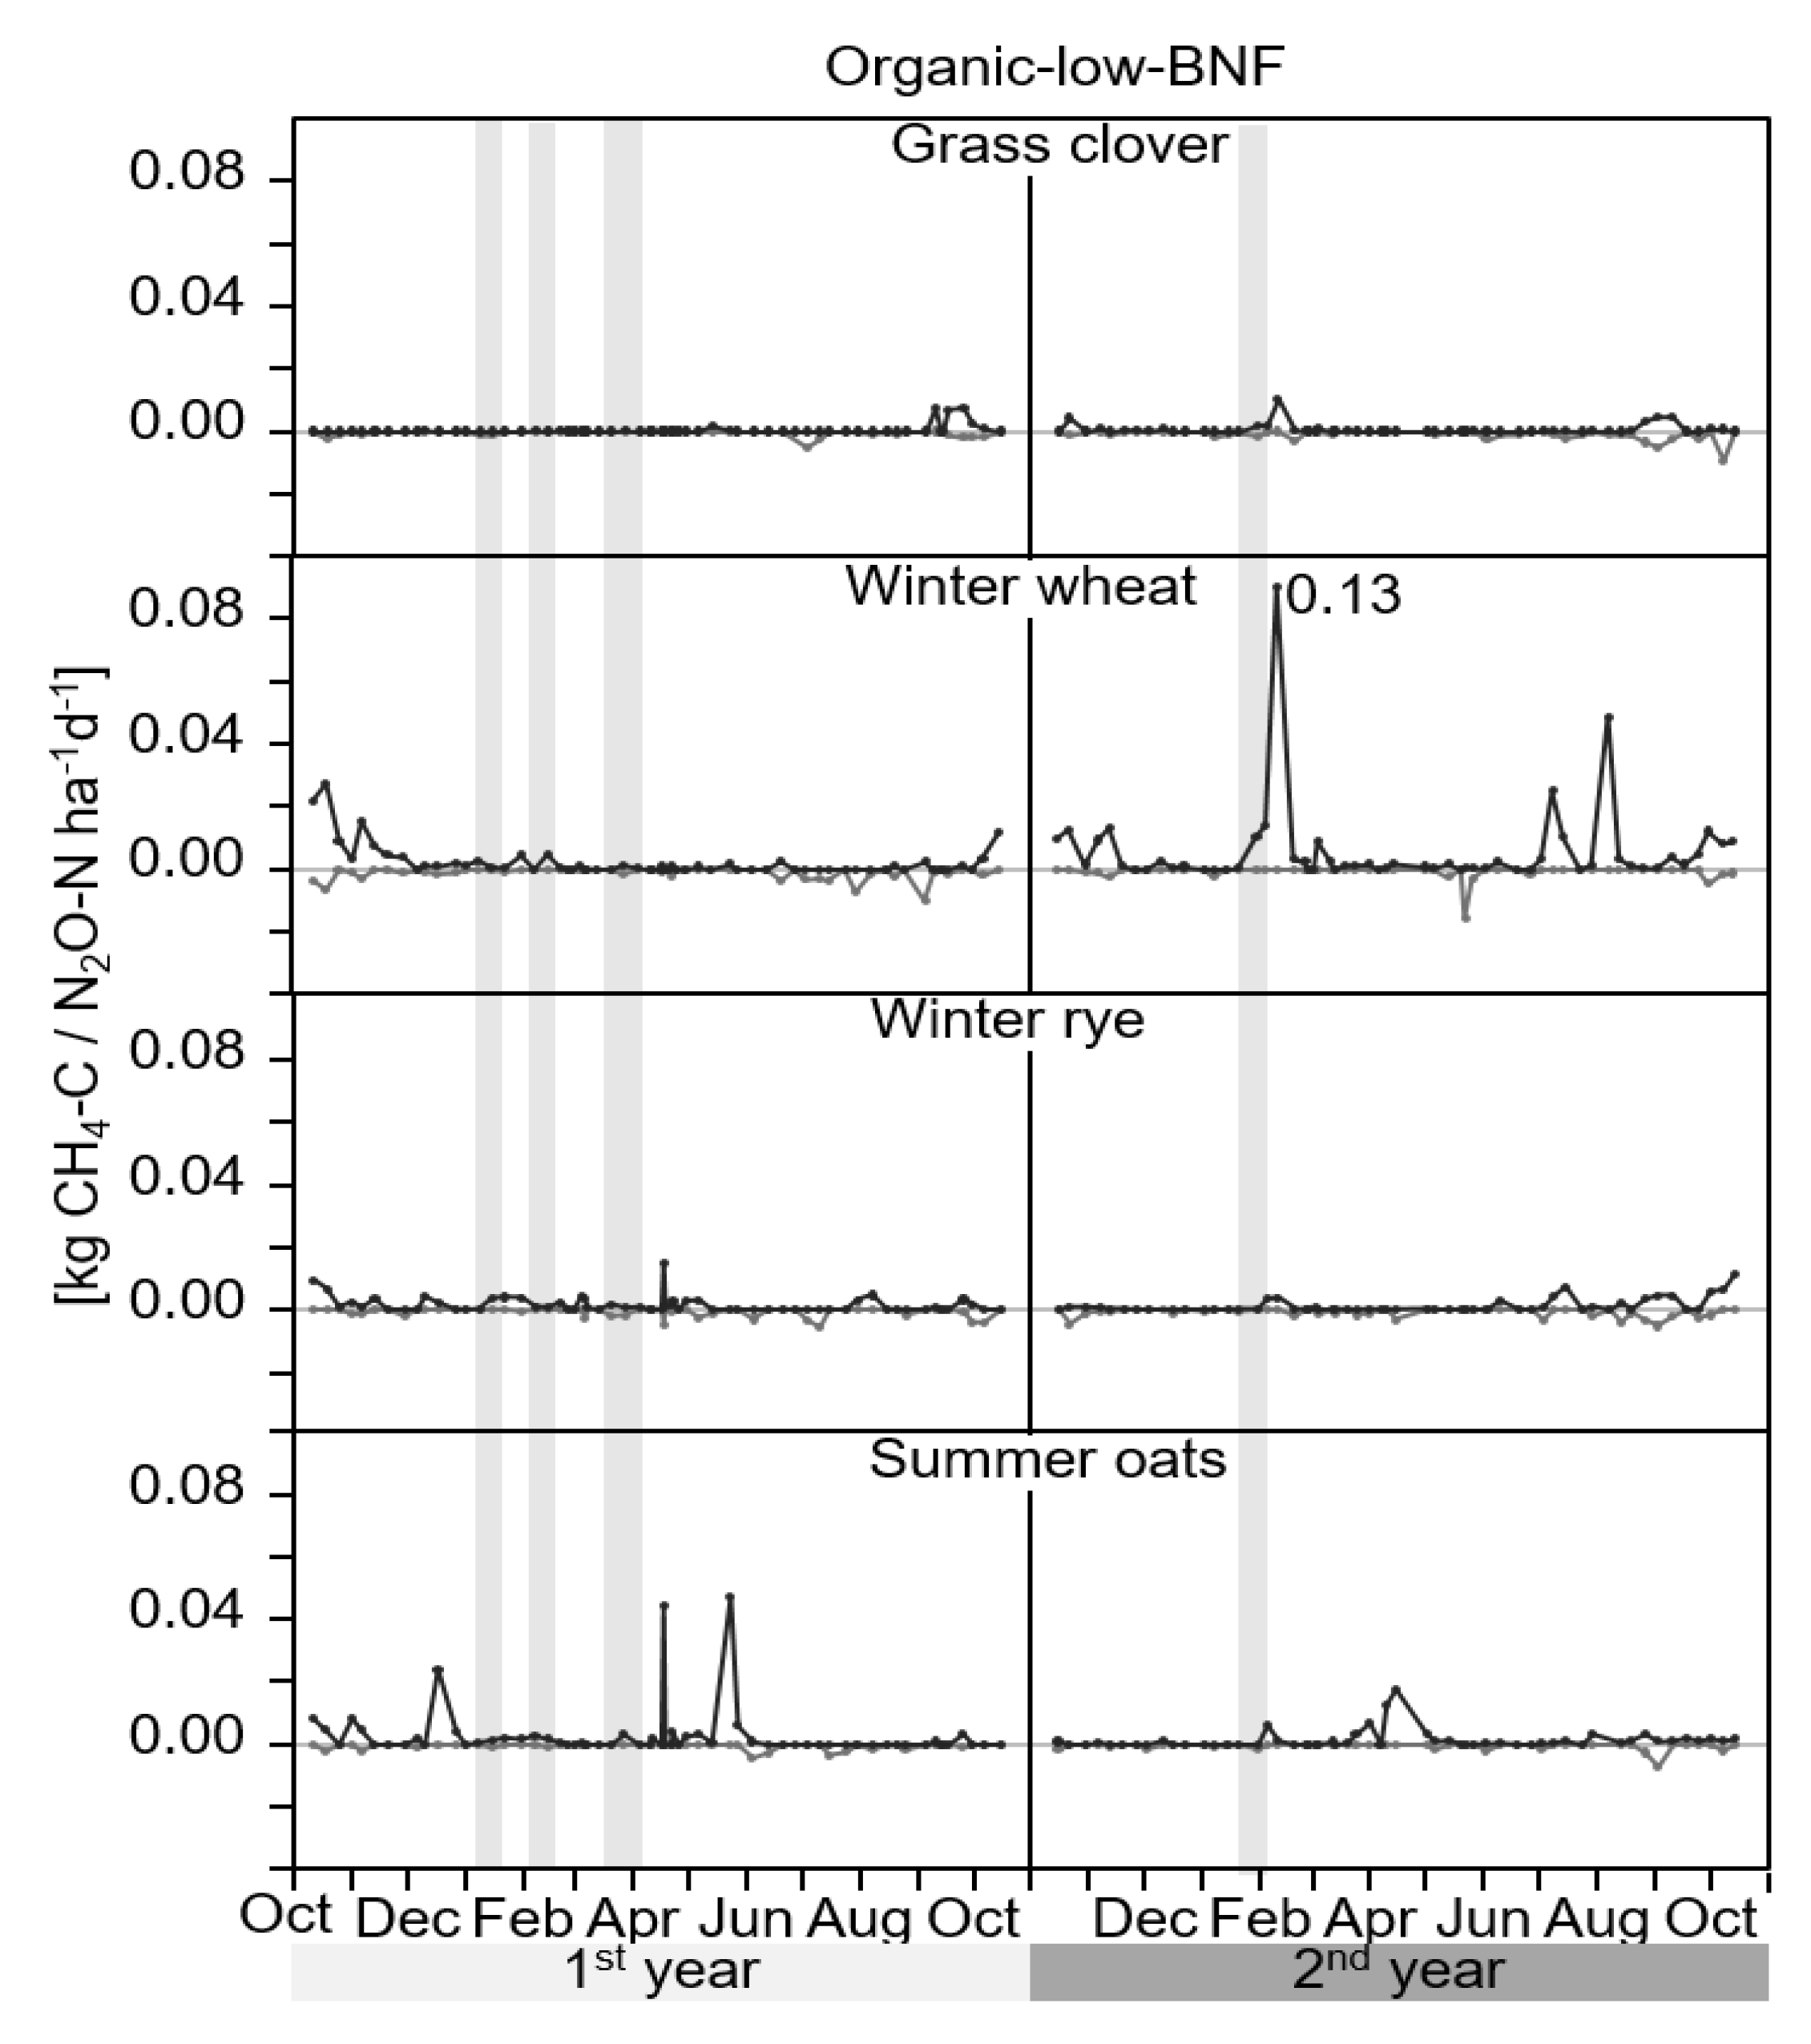
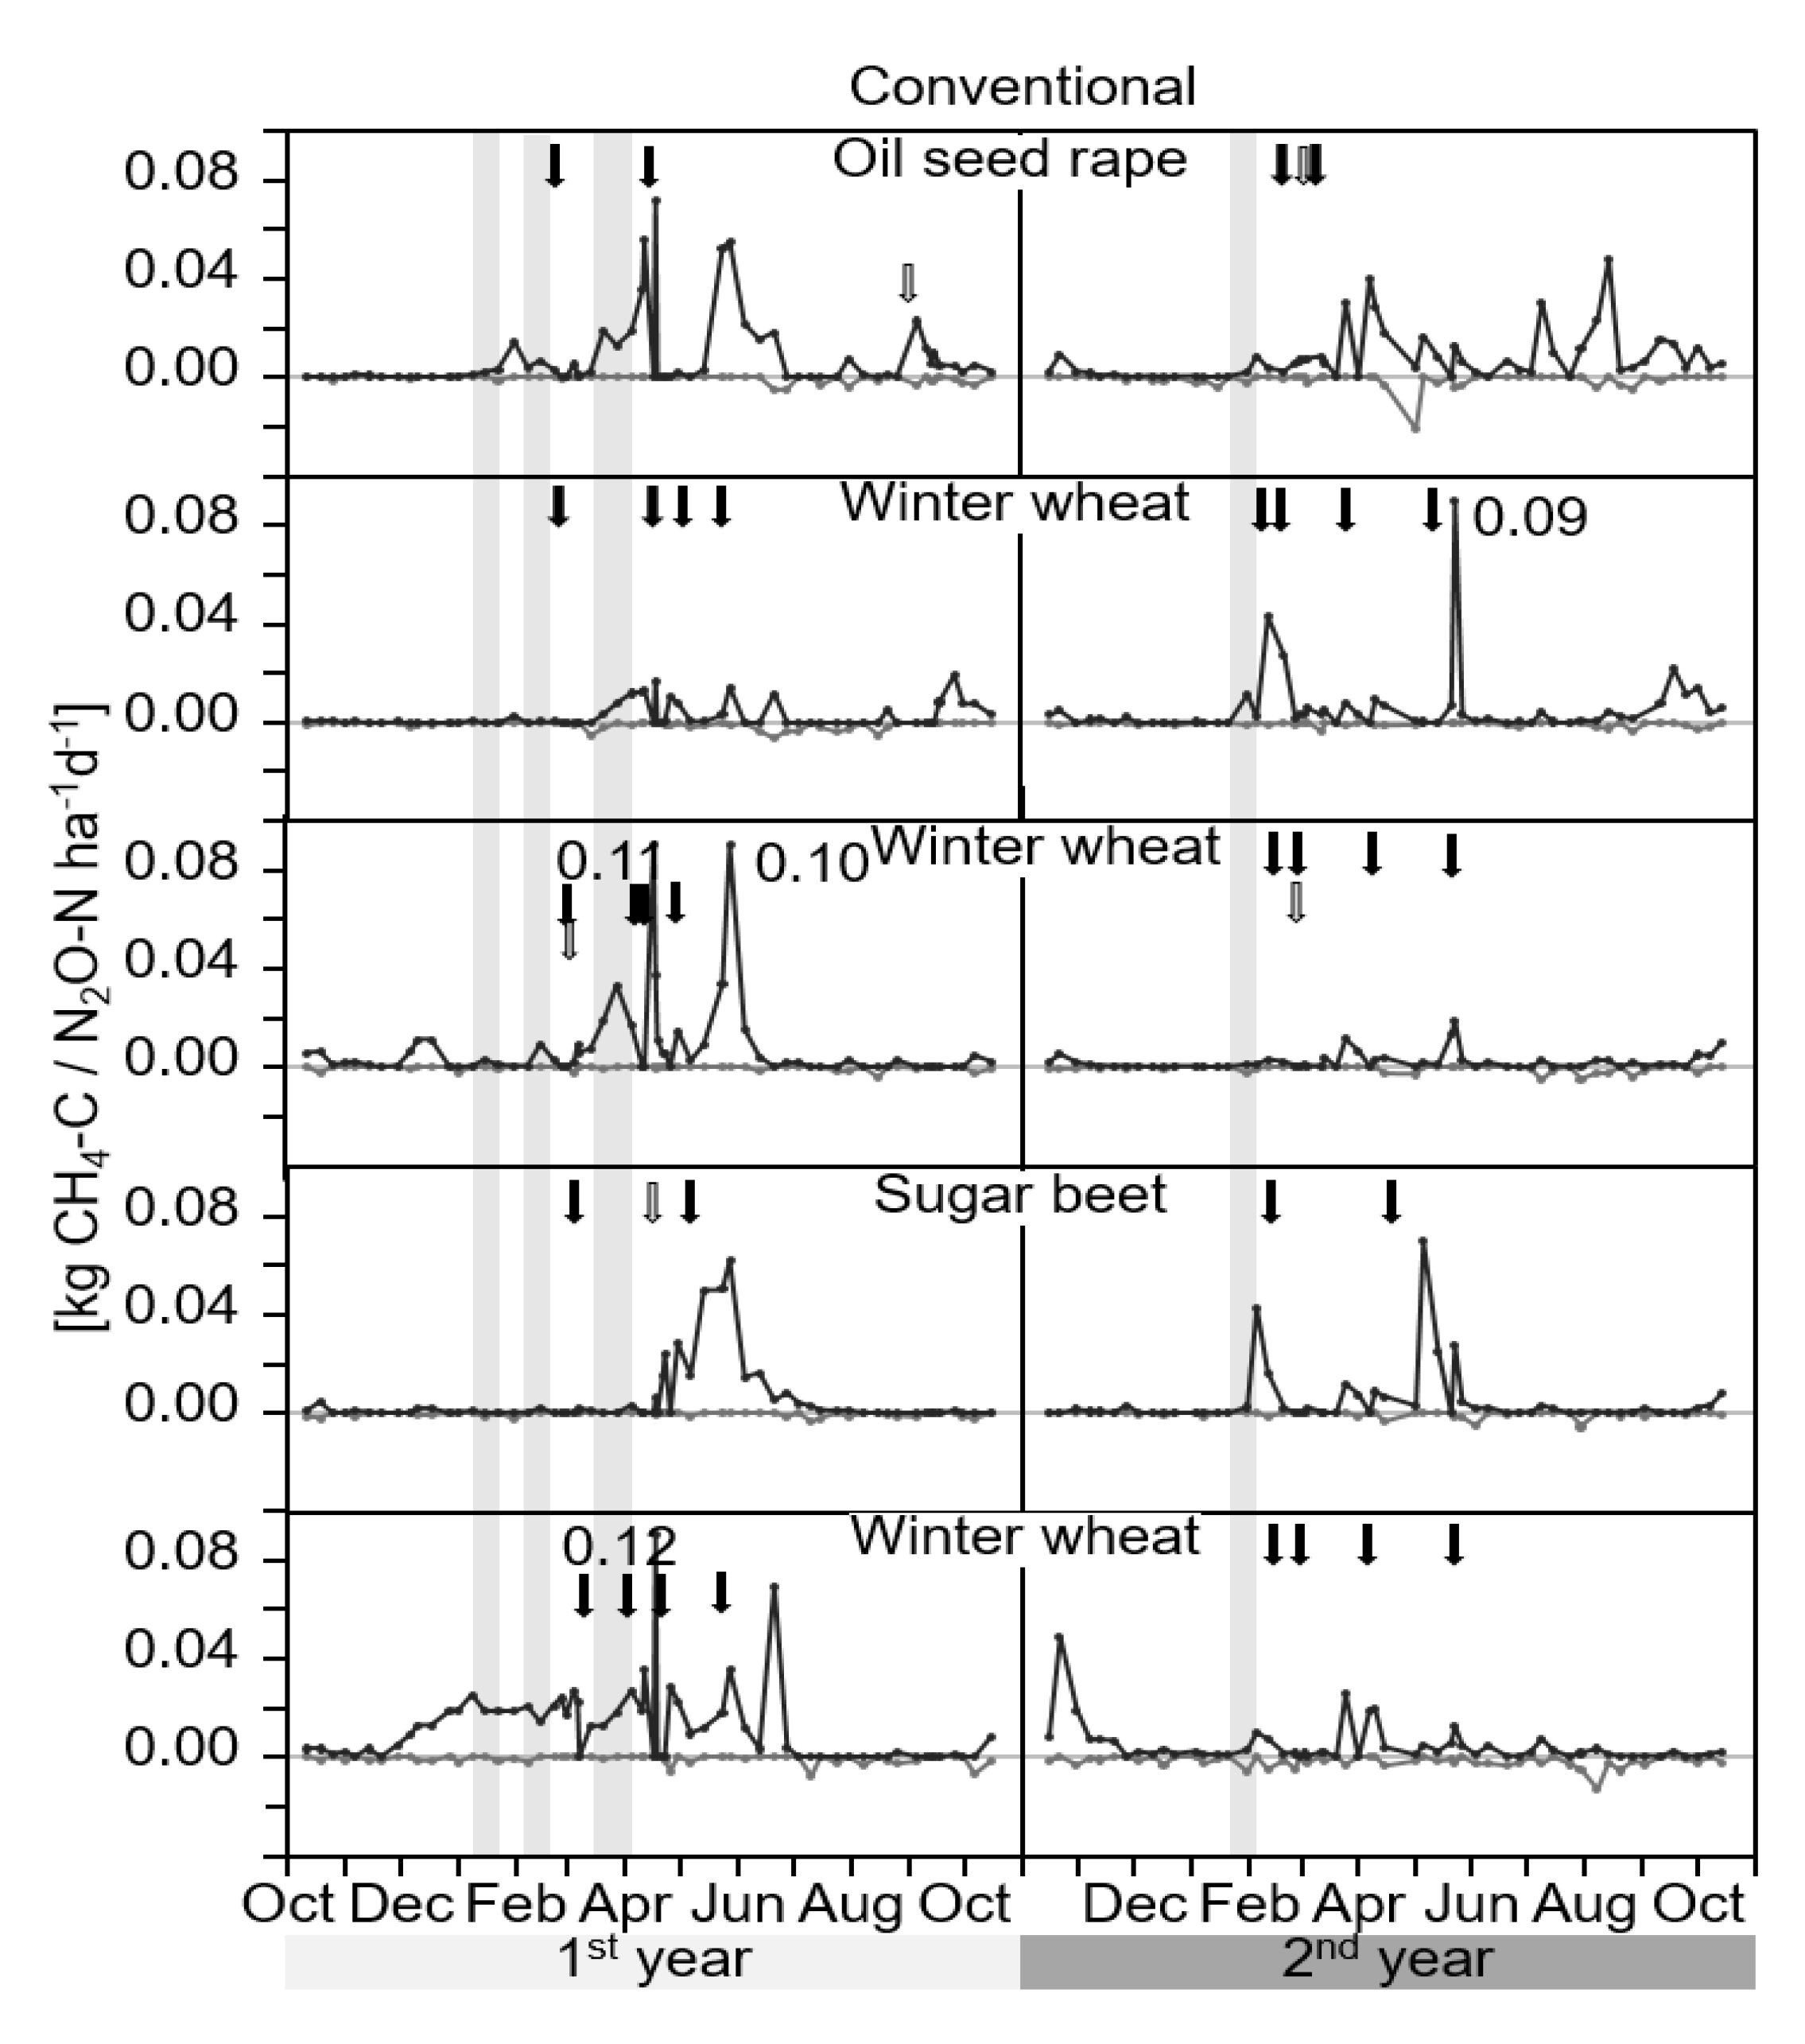
3.1. GHG-Fluxes
3.2. Crop Yields and Yield-Related GHG Emissions
4. Discussion
4.1. GHG-Fluxes
4.2. Crop Yields and Yield-Related GHG Emissions
4.3. Further Mitigation Potential
5. Conclusions
Supplementary Materials
Author Contributions
Funding
Acknowledgments
Conflicts of Interest
References
- IPCC. Contribution of Working Groups I, II and III to the Fifth Assessment Report of the Intergovernmental Panel on Climate Change; Climate Change 2014: Synthesis Report; IPCC: Geneva, Switzerland, 2014. [Google Scholar]
- Smith, K.A.; Ball, T.; Conen, F.; Dobbie, K.E.; Massheder, J.; Rey, A. Exchange of greenhouse gases between soil and atmosphere: Interactions of soil physical factors and biological processes. Eur. J. Soil Sci. 2003, 54, 779–791. [Google Scholar] [CrossRef]
- Cicerone, R.J. Changes in Stratospheric Ozone. Science 1987, 237, 35–42. [Google Scholar] [CrossRef]
- Ravishankara, A.R.; Daniel, J.S.; Portmann, R.W. Nitrous Oxide (N2O): The Dominant Ozone-Depleting Substance Emitted in the 21st Century. Science 2009, 326, 123–125. [Google Scholar] [CrossRef]
- Thomson, A.J.; Giannopoulos, G.; Pretty, J.; Baggs, E.M.; Richardson, D.J. Biological sources and sinks of nitrous oxide and strategies to mitigate emissions. Philos. Trans. R. Soc. B Biol. Sci. 2012, 367, 1157–1168. [Google Scholar] [CrossRef]
- Fowler, D.; Coyle, M.; Skiba, U.; Sutton, M.A.; Cape, J.N.; Reis, S.; Sheppard, L.J.; Jenkins, A.; Grizzetti, B.; Galloway, J.N.; et al. The global nitrogen cycle in the twenty-first century. Philos. Trans. R. Soc. B 2013, 368, 20130164. [Google Scholar] [CrossRef]
- Dobbie, K.E.; Smith, K.A. Nitrous oxide emission factors for agricultural soils in Great Britain: The impact of soil water-filled pore space and other controlling variables. Glob. Chang. Biol. 2003, 9, 204–218. [Google Scholar] [CrossRef]
- Flessa, H.; Pfau, W.; Dörsch, P.; Beese, F. The influence of nitrate and ammonium fertilization on N2O release and CH4 uptake of a well-drained topsoil demonstrated by a soil microcosm experiment. Zeitschrift Pflanzenernährung Bodenkunde 1996, 159, 499–503. [Google Scholar] [CrossRef]
- Henault, C.; Devis, X.; Page, S.; Justes, E.; Reau, R.; Germon, J.C. Nitrous oxide emissions under different soil and land management conditions. Biol. Fertil. Soils 1998, 26, 199–207. [Google Scholar] [CrossRef]
- Kaiser, E.A.; Kohrs, K.; Kücke, M.; Schnug, E.; Munch, J.C.; Heinemeyer, O. Nitrous oxide release from arable soil: Importance of perennial forage crops. Biol. Fertil. Soils 1998, 28, 36–43. [Google Scholar] [CrossRef]
- Stevens, R.J.; Laughlin, R.J.; Burns, L.C.; Arah, J.R.M.; Hood, R.C. Measuring the contributions of nitrification and denitrification to the flux of nitrous oxide from soil. Soil Biol. Biochem. 1997, 29, 139–151. [Google Scholar] [CrossRef]
- Dechow, R.; Freibauer, A. Assessment of German nitrous oxide emissions using empirical modelling approaches. Nutr. Cycl. Agroecosyst. 2011, 91, 235–254. [Google Scholar] [CrossRef]
- Baggs, E.M.; Stevenson, M.; Pihlatie, M.; Regar, A.; Cook, H.; Cadisch, G. Nitrous oxide emissions following application of residues and fertiliser under zero and conventional tillage. Plant Soil 2003, 254, 361–370. [Google Scholar] [CrossRef]
- Ruser, R.; Flessa, H.; Russow, R.; Schmidt, G.; Buegger, F.; Munch, J.C. Emission of N2O, N2 and CO2 from soil fertilized with nitrate: Effect of compaction, soil moisture and rewetting. Soil Biol. Biochem. 2006, 38, 263–274. [Google Scholar] [CrossRef]
- Šimek, M.; Jíšová, L.; Hopkins, D.W. What is the so-called optimum pH for denitrification in soil? Soil Biol. Biochem. 2002, 34, 1227–1234. [Google Scholar] [CrossRef]
- Breuer, L.; Butterbach-Bahl, K. Local temperature optimum of N2O production rates in tropical rain forest soils of Australia. Soil Res. 2005, 43, 689–694. [Google Scholar] [CrossRef]
- Dobbie, K.E.; Smith, K.A. The effects of temperature, water-filled pore space and land use on N2O emissions from an imperfectly drained gleysol. Eur. J. Soil Sci. 2001, 52, 667–673. [Google Scholar] [CrossRef]
- Mosier, A.R.; Duxbury, J.M.; Freney, J.R.; Heinemeyer, O.; Minami, K. Assessing and Mitigating N2O Emissions from Agricultural Soils. Clim. Chang. 1998, 40, 7–38. [Google Scholar] [CrossRef]
- Bouwman, A.F. Direct emission of nitrous oxide from agricultural soils. Nutr. Cycl. Agroecosyst. 1996, 46, 53–70. [Google Scholar] [CrossRef]
- Kaiser, E.A.; Kohrs, K.; Kücke, M.; Schnug, E.; Heinemeyer, O.; Munch, J.C. Nitrous oxide release from arable soil: Importance of N-fertilization, crops and temporal variation. Soil Biol. Biochem. 1998, 30, 1553–1563. [Google Scholar] [CrossRef]
- Velthof, G.L.; Oenema, O. Nitrous oxide emission from dairy farming systems in the Netherlands. Neth. J. Agric. Sci. 1997, 45, 347–360. [Google Scholar]
- Lebender, U.; Senbayram, M.; Lammel, J.; Kuhlmann, H. Effect of mineral nitrogen fertilizer forms on N2O emissions from arable soils in winter wheat production. J. Plant Nutr. Soil Sci. 2014, 177, 722–732. [Google Scholar] [CrossRef]
- Skinner, C.; Gattinger, A.; Muller, A.; Mäder, P.; Flieβbach, A.; Stolze, M.; Ruser, R.; Niggli, U. Greenhouse gas fluxes from agricultural soils under organic and non-organic management—A global meta-analysis. Sci. Total Environ. 2014, 468–469, 553–563. [Google Scholar] [CrossRef]
- Ojima, D.S.; Valentine, D.W.; Mosier, A.R.; Parton, W.J.; Schimel, D.S. Effect of Land-Use Change on Methane Oxidation in Temperate Forest and Grassland Soils. Chemosphere 1993, 26, 675–685. [Google Scholar] [CrossRef]
- Dobbie, K.E.; Smith, K.A.; Prieme, A.; Christensen, S.; Degorska, A.; Orlanski, P. Effect of land use on the rate of methane uptake by surface soils in Northern Europe. Atmos. Environ. 1996, 30, 1005–1011. [Google Scholar] [CrossRef]
- UBA Daten zur Umwelt. Available online: https://www.umweltbundesamt.de/publikationen/reaktiver-stickstoff-in-deutschland (accessed on 16 March 2020).
- BMEL. Zukunftstrategie Ökologischer Landbau; Bundesministerium für Ernährung und Landwirtschaft, 2015. Available online: https://www.bmel.de/SharedDocs/Downloads/Broschueren/Zukunftsstrategie-oekologischer-Landbau.pdf?__blob=publicationFile (accessed on 16 March 2020).
- Van Groenigen, J.W.; Velthof, G.L.; Oenema, O.; Van Groenigen, K.J.; Van Kessel, C. Towards an agronomic assessment of N2O emissions: A case study for arable crops. Eur. J. Soil Sci. 2010, 61, 903–913. [Google Scholar] [CrossRef]
- Petersen, S.O.; Regina, K.; Pöllinger, A.; Rigler, E.; Valli, L.; Yamulki, S.; Esala, M.; Fabbri, C.; Syväsalo, E.; Vinther, F.P. Nitrous oxide emissions from organic and conventional crop rotations in five European countries. Agric. Ecosyst. Environ. 2006, 112, 200–206. [Google Scholar] [CrossRef]
- Reinsch, T.; Loges, R.; Kluß, C.; Taube, F. Renovation and conversion of permanent grass-clover swards to pasture or crops: Effects on annual N2O emissions in the year after ploughing. Soil Tillage Res. 2018, 175, 119–129. [Google Scholar] [CrossRef]
- Brozyna, M.A.; Petersen, S.O.; Chirinda, N.; Olesen, J.E. Effects of grass-clover management and cover crops on nitrogen cycling and nitrous oxide emissions in a stockless organic crop rotation. Agric. Ecosyst. Environ. 2013, 181, 115–126. [Google Scholar] [CrossRef]
- Ball, B.C.; Watson, C.A.; Crichton, I. Nitrous oxide emissions, cereal growth, N recovery and soil nitrogen status after ploughing organically managed grass/clover swards. Soil Use Manag. 2007, 23, 145–155. [Google Scholar] [CrossRef]
- Bell, M.J.; Hinton, N.J.; Cloy, J.M.; Topp, C.F.E.; Rees, R.M.; Williams, J.R.; Misselbrook, T.H.; Chadwick, D.R. How do emission rates and emission factors for nitrous oxide and ammonia vary with manure type and time of application in a Scottish farmland? Geoderma 2016, 264, 81–93. [Google Scholar] [CrossRef]
- Chen, H.; Li, X.; Hu, F.; Shi, W. Soil nitrous oxide emissions following crop residue addition: A meta-analysis. Glob. Chang. Biol. 2013, 19, 2956–2964. [Google Scholar] [CrossRef]
- De Ponti, T.; Rijk, B.; van Ittersum, M.K. The crop yield gap between organic and conventional agriculture. Agric. Syst. 2012, 108, 1–9. [Google Scholar] [CrossRef]
- Meier, M.S.; Stoessel, F.; Jungbluth, N.; Juraske, R.; Schader, C.; Stolze, M. Environmental impacts of organic and conventional agricultural products—Are the differences captured by life cycle assessment? J. Environ. Manag. 2015, 149, 193–208. [Google Scholar] [CrossRef]
- Herrmann, A.; Claus, S.; Loges, R.; Kluß, C.; Taube, F. Can arable forage production be intensified sustainably? A case study from northern Germany. Crop Pasture Sci. 2014, 65, 538–549. [Google Scholar] [CrossRef]
- Hansen, S.; Bernard, M.-E.; Rochette, P.; Whalen, J.K.; Dörsch, P. Nitrous oxide emissions from a fertile grassland in Western Norway following the application of inorganic and organic fertilizers. Nutr. Cycl. Agroecosyst. 2014, 98, 71–85. [Google Scholar] [CrossRef]
- Kirchmann, H.; Kätterer, T.; Bergström, L.; Börjesson, G.; Bolinder, M.A. Flaws and criteria for design and evaluation of comparative organic and conventional cropping systems. Field Crops Res. 2016, 186, 99–106. [Google Scholar] [CrossRef]
- Høgh-Jensen, H.; Loges, R.; Jørgensen, F.V.; Vinther, F.P.; Jensen, E.S. An empirical model for quantification of symbiotic nitrogen fixation in grass-clover mixtures. Agric. Syst. 2004, 82, 181–194. [Google Scholar] [CrossRef]
- Wichmann, S.; Loges, R.; Taube, F. Grain Yield, N2 Fixation and N Balance of Peas, Faba Beans and Narrow-Leafed Lupins in Monocrop and in Intercropping with Cereals. Pflanzenbauwissenschaften 2006, 10, 2–15. [Google Scholar]
- Hutchinson, G.L.; Mosier, A.R. Improved Soil Cover Method for Field Measurement of Nitrous-Oxide Fluxes. Soil Sci. Soc. Am. J. 1981, 45, 311–316. [Google Scholar] [CrossRef]
- BLE. Getreideeinheitenschlüssel, Bundesanstalt für Landwirtschaft und Ernährung 2012. Available online: https://www.bzl-datenzentrum.de/metanavigation/datendownload/ (accessed on 16 March 2020).
- Velthof, G.L. Nitrous Oxide Emission from Intensively Managed Grasslands; Wageningen University: Wageningen, The Netherlands, 1997. [Google Scholar]
- Clayton, H.; McTaggart, I.P.; Parker, J.; Swan, L.; Smith, K.A. Nitrous oxide emissions from fertilised grassland: A 2-year study of the effects of N fertiliser form and environmental conditions. Biol. Fertil. Soils 1997, 25, 252–260. [Google Scholar] [CrossRef]
- Dittert, K.; Lampe, C.; Gasche, R.; Butterbach-Bahl, K.; Wachendorf, M.; Papen, H.; Sattelmacher, B.; Taube, F. Short-term effects of single or combined application of mineral N fertilizer and cattle slurry on the fluxes of radiatively active trace gases from grassland soil. Soil Biol. Biochem. 2005, 37, 1665–1674. [Google Scholar] [CrossRef]
- Velthof, G.L.; Kuikman, P.J.; Oenema, O. Nitrous oxide emission from animal manures applied to soil under controlled conditions. Biol. Fertil. Soils 2003, 37, 221–230. [Google Scholar] [CrossRef]
- Bell, M.J.; Hinton, N.; Cloy, J.M.; Topp, C.F.E.; Rees, R.M.; Cardenas, L.; Scott, T.; Webster, C.; Ashton, R.W.; Whitmore, A.P.; et al. Nitrous oxide emissions from fertilised UK arable soils: Fluxes, emission factors and mitigation. Agric. Ecosyst. Environ. 2015, 212, 134–147. [Google Scholar] [CrossRef]
- Jones, S.K.; Rees, R.M.; Skiba, U.M.; Ball, B.C. Influence of organic and mineral N fertiliser on N2O fluxes from a temperate grassland. Agric. Ecosyst. Environ. 2007, 121, 74–83. [Google Scholar] [CrossRef]
- Henriksen, T.M.; Breland, T.A. Evaluation of criteria for describing crop residue degradability in a model of carbon and nitrogen turnover in soil. Soil Biol. Biochem. 1999, 31, 1135–1149. [Google Scholar] [CrossRef]
- Loges, R.; Bunne, I.; Reinsch, T.; Malisch, C.; Kluß, C.; Herrmann, A.; Taube, F. Forage production in rotational systems generates similar yields compared to maize monocultures but improves soil carbon stocks. Eur. J. Agron. 2018, 97, 11–19. [Google Scholar] [CrossRef]
- Benoit, M.; Garnier, J.; Anglade, J.; Billen, G. Nitrate leaching from organic and conventional arable crop farms in the Seine Basin (France). Nutr. Cycl. Agroecosyst. 2014, 100, 285–299. [Google Scholar] [CrossRef]
- Schmeer, M.; Loges, R.; Dittert, K.; Senbayram, M.; Horn, R.; Taube, F. Legume-based forage production systems reduce nitrous oxide emissions. Soil Tillage Res. 2014, 143, 17–25. [Google Scholar] [CrossRef]
- Wuebbles, D.J.; Hayhoe, K. Atmospheric methane and global change. Earth Sci. Rev. 2002, 57, 177–210. [Google Scholar] [CrossRef]
- Boeckx, P.; Van Cleemput, O. Estimates of N2O and CH4 fluxes from agricultural lands in various regions in Europe. Nutr. Cycl. Agroecosyst. 2001, 60, 35–47. [Google Scholar] [CrossRef]
- Kirschke, S.; Bousquet, P.; Ciais, P.; Saunois, M.; Canadell, J.G.; Dlugokencky, E.J.; Bergamaschi, P.; Bergmann, D.; Blake, D.R.; Bruhwiler, L.; et al. Three decades of global methane sources and sinks. Nat. Geosci. 2013, 6, 813. [Google Scholar] [CrossRef]
- Hütsch, B.W.; Webster, C.P.; Powlson, D.S. Long-term effects of nitrogen fertilization on methane oxidation in soil of the broadbalk wheat experiment. Soil Biol. Biochem. 1993, 25, 1307–1315. [Google Scholar] [CrossRef]
- Willison, T.W.; Webster, C.P.; Goulding, K.W.T.; Powlson, D.S. Methane oxidation in temperate soils: Effects of land use and the chemical form of nitrogen fertilizer. Chemosphere 1995, 30, 539–546. [Google Scholar] [CrossRef]
- Boeckx, P.; Van Cleemput, O.; Villaralvo, I. Methane oxidation in soils with different textures and land use. Nutr. Cycl. Agroecosyst. 1997, 49, 91–95. [Google Scholar] [CrossRef]
- Seufert, V.; Ramankutty, N.; Foley, J.A. Comparing the yields of organic and conventional agriculture. Nature 2012, 485, 229. [Google Scholar] [CrossRef]
- Cederberg, C.; Mattsson, B. Life cycle assessment of milk production—A comparison of conventional and organic farming. J. Clean. Prod. 2000, 8, 49–60. [Google Scholar] [CrossRef]
- Korsaeth, A. Relations between nitrogen leaching and food productivity in organic and conventional cropping systems in a long-term field study. Agric. Ecosyst. Environ. 2008, 127, 177–188. [Google Scholar] [CrossRef]
- Flessa, H.; Ruser, R.; Dörsch, P.; Kamp, T.; Jimenez, M.A.; Munch, J.C.; Beese, F. Integrated evaluation of greenhouse gas emissions (CO2, CH4, N2O) from two farming systems in southern Germany. Agric. Ecosyst. Environ. 2002, 91, 175–189. [Google Scholar] [CrossRef]
- Chirindaa, N.; Carter, S.; Albert, K.R.; Ambus, P.; Olesen, J.E.; Porter, J.R.; Petersen, S.O. Emissions of nitrous oxide from arable organic and conventional cropping systems on two soil types. Agric. Ecosyst. Environ. 2010, 136, 199–208. [Google Scholar] [CrossRef]
- Knudsen, M.T.; Meyer-Aurich, A.; Olesen, J.E.; Chirinda, N.; Hermansen, J.E. Carbon footprints of crops from organic and conventional arable crop rotations—Using a life cycle assessment approach. J. Clean. Prod. 2014, 64, 609–618. [Google Scholar] [CrossRef]
- Irmler, U. Changes in earthworm populations during conversion from conventional to organic farming. Agric. Ecosyst. Environ. 2010, 135, 194–198. [Google Scholar] [CrossRef]
- Schröter, L.; Irmler, U. Organic cultivation reduces barrier effect of arable fields on species diversity. Agric. Ecosyst. Environ. 2013, 164, 176–180. [Google Scholar] [CrossRef]
- Möller, K.; Stinner, W.; Leithold, G. Growth, composition, biological N 2 fixation and nutrient uptake of a leguminous cover crop mixture and the effect of their removal on field nitrogen balances and nitrate leaching risk. Nutr. Cycl. Agroecosyst. 2008, 82, 233–249. [Google Scholar] [CrossRef]
- Nemecek, T.; Dubois, D.; Huguenin-Elie, O.; Gaillard, G. Life cycle assessment of Swiss farming systems: I. Integrated and organic farming. Agric. Syst. 2011, 104, 217–232. [Google Scholar] [CrossRef]
- Tuomisto, H.L.; Hodge, I.D.; Riordan, P.; Macdonald, D.W. Does organic farming reduce environmental impacts?—A meta-analysis of European research. J. Environ. Manag. 2012, 112, 309–320. [Google Scholar] [CrossRef]


| Rotation Element | Year | Amount [kg N ha−1], Fertilizer Type and Date of N Application | Total Input [kg N ha−1] | ||||
|---|---|---|---|---|---|---|---|
| Treatment | 1. | 2. | 3. | 4. | 5. | ||
| Oilseed rape | 1st 2nd | 31 b (09-Sep-12) 106 f (30-Aug-13) | 138 c (28-Feb-13) 130 c (18-Feb-14) | 42 d (08-Apr-13) 74 f (26-Feb-14) | 31d (01-Mar-14) | 211 341 | |
| Winter wheat | 1st 2nd | 83 c (06-Mar-13) 80 c (25-Feb-14) | 25 d (08-Apr-13) 31 d (08-Mar-14) | 38 b (22-Apr-13) 55 c (06-Apr-14) | 32 d (21-May-13) 52 c (18-May-14) | 178 218 | |
| Winter wheat | 1st 2nd | 88 c (06-Mar-13) 95 c (25-Feb-14) | 61 e (06-Mar-13) 82 e (13-Mar-14) | 29 d (12-Apr-13) 32 d (10-Mar-14) | 52 c (17-Apr-13) 21 b (07-Apr-14) | 37 c (21-May-13) 55 c (17-May-14) | 267 285 |
| Sugar beet | 1st 2nd | 36 b (07-Mar-13) 36 b (11-Mar-14) | 78 f (17-Apr-13) 100 c (23-Apr-14) | 38 a (07-May-13) | 152 136 | ||
| Winter wheat | 1st 2nd | 101 c (06-Mar-13) 92 c (25-Feb-14) | 25 d (08-Apr-13) 31 d (08-Mar-14) | 36 b (22-Apr-13) 55 c (03-Apr-14) | 60 c (21-May-13) 55 c (18-May-14) | 222 233 | |
| Effect | N2O | CH4 | CO2eq ha−1 | PCFNON-CO2 |
|---|---|---|---|---|
| Period | ns | p < 0.001 | ns | ns |
| Crop | p < 0.001 | p < 0.001 | p < 0.001 | p < 0.001 |
| Period*Crop | p < 0.001 | p < 0.001 | p < 0.001 | p < 0.001 |
| System | Crop | First Experimental Year | Second Experimental Year | ||||||||||
|---|---|---|---|---|---|---|---|---|---|---|---|---|---|
| N2O [kg N ha−1] | CH4 [kg C ha−1] | GWP [kg CO2eq ha−1] | Yield [t DM ha−1] | Yield [GE ha−1] | PCFNON-CO2 [kg CO2eq GE−1] | N2O [kg N ha−1] | CH4 [kg C ha−1] | GWP [kg CO2eq ha−1] | Yield [t DM ha−1] | Yield [GE ha−1] | PCFNON-CO2 [kg CO2eq GE−1] | ||
| Organic-low-BNF | Grass–clover | 0.2 Ab | −0.1 Aa | 79.5 Ab | 7.1 | 40.9 | 1.9 Ac | 0.3 Ab | −0.3 Ba | 113.6 Ab | 6.7 | 38.7 | 2.9 Ab |
| Winter wheat | 0.9 Aa | −0.3 Aa | 363.2 Aa | 3.2 | 33.6 | 10.8 Aa | 2.3 Aa | −0.1 Ba | 953.2 Aa | 3.0 | 31.1 | 30.6 Aa | |
| Winter rye | 0.5 Aa | −0.3 Aa | 196.8 Aa | 4.1 | 41.4 | 4.8 Ab | 0.4 Ab | −0.2 Aa | 159.0 Ab | 4.4 | 44.4 | 3.6 Ab | |
| Summer oats | 1.0 Aa | −0.1 Ab | 412.3 Aa | 3.1 | 25.9 | 15.9 Aa | 0.6 Ab | −0.1 Aa | 245.9 Ab | 3.7 | 31.1 | 7.9 Ab | |
| Organic-semi-BNF | Grass–clover | 0.0 Ad | −0.1 Ac | 12.9 Ad | 6.3 | 36.4 | 0.4 Ad | 0.2 Bc | −0.2 Aa | 75.7 Bc | 5.8 | 33.4 | 2.3 Bc |
| Winter wheat | 1.1 Aa | −0.5 Aa | 439 Aa | 3.5 | 36.8 | 11.9 Aa | 1.7 Aa | −0.2 Ba | 699.8 Aa | 4.0 | 41.6 | 16.8 Aa | |
| Winter rye | 0.5 Ab | −0.3 Aabc | 196.8 Ab | 4.1 | 41.4 | 4.8 Ab | 0.7 Ab | −0.2 Aa | 283.8 Ab | 4.9 | 49.5 | 5.7 Ab | |
| Spring field peas | 0.4 Aab | −0.1 Aab | 162.7 Abc | 3.5 | 36.1 | 4.5 Aab | 1.6 Aabc | −0.1 Aa | 661.9 Aabc | 3.1 | 32.2 | 20.6 Aabc | |
| Winter rye | 0.3 Ac | −0.3 Ab | 113.6 Ac | 4.6 | 46.0 | 2.5 Ac | 0.4 Abc | −0.1 Ba | 162.7 Abc | 3.0 | 30.3 | 5.4 Ab | |
| Conven-tional | Oil seed rape | 2.6 Ab | −0.2 Aab | 1074.3 Ab | 4.3 | 55.9 | 19.2 Aa | 2.6 Aa | −0.4 Bab | 1066.8 Aa | 4.9 | 63.7 | 16.7 Aa |
| Winter wheat | 0.9 Ac | −0.3 Aa | 363.2 Ac | 10.8 | 112.3 | 3.2 Ac | 1.7 Bb | −0.2 Ac | 699.8 Bb | 11.4 | 118.6 | 5.9 Bb | |
| Winter wheat | 2.7 Ab | −0.1 Ab | 1119.6 Ab | 9.8 | 101.8 | 11.0 Ab | 0.7 Bc | −0.2 Aac | 283.8 Bc | 10.3 | 107.1 | 2.6 Bc | |
| Sugar beet | 2.0 Aab | −0.2 Aab | 824.6 Aabc | 75.0 | 172.5 | 4.8 Ac | 1.6 Ab | −0.2 Ac | 658.2 Ab | 89.0 | 204.7 | 3.2 Ac | |
| Winter wheat | 4.1 Aa | −0.3 Aa | 1694.6 Aa | 9.8 | 101.8 | 16.6 Aa | 1.7 Bb | −0.5 Ba | 688.6 Bb | 11.2 | 116.5 | 5.9 Bb | |
| Grass-land | 0.2 | −0.1 | 82.2 | 2.4 | 14.2 | 5.8 | 0.3 | −0.1 | 122 | 2.4 | 14.1 | 8.6 | |
| Beech forest | 0.2 | −3.9 | −51.3 | - | - | 0.5 | −2.5 | 114 | - | - | |||
| First Experimental Year | Second Experimental Year | |||
|---|---|---|---|---|
| System | GWP [kg CO2eq ha−1] | PCFNON-CO2 [kg GE−1] | GWP [kg CO2eq ha−1] | PCFNON-CO2 [kg GE−1] |
| Organic-low-BNF | 263.0 (24.1) Ab | 8.4 (0.58) Ab | 367.9 (66.5) Ab | 11.3 (2.13) Aab |
| Organic-semi-BNF | 185.0 (10.5) Ac | 4.8 (0.28) Ac | 376.8 (98.4) Bb | 10.1 (3.17) Ba |
| Conventional | 1015.3 (60.1) Aa | 11.0 (0.44) Aa | 679.4 (31.5) Ba | 6.9 (0.28) Bb |
| Grassland | 82.2 (46.4) Acd | 5.8 (3.3) Aabc | 122.1 (29.2) Ac | 8.6 (2.05) Aab |
| Beech forest | −51.3 (39.8) Ad | 114.9 (8.9) Ac | ||
© 2020 by the authors. Licensee MDPI, Basel, Switzerland. This article is an open access article distributed under the terms and conditions of the Creative Commons Attribution (CC BY) license (http://creativecommons.org/licenses/by/4.0/).
Share and Cite
Biernat, L.; Taube, F.; Loges, R.; Kluß, C.; Reinsch, T. Nitrous Oxide Emissions and Methane Uptake from Organic and Conventionally Managed Arable Crop Rotations on Farms in Northwest Germany. Sustainability 2020, 12, 3240. https://doi.org/10.3390/su12083240
Biernat L, Taube F, Loges R, Kluß C, Reinsch T. Nitrous Oxide Emissions and Methane Uptake from Organic and Conventionally Managed Arable Crop Rotations on Farms in Northwest Germany. Sustainability. 2020; 12(8):3240. https://doi.org/10.3390/su12083240
Chicago/Turabian StyleBiernat, Lars, Friedhelm Taube, Ralf Loges, Christof Kluß, and Thorsten Reinsch. 2020. "Nitrous Oxide Emissions and Methane Uptake from Organic and Conventionally Managed Arable Crop Rotations on Farms in Northwest Germany" Sustainability 12, no. 8: 3240. https://doi.org/10.3390/su12083240
APA StyleBiernat, L., Taube, F., Loges, R., Kluß, C., & Reinsch, T. (2020). Nitrous Oxide Emissions and Methane Uptake from Organic and Conventionally Managed Arable Crop Rotations on Farms in Northwest Germany. Sustainability, 12(8), 3240. https://doi.org/10.3390/su12083240