Abstract
Due to the popularization of the concept of “new retailing”, we study a new commercial model named O2O (online-to-offline), which is a good combination model of a direct channel and a traditional retail channel. We analyze an O2O supply chain in which manufacturers are responsible for making green products and selling them through both online and offline channels. The retailer is responsible for all online and offline channels’ orders, and the manufacturer gives the retailer a fixed fee. We construct a mathematical function model and analyze the greenness and pricing strategies of centralized and decentralized settings through the retailer Stackelberg game model. Due to the effects of the double marginalization of supply chain members, we adopt a simple contract to coordinate the green supply chain. The paper’s contributions are that we obtain pricing and greening strategies by taking the cooperation of offline channels and online channels into consideration under the O2O green supply chain environment.
1. Introduction
With the advent of global climate change and the popular Chinese statement that “clear waters and green mountains are wealth”, the green economy, sustainable development, green product design, ecological civilization, and many other concepts have been widely promoted. There have been many studies on green supply chains [1,2,3,4]. A green supply chain requires the rethinking of many issues, including purchasing, product design, inventory control, transportation and reverse logistics, return and recycling, and supply chain reconstruction among many chain members. Adopting a green supply chain management method can comply with the local environmental protection laws and policies, improve enterprise performance, and realize the concept of sustainable development in the enterprise.
Many aspects must be considered in the adoption and implementation of green logistics, such as: rethinking procurement; product development and design; improved mode of production; process management and control; and transportation, distribution, and return service management innovation. Although there are many methods, green product design and development from the source is the most appropriate. Some researchers have designed green products, improved the adaptability of products and the environment, and made products more environmentally friendly and compatible. Some researchers also suggested that green product innovation could not only improve the environment, but also improve an enterprise’s financial performance. As a result, many business operators, government organizations, NGOS, and a Swedish girl—Greta Thunberg—have become famous because they care very much about the environment. Green product development, including innovation in design and production, has become the preferred method of selection for green supply chains.
Therefore, many enterprises focus on green product design and improving the production process, and plan to put this into practice. For example, some companies have designed environmentally-friendly green plastic bags due to the non-degradability of traditional plastics [5]. Some manufacturing enterprises have adopted green technology as a means of product differentiation, opened up new markets, improved their competitiveness, and embraced good business practices [1]. Many enterprises have gained commercial benefits from green behaviors, and are now widely recognized by the market and society in terms of both financial and commercial reputations.
The rapid development of e-commerce means that numerous consumers shop online and many consumers also prefer environmentally-friendly products. Consumers who use both online and offline channels are willing to pay for the environmental performance of products. Therefore, a product’s green innovation has become the focus of business operations in multi-channel supply chains.
Rao [1] purposed a conceptual model to identify potential linkages within green supply chain management (GSCM). Fahimnia et al. [2] performed a thorough literature measurement and network analysis for the emergent field of GSCM, and gave a unique evaluation opinion compared with previous literature. Some other research papers [3,4] provide a literature review of GSCM. Agi et al. [5] reviewed the application of game theory in a green supply chain and summarized the literature and papers based on the problems investigated. The existing literature focuses on GSCM from various perspectives [5]: one is that manufactures produce products by taking green product design into consideration, such as products’ recyclability; coordinating the greening efforts from the perspective of the supply chain; pricing the green product in the supply chain; coordinating the closed-loop supply chain; diffusion and performance measurement; and governmental interventions and policy making.
For example, Chen et al. [6] constructed a mathematical model using the game theory method to improve the recyclability of products and took reverse logistics into account. Sheu [7] studied the competition between logistics service providers and manufacturers in the supply chain environment in reverse logistics, which contained recyclable components in the green supply chain. This study used game theory tools and discussed the special circumstances in which the profit and public welfare functions of chain members can be maximized. Sheu et al. [8] used a three-stage game model to analyze similar problems to those found in the previous paper. The results showed that under certain conditions that comply with policies and regulations and internal input, the production of green products can bring non-negative green profits to manufacturers.
Other studies analyzed green supply chains without considering products’ recyclability. For example, Liu [9] analyzed how consumers’ environmental awareness and product substitutability affected the balance strategies and profit of supply chain members. Barari et al. [10] analyzed the level of green effort by manufacturers and suppliers through mathematical modeling, seeking the optimal investment ratio between the two members, and then coordinated the supply chain with a two-part contract. Ghosh [11] studied the green level and pricing strategy under different power game structures and made a detailed comparison of the three decentralized game coordination situations and the green supply chain decision under the cooperation strategy. Ghosh [12] also focused on the issue of channel coordination using game theory as a tool to analyze the greenness strategy and how the chain members’ profits are affected by cost-sharing contracts. Xiao [13] analyzed the cooperation in the supply chain, taking into account environmental impacts using the newsboy model in a single channel. Wei [14] analyzed the pricing of complementary products in a multi-level supply chain. Agi [15] analyzed the influence of market segmentation and power structure on the supply chain of brown products and green products. The results show that the manufacturer-led supply chain is better than the retailer-led supply chain. Chen [16] studied pricing and carbon emission reduction decisions with game theory in two competitive low-carbon manufacturers. Cohen [17] analyzed the impact of demand uncertainty on government consumer subsidies and manufacturers’ introduction of green technology.
However, most of the papers are research about GSCM under single-channel supply, and only a few papers involve a dual-channel supply chain. Chen [18] analyzed how environmental sustainability affected the chain members and focused on the impact of cross-impact factors of environmental sustainability on pricing strategies. Chen [19] analyzed pricing policies of the reverse recovery center under a dual channel supply chain while considering regional differences, logistics costs, and consumers’ environmental awareness. Ma [20] adopted a game theoretic approach to analyze the economic performance and environmental performance under the dual channel green supply chain, and discussed the impact of customer environmental awareness on green supply chains’ (GSCs’) green level and profitability. Qi [21] analyzed the effects of cap-and-trade regulation on optimal decisions and profits in a dual-channel supply chain. Li [22] analyzed the green decisions in a dual-channel environment, comparing the green level and pricing strategy with single and dual channels, and coordinating the supply chain. Li [23] analyzed the impact of government green subsidies on the production of environment-friendly products in a dual channel environment.
Basiri [24] studied two substitution green products, constructed a green decision model, and analyzed the substitution relationship and the competition between the dual channels of the two products. Ranjan [25] constructed a mathematical model where manufacturers produced green products and substitution products and retailers were responsible for the product sales effort; he designed a cooperation and coordination contract to adjust the benefit distribution of the supply chain members. Heydari [26] analyzed a three-level supply chain, and analyzed whether the distributors were to be opened; he also designed a contract to realize a Pareto improvement.
However, no one focuses on green products in GSCM under the O2O (online-to-offline) environment. Due to the advancement of “Internet +”, business operators have generally used the network platform and traditional retailers to form dual channel distribution and sales of products or services, which has also become a hot issue. In recent years, many enterprise practitioners have developed new retailing. The O2O dual-channel model that combines online and offline shopping experiences has attracted the attention of theoretical researchers and practitioners.
The coexistence of a direct channel and a traditional retail channel brings some problems. Tsay [27] comprehensively reviewed the quantitative modeling methods of a dual-channel supply chain. Tsay [28] showed that the selection of distribution channels has an important impact on the product design and pricing of enterprises. Tsay [29] analyzed service competition and demonstrated that both sides can benefit from increasing the number of direct channels. Recognizing that value-added services can improve consumer acceptance of direct channels, some studies have described the pricing strategy and service quality competition for different chains. Many scholars have begun to pay attention to value-added services due to the continuous development of the supply chain. They integrated multi-channel supply chains with return management, marketing services, low-carbon products, and product greenness. Dan [30] introduced retail marketing services and constructed a mathematical model under the assumption that the promotion efforts of physical stores have a negative spillover effect on online demand, and he found that the level of promotional efforts of physical stores significantly affects the pricing strategies of both channels. Huang [31] studied how consumers’ preferences and the demand change in online sales significantly affect the price strategy of physical stores and the production strategy of manufacturers. Lu [32] studied the cooperative promotion of a two-channel supply chain under deterministic demand, and found that cooperative promotion is beneficial to all members of the supply chain.
Jian [33] analyzed the influence of service cooperation between retailers and manufacturers on the pricing decision of a dual channel supply chain. Xu [34] analyzed the influence of a compensation strategy considering the transfer of directs order to the retailer on the pricing and coordination of a dual channel supply chain. Zhao [35] studied the decision-making of lateral inventory transfer under the O2O environment, and pointed out the differences between a traditional dual channel supply chain and an O2O supply chain. Yu [36] studied the optimal distribution channel strategy of e-retailers and traditional retailers considering a drop-shipping model and power structure. Ji [37] studied the carbon emissions and promotion issues in the O2O dual-channel model under different power structures. He [38] examined the influence of the reference price effect on the operation management, and constructed a game model for the O2O environment.
In order to overcome the shortcomings of green products under the traditional dual channels and drop-shipping models, in this paper we studied a new business model called O2O by taking into account the service cooperation between different channels, which is different from Li’s [22] paper. In the O2O mode, the delivery lead time is shorter than the traditional direct channel. Generally, consumers who like to experience shopping in advance and pick up goods can go to the nearest retailer. In addition, it is more convenient for consumers to enjoy after-sales services in physical stores. Customers’ orders are independently fulfilled both in the direct and retail channels separately under Li’s [22] literature research. At the same time, consumers who like green products can go to the nearest retailers to watch green product display, pick up goods, or enjoy the touchless delivery service, which is faster and more convenient than the traditional dual channel model.
The main innovations of this article are as follows: first, we introduce the O2O supply chain and build a model by taking the service cooperation between online channel and offline channel into account; second, we use inconsistent pricing strategies for the online channel and offline channel. We utilize the retailer Stackelberg game model, while the majority of the current studies use the manufacturer Stackelberg game approach, such as Li’s paper [22]. In addition, we adopted a simple contract to coordinate the green supply chain. The O2O model can benefit green product manufacturers and retailers.
This paper is the first to introduce a green supply chain into O2O mode, which is different from Li’s [22] traditional dual channel mode. The rest of the paper is as follows. The second part introduces the notations, assumptions, and model. The third part examines the optimal pricing strategy and product green degree sum in the centralized O2O model and the decentralized setting, and designs a simple contract to coordinate green supply chain. The fourth part presents the numerical case and management enlightenment. The last part presents the conclusion and future research direction.
2. Model Formulation
Here, we discuss an O2O supply chain consisting of a retailer with an offline channel and a manufacturer with an online channel. In order to protect the environment and comply with existing environmental protection laws and regulations, manufacturers only manufacture green product and are responsible for online channel sales, and retailers are responsible for traditional offline sales and all customer orders. Consumers are green-sensitive and are willing to buy green products through online and offline channels. They can also buy products from online channels and take them from offline retailers. If they are unwilling to pick up goods, the retailers are responsible for distribution fees. Figure 1 shows the green product flow and decision framework of the O2O model.
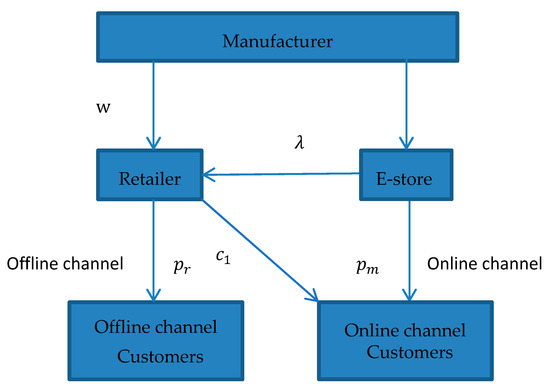
Figure 1.
O2O (online-to-offline) supply chain structure.
In the decision-making framework of the Stackelberg game model, the retailer (as the leader) determines the offline selling price and takes the green manufacturer’s response function into account. The manufacturer (as the follower) determines the greenness level, online selling price, and wholesale price, and gives the retailer a fixed fee to compensate for the cooperative service cost. Table 1 shows the notations and their definitions.

Table 1.
Model parameters.
Assumption 1.
Demands in each channel are assumed to be a linear function of a product’s greenness. Both demand function curves are assumed to go upward with the greening level and downward with the sale price. According to [30], basic demand functions without greening are defined as follows: and . After considering the greenness effort, our basic demand functions with the greening level are very similar to those of Li’s [22] and Amit’s [25]. The demand functions for the offline and online channels are as follows:
The self-price elasticity is bigger than the cross-price elasticity in each channel, that is, . The self-price elasticity is bigger than the expansion effectiveness coefficient of greenness, that is, . Consumers have access to the actual products and examine the green products; it is assumed that .
Assumption 2.
To make the green product, the manufacturer must invest a large amount of resources to achieve green innovation. The investment cost function is , and is the cost effectiveness of the product’s environmental sustainability. In our model, we assume all the information about the cost and demand is symmetrical for the O2O members. All members are rational and their aim is to maximize their own profits. The manufacturer and O2O retailer are risk-neutral. We assume that consumers are willing to purchase green products.
Assumption 3.
The potential market size is sufficiently large. In order to avoid the economic paradox, we created additional inequality constraints for some parameters to ensure that (i) and (ii) . Therefore, we obtained:.
The manufacturer’s profit, the offline retailer’s profit, and the total channel profit are determined by
3. Model Solution
This section derives the optimal product prices and green degree for the chain member in the centralized and decentralized settings. We adopted a simple contract to coordinate the supply chain.
3.1. Centralized Setting
The best performance of a supply chain system occurs when different members perform as a centralized system. The decision variables of a supply chain system are , , and . By substituting Equation (1) and into Equation (8) we obtain
so that
In order to maximize , we developed some propositions regarding :
Proposition 1.
is concave in , and strictly jointly concave in and , but not jointly concave in , , and . (Appendix A).
Proposition 2.
Proposition 3.
- (1)
- ,
- (2)
- ,
- (3)
- , and
- (4)
- ,.
- (5)
- . (Appendix C).
We substitute Equations (10) and (11) into Equation (9) and differentiate with respect to . We let the derivatives be 0, which yields the first-order condition, and obtain
By substituting into Equations (10) and (11), we obtain and .
, and .
We can also get by substituting , , and into Equation (9).
3.2. Decentralized Setting
In this section, the profit function of manufacturers is as follows:
Proposition 4.
The manufacturer’s profit is strictly jointly concave in and . (Appendix D).
Proposition 5.
The manufacturer’s optimal online price and wholesale price with a given are given in Equations (14) and (15), respectively (Appendix E):
Proposition 6.
The retailer’s optimal offline price and manufacturer’s optimal wholesale price are given as follows with a given :
and (Appendix F)
Proposition 7.
- (1)
- ,
- (2)
- ,
- (3)
- , and
- (4)
- ,. (Appendix G).
Therefore, we substitute all the expressions into and differentiate it with respect to . We thus obtain the last expression of .
Proposition 8.
, . (Appendix H).
By substituting into Equations (15)–(17), we get the equilibrium prices of , , and :
, , and
.
Finally, we can obtain , , and by substituting , , , and into Equations (5)–(7).
3.3. Channel Coordination
According to the context comparison, the total profit of the decentralized mode is smaller than the centralized mode, and the price and greenness are different . Therefore, using a two-part tariff contract, we can coordinate the supply chain:
To solve the model, we get
and
The size of has an impact on the successful implementation of a simple two-part tariff. Thus, we have
The range of the lump fee that the manufactures pays the O2O retailer is .
Therefore, supply chain coordination is achieved and we get a win-win result in the O2O supply chain.
4. Numerical Experiments
In this section, we present numerical examples to compare the price, profit, and greenness in the O2O green supply chain. The parameter values used in this section is in Table 2. Then, we illustrate the effects of the cross-price factor, the expansion effectiveness of the coefficients of greenness, and the cost coefficient of greenness for the theoretical results in the two kinds of supply chain by numerical experiments.

Table 2.
Assignment data.
Figure 2 shows that as rises, the online channel price drops, and the offline retail channel price rises. To put it another way, the initial demand scale of different channels affects the pricing of the corresponding channel green products. When is below a threshold, the offline channel price is less than the online sale price. The larger the parameter is, the larger the offline price and the wholesale price are, and the lower the online price is.
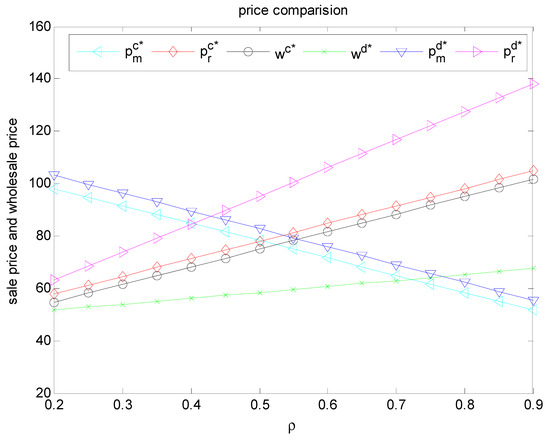
Figure 2.
Effects of on prices.
Figure 3 shows that as increases, the retailer’s profit increases in the decentralized decision-making, which is reasonable and consistent with the initial demand scale in the offline channel. The manufacturer’s profit is reduced first and then slowly increased during the decentralized decision-making. Obviously, the sum of the profit in the decentralized setting is less than that in the centralized setting. If the parameters are small enough, it will help the manufacturer access online channels and gain more online channel profits.
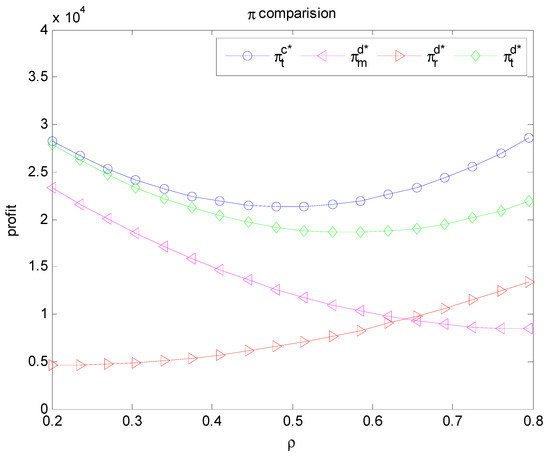
Figure 3.
Effects of on profits.
Figure 4 shows the effect on the parameter of the contract in the green supply chain as increases. As increase, changes more quickly than does, and it means there are differences in the bargaining power of the transfer expense between the manufacturer and the retailer.
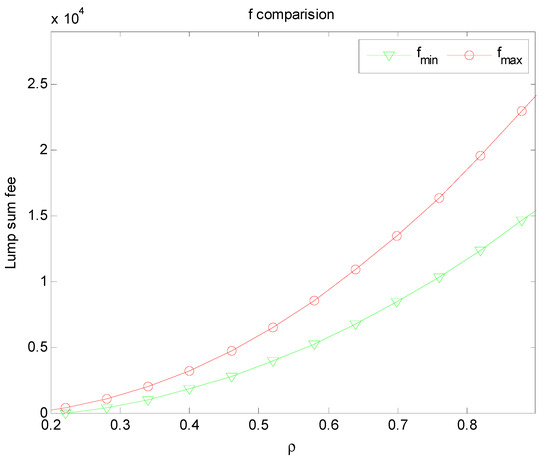
Figure 4.
Effects of on lump sum fee.
Figure 5 mainly shows that as increases, the greenness of the product slowly increases. However, it is clear that the growth rate in the decentralized setting is lower than the growth rate of the centralized setting. This is consistent with the previous derivation formula.
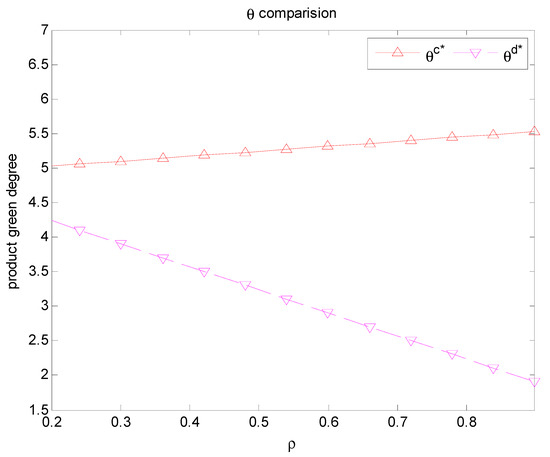
Figure 5.
Effects of on the optimal green degrees.
Figure 6 shows the impact of the unit expenditures on the coordinated transfer payments of the O2O green supply chain when working together and collaborating online and offline. The greater the unit expenditure is, the smaller the lump sum fee will be.
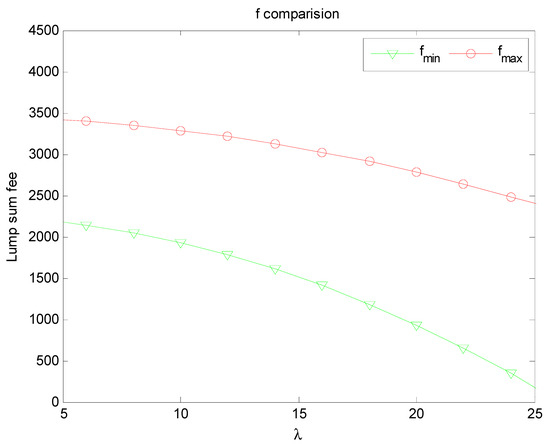
Figure 6.
Effects of on lump sum fee.
5. Implication
Based on the above research, some theoretical and management implications are obtained to enrich the O2O supply chain research. The centralized decision making always gives the best supply chain profit, and coordination contracts can improve the supply chain profit over the decentralized model. A two-part tariff contract can coordinate the GSC to achieve a win-win situation.
The transfer payment generated through the coordination of the leader can be further used for the cooperation between the manufacturer and the retailer. The amount of the transfer payment is affected by the bargaining power of channel members, and the dominant members can get more profits. When the retailer’s bargaining power is stronger than the manufacturer’s, it will affect the manufacturer’s investment in green technology. Manufacturers with lower bargaining power must invest more in greening to compete with retailers.
If the cost of green innovation is low, manufacturers can provide products with a high green level and increase the demand for green product, even at higher sales prices, and retailers benefit from online direct sales channels. The more fixed fee compensation a retailer receives, the more willing are they to implement the online and offline service cooperation mode.
In addition, consumers’ loyalty cannot be ignored. The higher the customer loyalty is, the more the demand for the retail channel. The higher the customer loyalty is, the higher the selling price of retailers.
6. Conclusions
This article analyzed an O2O green supply chain and the implementation model of a service cooperation between online channels and offline channels called “online purchase and offline cooperation”. We constructed a mathematical function and analyzed the greenness and pricing strategy in centralized and decentralized settings using the retailer Stackelberg game model. To examine the effects of the double marginalization of the supply chain, we used a simple two-part contract and developed green supply chain coordination. The contributions of this work are that we obtained pricing and green strategies by taking the cooperation of the offline channel and online channel into consideration in the O2O green supply chain environment.
In the O2O mode, we have made some contributions, but we also have some limitations. For example, we assume that all the demand is equal to the retailer’s order, but in the actual enterprise management practice, the inventory and the demand are not equal. Retailers are more like newsboys and the demand function is random. Future research should investigate the following issues: first, researchers should investigate the scenario where both offline channel demand and online channel demand are stochastic rather than deterministic. Second, researchers should investigate the scenario where the members of the supply chain are risk averse rather than risk neutral, which is in line with the actual production and operation management of most enterprises. Third, researchers should investigate the scenario where the practice of enterprise management is accompanied by information asymmetry rather than information symmetry.
Author Contributions
Conceptualization, G.W. and G.K.; methodology, G.W., Y.C. and T.L.; validation, G.W. and F.X.; formal analysis, G.W., T.L. and F.X.; data curation, G.W. and Y.C.; writing—original draft preparation, G.W. and G.K. All authors have read and agreed to the published version of the manuscript.
Funding
This research was funded by the National Nature Science Foundation of China (Grant No. U1811462), Ministry of Education Project of Humanities and Social Science (#20YJC6300064), and the China Postdoctoral Science Foundation (#2019M653388).
Acknowledgments
This work was partially supported by the National Nature Science Foundation of China (Grant No. U1811462), Ministry of Education Project of Humanities and Social Science (#20YJC6300064), and the China Postdoctoral Science Foundation (#2019M653388).
Conflicts of Interest
The authors declare no conflict of interest
Appendix A
The Hessian matrix of is:
Since , , and , is strictly jointly concave in and . However, due to and , or is uncertainty. Thus is indefinite with respect to and , and therefore is not jointly concave in , and .
Appendix B
;
;
Then
Thus, we get
- , and
Appendix C
.
.
.
.
Appendix D
The Hessian matrix of is
Similar to the front part, the manufacturer’s profit is strictly jointly concave in and , but not joint jointly concave with , , and .
Appendix E
.
Substituting , we obtain and
.
Then, we obtain
Appendix F
We substitute and into , and then take the first-order partial derivatives of , and let the derivatives be zero
Then, we get
Appendix G
- (1).
- .
- (2).
- .
- (3).
- .
- (4).
- , .
Appendix H
References
- Rao, P.; Holt, D. Do green supply chains lead to competitiveness and economic performance? Int. J. Oper. Prod. Manag. 2005, 25, 898–916. [Google Scholar] [CrossRef]
- Fahimnia, B.; Sarkis, J.; Davarzani, H. Green supply chain management: A review and bibliometric analysis. Int. J. Prod. Econ. 2015, 162, 101–114. [Google Scholar] [CrossRef]
- Jayaram, J.; Avittathur, B. Green supply chains: A perspective from an emerging economy. Int. J. Prod. Econ. 2015, 164, 234–244. [Google Scholar] [CrossRef]
- Gunasekaran, A.; Subramanian, N.; Rahman, S. Green supply chain collaboration and incentives: Current trends and future directions. Transp. Res. Part E 2015, 74, 1–10. [Google Scholar] [CrossRef]
- Agi, M.A.; Hazır, Ö. Game theory-based research in green supply chain management: A review. IFAC-PapersOnLine 2019, 52, 2267–2272. [Google Scholar] [CrossRef]
- Chen, Y.J.; Shed, J.-B. Environmental-regulation pricing strategies for green supply chain management. Transp. Res. Part E Logist. Transp. Rev. 2009, 45, 667–677. [Google Scholar] [CrossRef]
- Sheu, J.B. Bargaining framework for competitive green supply chains under governmental financial intervention. Transp. Res. Part E Logist. Transp. Rev. 2011, 47, 573–592. [Google Scholar] [CrossRef]
- Shed, J.-B.; Chen, Y.J. Impact of government financial intervention on competition among green supply chains. Int. J. Prod. Econ. 2012, 138, 201–213. [Google Scholar]
- Zhu, W.; He, Y. Green product design in supply chains under competition. Eur. J. Oper. Res. 2017, 258, 165–180. [Google Scholar] [CrossRef]
- Swami, S.; Shah, J. Channel coordination in green supply chain management. J. Oper. Res. Soc. 2013, 64, 336–351. [Google Scholar] [CrossRef]
- Ghosh, D.; Shah, J. A comparative analysis of greening policies across supply chain structures. Int. J. Prod. Econ. 2012, 135, 568–583. [Google Scholar] [CrossRef]
- Ghosh, D.; Shah, J. Supply chain analysis under green sensitive consumer demand and cost sharing contract. Int. J. Prod. Econ. 2015, 164, 319–329. [Google Scholar] [CrossRef]
- Xiao, Y.; Yang, S.; Zhang, L.; Kuo, Y.-H. Supply chain cooperation with price-sensitive demand and environmental impacts. Sustainability 2016, 8, 716. [Google Scholar] [CrossRef]
- Wei, J.; Wang, W.; Tsai, S.-B.; Yang, X. To cooperate or not? An analysis of complementary product pricing in green supply chain. Sustainability 2018, 10, 1392. [Google Scholar] [CrossRef]
- Agi, M.A.; Yan, X. Greening products in a supply chain under market segmentation and different channel power structures. Int. J. Prod. Econ. 2019. [Google Scholar] [CrossRef]
- Chen, X.; Luo, Z.; Wang, X. Impact of efficiency, investment, and competition on low carbon manufacturing. J. Clean. Prod. 2017, 143, 388–400. [Google Scholar] [CrossRef]
- Cohen, M.C.; Lobel, R.; Perakis, G. The impact of demand uncertainty on consumer subsidies for green technology adoption. Manag. Sci. 2016, 62, 1235–1258. [Google Scholar] [CrossRef]
- Chen, S.; Wang, X.; Wu, Y.; Zhou, F. Pricing policies of a dual-channel supply chain considering channel environmental sustainability. Sustainability 2017, 9, 382. [Google Scholar] [CrossRef]
- Chen, J.; Wu, D.; Li, P. Research on the pricing model of the dual-channel reverse supply chain considering logistics costs and consumers’ awareness of sustainability based on regional differences. Sustainability 2018, 10, 2229. [Google Scholar] [CrossRef]
- Ma, W.; Cheng, Z.; Xu, S. A game theoretic approach for improving environmental and economic performance in a dual-channel green supply chain. Sustainability 2018, 10, 1918. [Google Scholar] [CrossRef]
- Qi, Q.; Wang, J.; Xu, J. A dual-channel supply chain coordination under carbon cap-and-trade regulation. Int. J. Environ. Res. Public Health 2018, 15, 1316. [Google Scholar] [CrossRef] [PubMed]
- Li, B.; Zhu, M.; Jiang, Y.; Li, Z. Pricing policies of a competitive dual-channel green supply chain. J. Clean. Prod. 2016, 112, 2029–2042. [Google Scholar] [CrossRef]
- Li, B.; Chen, W.; Xu, C.; Hou, P. Impacts of government subsidies for environmental-friendly products in a dual-channel supply chain. J. Clean. Prod. 2018, 171, 1558–1576. [Google Scholar] [CrossRef]
- Basiri, Z.; Heydari, J. A mathematical model for green supply chain coordination with substitutable products. J. Clean. Prod. 2017, 145, 232–249. [Google Scholar] [CrossRef]
- Ranjan, A.; Jha, J. Pricing and coordination strategies of a dual-channel supply chain considering green quality and sales effort. J. Clean. Prod. 2019, 218, 409–424. [Google Scholar] [CrossRef]
- Heydari, J.; Govindan, K.; Aslani, A. Pricing and greening decisions in a three-tier dual channel supply chain. Int. J. Prod. Econ. 2018, 217, 185–196. [Google Scholar] [CrossRef]
- Tsay, A.A.; Agrawal, N. Channel dynamics under price and service com-petition. Manuf. Serv. Oper. Manag. 2000, 2, 372–391. [Google Scholar] [CrossRef]
- Tsay, A.; Agrawal, N. Channel conflict and coordination in the e-commerce age. Prod. Oper. Manag. 2004, 13, 93–110. [Google Scholar] [CrossRef]
- Tsay, A.; Agrawal, N. Modeling conflict and coordination in multi-channel distribution systems: A Review. In Handbook of Quantitative Supply Chain Analysis; Springer: Berlin/Heidelberg, Germany, 2004; pp. 557–606. [Google Scholar]
- Dan, B.; Xu, G.; Liu, C. Pricing policies in a dual-channel supply chain with retail services. Int. J. Prod. Econ. 2012, 139, 312–320. [Google Scholar] [CrossRef]
- Huang, S.; Yang, C.; Zhang, X. Pricing and production decisions in dual-channel supply chains with demand disruptions. Comput. Ind. Eng. 2012, 62, 70–83. [Google Scholar] [CrossRef]
- Lu, Q.; Liu, N. Effects of e-commerce channel entry in a two-echelon supply chain: A comparative analysis of single- and dual-channel distribution systems. Int. J. Prod. Econ. 2015, 165, 100–111. [Google Scholar] [CrossRef]
- Jian, X.; Bin, D. Service cooperation pricing strategy between manufacturers and retailers in dual-channel supply chain. Syst. Eng. Theory Pract. 2010, 30, 2203–2211. [Google Scholar]
- Xumei, Z. A compensation strategy for coordinating dual-channel supply chains in e-commerce. Ind. Eng. Eng. Manag. 2012, 26, 1. [Google Scholar]
- Zhao, F.; Wu, D.; Liang, L.; Dolgui, A. Lateral inventory transshipment problem in online-to-offline supply chain. Int. J. Prod. Res. 2016, 54, 1951–1963. [Google Scholar] [CrossRef]
- Yu, D.Z.; Cheong, T.; Sun, D. Impact of supply chain power and drop-shipping on a manufacturer’s optimal distribution channel strategy. Eur. J. Oper. Res. 2017, 259, 554–563. [Google Scholar] [CrossRef]
- Ji, J.; Zhang, Z.; Yang, L. Comparisons of initial carbon allowance allocation rules in an O2O retail supply chain with the cap-and-trade regulation. Int. J. Prod. Econ. 2017, 187, 68–84. [Google Scholar] [CrossRef]
- He, Y.; Zhang, J.; Gou, Q.; Bi, G. Supply chain decisions with reference quality effect under the O2O environment. Ann. Oper. Res. 2018, 268, 273–292. [Google Scholar] [CrossRef]
© 2020 by the authors. Licensee MDPI, Basel, Switzerland. This article is an open access article distributed under the terms and conditions of the Creative Commons Attribution (CC BY) license (http://creativecommons.org/licenses/by/4.0/).