Article

Decision-Support System for LID Footprint Planning and Urban Runoff Mitigation in the Lower Rio Grande Valley of South Texas

1
Research, Applied, Technology, Education and Service, Inc., Rio Grande Valley, Edinburg, TX 78540, USA
2
Department of Environmental Engineering, Texas A&M University-Kingsville, Kingsville, TX 78363, USA
3
Department of Civil Engineering, University of Texas Rio Grande Valley, Edinburg, TX 78539, USA
*
Author to whom correspondence should be addressed.
Sustainability 2020, 12(8), 3152; https://doi.org/10.3390/su12083152
Submission received: 15 March 2020 / Revised: 4 April 2020 / Accepted: 6 April 2020 / Published: 14 April 2020
(This article belongs to the Special Issue Urban Stormwater Management by Green Infrastructure)

Abstract

:
To address regional flooding in the United States, federal and state agencies are adopting strict drainage policies in any large-scale commercial development within the watershed boundary. The conventional approach of implementing a wet detention pond (WP) reduces the land cover and causes operation and maintenance challenges eventually. The present study developed a decision-support system (DSS) in the Lower Rio Grande Valley region of South Texas for optimal selection of Best Management Practices (BMPs) by substituting a portion of the WP footprint with three regionally promising low-impact development practices, namely, porous concrete pavement (PCP), bioretention (BR), and bioswale (BS). Source Load Assessment and Management Model for Windows (WinSLAMM) was used as the foundation for the DSS database and algorithm development. This tool suggested that the implementation of bioswale alone can considerably reduce the footprint and construction cost. Less than 0.95 ha of installation of BR and BS can mitigate 79–91% of runoff from a maximum of 5 ha of commercial development. A combination of BR, BS, and WP was found to reduce runoff significantly (~100%), which suggests that the successful adoption of DSS might support better planning of the urban stormwater management in the Lower Rio Grande Valley (LRGV).

1. Introduction

Rapid urbanization and industrialization have significantly fueled the total percentage of impervious land cover (such as traditional parking lots driveways, sidewalks, roofs, etc.) within the major watersheds of the United States (US) [1,2,3,4]. Urban land developments increased by four times between the years 1945 and 2010 [5], which eventually altered the watershed hydrology and triggered an uncontrolled runoff towards major rivers in the US [6]. The first flush of urban runoff carries non-point source (NPS) pollutant load, which eventually adversely affects the water quality of the watershed [7,8,9]. Since the 1980s, federal and state agencies have been working to update the watershed protection plans and adjust existing drainage policy measures to address the impairment of the US rivers, with the involvement of cities and the Stormwater Task Force (STF) partners [10,11].
In most US states, the conventional approach to meet the stormwater discharge goal through the detention of runoff is to design a wet or dry detention pond with a large footprint and maintenance burdens [12]. The flat terrain of the watershed provides stormwater engineers with complicated flow, detention, and flood design problems [13]. Although designing detention ponds is somewhat effective and the calculation of storage is simple using Excel spreadsheets, this approach may cause the reduction of land cover; problems with safety, operation, and maintenance; and aesthetic issues in the future [14]. Communities have been stressing successful planning of innovative stormwater management techniques to reduce non-point source pollutants; to mitigate localized flooding in urban, colonial, and rural settings; and to improve water quality [15].
The implementation of Low-Impact Development (LID)—Best Management Practices (BMPs)—has been encouraged to promote onsite mitigation of polluted runoff before discharging into the local storm sewer [10]. With the use of innovative LID strategies, the traditional design of a large detention pond footprint can be reduced or eliminated by allowing the LID footprint to be incorporated into design detention calculations [16]. LID is an ecologically based engineered landscape that helps to return the urbanized watersheds to predevelopment hydrological conditions. LID differs from the conventional approach because it has the function of returning the runoff to the hydrological cycle, including runoff volume reduction and improvement in water quality [17]. It also provides environmental services, territorial cohesion, preservation of biodiversity, and sustainable development [18,19]. However, LID is not typically integrated at the beginning of the planning process because of the high capital and retrofitting cost for some BMPs [12,20], more specifically in rapidly grown urban areas. Even though it is recommended on some occasions, it is not mandated in the drainage ordinances [21]. The recent challenge is to decide how to plan LIDs efficiently within a commercial development to meet a certain storm discharge goal from the drainage site.
Several decision-support systems were developed as tools to compare and evaluate different LID scenarios within the watershed boundary [22]. One study developed a tool for the placement of LIDs based on the defined precipitation and soil moisture conditions. Results showed the areas that are the most suitable locations for LID installments and the optimal facility with higher retention abilities of the accumulated runoff [23]. Another study developed an algorithm to allow the selection of LIDs with the lowest cost, the highest runoff reduction, and the highest likelihood of private-owner maintenance in various sub-watersheds [24]. Another similar study developed a decision-making tool by evaluating various alternatives to determine the most cost-effective types and combinations of LIDs that maximize the water quality benefits [25]. In dealing with the complex issues in stormwater management, the use of decision-support systems supported by modeling tools is becoming increasingly popular [26]. Analyzing LID through coupling modeling software with a multi-objective optimization using genetic algorithms has been a common method [22,27]. Ercolani et al. used the MOBIDIC-U hydrologic model equipped with SMART-GREEN, which is a Quantum Geographic Information System (QGIS) plugin interface, to study the effects of green roofs in an urban watershed [28]. Their study revealed that green roofs might work better under more frequent storms of smaller magnitude, and their efficiency can be increased with spatially heterogeneous implementation. Martin-Mikle et al. presented a spatially explicit method using Geographic Information System (GIS) for the placement of LIDs within the urban watershed to increase cost-effectiveness and ecological benefits [5]. Meeorw and Newell developed a Green Infrastructure Spatial Planning (GISP) model to aid in identifying trade-offs, synergies, and hotspots for future green infrastructures (GI) with maximum ecosystem services [29]. Charoenkit and Piyathamrongchai developed a framework for the comparative assessment of multifunctionality among different urban ecosystem structures [30]. A previous study evaluated a machine learning approach using artificial neural network (ANN), adaptive network-based fuzzy inference system (ANFIS) algorithms, and statistical modeling to predict the probability of green or grey transformation for vacant places, poor condition sites, and waterway corridors [31]. Previously, the Storm Water Management Model (SWMM)-calibrated green infrastructure models were used to assess runoff reductions via different location strategies within the watershed, both spatially known and unknown [32].
Previous studies evaluated the performance of LID systems to be location-dependent. Several factors can affect the LID effectiveness; efficacy depends on the type, design, and local conditions such as the topography of the site, the soil type/conditions, the rainfall patterns, and other types of hydrological and meteorological properties [33]. Due to the variation of each watershed’s character, there are many disciplinary factors, such as hydrology (stormwater runoff reduction), ecology, health (air and water pollution), urban landscape (social activity), etc. The guidelines for BMP planning are not consistent, even between neighboring cities, due to the hydrogeological variation. For example, stormwater runoff generated from a 25-year frequency storm event in a new commercial development in San Benito, Texas was generally required to be detained on-site to be released into a receiving system at a 25-year predevelopment discharge rate. On the other hand, the city of Weslaco followed more stringent drainage policies, with a 10-year predevelopment discharge rate because of its lower elevation [34]. Most of the previous studies focused on the development of a framework for identifying the optimal distribution of BMPs within a mixed-use watershed for maximizing ecosystem services [5,32]. One previous study also prioritized economic evaluation as a decision-support tool for strategic spatial planning of green infrastructures [35]. Very few studies have attempted to develop a region-specific decision-support framework to assess the LID transformation in a small-scale or commercial development boundary to reveal both maximum ecosystem services and minimum costs. Still, there is a lack of a well-established tool to enforce the local drainage policy in optimal selection and evaluation of combined BMP scenarios for maximizing hydrologic benefits in urban development [32,36,37]. The proper selection of a BMP or BMPs in series through innovative planning, management, and engineering approaches will not only benefit communities but will also protect the water quality and ecosystems of the watershed [7].
Source Load Assessment and Management Model for Windows (WinSLAMM) is a Stormwater Quality Modeling Tool, which can evaluate stormwater controls based on the field environment and actual design values [38]. It was designed to provide relatively complex outputs, such as runoff volume, pollutant mass loadings, and the effects of critical conditions on control practices. It is mostly used as a planning tool to better understand the sources of urban runoff pollutants and their control strategies. It has been widely used and extensively reviewed in many LID implementation studies in North America and has been proven reasonable in predicting stormwater flows and pollutant characteristics from a wide range of rainfall events, urban development characteristics, and control practices [38,39,40]. WinSLAMM predicts runoff based on the results of field data from the National Stormwater Database and actual design values of BMPs [38,41]. Therefore, the model is capable of predicting results even when there are no field-input data by using the complete package of default-calibrated files generated from previous LID data collection within the USA. It uses a simple rainfall-runoff equation (Rational Method) to predict runoff volumes, with errors ranging from 10% to 30% [40]. By using 3–5 years of rainfall-runoff data, it is possible to calibrate the model for future runoff and even more reliable water quality prediction. WinSLAMM is highly advanced in its LID control features [42]. The model can use BMPs as external control practices beyond the boundary of land use development. The model outputs can be summarized per month and incorporated into the SWAT model and Geographic Information System (GIS) Platforms [39,43,44,45].
To address the water quality issues at the US-Mexico border associated with non-point source pollution in the Lower Rio Grande Valley (LRGV) region within the Arroyo Colorado watershed, this study was designed to develop an innovative Decision-Support System (DSS) for the planning of a BMP(s) footprint to replace a portion of conventional detention practices with LID echo-technologies. The preliminary objective of this study is to generate calibrated-BMP models of three LID BMPs (porous concrete pavement, bioretention, and bioswale) using WinSLAMM for the semi-arid climatic region of LRGV in South Texas. The primary objective is to apply BMP models to establish a novel methodology for the DSS development and to assess its feasibility in determining the footprint of an individual BMP or BMPs in series, as well as their hydrologic performance (peak flow, runoff volume reduction), for a range of sizes of commercial developments. In a broader picture, this novel algorithm is expected to evaluate existing BMP footprint requirements or seek LID options as an alternative to existing or conventional facilities (e.g., wet detention pond). If the tool proves adequate, a similar algorithm can be applied to other impaired watersheds in the US and the rest of the world.

2. Materials and Methods
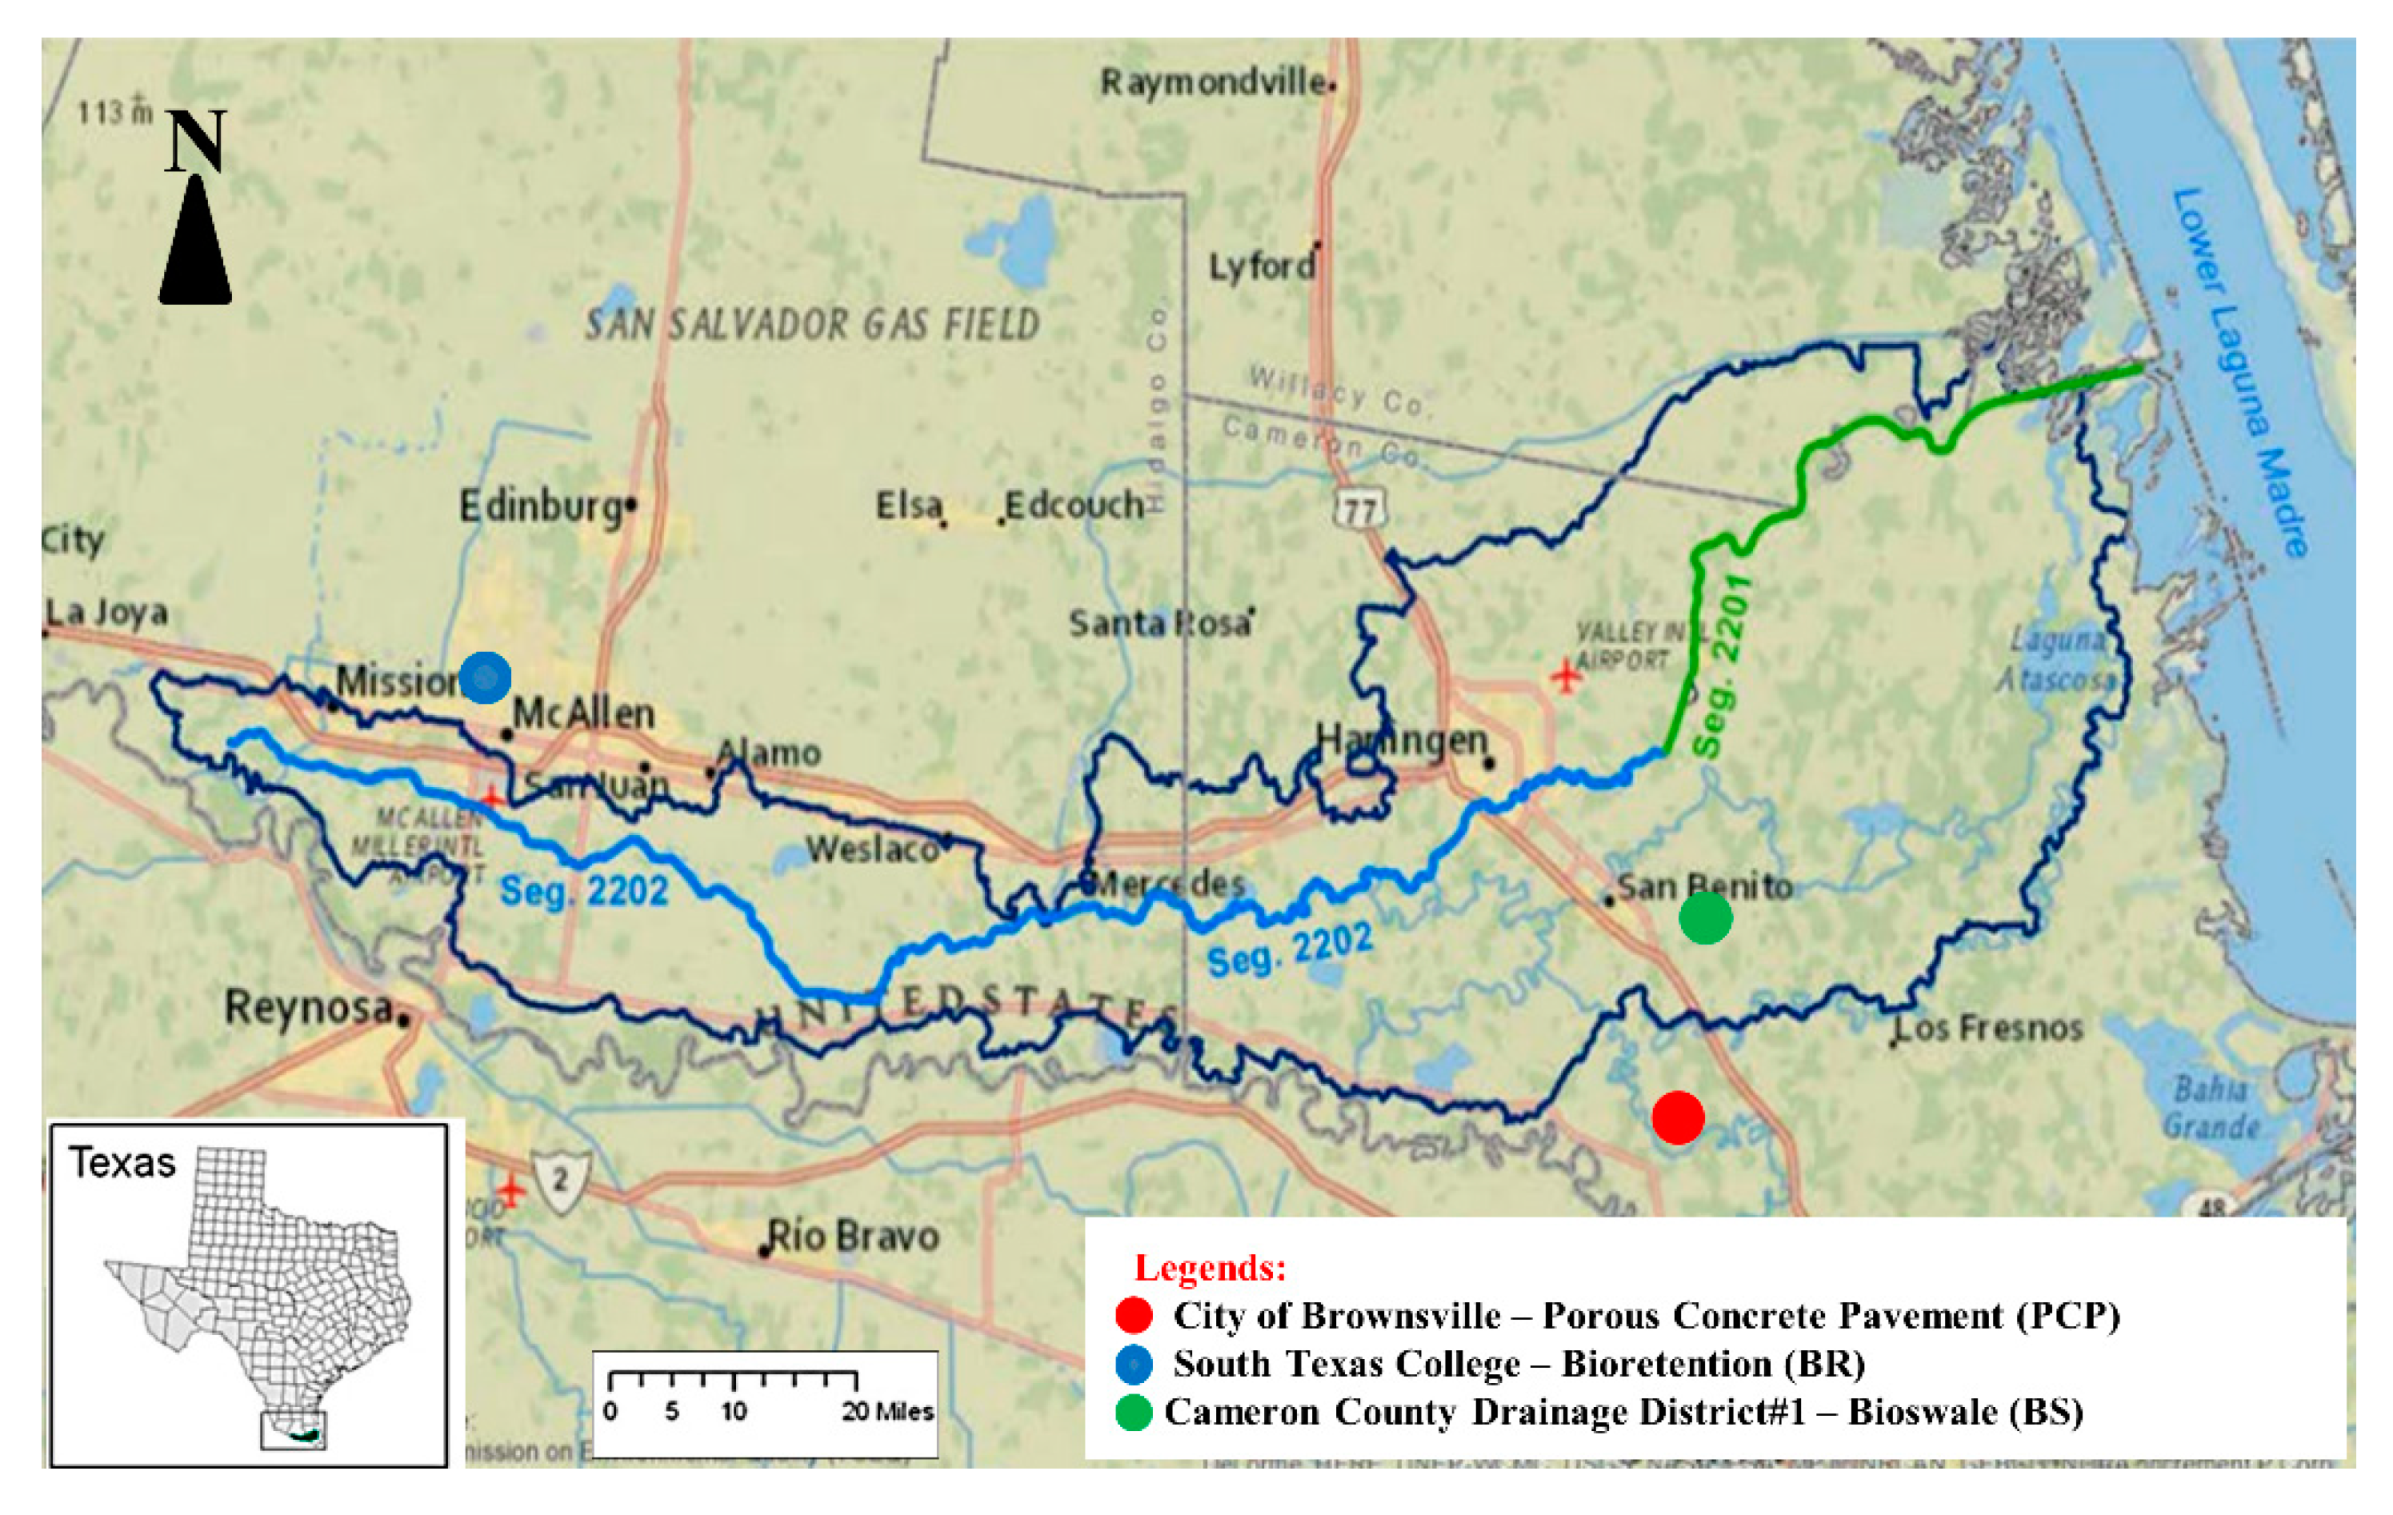
2.1. Study Case

This study focused on the Arroyo Colorado River, which passes through the heart of the Lower Rio Grande Valley (LRGV) of South Texas, which extends up to 145 km from Mission, TX, to the Lower Laguna Madre. The total reach of the river has been divided into two segments by the Texas Commission on Environmental Quality (TCEQ): the tidal segment (Segment 2201) and the above-tidal segment (Segment 2202) [4,13,46]. TCEQ identified both of these segments as impaired due to high nutrient and bacterial concentration and low Dissolved Oxygen (DO) level. Rapid urbanization and industrialization adversely replaced the existing vegetative cover [13,46,47], which eventually triggered the non-point source (NPS) pollution within the Arroyo Colorado watershed (Figure 1). The impairment inspired the development of the Arroyo Colorado Watershed Protection Plan in 2007 by local, state, and federal stakeholders to improve the surface water quality of the watershed.
Under the TCEQ-sponsored Clean Water Act 319 LRGV LID implementation program, flow data were monitored from six LID BMPs initially. Flow data were monitored from BMPs installed in different locations in the LRGV from August 2014 through March 2017 [48]. From our field assessment, three LID BMPs (porous pavement, bioretention, and bioswale) were found “most promising” in terms of peak flow and runoff volume reduction in the semi-arid climatic region of LRGV in South Texas. Therefore, the following BMPs were prioritized in this study to be incorporated into the DSS algorithm:
  • City of Brownsville—Porous Concrete Pavement (PCP)
  • South Texas College—Bioretention (BR)
  • Cameron County Drainage District#1—Bioswale (BS)

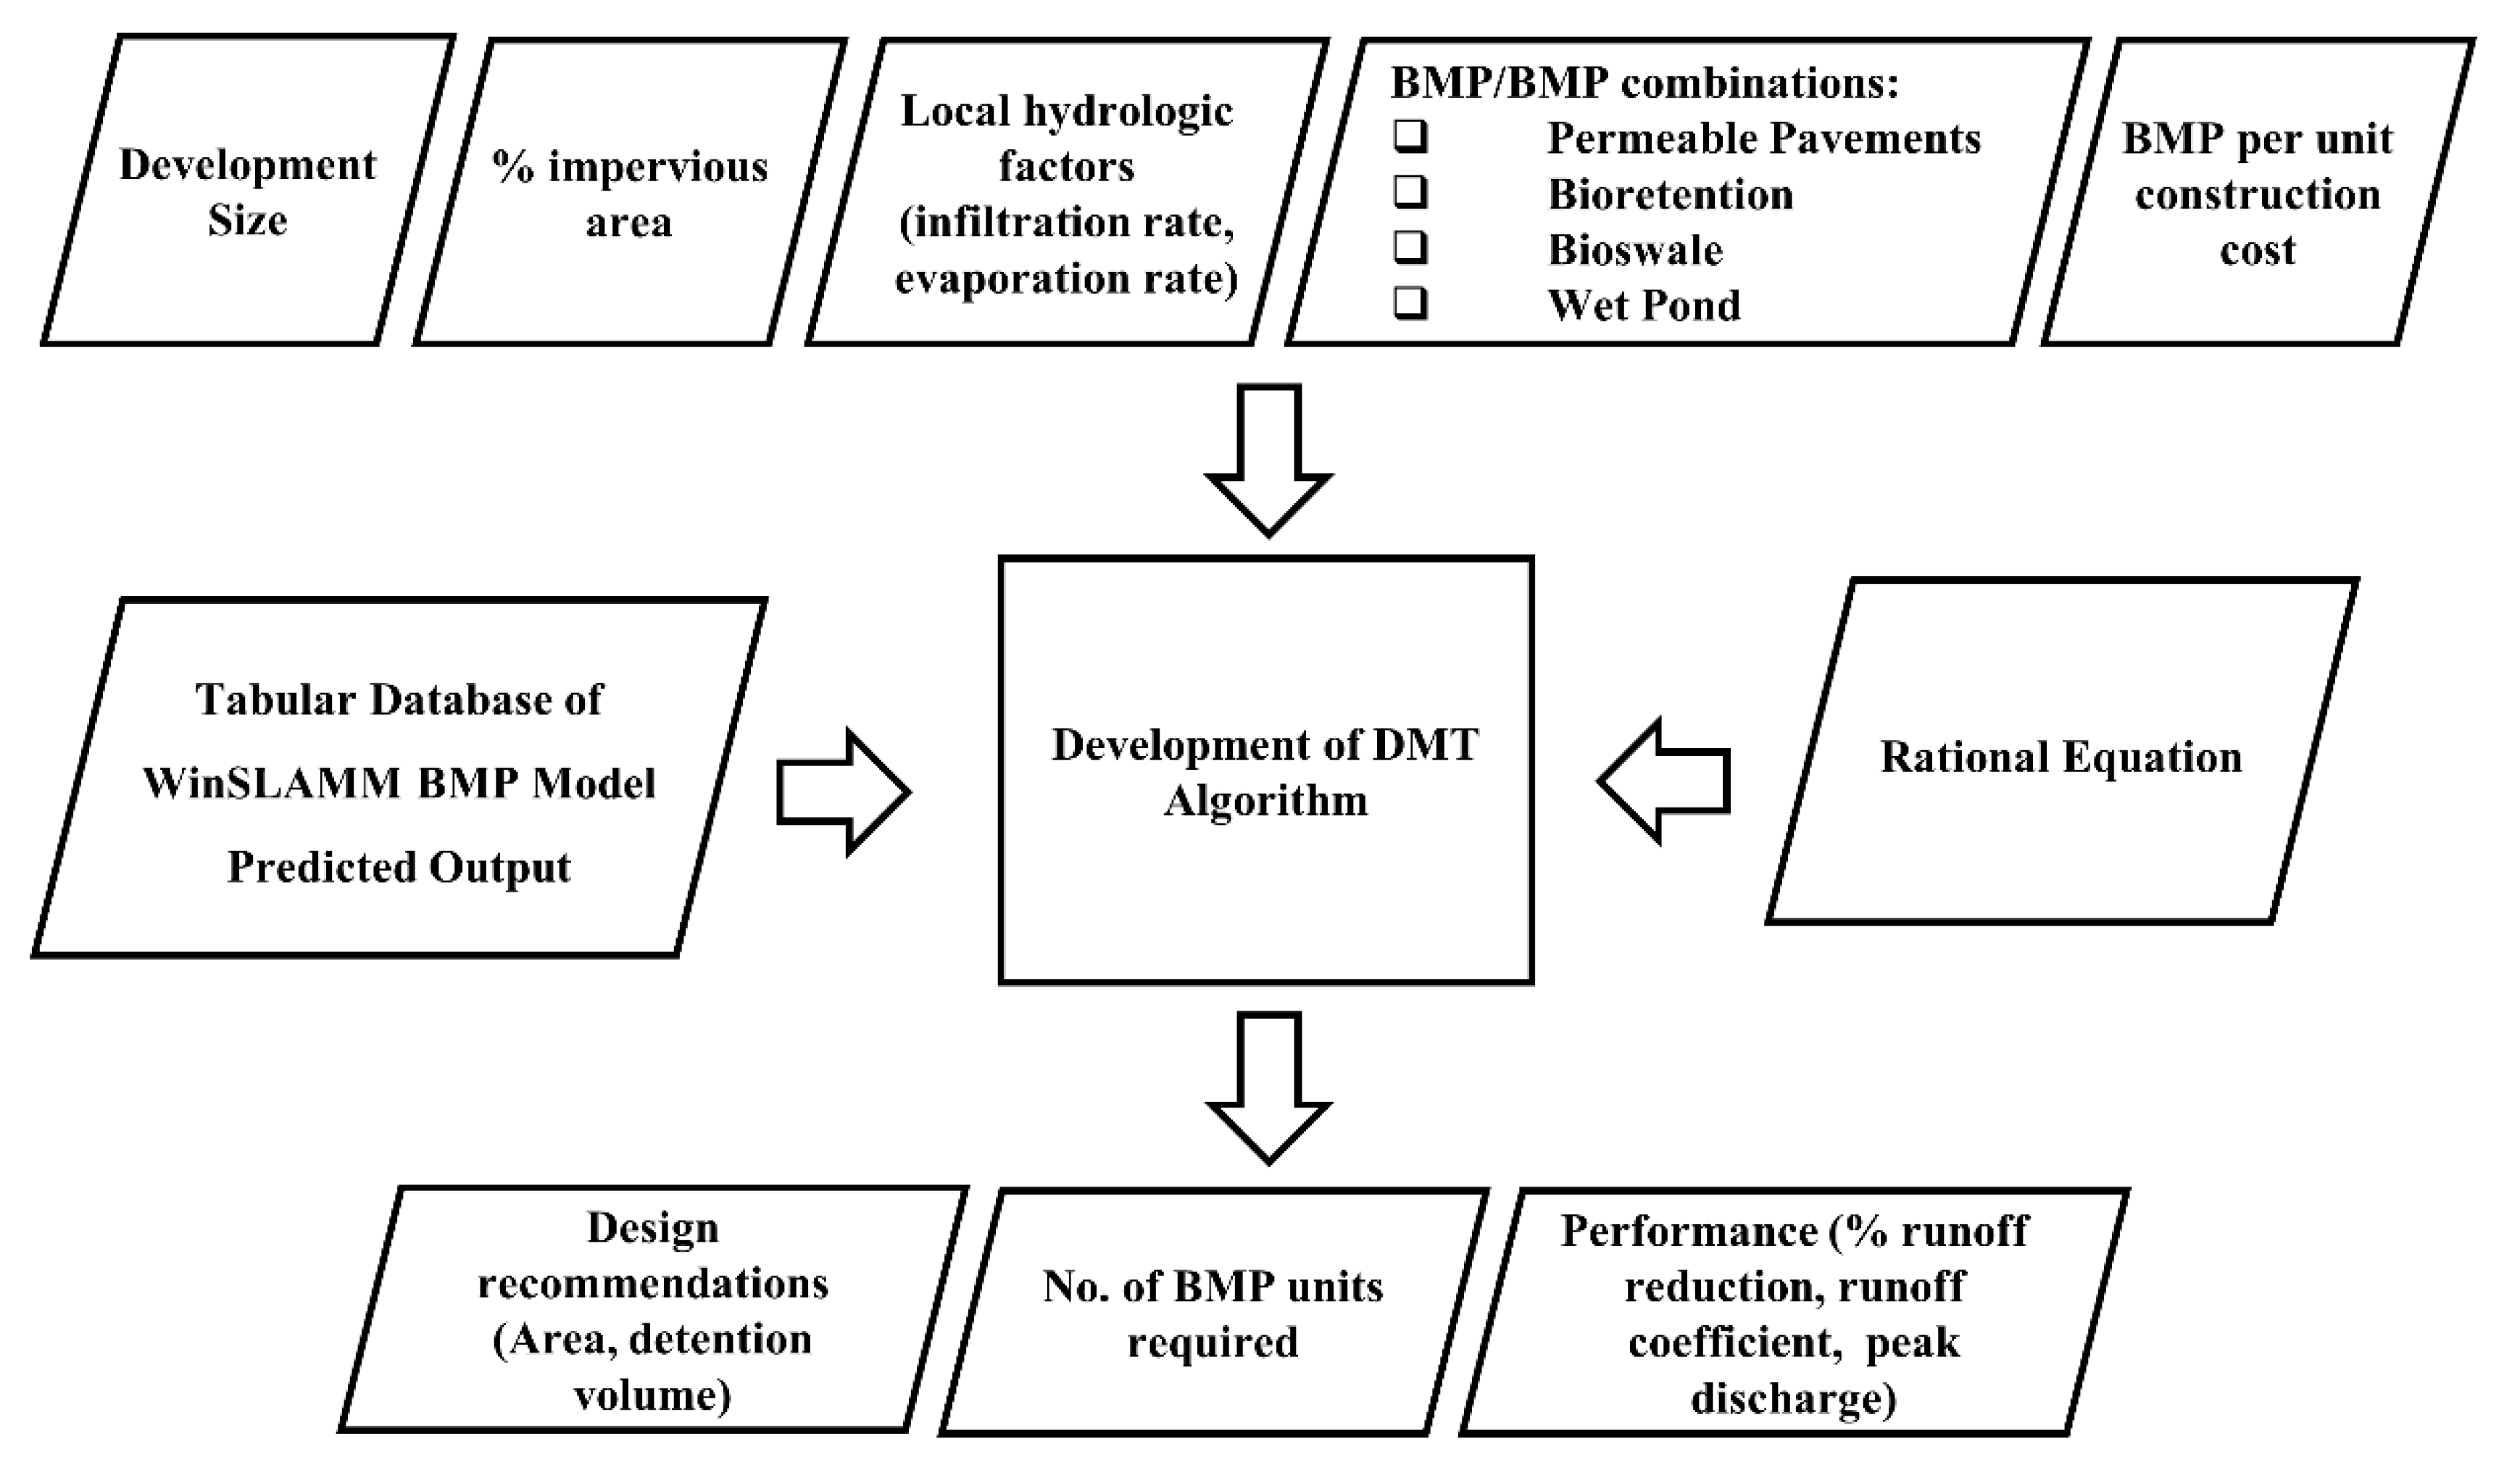
2.2. DSS Framework for LID Footprint Planning and Evaluation

The DSS was developed as an innovative calculator for the LID footprint planning in a proposed commercial development to meet the 10-year discharge goal from a 50-year rainfall event. As a planning tool, the DSS algorithm has been written in the Visual Basic programming language and formulated as a macro-enabled Excel spreadsheet to support the discharge calculation as a basis for BMP planning. The user has control over the selection of a city, which is linked to the local soil characterization parameters (runoff coefficient, surface infiltration rate, etc.). Feedback from local engineers/planners/stakeholders was gathered to assess city-specific hydrologic and geologic information. The tool was successfully designed to accept input parameters, such as development size, predeveloped land cover, evaporation rate, type of BMP(s), and per unit construction cost. The database and algorithm of the DSS were generated from the output resulting from the assessment, evaluation, and field-calibrated WinSLAMM model of three BMPs (permeable pavements, bioretention, and bioswale). The tool was designed to provide the outcomes, such as required BMP footprint, detention volume, size, and the number of BMP units needed to accomplish the objectives. The tool can predict the uncontrolled and controlled performance of the site in terms of peak discharge, total runoff volume, percentage of runoff reduction, runoff coefficient, etc. The tool is also able to estimate the total lifecycle cost of BMP(s). Figure 2 shows the overall framework of the DSS for the accomplishment of the objective of this study.

2.3. BMP Data Acquisition and Analysis

The raw flow data were retrieved from the ISCO Signature flow meter and analyzed for each rainfall event to calculate the flow volume at the BMP outfall. The total inflow volume onto the BMPs was calculated by summing up the direct rainfall volume (calculated from the ISCO 674 Rain Gauge data) onto the BMP surface and the runoff generated in the drainage areas. Later, volume reduction was calculated and converted to a normalized unit by dividing it by the area of BMP installation. Normalized runoff volume reduction (ΔV) was calculated to evaluate the performance of each BMP by using the following Equation (1):
Δ V = V i V o A p   ×   100
where Vi = total inflow volume (m3), V0 = total outflow volume (m3), and Ap = area of BMP installation (m2).

2.4. WinSLAMM Model Development

A site-specific rainfall file (.RAN) was created for each type of monitored BMP. The particulate solids concentration (.pscx) and pollutant probability distribution (.ppdx) files were selected from the default standardized files for the Central US zone. The street delivery file (.std) was selected for the other urban and commercial land use developments. The particle size distribution and peak-to-average ratio files (.csv) were selected from the NURP database. The “as-built” design information of each BMP was assimilated and entered as model input parameters. All cross-sectional design values were collected from the drawing sheets provided by the contractors. The subgrade seepage rate was obtained from the geotechnical reports provided by the lead engineers. Within a designated land use, the type and area of source contributions to runoff generation were defined. For the first simulation, default runoff coefficient files (.rsvx) were selected for the Central US zone. The flow routing process was defined in the model window, which includes the delineation of land use, conduits, junctions, BMP, and outfall. Local calibration of BMPs was emphasized based on the degree of discrepancy between observed and simulated runoff reduction results. For significant deviation, the default runoff coefficient (Rv) values were adjusted to bring the simulated results close to the observed results. The goodness of fit between both results was statistically justified through determining the Kling-Gupta efficiency (KGE) and Root Mean Square Error (RMSE) [49]. Furthermore, the p-value for supporting the correlation was reported through a regression hypothesis test. Later, all calibrated BMP models were validated with a separate observed dataset. The following Equations (2) and (3) were used to calculate statistical parameters to assess the correlation between observed and model-simulated results:
KGE = 1 ( r 1 ) 2 + ( σ s i m σ o b s 1 ) 2 ( µ s i m µ o b s 1 ) 2
RMSE = i 1 n ( y i x i ) 2 n
where r = linear correlation between observations and simulations, σobs = standard deviation in observations, σsim = standard deviation in simulations, µobs = observation mean, µsim = simulation mean, n = number of observations, xi = model-simulated runoff reduction for a particular rainfall event (i) (mm), and yi = observed runoff reduction for a particular rainfall event (i) (mm). A higher value of KGE (>0.8), lower value of RMSE (<30%), and a p-value less than 0.05 were preferred to support the adequacy of the best-fitted correlation between observed and model-predicted results [50,51,52,53].

2.5. DSS Algorithm Development

The DSS uses the Rational Method (uncontrolled conditions), and WinSLAMM transformed BMP equations (controlled conditions) to calculate the peak discharge from proposed commercial developments for the Arroyo Colorado watershed. For the uncontrolled or baseline condition, the peak discharge from a rainfall event was calculated by taking the difference between the discharge calculated by the rational method and the volumetric evaporation rate (rate of evaporation, mm/h × total area of commercial development, m2) [54]. In the discharge calculation, the rainfall intensity was assumed to be the seasonal average for each of the three LRGV counties in Texas: Hidalgo, Willacy, and Cameron. From the Intensity-Duration-Frequency (IDF) curve for these counties, the rainfall intensity corresponding to the 50 and 10-year 24-h storm events was estimated to be 12.7 and 7.62 mm/h, respectively. The intensity is multiplied by a seasonal variation factor of 3.8 to simulate a wet weather condition. Within the algorithm, the total volume of runoff was calculated by multiplying the rainfall duration by the peak discharge as per flow-volume relationship [55]. The following Equations (4)–(7) were written for the DSS algorithm to calculate 50- and 10-year peak discharge and runoff volume:
Q p , 50 = ( i 50 × C i × A × S V F ) ( E × A )  
V p , 50 = Q p , 50 × t  
Q p , 10 = [ i 10 × { ( C i × A i ) + ( C p × A p ) } × S V F ] ( E × A )  
V p , 10 = Q p , 10 × t  
where Qp,10, Qp,50 = peak discharge from 10- and 50-year 24-h storm events (m3/s); Vp,10, Vp,50 = peak volume of runoff from 10 and 50-year 24-h storm events (m3); i10, i50 = average rainfall intensity of 10- and 50-year 24-h storm events; A = total area of proposed commercial development (ha); Ai = total area of existing impervious cover at the predeveloped site (ha); Ci = runoff coefficient for existing impervious cover = 0.98 (assumed); Ap = total area of impervious cover at the predeveloped site (ha); Cp = runoff coefficient for impervious cover = 0.98 (ha); SVF = seasonal variation factor, for wet seasons = 3.8 (assumed); E = evaporation rate (mm/h); t = time.
In the development of the DSS algorithm for the controlled condition, WinSLAMM was used to create a database for four BMPs. The database was generated in terms of peak discharge as an output resulting from the WinSLAMM-calibrated BMP models for varying development sizes and installation areas. The information gathered from the database was transformed into equations to build the algorithm for the DSS in the Visual Basic programming language. The calculated volumetric evaporation rate was subtracted from the peak discharge calculated from the WinSLAMM-translated BMP equation to estimate the discharge after the installation of a BMP that covers a specific footprint area. The following Equation (8) is the generic form of the algorithm written to calculate the peak discharge with a single control practice:
Q p , C P   ( i ) = ( b i × A d i ) ( E × A )
where i = BMP footprint trial number; Qp,CP (i) = peak discharge with single control practice for an ith footprint trial (m3/s); bi, di = regression coefficients, which depend on the size of the BMP footprint; A = total area of proposed commercial development (ha); E = evaporation rate (mm/h).
For BMPs in series, the summation of peak discharge reductions for all control practices was subtracted from the 50-year 24-h peak discharge to calculate the final peak discharge. The following Equation (10) is the generic form of the algorithm:
Q p , c o m b   ( i ) = Q p , 50 { ( Q p , 50 Q p , C P 1 ) + ( Q p , 50 Q p , C P 2 ) + ( Q p , 50 Q p , C P 3 ) }
Equation (10) can be simplified and written in the following form:
Q p , c o m b   ( i ) = ( Q p , C P 1 + Q p , C P 2 + Q p , C P 3 ) 2 Q p , 50
where Qp,comb, (i) = peak discharge when a commercial development is incorporated with the combination of i thfootprint trial of all BMPs in series (m3/s); Qp,CP1 = peak discharge when a commercial development is incorporated with LID control practice 1; Qp,CP2 = peak discharge when a commercial development is incorporated with LID control practice 2; Qp,CP3 = peak discharge when a commercial development is incorporated with LID control practice 3; Qp,50 = peak discharge from the 50-year 24-h storm event (m3/s).
Later, a convergence algorithm in Visual Basic was developed for BMP size determination. If the calculated Qp, CP (i) or Qp, comb, (i) is found to be less than Qp,10 for a specific footprint of the BMP(s), the algorithm ceases and considers the footprint size to be finalized. Otherwise, the algorithm goes for a further trial to look for the next available size and check for convergence again.

3. Results

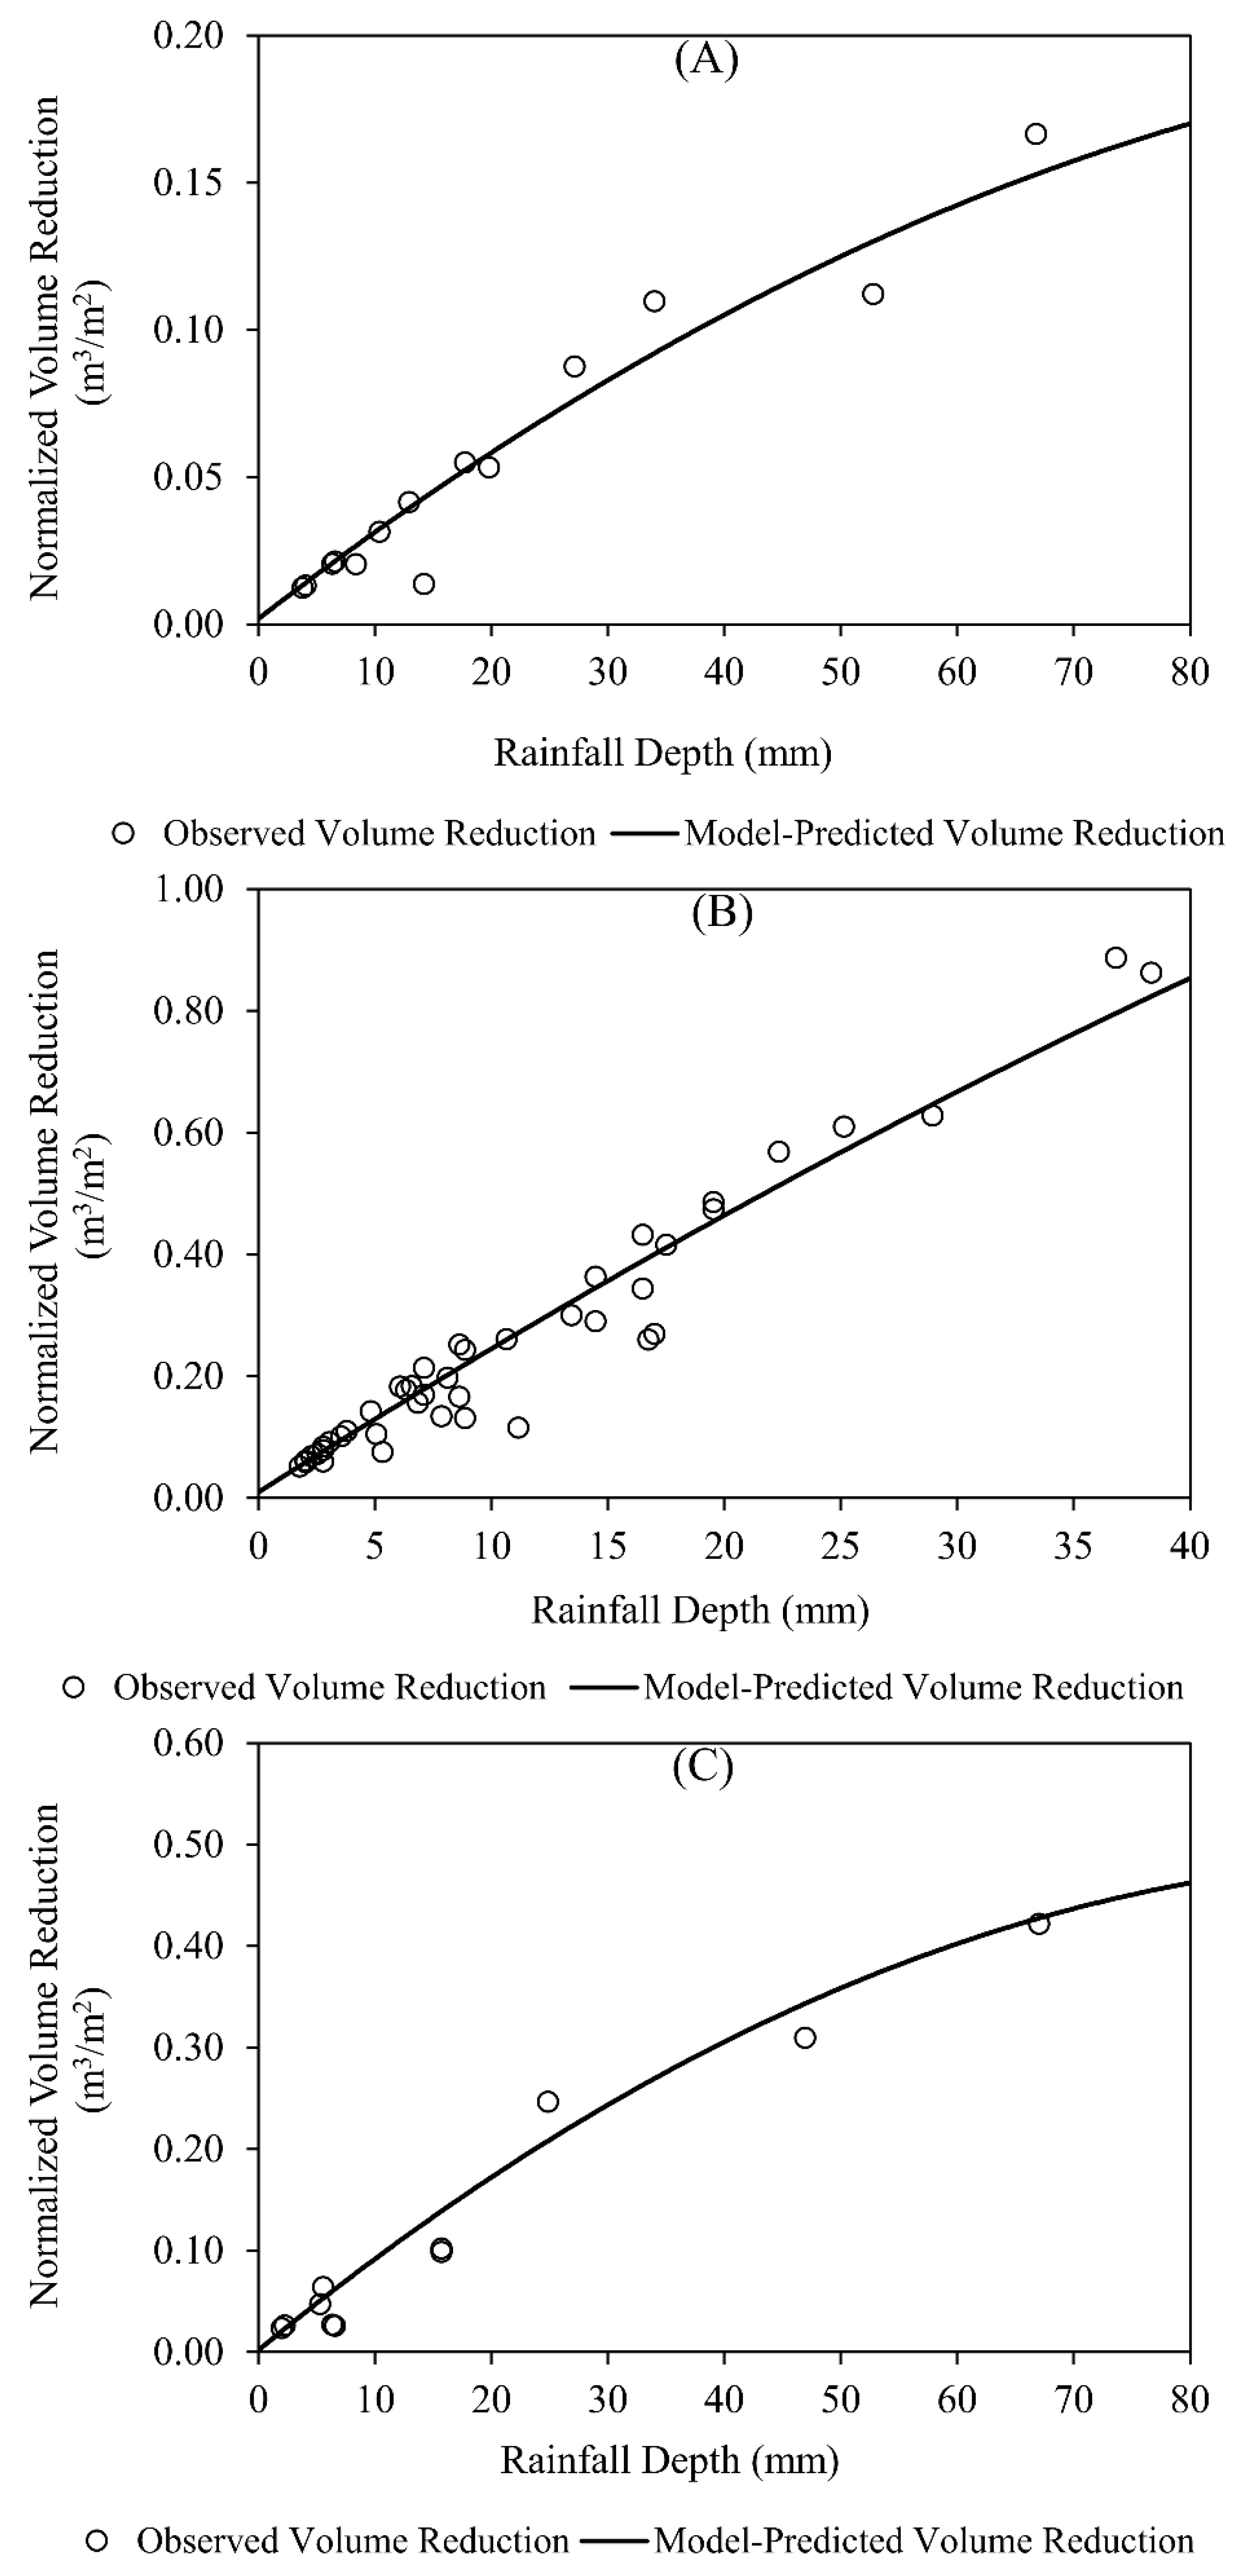
3.1. WinSLAMM-Calibrated BMP Model Development

Figure 3 shows the WinSLAMM calibration plots for three different types of BMPs: permeable pavements, bioretention, and bioswale. The plots show the runoff reduction behavior of these BMPs as a function of a range of rainfall magnitudes. The scattered markers represent the observed runoff reduction for a certain rainfall depth. However, only rainfall events greater than 1.0 mm were found to be sufficient to trigger a significant volume of runoff. For calibration purposes, the default runoff coefficient (Rv) values were adjusted to fit the model-simulated results to be closer to the observed results when needed. The model-simulated results were fitted with a second-order polynomial trendline since the observed reduction pattern was not found to be linear to rainfall depth. Previous studies observed that the outflow volume followed a curvilinear trend as rainfall magnitude increased. The goodness of fit and the statistical correlation between observed and simulated results were determined through the Kling-Gupta Efficiency (KGE), Root Mean Square Error (RMSE), and regression hypothesis test (p-value). Table 1 summarizes the monitoring period, the number of rainfall events, max rainfall depth, calibrated parameters, and performance indexes of the period for the three BMPs.
A total of 14 significant rainfall events were monitored from (September 2014 to November 2014) for the modeling of the porous concrete pavement (PCP), which is located at Monte Bella Park, Brownsville, TX (Figure 3A). The highest depth of rainfall was observed to be 67 mm within the dataset. The runoff reduction behavior seemed to follow an increasing trend against rainfall depths. Within this monitoring timeframe, the normalized volume reduction achieved was 0.054 ± 0.047 m3/m2. The model-simulated results showed a reasonable fit (KGE = 0.833, RMSE = 0.012 m3/m2, p < 0.05) with the observed data with default Rv values. Therefore, the PCP model did not undergo further calibration trials. For the modeling of bioretention, 43 rainfall events (March 2016 to March 2017) were monitored from the South Texas college parking lot (Figure 3B). The highest depth of rainfall was observed to be 38 mm inches within the dataset. Observed reductions followed a steadily increasing trend, which was a good indication of significant volume reduction performance (0.25 ± 0.21 m3/m2) from the bioretention. The model was fitted (KGE = 0.866, RMSE = 0.054 m3/m2, p < 0.05) to the observed results by decreasing the default Rv values by 66% for pervious surfaces. Eleven rainfall events (August 2014 through February 2015) were monitored for the modeling of bioswale installed in the Cascade Park parking lot (Figure 3C). The highest depth of rainfall was 67 mm within the observed dataset. The model-simulated results with default Rv values were a good fit (KGE = 0.893, RMSE = 0.033 m3/m2, p < 0.05) with the observed data. Thus, no further calibration was necessary for the bioswale model. Within the monitoring timeframe, the normalized reduction was observed at 0.13 ± 0.14 m3/m2. Overall, bioretention (BR) and bioswale (BS) showed somewhat better performance than porous concrete pavement (PCP), perhaps because of its improved infiltration rate through the vegetative cover. Our validation results (Tables S1–S3) showed that the WinSLAMM-calibrated PCP, BR, and BS models might over or under-predict within a 30% error range. Later, these calibrated models were used to calculate the controlled peak discharge for different sizes of commercial developments and BMP installations to create a BMP-specific database and equations for the integration into the DSS algorithm.

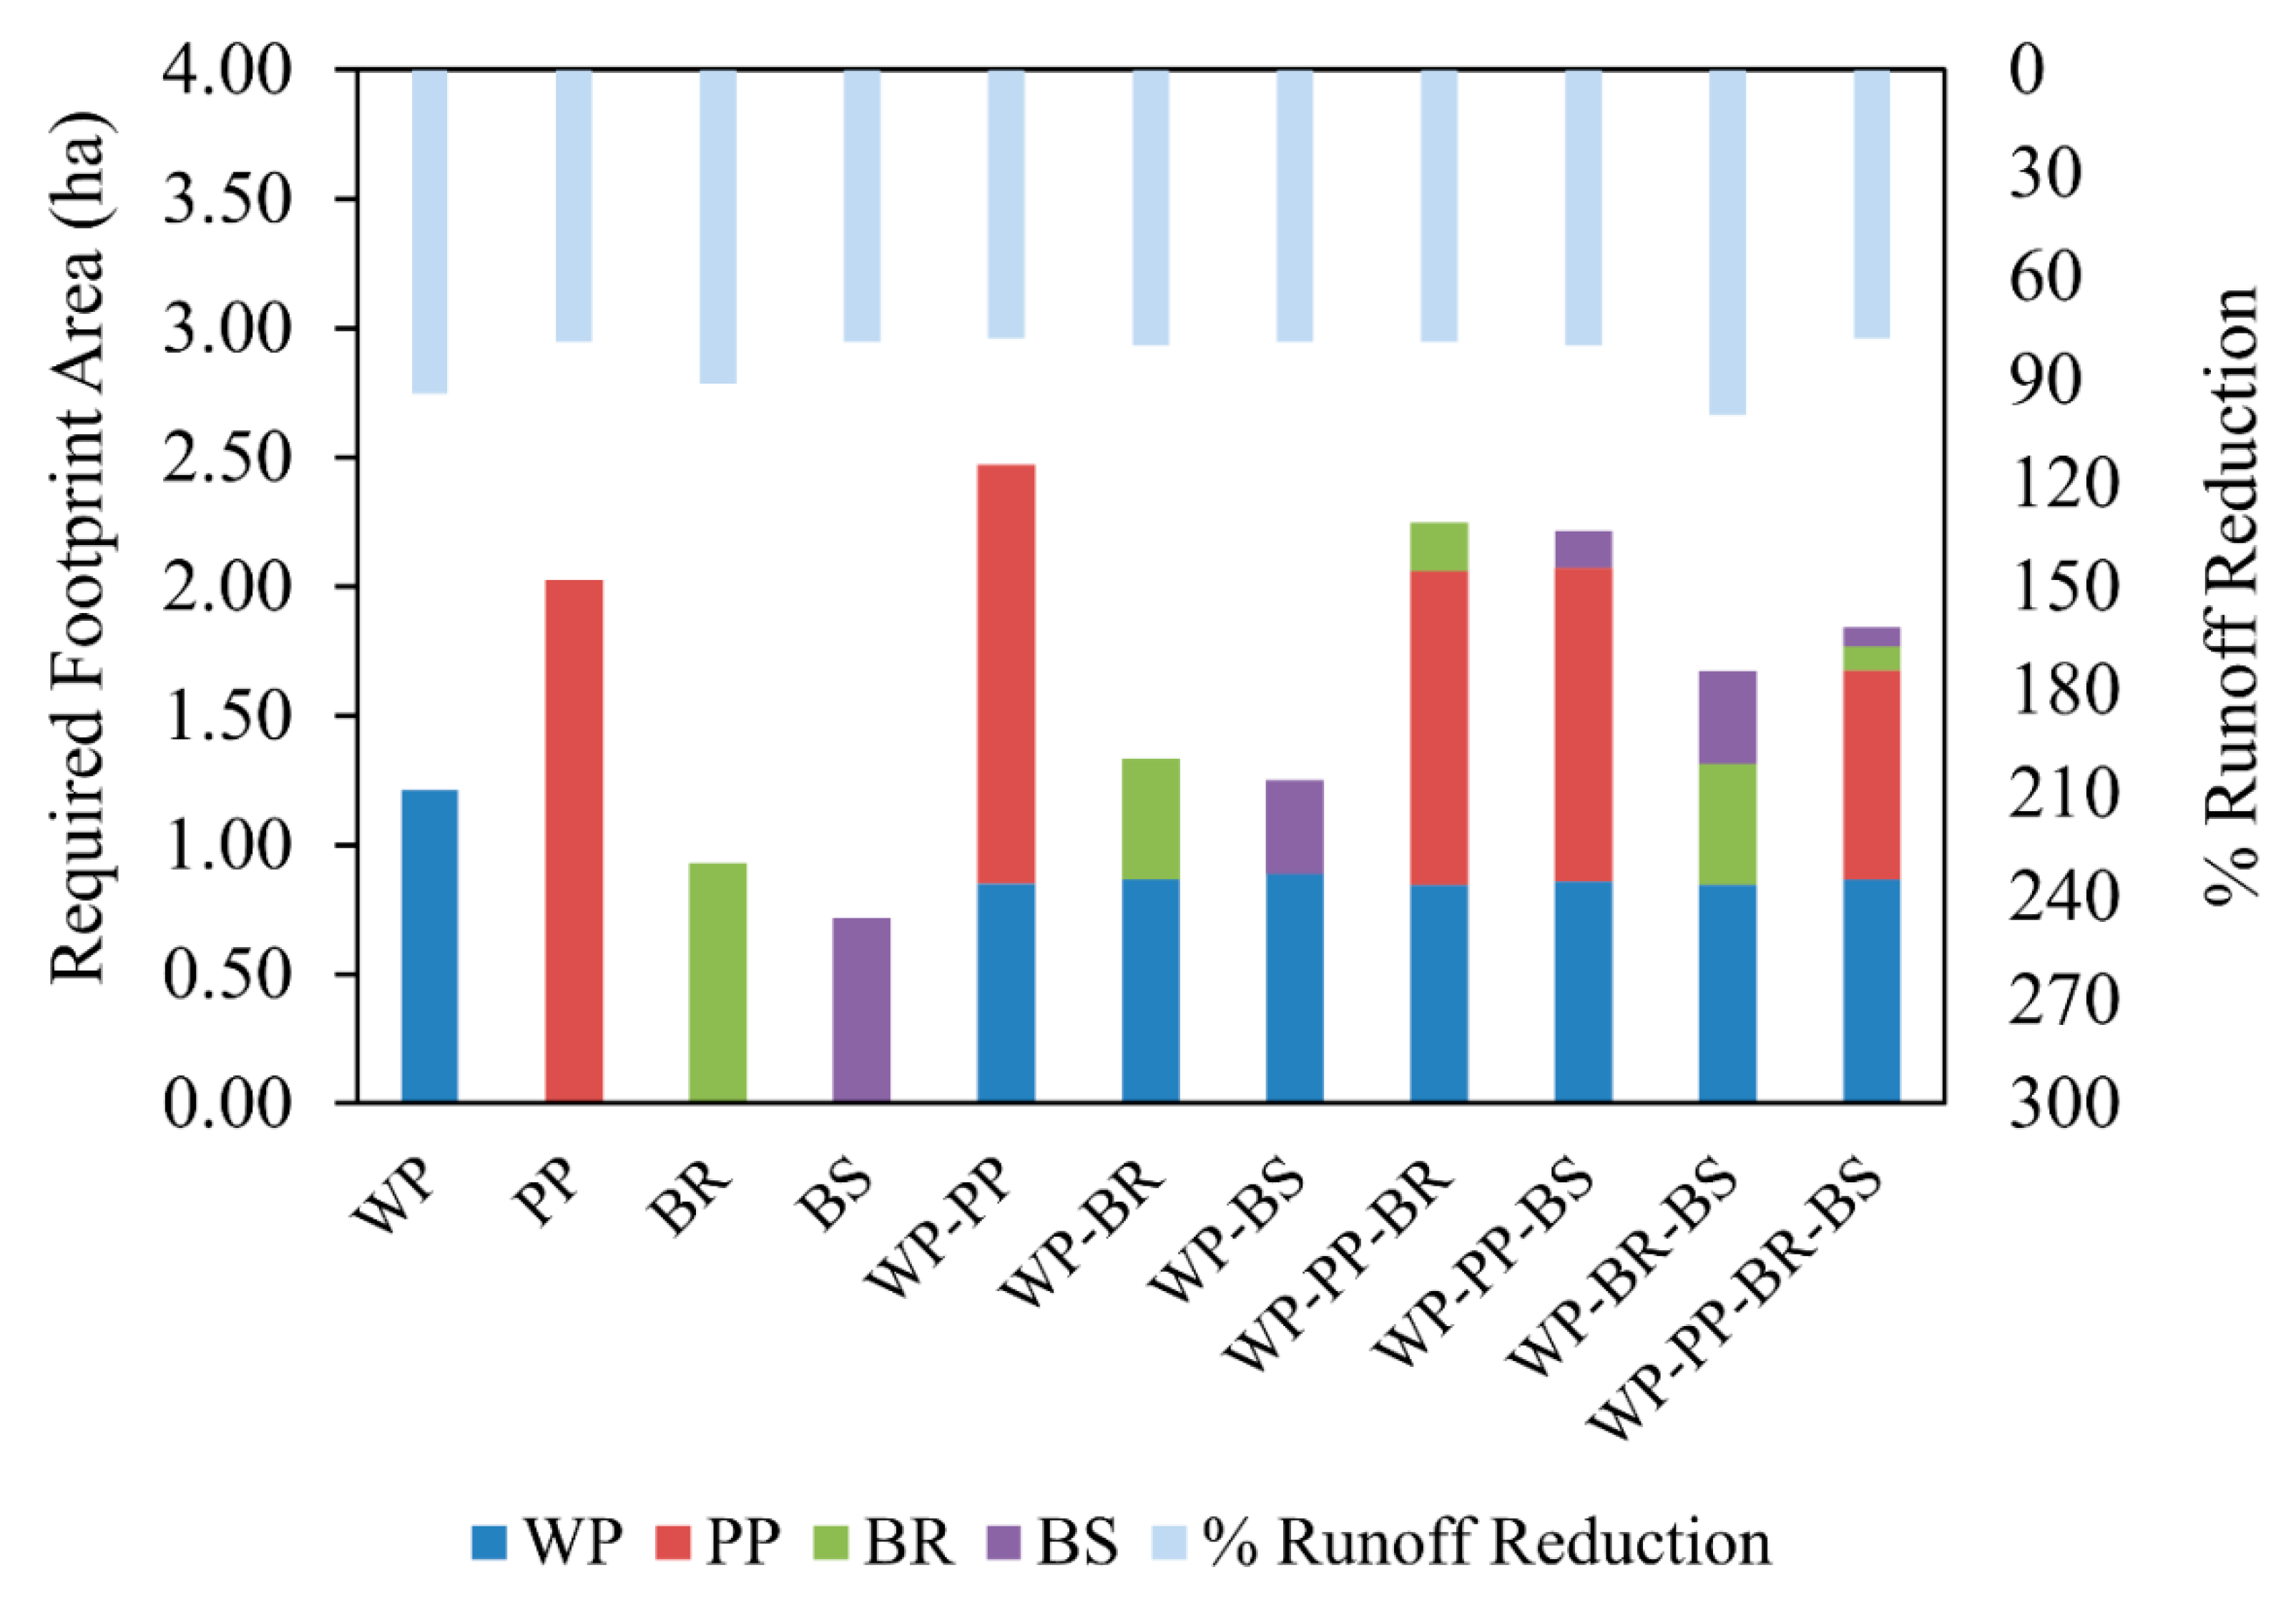
3.2. Application of DSS

The application of the DSS was evaluated to identify a suitable control practice(s) with a recommendation on the footprint area and number of units to meet the 10-year storm discharge at the outfall. According to the user-provided site and BMP information, our DSS predicted the size and units of the structure required to meet the 10-year discharge goal. During the DSS simulation, the algorithm utilized BMP-specific calibrated equations as the basis for the estimation of hydrologic outputs (peak discharge, runoff volume, percentage runoff reduction, and runoff coefficient). The area of the BMP footprint was determined after several iteration trials (convergence algorithm) until the calculated peak discharge met the targeted 10-year peak discharge. Apart from the footprint, the tool determined the total detention volume, geometric recommendations, and the number of BMP units required, none of which were the focus of our analysis. The tool also predicted the total lifecycle cost of LID implementation.
An illustration of the simulated results of the DSS was created to assess the effects of changing the development size, ranging between 0.1 and 6.0 ha, in Brownsville, TX, on the LID-controlled peak discharge from the site, as shown in Figure 4. In the preparation of the input data, the typical evaporation rate was considered to be 0.25 mm/h. A 5% impervious cover was assumed for the predevelopment condition of the site. The DSS was simulated to determine the footprint area for each control practice required to meet the 10-year storm discharge goal as a function of the size of the development (0.1–6 ha). The shaded area represents the recommended footprint of control practices estimated by the tool. The DSS also estimated the outfall peak discharge values for controlled conditions to check the technical feasibility of the selected BMP option, which is shown by the connected rectangular dots. The dashed dots represent the targeted discharge from the 10-year 24-h storm event. As per the rainfall-runoff algorithm written for the rational method, the DSS-simulated 10-year peak discharge followed a linear trend concerning the size of the development. The DSS reveals that the commercial development of 2 ha is expected to release a runoff at a predeveloped rate of fewer than 0.06 m3/s to meet the 10-year storm discharge. Since no parameters were altered, these results were the same for all control practice scenarios (WP, PP, BR, and BS). The ANOVA results suggest that there is a significant difference (p > 0.05) in the footprint recommendation for different BMP options for the same size of commercial development. The values from Pearson multiple correlation (R) analysis (Table S4) showed that the runoff reduction and runoff coefficient for each BMP have a strong inverse correlation (R = −0.99) with the peak discharge.
Figure 4A reveals the size of the wet detention pond (WP), which might be adequate in runoff management for a range of development sizes (0.1–6.0 ha). Results suggested that the 2 ha development size might require the building of a 0.8 ha wet pond that would induce the least peak discharge of 0.034 m3/s and a maximum runoff reduction of 94% from the site. The installation of 0.8 ha of WP might cover the development size ranging between 0.1 and 6.0 ha. The DSS suggests that 1.22 ha of WP alone can be promising in terms of successful mitigation of runoff (94%) from 4 ha of development. The DSS also did the consultation to make a recommendation on LID BMPs. Figure 4B suggests that it might take 1.25 ha of porous concrete pavement (PCP) installation from 2.0 ha of development. The cross-sectional profile of the modeled PCP consists of a clean, washed, and angular aggregate, typically #57 (as a base) and #2 (as sub-base). The interim layers of PCP form 35% of the void space between the aggregates, which may only be counted as detention. Therefore, the DSS estimated a higher footprint for PCP as compared to WP. The DSS results suggest that 1.25 ha of PCP installation should be enough to handle runoff from a maximum of 2.4 ha of development. After that, the PCP size might differ along with the size of the development. Installation of 4 ha of PCP might serve a development size as large as 6.1 ha. These results reveal the idea that PCP might be capable to detain 34–50% of runoff generated outside its footprint boundary. The DSS also estimated the footprint of bioretention control structures to be 0.45 ha for the same 2 hectares of development, as shown in Figure 4C. The more preferable size would be 0.92 ha, which might cover a development size as large as 5 ha with 90–95% runoff reduction. For the same development size, the DSS recommends a comparatively smaller bioswale (BS) footprint (0.35 ha) than bioretention, with a similar peak discharge (0.1 m3/s) since they are more linear systems with a greater length than width. Only 0.7 ha of BS installation might be adequate to withstand the runoff received from the maximum 4.5 ha of commercial development (84% bigger than the BS footprint itself). The results summary for individual BMP cases is given in Table 2.
The DSS module also provides the user with an option to choose BMPs in series. The simulation through the DSS recommends a footprint for all probable BMP configurations when they are installed in series. The comparison of different BMP combinations in terms of footprint requirements for 4 ha of development is shown in Figure 5. DSS inputs were fixed to a 4 ha commercial development in the city of Brownsville, TX. The figure distinguishes the distribution of footprint area between BMPs in the form of color-coded bar graphs. During the simulation, the 50-year uncontrolled peak discharge was used as an input to estimate the total inflow volume and runoff reduction (by subtracting the LID-controlled runoff volume). The figure also depicts the performance in terms of percentage runoff reduction after the implementation of the BMPs in the series.
When LIDs are installed in series with a wet detention pond, they may raise the total land use to be higher than that expected from a WP alone, as suggested by the DSS. The maximum 30% of the wet pond footprint can be replaced when combined with other BMPs in series. The DSS estimates a maximum BMP installation area of 2.5 ha when the exfiltration from the PCP is designed to be detained in the hydrologically connected downstream WP. It is important to note that the involvement of PCP in series can cover a major portion (>50%) of the total areas of BMP installation. The implementation of bioswale (0.72 ha, $1.25 M) or bioretention (0.92 ha, $3.5 M) alone can considerably reduce the construction cost (>75%) and promote the aesthetics of the site. A combined total of 0.47 ha of bioretention (incorporated as an island or median), 0.36 ha of bioswale (on the periphery of the site), and 0.85 ha of large wet detention pond (at the downstream) is the most promising configuration, with almost 100% runoff reduction from the site. Such a result indicates that the post-development condition that contributes to flooding can be reduced to zero under this configuration.

4. Discussion

Our LID decision-support algorithm predicted that a single wet detention pond (WP) of 1.22 ha might efficiently handle a 50-year frequency storm event from 4 ha of commercial development (peak inflow ~0.53 m3/s) in Brownsville, Texas, which can release the least peak outflow of 0.034 m3/s with a maximum flow reduction of 94%. Although WP can be promising in terms of runoff detention (94%), its implementation can sometimes produce both unpleasant and unwanted liabilities. The main concern for a developer is the high amount of land utilization and the maintenance and construction costs associated with WP [12,14]. Due to improper maintenance, the wetland can cause health and safety issues, declination of waterfowl population, clogging, mosquito breeding, etc. [56]. The DSS estimated the total cost (including construction, operation & maintenance (O&M), and others) of 1.22 ha of WP in a 4 ha development to be almost 16 million, considering $236 per cubic meter of construction cost.
The DSS results suggest that the wet pond requirements can easily be avoided by using porous concrete pavement (PCP), bioretention (BR), or bioswale (BS) alone. Although PCP might require more space, the highly durable concrete or asphalt surfaces pose great serviceability by providing additional benefits when utilized in parking lots and areas with light traffic (driveway, shoulder, etc.) [57]. Like other conventional pavements, it can also support high axle loads from fire trucks, garbage trucks, and emergency vehicles without any problem [58]. Our present study in the semi-arid climatic LRGV observed a comparatively higher normalized runoff volume reduction from PCP than in the eastern sub-tropical, humid part of the US (e.g., North Carolina), where the reduction was calculated to be as low as 0.008 ± 0.006 m3/m2 [59]. This comparison indicates that our established DSS algorithm might predict higher space requirements for the same BMPs in sub-tropical climates. Our DSS estimated the total cost of 2.03 ha of PCP in a 4 ha development to be almost 3.5 million, considering $638 per cubic meter of construction cost. The DSS predicted the most promising results from the BS in terms of land use utilization to meet 10-year frequency targeted discharge (0.12 m3/s), with the peak outflow rate of 0.113 m3/s and a smaller footprint (0.72 ha) than other types. The BS structure is often designed for better conveyance, collection, and infiltration of stormwater runoff [60]. The structure is highly vegetated with grass throughout its length and sloped sides to improve the surface runoff and infiltration, which was also encountered in our modeled bioswale. Before infiltration, the structure also causes the runoff water to pool on the surface temporarily [61,62]. On the other hand, BR alone might induce a similar outlet peak discharge (0.046 m3/s) and runoff volume reduction (90–95%) to a wet pond, with much less land utilization (0.93 ha) than porous concrete pavement and wet pond in a 4–5 ha commercial development in Brownsville, TX. Bioretention can be described as a porous landscape detention basin since it captures a huge volume of runoff through its highly porous media [63]. The top layer of our modeled BR cell was vegetated, deep-rooted native plants and local soil, which together build a strong foundation to enhance the on-site infiltration and evapotranspiration of the stormwater runoff, with less chance of potential clogging [64]. Our modeled BR structure also provides an essential ponding depth (up to 0.3 m), which might temporarily hold the runoff from the parking lots and roadway [65]. Hence, our field data also support the fact that the normalized volume reduction from the bioretention (0.25 ± 0.21 m3/m2) was higher than that of PCP (0.054 ± 0.047 m3/m2). The performance of our monitored bioretention in the semi-arid LRGV was even higher than that for the sub-tropical state of Virginia, US, where normalized volume reduction was calculated as 0.11 ± 0.23 m3/m2 [66]. A study in Italy showed that a single green roof with 100% green conversion could achieve a runoff volume reduction of up to 35% [67]. Our DSS predicted that WP, PP, BR, or BS alone might achieve more than 75% runoff reduction, with a green conversion of 31%, 51%, 23%, and 18%, respectively. These results indicate a greater hydrologic potential of these four BMPs than the green roof. Our DSS estimated $3.6 and 1.6 million as the total life cycle cost for BR and BS implementation, respectively, in a 4 ha commercial development in Brownsville, TX, considering $546 per cubic meter of construction cost. Considering the DSS-predicted hydrological benefits and cost, BR alone might be the optimal option for any commercial development in the LRGV region. However, Zhang and Hu [68] observed the most promising runoff volume reduction (up to 100%) from a rainwater harvesting cistern in China in the case of a critical rainfall storm (50 mm).
In terms of volume reduction, a combination of PCP, BR, BS, and WP in series might require the least construction cost of $7.5 million, with a runoff reduction of 78%. By incorporating this combination, the serviceability and property value of the site can be increased. The DSS also predicted a combination of BR (0.47 ha), BS (0.36 ha), and WP (0.84 ha) in series, which might be the most promising option to handle 50-year frequency storm event runoff reduction of up to 100% from a 4 ha commercial development with a total cost of $9 million approximately. Besides, this combination can improve land use management and foster healthy aesthetics on the site. Considering all hydrological benefits and costs, this configuration might be optimal for combined BMP cases for any commercial development in the LRGV region.
With more flexible drainage policy options, the recommended size of BMPs can be reduced. However, the adopted stringent drainage policy in the DSS algorithm provided an opportunity for more sustainable runoff management. Also, it is possible to improve DSS recommendations through the integration of innovative BMP design models with higher storage capacity into the DSS algorithm.
Overall, the results of the presented analysis may support planners, stakeholders, and stormwater task force partners for optimized planning, design, and implementation of LID facilities in any commercial development in the region. Considering DSS-predicted hydrologic results (peak flow, runoff volume reduction) and cost, the most promising BMP or BMPs in series can be suggested at the beginning of the land development process in the semi-arid climatic region of LRGV. These results can also help to evaluate any existing/conventional facilities (e.g., wet detention pond) or to seek LID alternatives to maximize ecosystem services with a minimized cost. Furthermore, the outcomes of the tool can be incorporated into the enhancement of property development options and values in the region. Sustainable urban stormwater management will eventually lead to surface water quality improvement in the Arroyo Colorado watershed.

5. Conclusions

The present study established a novel methodology of a decision-support system for the planning of LID footprint using calibrated BMP models with the estimation of hydrologic performances (peak flow, runoff volume reduction) in any commercial development in the Lower Rio Grande Valley of South Texas. The database and algorithm of the DSS were developed based on WinSLAMM simulations of three BMPs (permeable pavements, bioretention, and bioswale) of different installation sizes, within a range of sizes of commercial development. Later DSS results were evaluated with specific site information to identify the suitable control practice(s) along with the footprint recommendation to meet the 10-year storm discharge from the site. The following are highlights of some important findings gathered from the DSS recommendations in the present study:
  • A wet detention pond (WP) alone can be promising to provide hydrologic benefits, but it is not optimal. WP can achieve the least peak discharge (0.034 m3/s) and maximum runoff reduction (94%) from a 4 ha development. However, WP can cause safety, aesthetic, and water quality issues in the long run.
  • Bioswale (BS) showed the smallest footprint requirement among all BMPs analyzed. Only 0.7 ha of BS installation can be adequate to hold the runoff generated from a maximum of 4.5 ha of commercial development (84% bigger than the BS footprint itself). Therefore, the implementation of bioswale alone can considerably reduce the footprint and construction cost.
  • Bioretention (BR) can also be promising with a preferable footprint of 0.93 ha, which might cover a commercial development as large as 5 ha with a 90–95% runoff reduction.
  • Apart from providing good serviceability and enhancing property value, porous concrete pavement (PCP) might be capable of detaining 34–50% of runoff generated outside its footprint boundary. For example, 4 ha of PCP installation might serve a commercial development as large as 6.1 ha.
  • Considering all hydrological benefits and costs for a single BMP case, BR alone might be the optimal option from any commercial development in the LRGV region.
  • Considering all hydrological benefits, land use management, aesthetics, and costs, a combination of BR, BS, and WP may be the optimal option, with almost 100% runoff reduction from the site. However, when LIDs are coupled with a wet detention pond, it may require a larger footprint area than that expected from WP alone.
The DSS will benefit the public and the environment by providing innovative and critical information to the region to meet the challenging requirements of balancing floods, water quality demands, and public safety needs. Reducing localized flooding and identifying sustainable, economical, and innovative stormwater management strategies are key benefits projected to result from the development of the DSS. The successful implementation and adoption of the DSS in urban stormwater management should improve the stormwater runoff water quality within the LRGV.
Further studies for the improvement of the DSS may include a detailed cost-benefit analysis of BMPs, based on the analyzed costs in terms of construction and O&M costs of the BMPs, and benefits in terms of runoff reduction, property value increases, leasehold revenue, flood damage mitigation, and groundwater recharge. Future studies can be recommended to incorporate more BMP options (e.g., green roof, dry pond, subsurface wetland, rainwater harvesting cistern, etc.) into the DSS algorithm. Enhancement of the DMT tool can be suggested in terms of providing user-defined drainage policy constraints. Moreover, the current DSS convergence algorithm determines BMP(s) footprint by dealing with a 50-year frequency storm event (12.7 mm/h) at a post-development rate as input and with a 10-year frequency storm (7.62 mm/h) discharge at a predevelopment rate as an output. Further studies can be done to increase its robustness so that the users can select their design storm frequency from the drop-down menu of the tool. This finding might help to assess long-term runoff reductions by dealing with varying rainfall characteristics from multiple events. Since WinSLAMM approximates a composite peak flow from the first flush runoff generated with complex drainage surfaces (impervious, pervious, semi-pervious, etc.), our DSS might not reflect a continuous rainfall-runoff characteristic (with double or more peaks) to determine the optimal BMP alternative. For the development of BMP models, future works can be recommended to emphasize the calibration of the hydrograph based on the user-defined hyetograph to capture the characteristics of continuous rainfall. The findings of our developed DSS will only be applicable to the LRGV region since the algorithm allows hydrogeological input from 14 cities in the region. However, a similar methodology and convergence algorithm can be applied to other impaired watersheds in the US and the rest of the world only after a regional calibration and validation of BMP models.

Supplementary Materials

The following are available online at https://www.mdpi.com/2071-1050/12/8/3152/s1.

Author Contributions

Conceptualization, J.G., T.A., and K.D.J.; methodology, J.G. and T.A.; software, T.A.; formal analysis, T.A.; investigation, J.G., A.M., K.D.J., and A.E.; data curation, T.A. and A.M.; writing—original draft preparation, T.A., J.G., and A.M.; writing—review and editing, J.G., A.M., K.D.J., and A.E.; visualization, T.A.; supervision, K.D.J. and A.E. All authors have read and agreed to the published version of the manuscript.

Funding

This project was funded through grants from the North American Development Bank and Border Environment Cooperation Commission along with the U.S. Environmental Protection Agency through the US—Mexico Border 2020 Program (TAA16-013).

Acknowledgments

The authors would like to thank Jorge Hernández, Project Manager, North American Development Bank, BECC. The authors would also like to thank Brandon Dalton from C.C. Lynch & Associates Inc. for his guidance in the troubleshooting of LID research equipment.

Conflicts of Interest

The authors declare no conflicts of interest.

References

  1. Franczyk, J.; Chang, H. The effects of climate change and urbanization on the runoff of the Rock Creek basin in the Portland metropolitan area, Oregon, USA. Hydrol. Process. 2009, 23, 805–815. [Google Scholar] [CrossRef]
  2. Rose, S.; Peters, N.E. Effects of urbanization on streamflow in the Atlanta area (Georgia, USA): A comparative hydrological approach. Hydrol. Process. 2001, 15, 1441–1457. [Google Scholar] [CrossRef]
  3. Hung, C.-L.J.; James, L.A.; Carbone, G.J. Impacts of urbanization on stormflow magnitudes in small catchments in the Sandhills of South Carolina, USA. Anthropocene 2018, 23, 17–28. [Google Scholar] [CrossRef]
  4. Alam, T.; Mahmoud, A.; Jones, D.K.; Bezares-Cruz, C.J.; Guerrero, J. WinSLAMM Simulation of Hydrologic Performance of Permeable Pavements—A Case Study in the Semi-Arid Lower Rio Grande Valley of South Texas, United States. Water 2019, 11, 1865. [Google Scholar] [CrossRef] [Green Version]
  5. Martin-Mikle, C.J.; de Beurs, K.M.; Julian, J.P.; Mayer, P.M. Identifying priority sites for low impact development (LID) in a mixed-use watershed. Landsc. Urban Plan. 2015, 140, 29–41. [Google Scholar] [CrossRef] [Green Version]
  6. Kaushal, S.S.; Belt, K.T. The urban watershed continuum: Evolving spatial and temporal dimensions. Urban Ecosyst. 2012, 15, 409–435. [Google Scholar] [CrossRef]
  7. Alam, T.; Mahmoud, A.; Jones, D.K.; Bezares-Cruz, C.J.; Guerrero, J. A Comparison of Three Types of Permeable Pavements for Urban Runoff Mitigation in the Semi-Arid South Texas, USA. Water 2019, 11, 1992. [Google Scholar] [CrossRef] [Green Version]
  8. Taebi, A.; Droste, R.L. First flush pollution load of urban stormwater runoff. J. Environ. Eng. Sci. 2004, 3, 301–309. [Google Scholar] [CrossRef]
  9. Guerrero, J.; Mahmoud, A.; Alam, T.; Chowdhury, A.M.; Adetayo, A.; Ernest, A.; Jones, D.K. Water Quality Improvement and Pollutant Removal by Two Regional Detention Facilities with Constructed Wetlands in South Texas. Sustainability 2020, 12, 2844. [Google Scholar] [CrossRef] [Green Version]
  10. National Research Council. Urban Stormwater Management in the United States; The National Academies Press: Washington, DC, USA, 2009; pp. 18–196. [Google Scholar]
  11. USEPA. Handbook for Developing Watershed Plans to Restore and Protect Our Waters; Office of Water, Nonpoint Source Control Branch: Washington, DC, USA, 2008; p. 400.
  12. Houle, J.J.; Roseen, R.M.; Ballestero, T.P.; Puls, T.A.; Sherrard, J. Comparison of Maintenance Cost, Labor Demands, and System Performance for LID and Conventional Stormwater Management. J. Environ. Eng. 2013, 139, 932–938. [Google Scholar] [CrossRef]
  13. Flores, J.; Benavides, J.A.; Cawthon, T. Update to the Arroyo Colorado Watershed Protection Plan; Texas Water Resources Institute Technical Report—504; Texas Water Resources Institute: College Station, TX, USA, 2017; pp. 3–152.
  14. USEPA. Stormater Technology Fact Sheet-Wet Detention Ponds; Office of Water, U.S. Environmental Protection Agency: Washington, DC, USA, 2018; p. 7. Available online: https://nepis.epa.gov/Exe/ZyPDF.cgi/200044D0.PDF?Dockey=200044D0.PDF (accessed on 18 September 2018).
  15. Kramer, M.G. Enhancing Sustainable Communities with Green Infrastructure; Office of Sustainable Communities, US Environmental Protection Agency: Washington, DC, USA, 2014; p. 61.
  16. Bhatt, A.; Bradford, A.; Abbassi, B.E. Cradle-to-grave life cycle assessment (LCA) of low-impact-development (LID) technologies in southern Ontario. J. Environ. Manag. 2019, 231, 98–109. [Google Scholar] [CrossRef] [PubMed]
  17. Youngblood, S.; Vogel, J.; Brown, G.; Storm, D.; McLemore, A.; Kandel, S. Field Studies of Microbial Removal from Stormwater by Bioretention Cells with Fly-Ash Amendment. Water 2017, 9, 526. [Google Scholar] [CrossRef] [Green Version]
  18. Simić, I.; Stupar, A.; Djokić, V. Building the Green Infrastructure of Belgrade: The Importance of Community Greening. Sustainability 2017, 9, 1183. [Google Scholar] [CrossRef] [Green Version]
  19. Honeck, E.; Moilanen, A.; Guinaudeau, B.; Wyler, N.; Schlaepfer, M.A.; Martin, P.; Sanguet, A.; Urbina, L.; von Arx, B.; Massy, J.; et al. Implementing Green Infrastructure for the Spatial Planning of Peri-Urban Areas in Geneva, Switzerland. Sustainability 2020, 12, 1387. [Google Scholar] [CrossRef] [Green Version]
  20. Wright, T.J.; Liu, Y.; Carroll, N.J.; Ahiablame, L.M.; Engel, B.A. Retrofitting LID Practices into Existing Neighborhoods: Is It Worth It? Environ. Manag. 2016, 57, 856–867. [Google Scholar] [CrossRef] [Green Version]
  21. Earles, A.; Rapp, D.; Clary, J.; Lopitz, J. Breaking Down the Barriers to Low Impact Development in Colorado. In Proceedings of the World Environmental and Water Resources Congress 2009, Kansas City, MI, USA, 17–21 May 2009; pp. 1–10. [Google Scholar]
  22. Eckart, K.; McPhee, Z.; Bolisetti, T. Performance and implementation of low impact development—A review. Sci. Total Environ. 2017, 607–608, 413–432. [Google Scholar] [CrossRef]
  23. Kazak, J.K.; Chruściński, J.; Szewrański, S. The Development of a Novel Decision Support System for the Location of Green Infrastructure for Stormwater Management. Sustainability 2018, 10, 4388. [Google Scholar] [CrossRef] [Green Version]
  24. Cano, O.; Barkdoll, B. Multiobjective, Socioeconomic, Boundary-Emanating, Nearest Distance Algorithm for Stormwater Low-Impact BMP Selection and Placement. J. Water Resour. Plan. Manag. 2016, 143, 05016013. [Google Scholar] [CrossRef]
  25. Cheng, M.-S.; Zhen, J.X.; Shoemaker, L. BMP decision support system for evaluating stormwater management alternatives. Front. Environ. Sci. Eng. China 2009, 3, 453. [Google Scholar] [CrossRef]
  26. Ahmad, S.; Simonovic, S.P. An Intelligent Decision Support System for Management of Floods. Water Resour. Manag. 2006, 20, 391–410. [Google Scholar] [CrossRef]
  27. Duan, H.-F.; Li, F.; Yan, H. Multi-Objective Optimal Design of Detention Tanks in the Urban Stormwater Drainage System: LID Implementation and Analysis. Water Resour. Manag. 2016, 30, 4635–4648. [Google Scholar] [CrossRef]
  28. Ercolani, G.; Chiaradia, E.A.; Gandolfi, C.; Castelli, F.; Masseroni, D. Evaluating performances of green roofs for stormwater runoff mitigation in a high flood risk urban catchment. J. Hydrol. 2018, 566, 830–845. [Google Scholar] [CrossRef]
  29. Meerow, S.; Newell, J.P. Spatial planning for multifunctional green infrastructure: Growing resilience in Detroit. Landsc. Urban Plan. 2017, 159, 62–75. [Google Scholar] [CrossRef]
  30. Charoenkit, S.; Piyathamrongchai, K. A review of urban green spaces multifunctionality assessment: A way forward for a standardized assessment and comparability. Ecol. Indic. 2019, 107, 105592. [Google Scholar] [CrossRef]
  31. Labib, S.M. Investigation of the likelihood of green infrastructure (GI) enhancement along linear waterways or on derelict sites (DS) using machine learning. Environ. Model. Softw. 2019, 118, 146–165. [Google Scholar] [CrossRef] [Green Version]
  32. Epps, T.H.; Hathaway, J.M. Using spatially-identified effective impervious area to target green infrastructure retrofits: A modeling study in Knoxville, TN. J. Hydrol. 2019, 575, 442–453. [Google Scholar] [CrossRef]
  33. Mahmoud, A.; Alam, T.; Yeasir A. Rahman, M.; Sanchez, A.; Guerrero, J.; Jones, K.D. Evaluation of field-scale stormwater bioretention structure flow and pollutant load reductions in a semi-arid coastal climate. Ecol. Eng. X 2019, 1, 100007. [Google Scholar] [CrossRef]
  34. Sepulveda, P.; Hinojosa, E. Cameron Country Storm Water Management Plan (CCSWMP). Developed with the Requirements of the Texas Pollutant Discharge Elimination Systems. General Permit No. TXR04000; TEDSI Infrastructure Group, Inc.: Brownsville, TX, USA, 2008; p. 8. [Google Scholar]
  35. Wilker, J.; Rusche, K. Economic valuation as a tool to support decision-making in strategic green infrastructure planning. Local Environ. 2014, 19, 702–713. [Google Scholar] [CrossRef]
  36. Son, H.C.; Hyun, H.K.; Kim, D.; Baek, I.J.; Ban, U.Y. Development and Application of a Low Impact Development (LID)-Based District Unit Planning Model. Sustainability 2017, 9, 145. [Google Scholar] [CrossRef] [Green Version]
  37. Liu, Y.; Cibin, R.; Bralts, V.F.; Chaubey, I.; Bowling, L.C.; Engel, B.A. Optimal selection and placement of BMPs and LID practices with a rainfall-runoff model. Environ. Model. Softw. 2016, 80, 281–296. [Google Scholar] [CrossRef] [Green Version]
  38. Velásquez, R.A. Application of WinSLAMM to Evaluate the Effect of Green Infrastructure Implementation in Northern Utah. Ph.D. Thesis, Utah State University, Logan, UT, USA, 2018. [Google Scholar]
  39. Shilling, F.; Sommarstrom, S.; Kattelmann, R.; Washburn, B.; Florsheim, J.; Henly, R. The California Watershed Assessment Guide; Department of Environmental Science and Policy, University of California-Davis: Davis, CA, USA, 2005; p. 34. [Google Scholar]
  40. PV & Associates WinSLAMM (Version 10.0). Available online: http://www.winslamm.com/docs/01%20WinSLAMM%20v%2010.0%20User’s%20Guide%20-%20Introduction.pdf (accessed on 30 September 2018).
  41. Hurley, S.E.; Forman, R.T.T. Stormwater ponds and biofilters for large urban sites: Modeled arrangements that achieve the phosphorus reduction target for Boston’s Charles River, USA. Ecol. Eng. 2011, 37, 850–863. [Google Scholar] [CrossRef]
  42. Mahmoud, A.; Alam, T.; Sanchez, A.; Guerrero, J.; Oraby, T.; Ibrahim, E.; Jones, K.D. Stormwater Runoff Quality and Quantity from Permeable and Traditional Pavements in Semiarid South Texas. J. Environ. Eng. 2020, 146, 05020001. [Google Scholar] [CrossRef]
  43. Pitt, R.; Voorhees, J. WinSLAMM and low impact development. In Proceedings of the Putting the LID on Stormwater Management LID Conference, College Park, MD, USA, 21–23 September 2004; Civil Engineering, University of Alabama: College Park, MD, USA, 2004; p. 13. [Google Scholar]
  44. Pitt, R. Module 4: Stormwater Controls and WinSLAMM. Available online: http://unix.eng.ua.edu/~rpitt/Class/International%20urban%20water%20systems/WinSLAMM%20and%20stormwater%20controls%20Feb%2018%202006.htm (accessed on 19 September 2018).
  45. Jayasooriya, V.M.; Ng, A.W.M. Tools for Modeling of Stormwater Management and Economics of Green Infrastructure Practices: A Review. Water Air Soil Pollut. 2014, 225, 2055. [Google Scholar] [CrossRef] [Green Version]
  46. Hernandez, E.A.; Uddameri, V. An assessment of optimal waste load allocation and assimilation characteristics in the Arroyo Colorado River watershed, TX along the US–Mexico border. Clean Technol. Environ. Policy 2013, 15, 617–631. [Google Scholar] [CrossRef]
  47. Raines, T.H.; Miranda, R.M. Simulation of Flow and Water Quality of the Arroyo Colorado, Texas; USGS: Ausin, TX, USA, 2002.
  48. Jones, D.K.; Sanchez, A.; Mahmoud, A.; Alam, T.; Fasae, O. Lower Rio Grande Valley Low Impact Development Implementation and Education Final Report; Institute for Sustainable Energy and the Environment, Environmental Engineering Department, Texas A&M University-Kingsville: Kingsville, TX, USA, 2017. [Google Scholar]
  49. Gupta, H.V.; Kling, H.; Yilmaz, K.K.; Martinez, G.F. Decomposition of the mean squared error and NSE performance criteria: Implications for improving hydrological modelling. J. Hydrol. 2009, 377, 80–91. [Google Scholar] [CrossRef] [Green Version]
  50. Mourad, M.; Bertrand-Krajewski, J.-L.; Chebbo, G. Calibration and validation of multiple regression models for stormwater quality prediction: Data partitioning, effect of dataset size and characteristics. Water Sci. Technol. 2005, 52, 45–52. [Google Scholar] [CrossRef]
  51. Dotto, C.B.S.; Mannina, G.; Kleidorfer, M.; Vezzaro, L.; Henrichs, M.; McCarthy, D.T.; Freni, G.; Rauch, W.; Deletic, A. Comparison of different uncertainty techniques in urban stormwater quantity and quality modelling. Water Res. 2012, 46, 2545–2558. [Google Scholar] [CrossRef]
  52. Haddad, K.; Egodawatta, P.; Rahman, A.; Goonetilleke, A. Uncertainty analysis of pollutant build-up modelling based on a Bayesian weighted least squares approach. Sci. Total Environ. 2013, 449, 410–417. [Google Scholar] [CrossRef] [Green Version]
  53. Dotto, C.B.S.; Kleidorfer, M.; Deletic, A.; Rauch, W.; McCarthy, D.T. Impacts of measured data uncertainty on urban stormwater models. J. Hydrol. 2014, 508, 28–42. [Google Scholar] [CrossRef]
  54. Pazwash, H. Urban Storm Water Managemen, 1st ed.; CRC Press: Boca Raton, FL, USA, 2011; ISBN 1-4398-1035-4. [Google Scholar]
  55. Blick, S.A.; Kelly, F.; Skupien, J.J. New Jersey Stormwater Best Management Practices Manual; Technical Document; New Jersey Department of Environmental Protection Division of Watershed Management: Trenton, NJ, USA, 2004; p. 363.
  56. USEPA. Stormwater Wet Pond and Wetland Management Guidebook; United States Environmental Protection Agency: Washington, DC, USA, 2009; p. 57.
  57. USEPA Storm Water Technology Fact Sheet: Porous Pavement. 1999. Available online: https://nepis.epa.gov/Exe/ZyPDF.cgi/91018M1N.PDF?Dockey=91018M1N.PDF (accessed on 27 November 2019).
  58. Tennis, P.D.; Leming, M.L.; Akers, D.J. Pervious Concrete Pavements; Portland Cement Association, Skokie, Illinois, and National Ready Mixed Concrete Association: Silver Spring, ML, USA, 2004; ISBN 0-89312-242-4. [Google Scholar]
  59. Collins, K.A.; Hunt, W.F.; Hathaway, J.M. Hydrologic Comparison of Four Types of Permeable Pavement and Standard Asphalt in Eastern North Carolina. J. Hydrol. Eng. 2008, 13, 1146–1157. [Google Scholar] [CrossRef]
  60. Purvis, A.R.; Winston, J.R.; Hunt, F.W.; Lipscomb, B.; Narayanaswamy, K.; McDaniel, A.; Lauffer, S.M.; Libes, S. Evaluating the Hydrologic Benefits of a Bioswale in Brunswick County, North Carolina (NC), USA. Water 2019, 11, 1291. [Google Scholar] [CrossRef] [Green Version]
  61. Xiao, Q.; McPherson, E.G. Performance of engineered soil and trees in a parking lot bioswale. Urban Water J. 2011, 8, 241–253. [Google Scholar] [CrossRef]
  62. Purvis, A.R.; Winston, J.R.; Hunt, F.W.; Lipscomb, B.; Narayanaswamy, K.; McDaniel, A.; Lauffer, S.M.; Libes, S. Evaluating the Water Quality Benefits of a Bioswale in Brunswick County, North Carolina (NC), USA. Water 2018, 10, 134. [Google Scholar] [CrossRef] [Green Version]
  63. Kocman, S.M.; Guo, J.C.Y.; Ramaswami, A. Waste-Incorporated Subbase for Porous Landscape Detention Basin Design. J. Environ. Eng. 2011, 137, 928–936. [Google Scholar] [CrossRef]
  64. Houdeshel, C.D.; Pomeroy, C.A.; Hultine, K.R. Bioretention Design for Xeric Climates Based on Ecological Principles1. JAWRA J. Am. Water Resour. Assoc. 2012, 48, 1178–1190. [Google Scholar] [CrossRef]
  65. Davis, A.P.; Hunt, W.F.; Traver, R.G.; Clar, M. Bioretention Technology: Overview of Current Practice and Future Needs. J. Environ. Eng. 2009, 135, 109–117. [Google Scholar] [CrossRef]
  66. DeBusk, K.M.; Wynn, T.M. Storm-Water Bioretention for Runoff Quality and Quantity Mitigation. J. Environ. Eng. 2011, 137, 800–808. [Google Scholar] [CrossRef]
  67. Masseroni, D.; Cislaghi, A. Green roof benefits for reducing flood risk at the catchment scale. Environ. Earth Sci. 2016, 75, 579. [Google Scholar] [CrossRef]
  68. Zhang, X.; Hu, M. Effectiveness of Rainwater Harvesting in Runoff Volume Reduction in a Planned Industrial Park, China. Water Resour. Manag. 2014, 28, 671–682. [Google Scholar] [CrossRef]
Figure 1. Map of the Arroyo Colorado Watershed and site locations of monitored porous concrete pavement, bioretention, and bioswale within the Lower Rio Grande Valley in Texas [13].
Sustainability 12 03152 g001
Figure 2. The framework of the decision-support system (DSS) demonstrating input parameters, methodology, and outcomes of the tool (note: all parallelogram-shaped boxes represent input/output parameters, and all square-shaped boxes represent a process).
Sustainability 12 03152 g002
Figure 3. Calibration plots for WinSLAMM Best Management Practice (BMP) models: (A) porous concrete pavement (PCP), (B) biodetention (BR), and (C) bioswale (BS).
Sustainability 12 03152 g003
Figure 4. Graphical representation of DSS-simulated results to assess the effect of the size of commercial development on the recommendation of LID footprints and controlled peak discharge: (A) wet detention pond (WP), (B) porous concrete pavement (PCP), (C) bioretention, and (D) bioswale.
Sustainability 12 03152 g004
Figure 5. The comparison of different BMP configurations in terms of footprint requirements in 4 ha of development.
Sustainability 12 03152 g005
Table 1. Summary of the monitoring period, the number of rainfall events, max rainfall depth, calibrated parameters, and performance indexes of the period for the three BMPs.
BMPMonitoring PeriodNo. of Rainfall EventsMax. Rainfall Depth (mm)Normalized Volume Reduction (m3/m2)Calibration Parameters
KGERMSE (m3/m2)p-Value
PCP09/2014–11/201414670.054 ± 0.0470.8330.012< 0.05
BR03/2016–03/201743380.250 ± 0.2100.8660.054< 0.05
BS08/2014–02/201511670.130 ± 0.1400.8930.033< 0.05
Table 2. DSS-simulated results summary for different types of control practices and sizes of commercial developments.
BMPsDevelopment (ha)Footprint Required (ha)Peak Discharge (m3/s)Total Runoff (m3)% Runoff ReductionRunoff Coefficient
WP0.50.320.00001000.00
10.320.0231998780.22
20.810.0171452940.06
41.220.0342941940.06
61.620.0978392880.12
PP0.50.410.0121028780.22
10.810.0221857800.20
21.220.0383247860.14
42.030.1129719790.21
64.050.0655604920.08
BR0.50.190.009797830.17
10.470.00001000.00
20.470.0504337810.19
40.930.0463966910.09
61.860.0403426950.05
BS0.50.070.011980790.21
10.140.0231966790.21
20.360.0574935790.21
40.720.1139783790.21
61.440.13912,040830.17

