Sustainable Scheduling of Material Handling Activities in Labor-Intensive Warehouses: A Decision and Control Model

 ,
, 
 ,
,  and
and 
Abstract
1. Introduction
- Electric consumption due to direct movements of products or materials both by fixed material handling equipment (FMHE) (such as conveyor systems and automated cranes) and mobile material handling equipment (MMHE) (such as forklift, trucks, etc.);
- electric consumption due to warehouse facilities like heating, lighting, and air conditioning of the building as well as power supplies of computer systems, office equipment, and miscellaneous equipment such as catering appliances.
- Increasing adoption of automated warehouses equipped with electric shuttles, stacker cranes, robots, etc.;
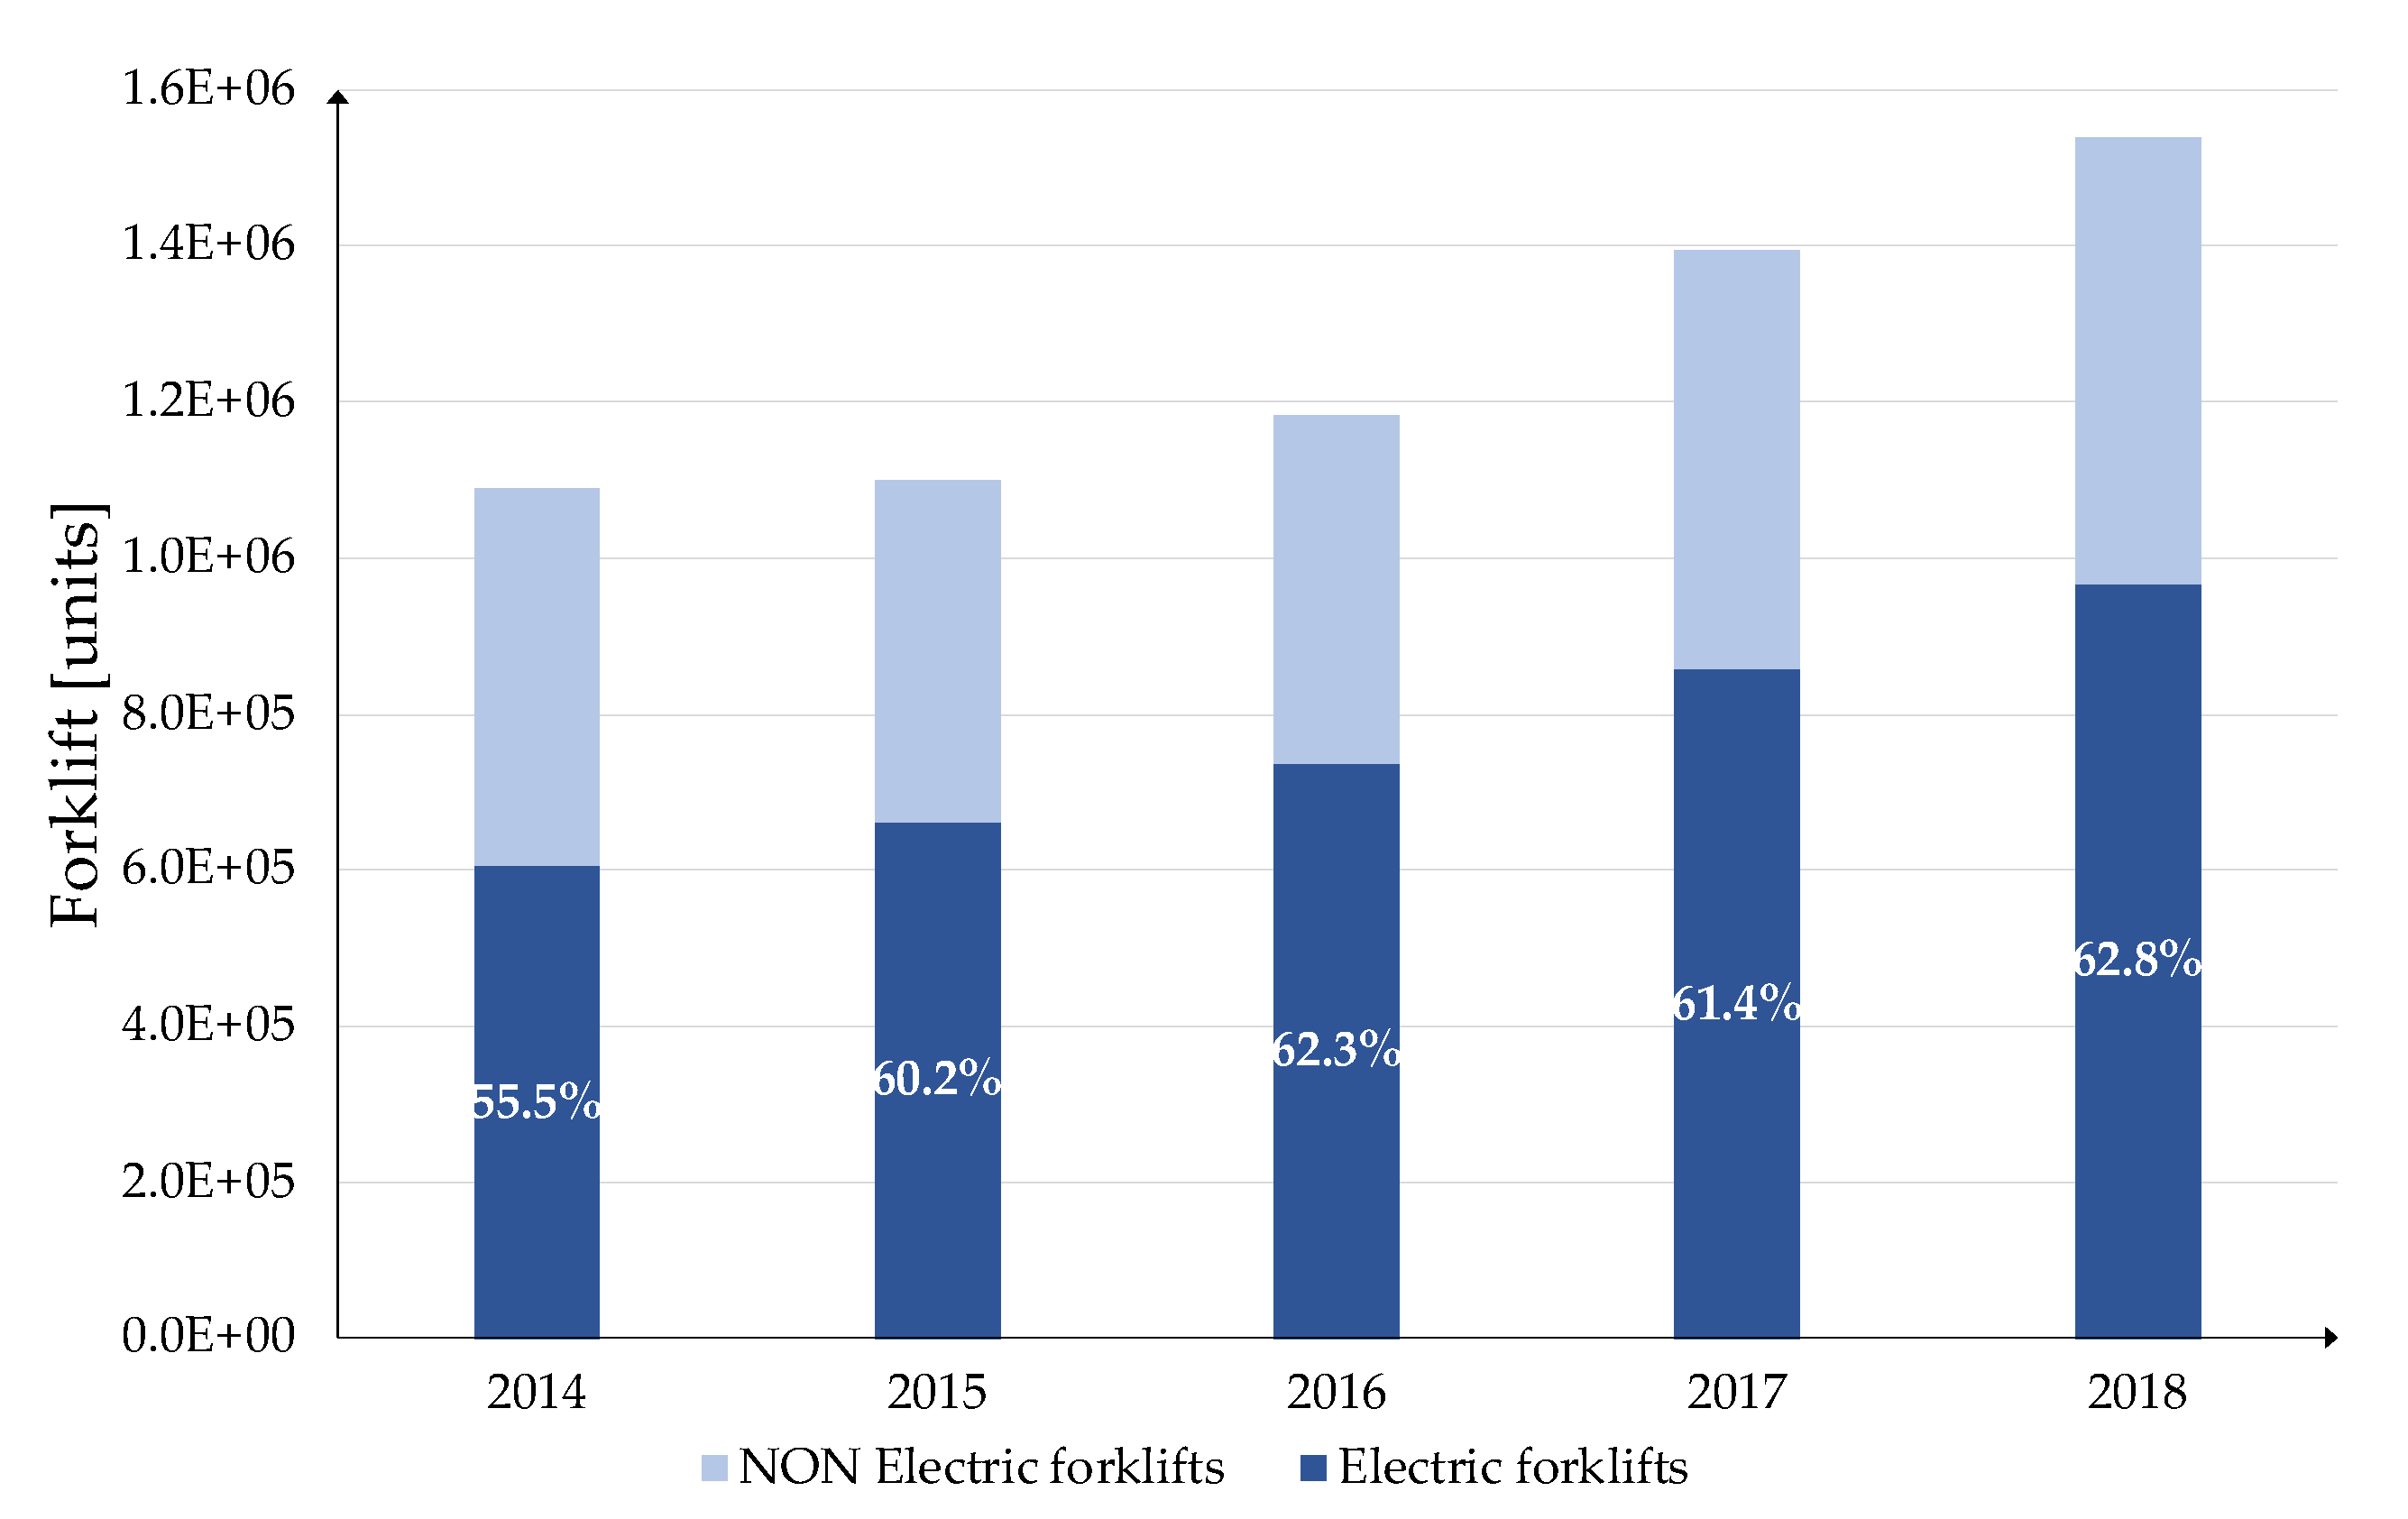
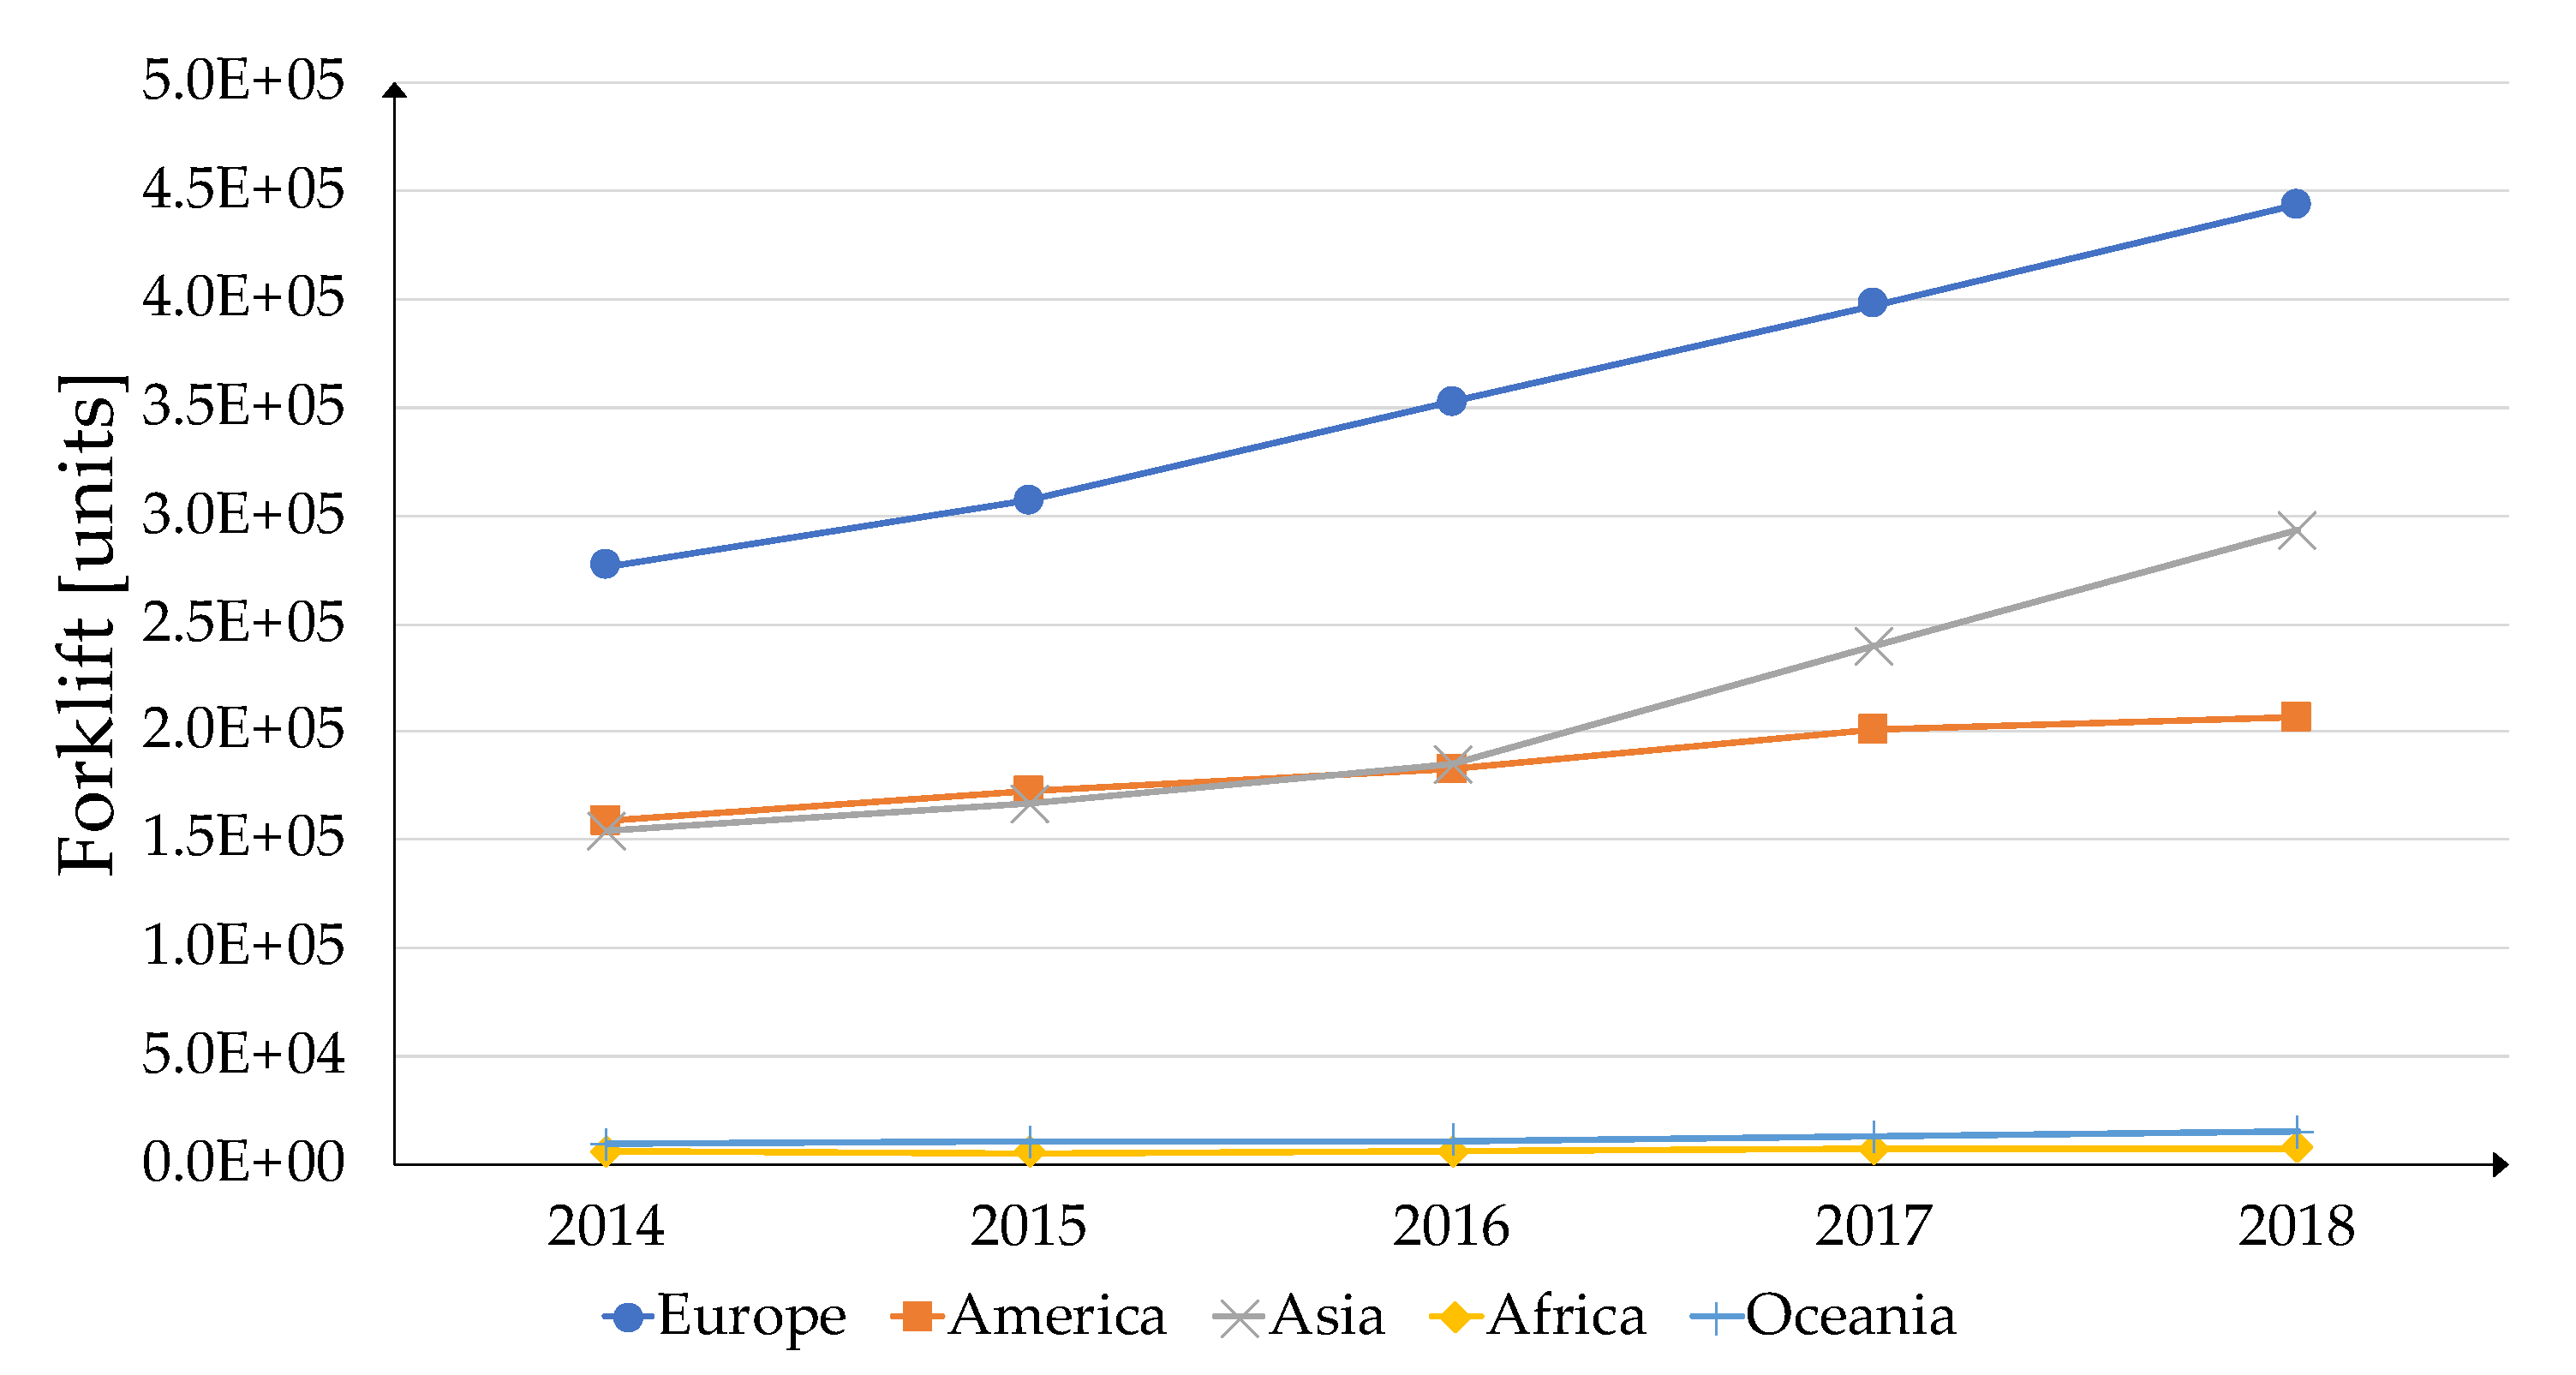
- increasing number of electric forklifts replacing forklifts powered by internal combustion engines thanks to their lower operational and maintenance costs. According to the World Industrial Truck Statistics, the percentage of electric forklifts in the world is over 60% of overall forklifts, and it is very interesting that this trend has grown more than 5% in only five years, from 2014 to 2018 (Figure 3). In the same period, the yearly sales of electric forklifts in Europe have grown by around 40%, and the same trend was observed in other continents (Figure 4).
- Is it possible to adopt DSM to reduce the economic and environmental impacts of electric MMHE recharging?
- Is there an optimal scheduling strategy allowing the minimization of the cost due to electric MMHE recharging while facing sustainability requirements?
2. Literature Review
3. System Modeling and Problem Formulation
3.1. Problem Statement
3.2. Assumptions
- Each job is composed by an uninterruptible and ordered sequence of picking operations.
- Jobs are executed in accordance with a priority queuing. This is one of the dispatching rules that is commonly used in in the material handling scheduling [44].
- Each forklift can process only one job at a time. The related processing time is known and independent from forklift and job execution order. This is a classical assumption made in the material handling scheduling [44].
- The processing time of each job is less than the fully charged battery capacity. This assumption can be removed by allowing the replacement of batteries within the execution of activities that require a long time.
- Battery usage on each forklift is zero during idling times. This assumption is motivated by the fact the battery leakage constant time is much larger than idling times between consecutive activities [45].
- All jobs are completed within the considered planning horizon. This assumption is straightforwardly verified by suitably setting the value of the planning horizon.
- There are no overlapping constraints between forklifts performing different jobs. This assumption is obviously derived by the independence of activities.
- Change of battery is done in a neglectable time on any forklift. This assumption can be removed by introducing the battery replacement as an activity with non-zero duration.
- Battery charging is an interruptible load and is performed with a fixed energy rate, i.e., we assume a linear recharge of vehicle batteries as in [13].
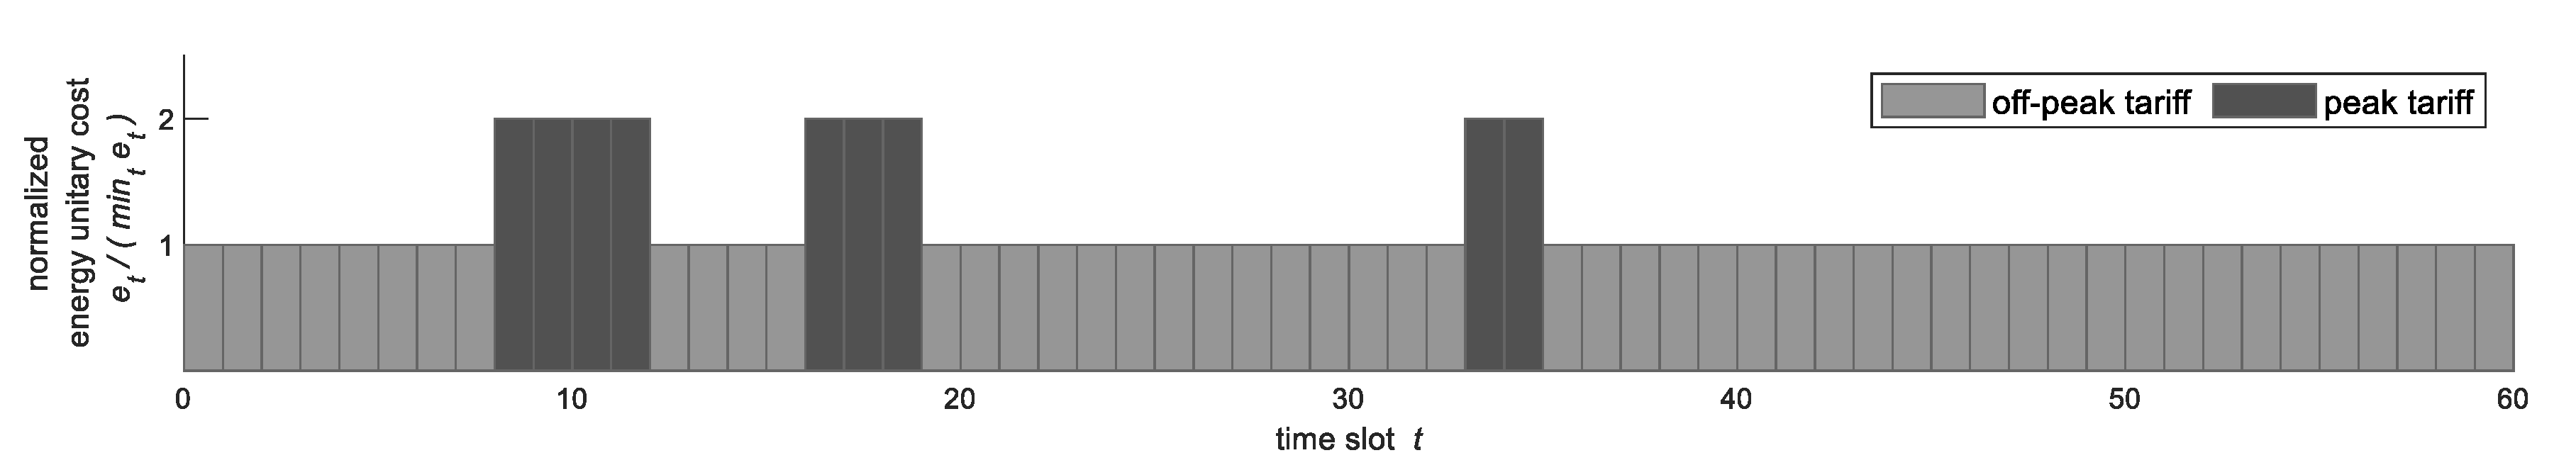
- The pricing of energy bought from the power grid is variable during the planning window but known ahead of time. This is a classical assumption in the field of DSM [14].
3.3. Indices and Sets
| set of levels of battery capacity | |
| index of places in job sequences () | |
| set of places in the job sequence addressed by forklifts | |
| identifier of jobs () | |
| set of jobs | |
| m | identifier of forklifts () |
| set of forklifts | |
| identifier of battery charging stations () | |
| set of charging stations | |
| index of time slots () | |
| planning horizon . |
3.4. Parameters
| 1 if charging station is available at time ; 0 otherwise | |
| minimum battery capacity | |
| fully charged battery capacity | |
| capacity of the battery in forklift at the beginning of the planning horizon | |
| capacity of the battery on forklift at the end of final setup | |
| setup completion time of forklift | |
| energy unitary cost at time slot | |
| number of jobs | |
| processing duration of job | |
| a large number | |
| number of electric forklift | |
| number of charging stations | |
| processing priority of job | |
| penalty unitary cost related to the job makespan | |
| penalty unitary cost related to the job ordering | |
| penalty unitary cost related to the battery recharging completion time | |
| number of time slots | |
| amount of energy required to charge one battery in one time slot | |
| weighting factor of the makespan penalty term in the objective function of the first-step optimization | |
| weighting factor of the job ordering penalty term in the objective function of the first-step optimization | |
| weighting factor of the makespan penalty term in the objective function of the second-step optimization | |
| weighting factor of the recharging completion time penalty term in the objective function of the second-step optimization | |
| weighting factor of the energy cost term in the objective function of the second-step optimization. |
3.5. Decision Variables
| capacity of battery on forklift at the beginning of activity taking into account the potential battery replacement | |
| maximum completion time over all the jobs (makespan) | |
| maximum completion time over all the jobs and forklifts (makespan), assuming that battery capacity is infinite | |
| completion time of job on forklift | |
| maximum completion time of forklift , assuming that battery capacity is infinite | |
| idling time before processing job on forklift | |
| energy cost for the overall charging of forklift batteries over the planning horizon | |
| energy for charging batteries of forklifts at time slot | |
| number of jobs allocated to forklift | |
| identifier of the -th activity—including jobs (), forklift initial setup (), and final setup ()—related to the -th forklift | |
| penalty cost related to makespan | |
| penalty cost related to job ordering | |
| penalty cost related to overall completion times of battery recharging processes | |
| completion time of recharging process related to the battery replaced at the beginning of activity on forklift | |
| overall completion time of recharging processes related to charging station | |
| starting time of activity on forklift | |
| 1 if job is the -th activity executed by forklift ; 0 otherwise | |
| 1 if forklift replaces its battery with a fully-charged one at the beginning of activity at charging station ; 0 otherwise | |
| capacity of battery on forklift at the beginning of activity | |
| 1 if is the completion time of the recharging window for the battery replaced at the beginning of activity on forklift ; 0 otherwise | |
| 1 if is within the recharging window for the battery replaced at the beginning of activity on forklift ; 0 otherwise | |
| 1 if the battery replaced at the beginning of activity is actually recharged in time slot on forklift ; 0 otherwise | |
| 1 if is the starting time of the recharging window for the battery replaced at the beginning of activity on forklift ; 0 otherwise. |
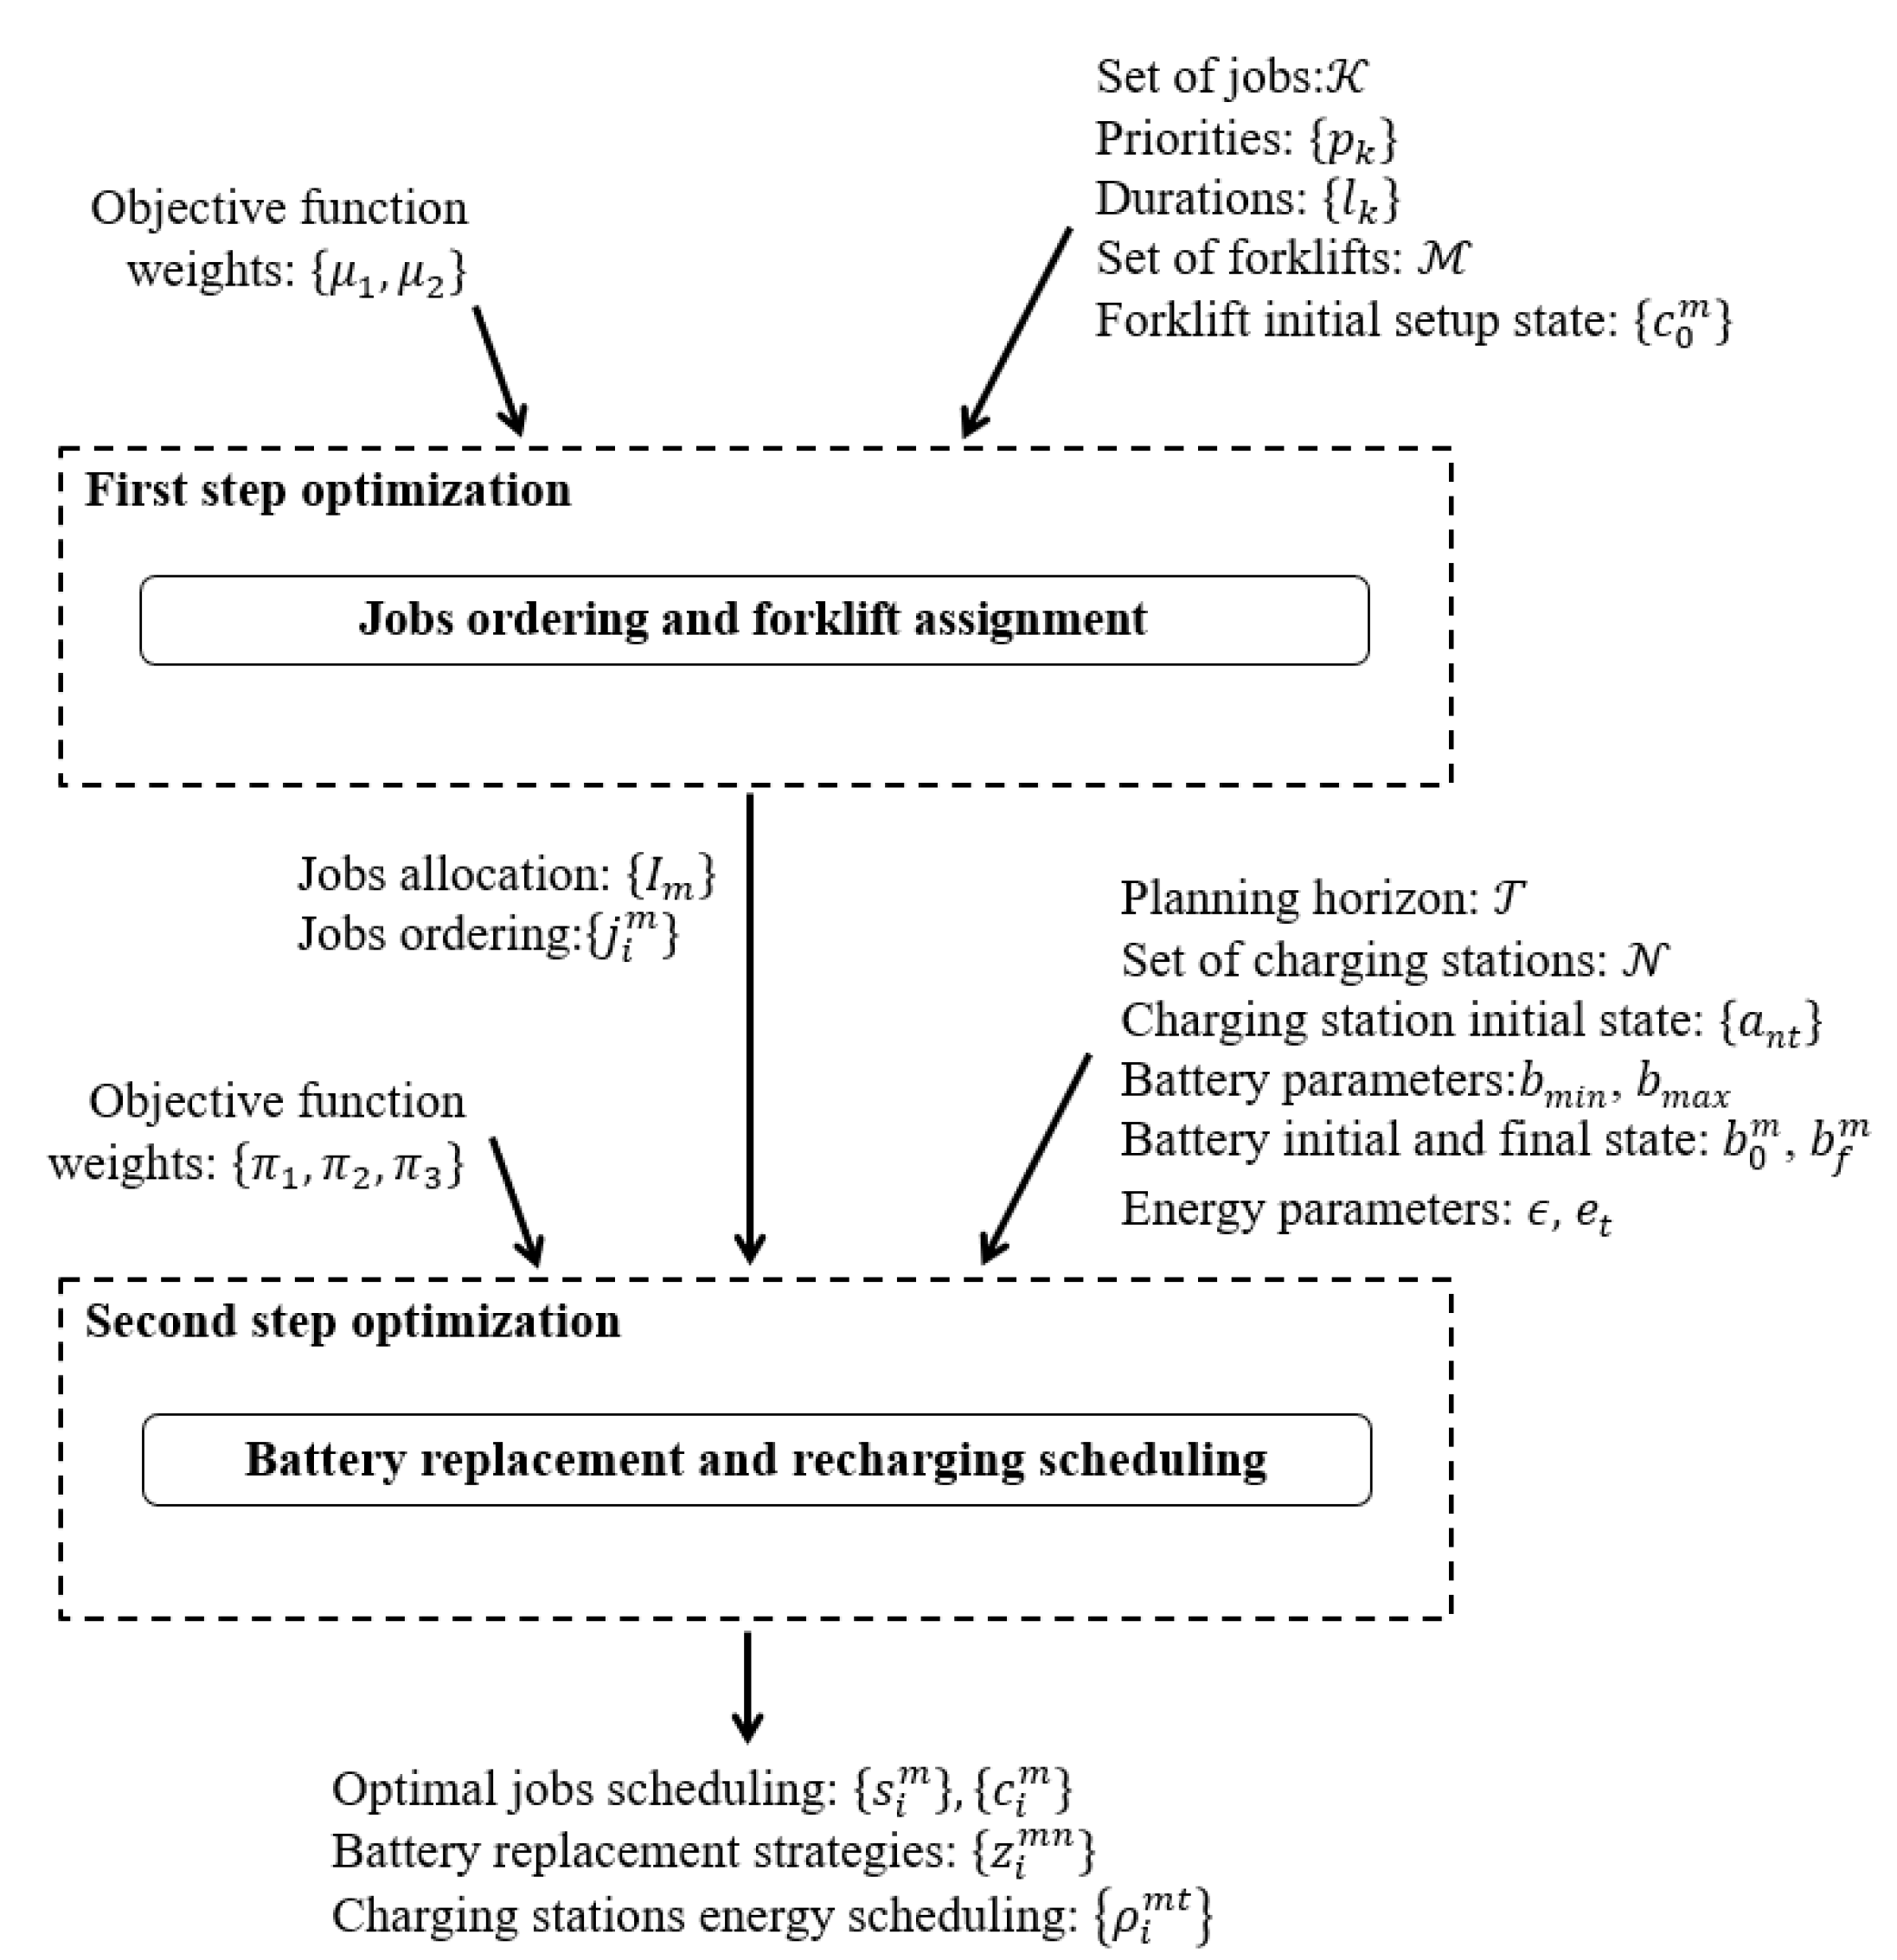
3.6. Optimization Model
3.6.1. First-Step Optimization
3.6.2. Second-Step Optimization
4. Numerical Experiments
4.1. Setup of Experiments
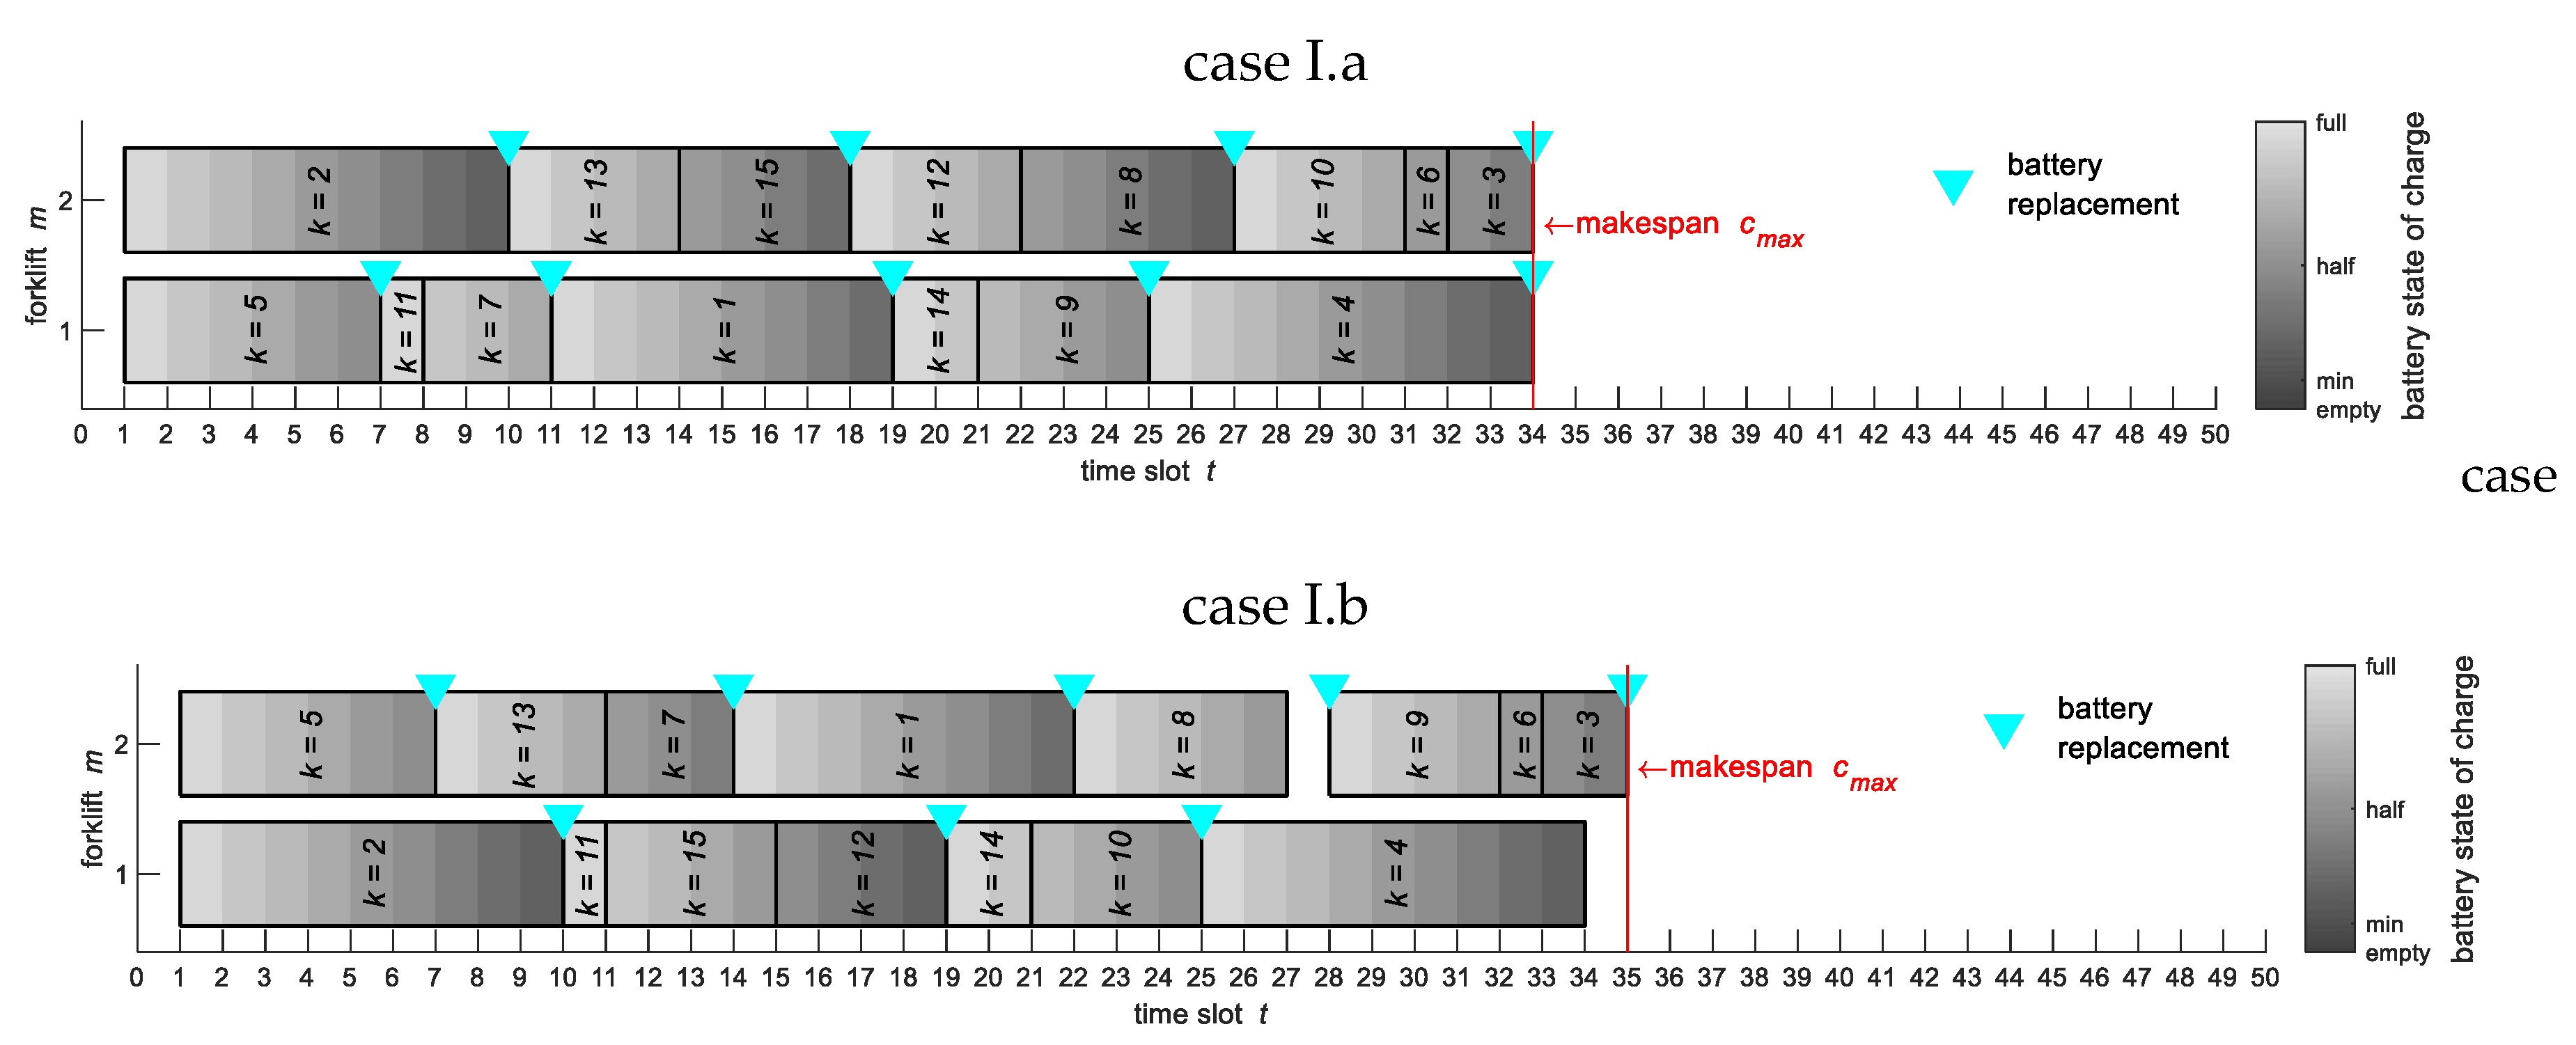
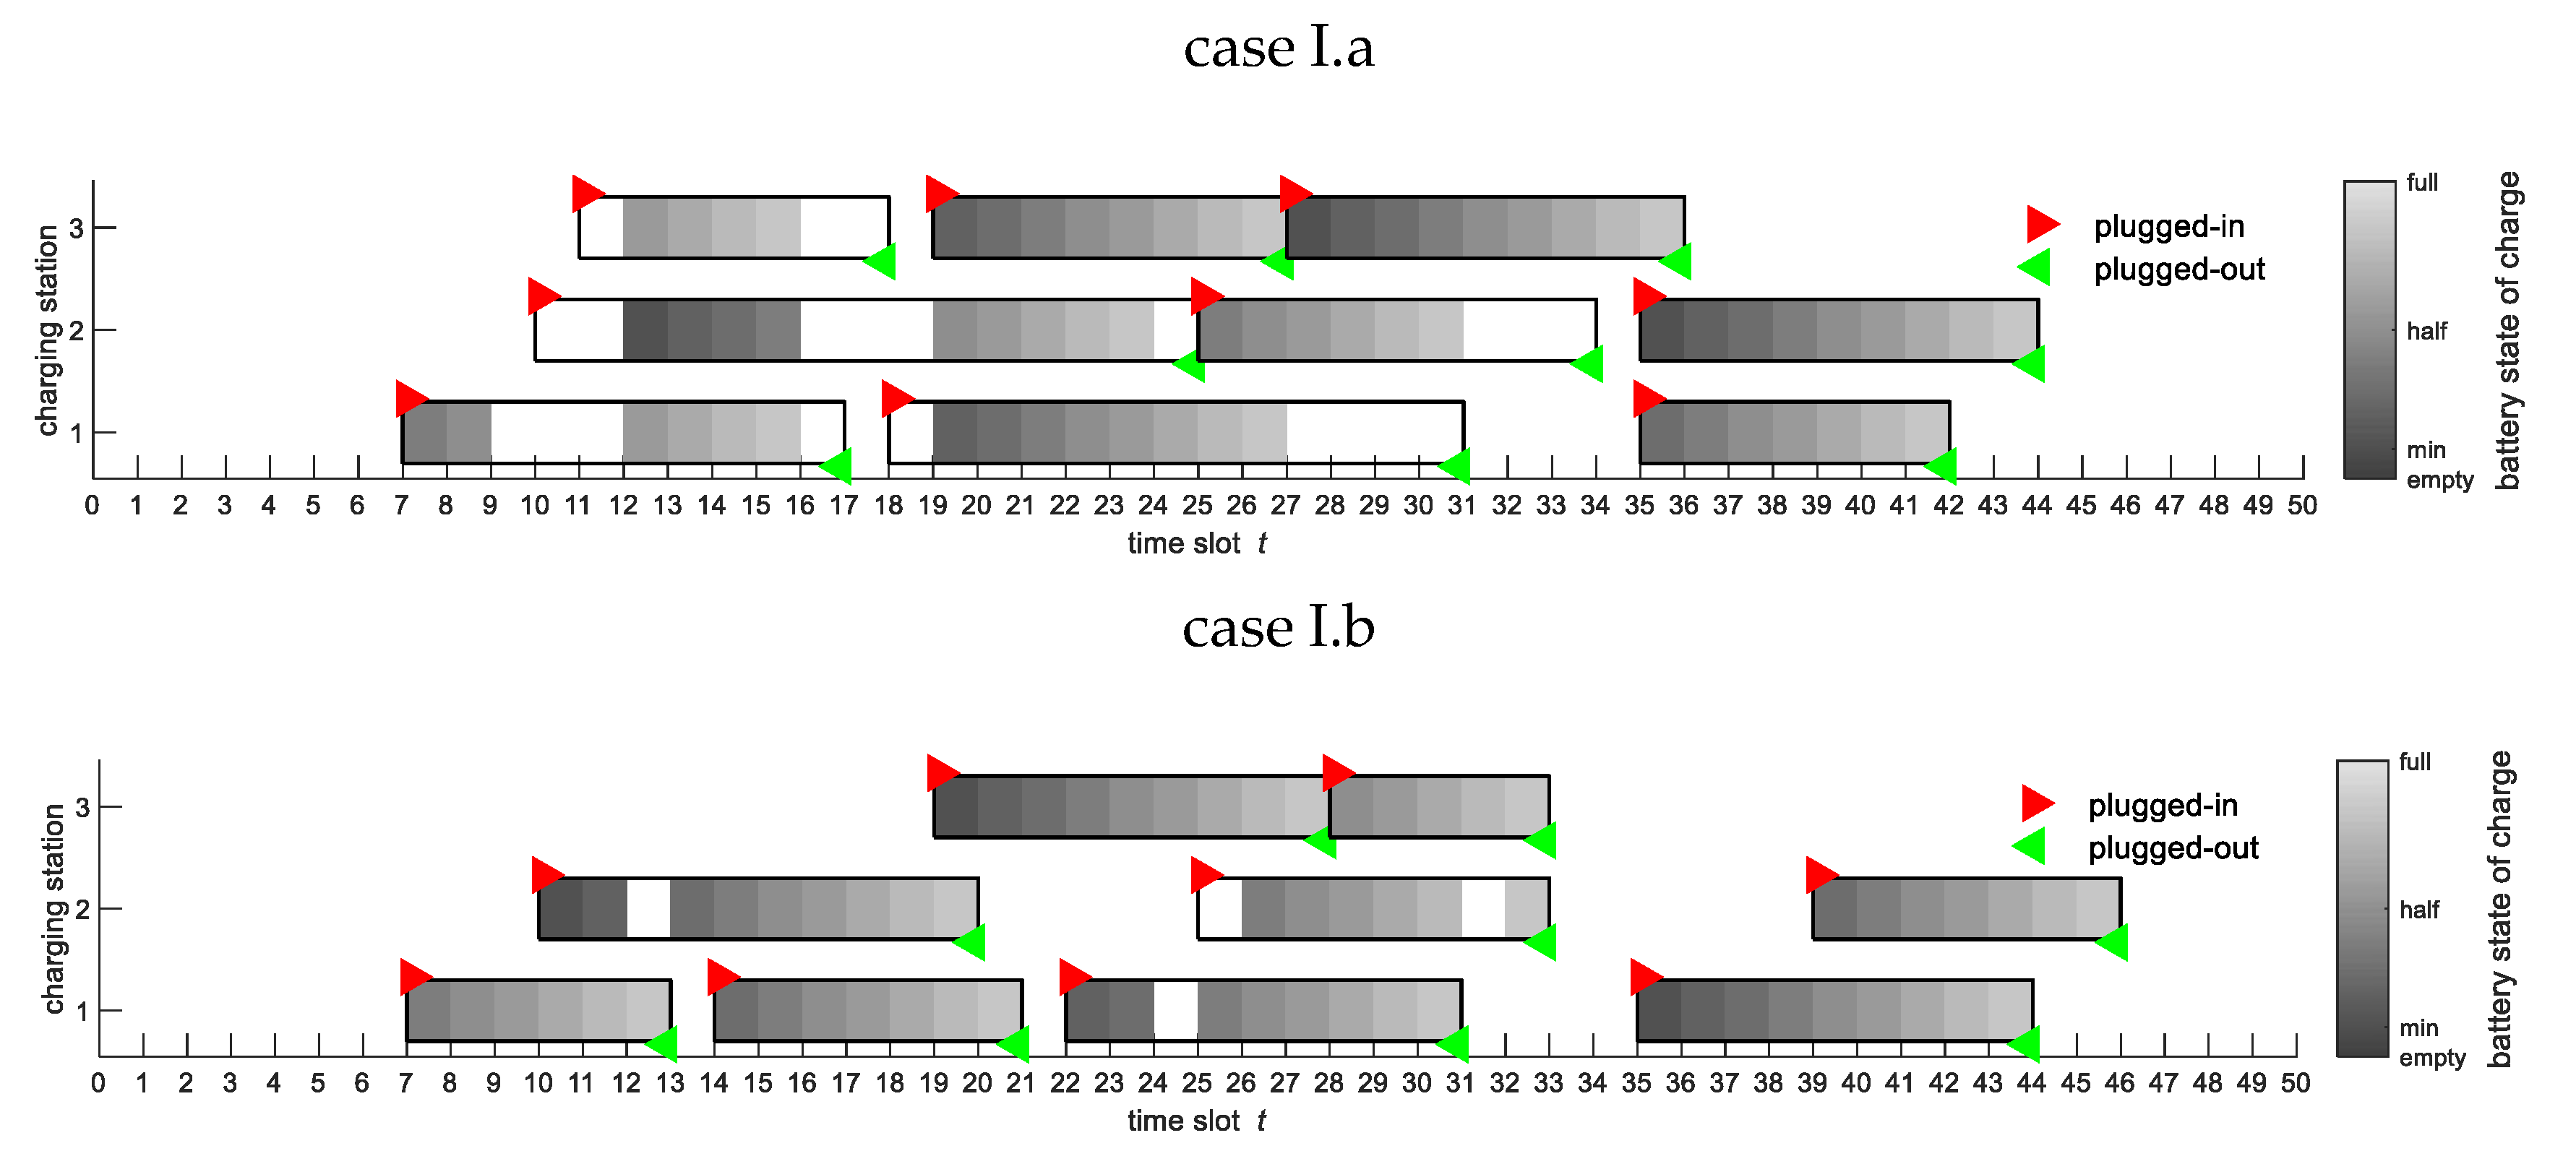
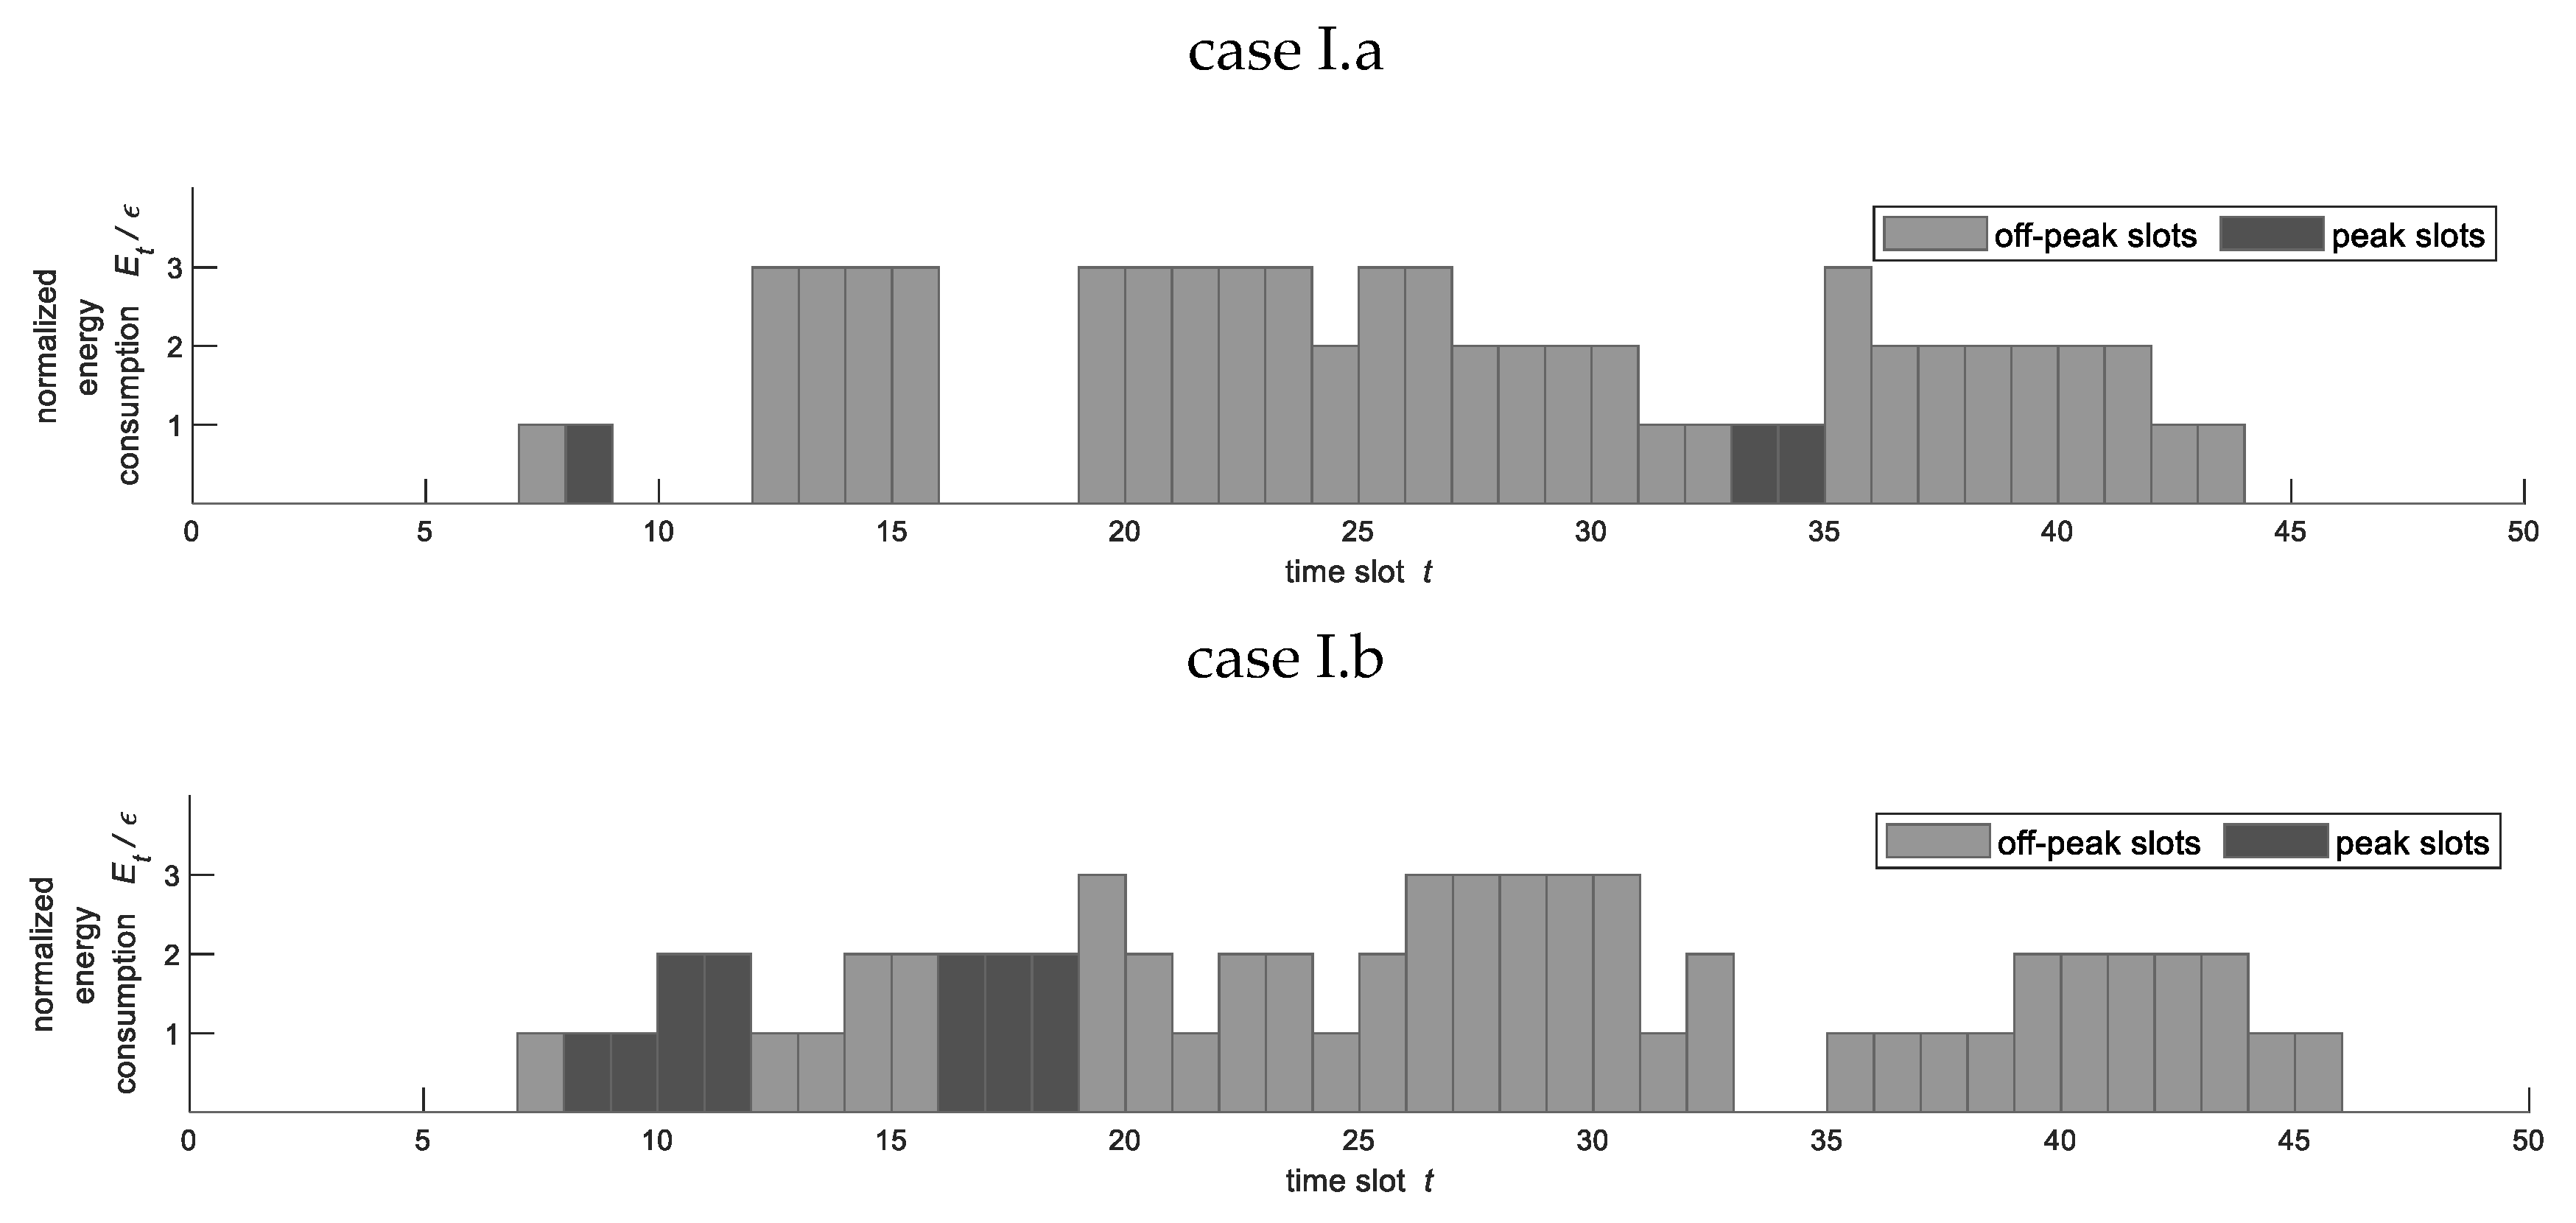
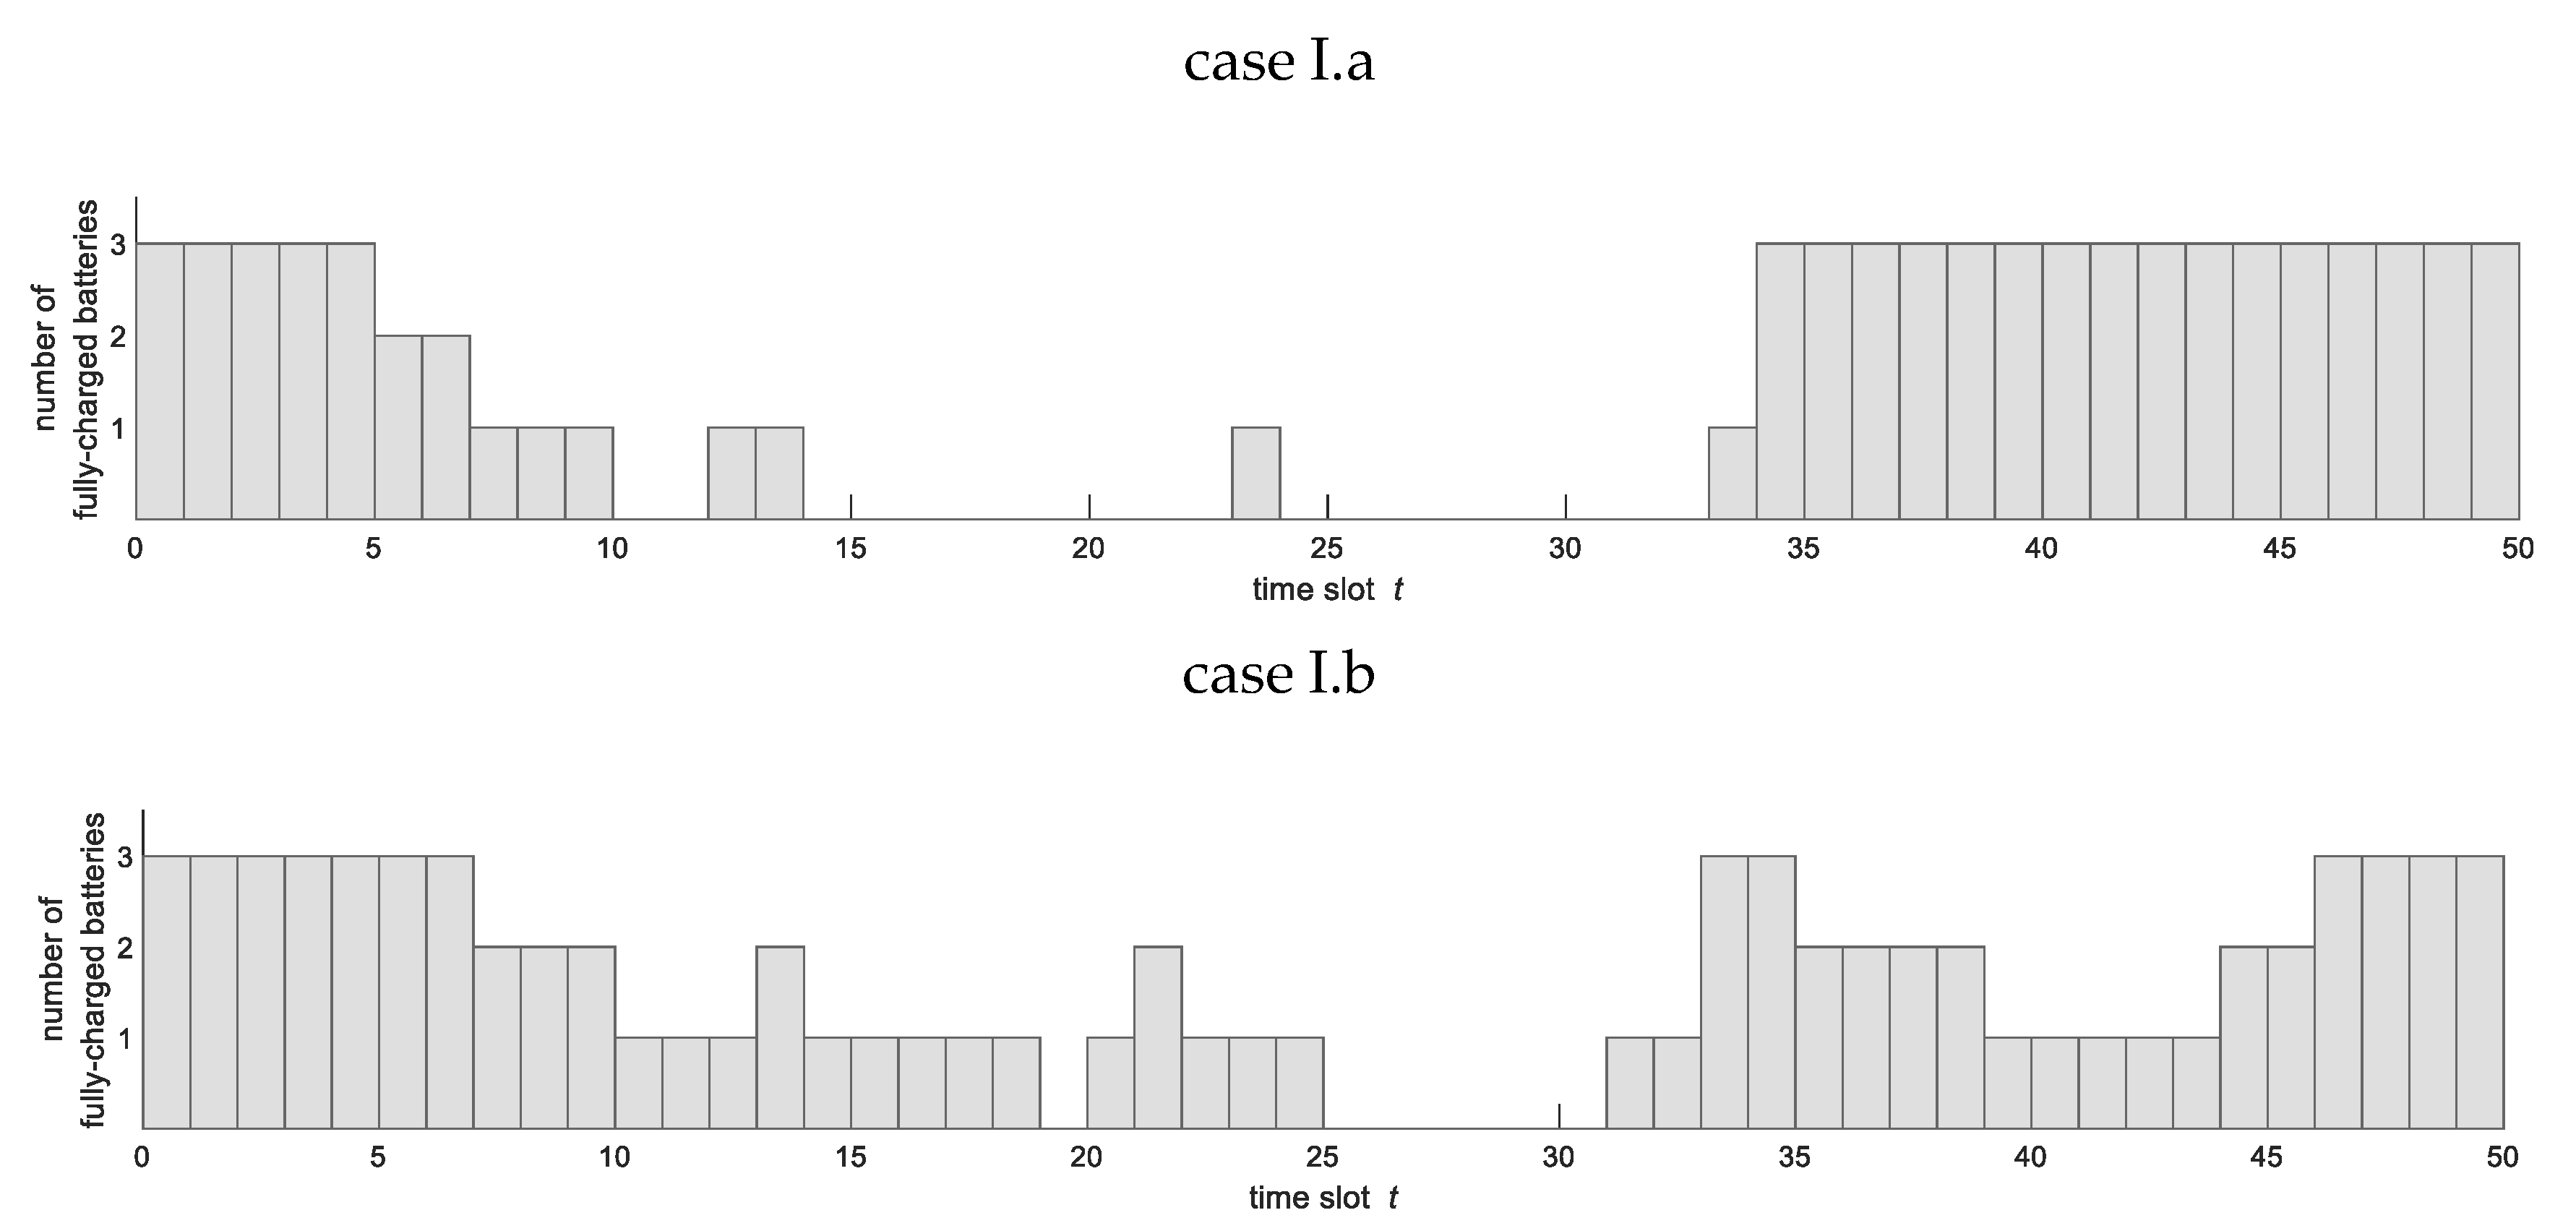
- Scenario I: We analyze in detail the optimal job scheduling, battery replacement strategies, and charging station energy scheduling when jobs are handled using forklifts and charging stations under two different model set-ups:
- Case I.a: With energy scheduling, i.e., 1/2 and 1/3;
- Case I.b: Without energy scheduling, i.e., and 0.
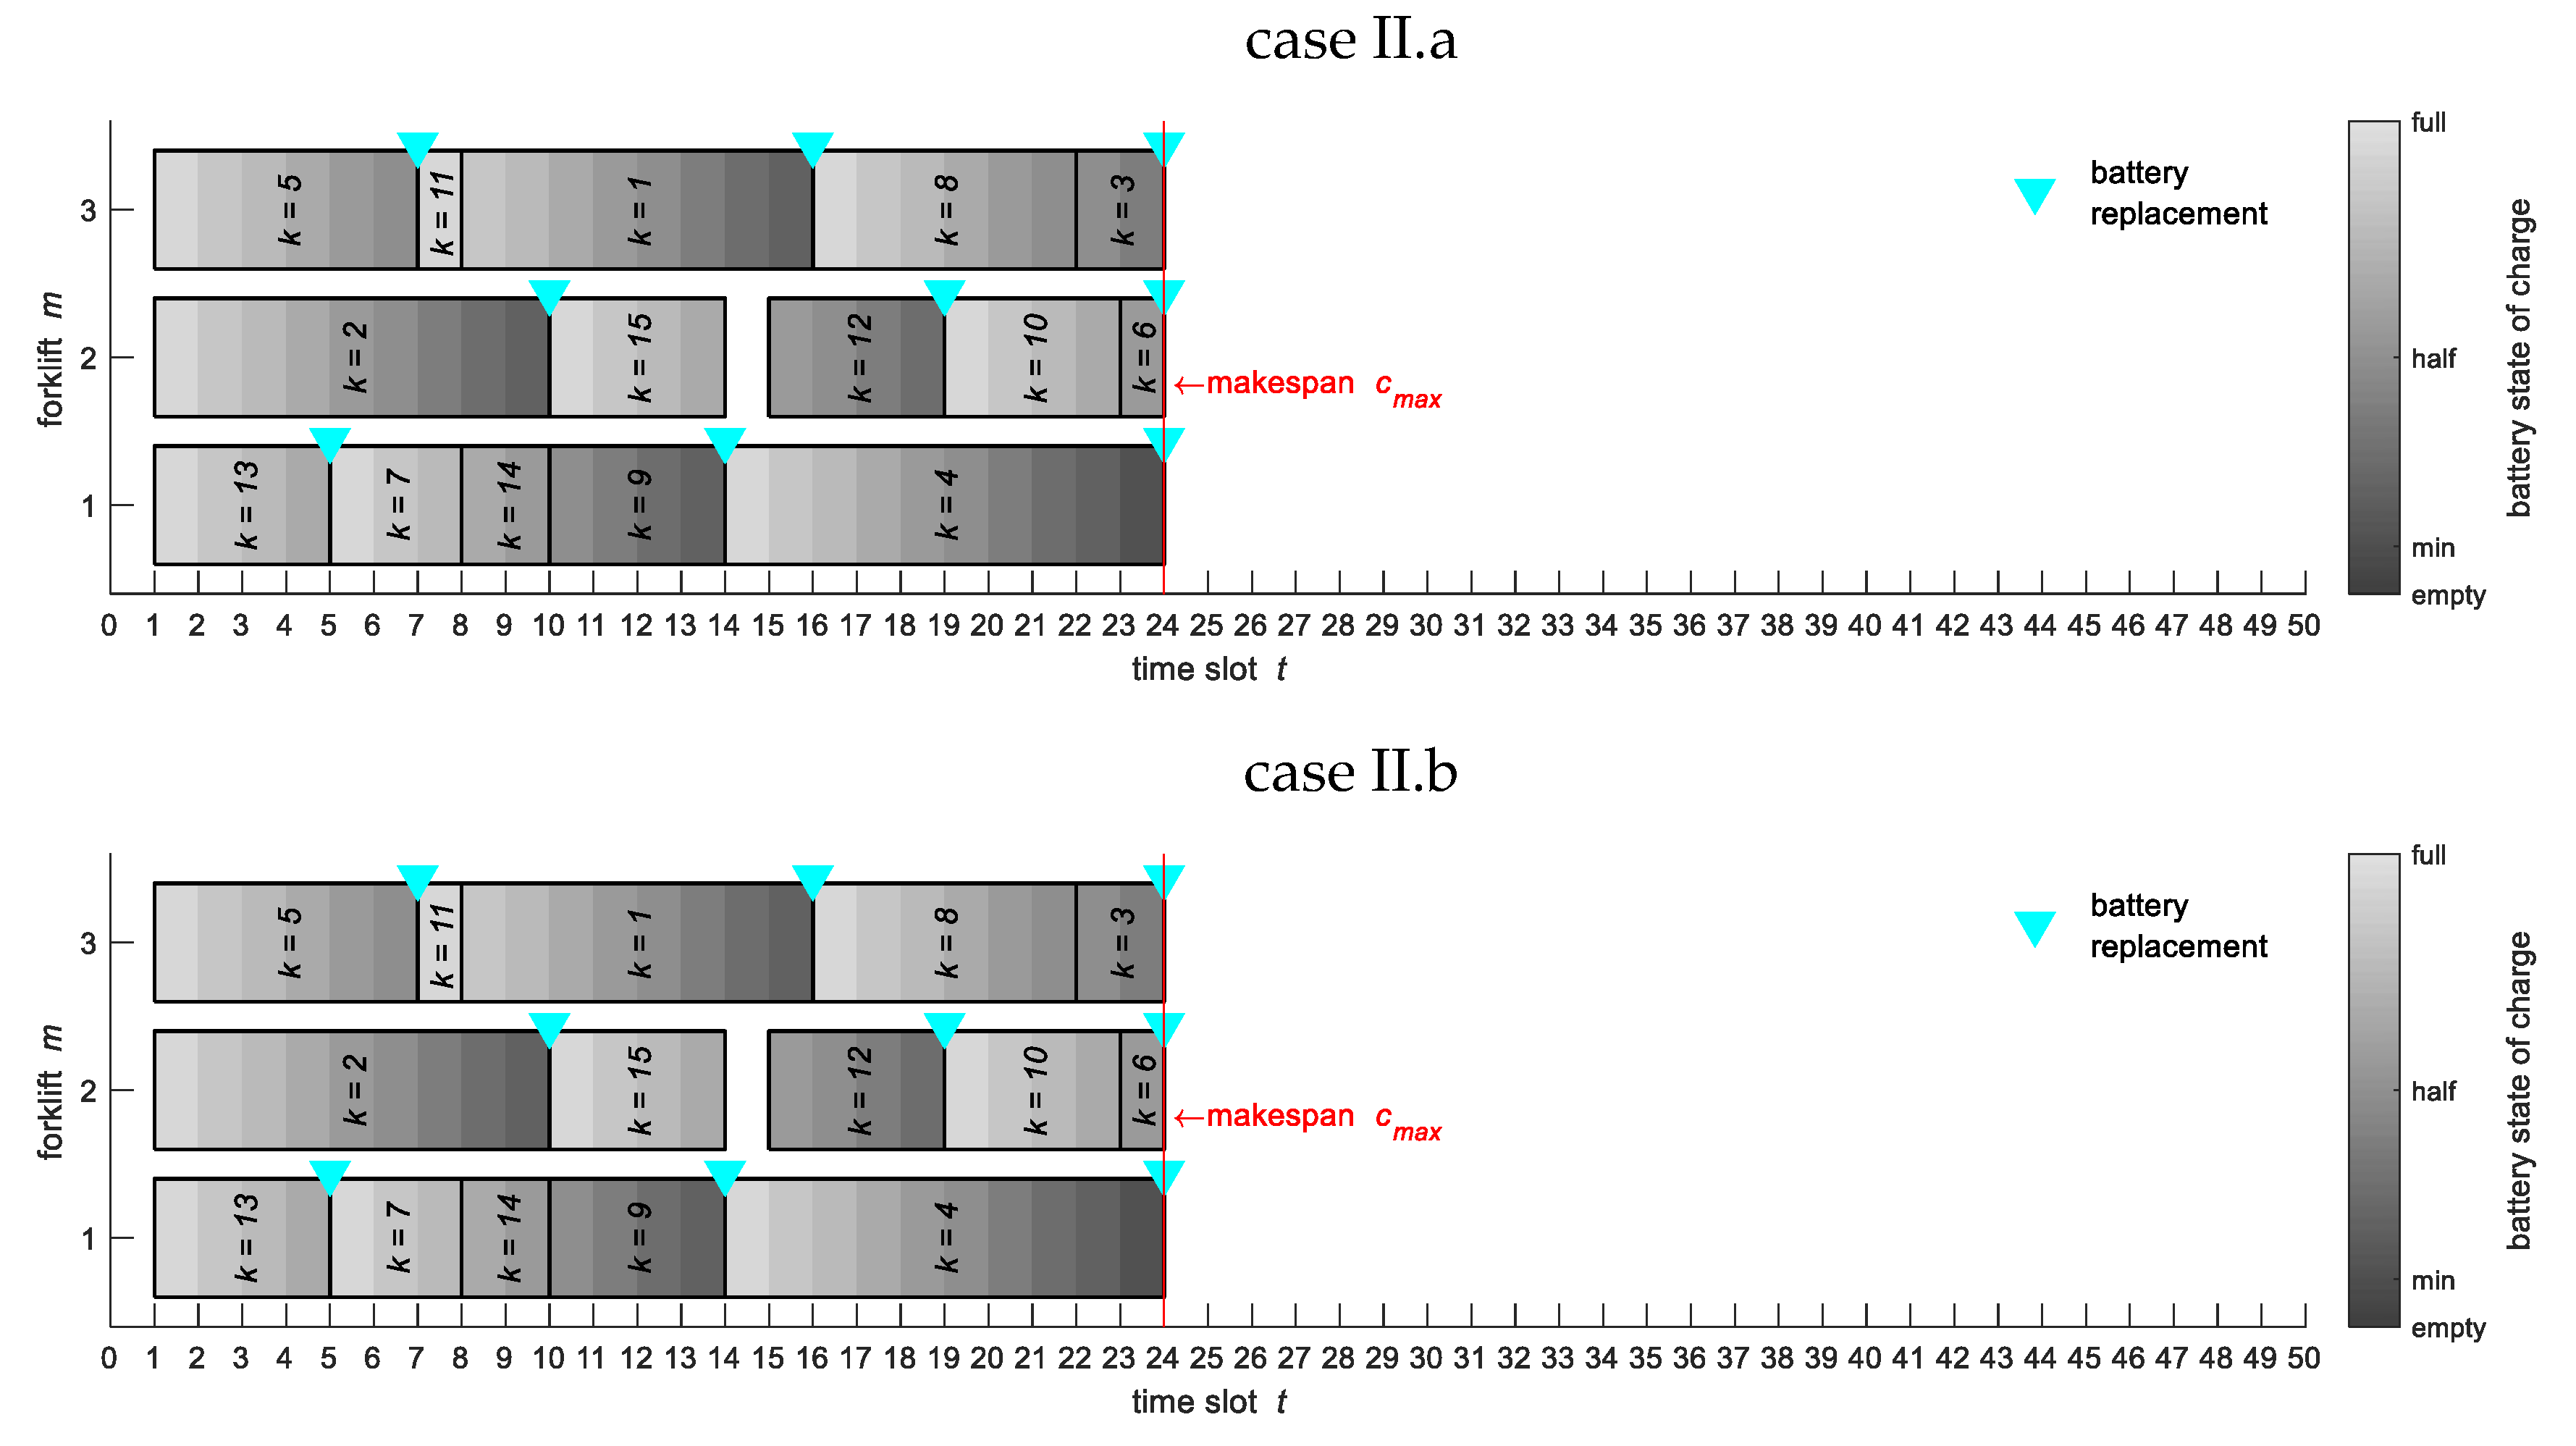
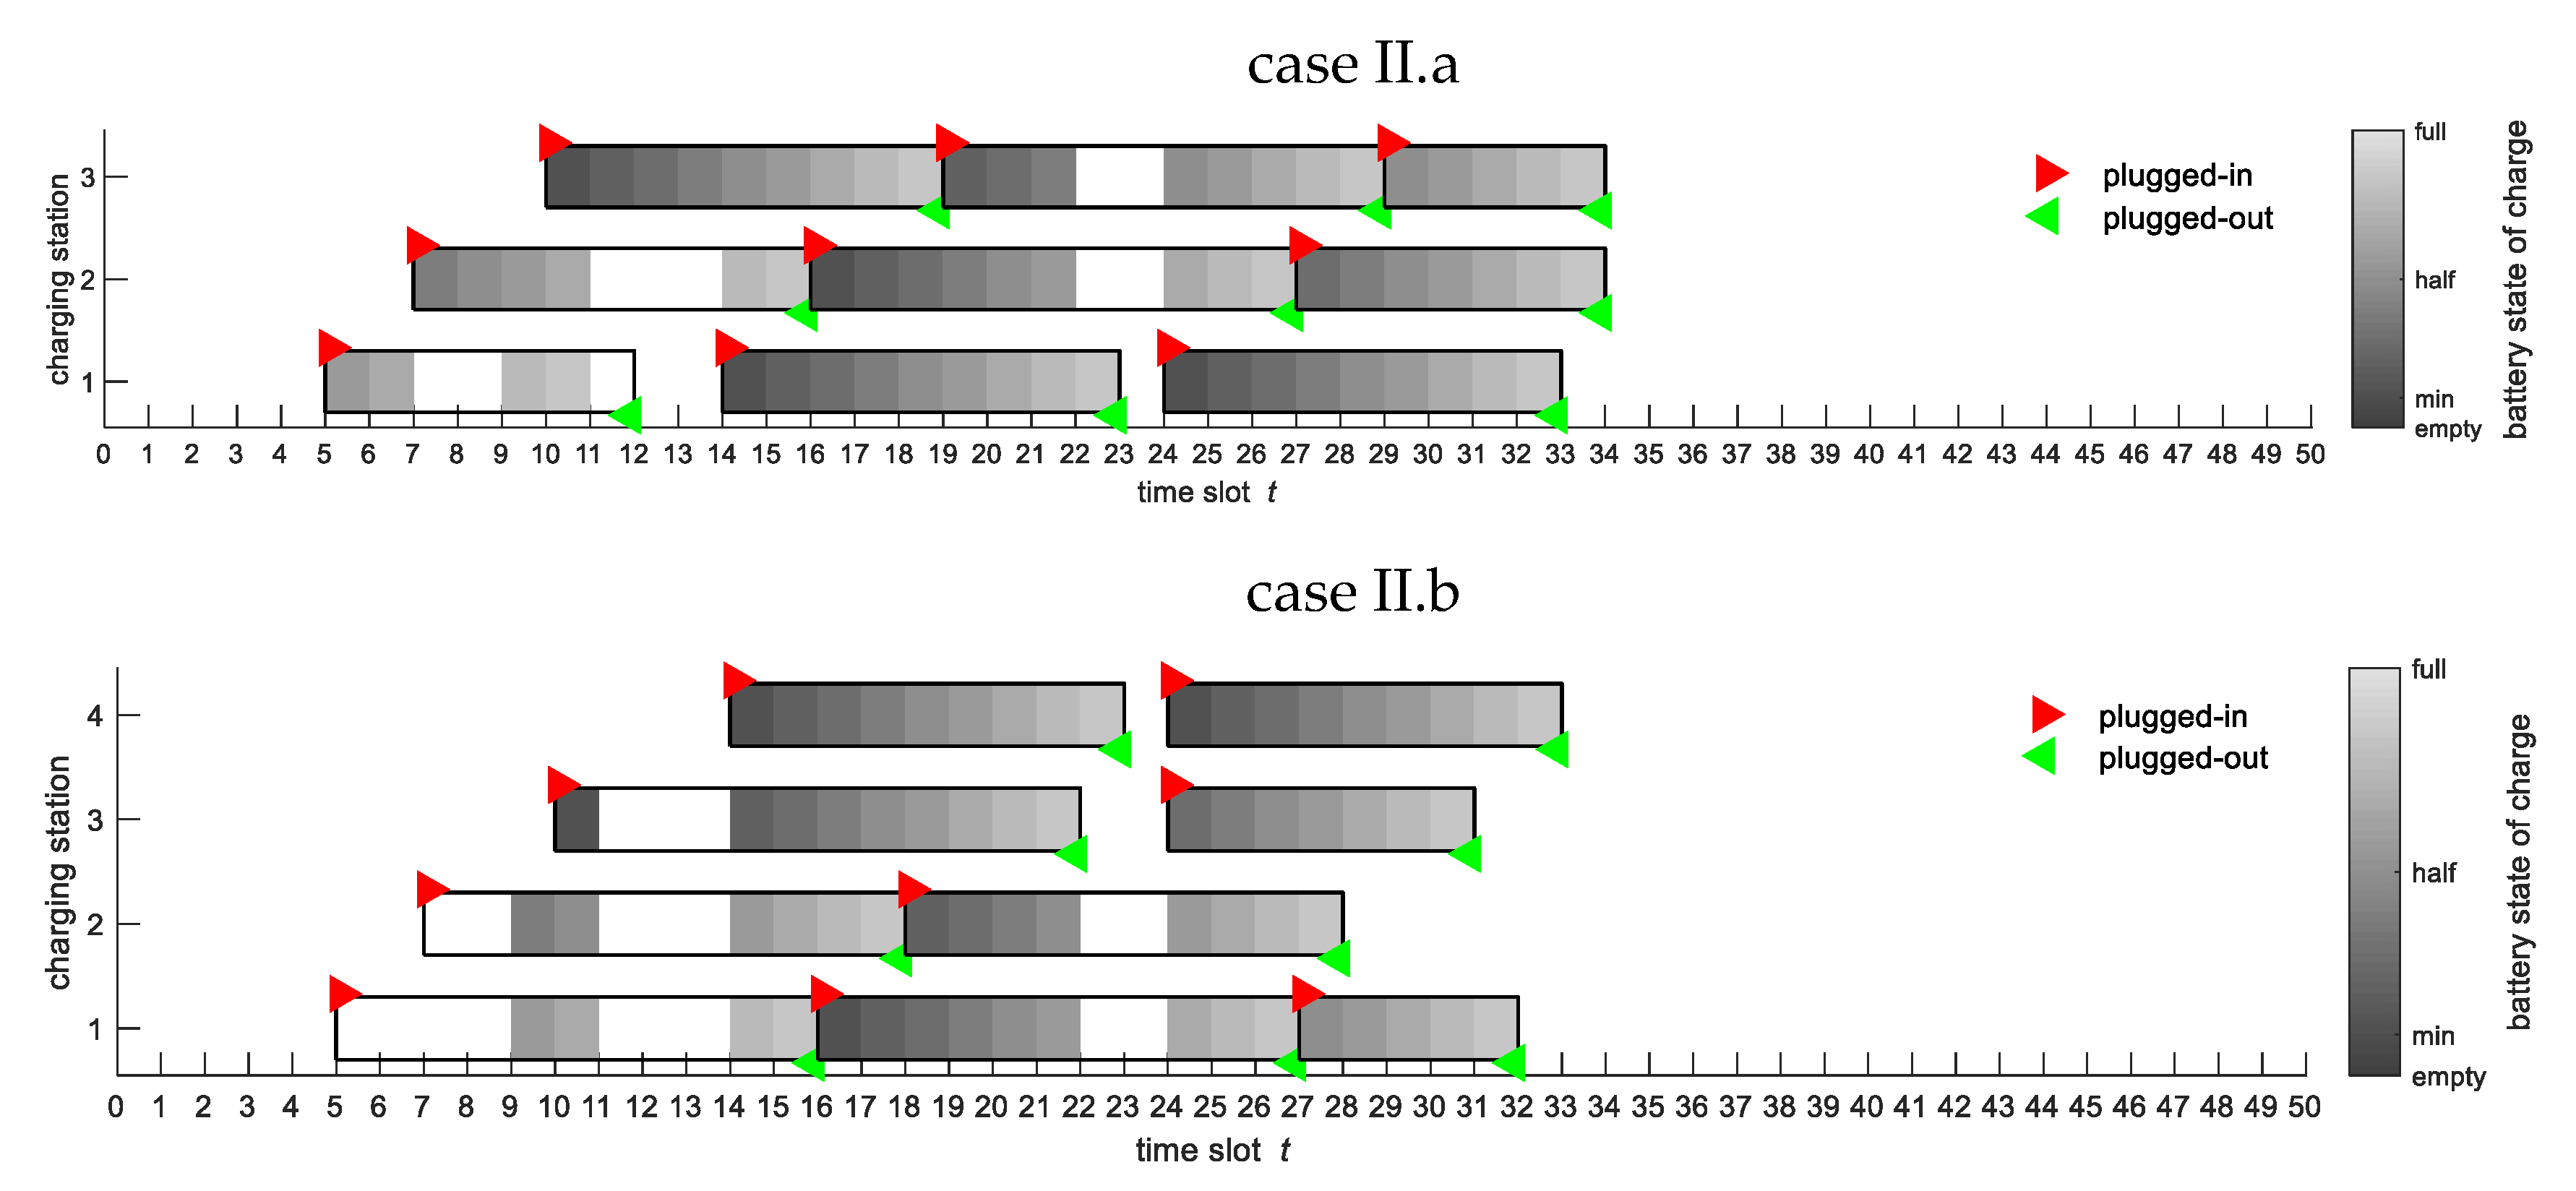
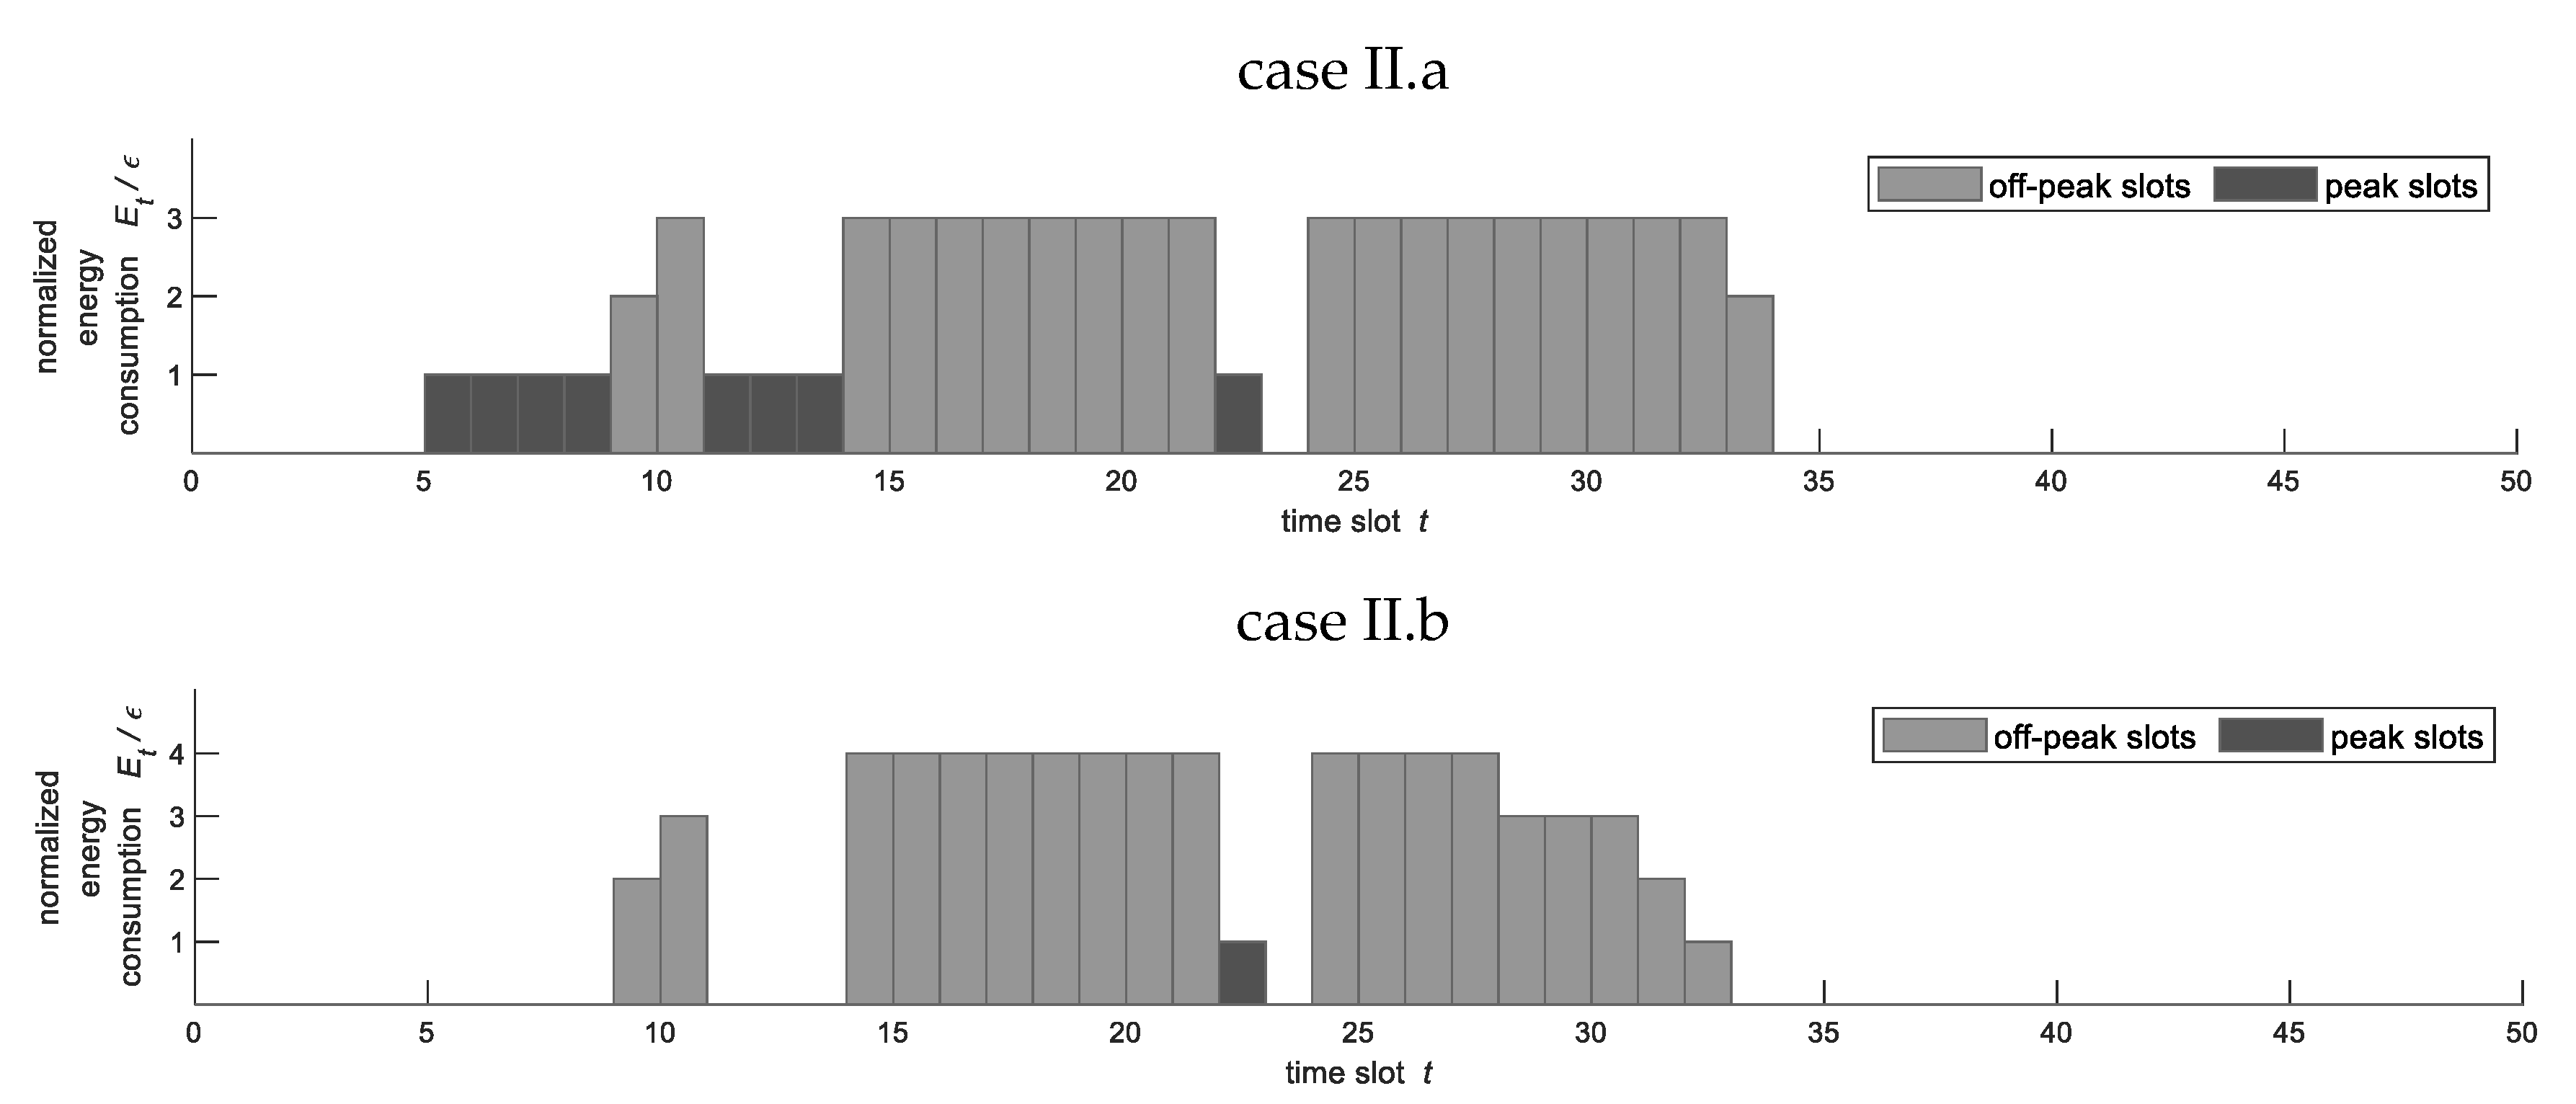
- Scenario II: We compare the optimal job scheduling, battery replacement strategies, and charging station energy scheduling obtained in scenario I.a (i.e., jobs, forklifts and charging stations) with the results obtained under two different configurations:
- Case II.a: forklifts and charging stations;
- Case II.b: forklifts and charging stations.
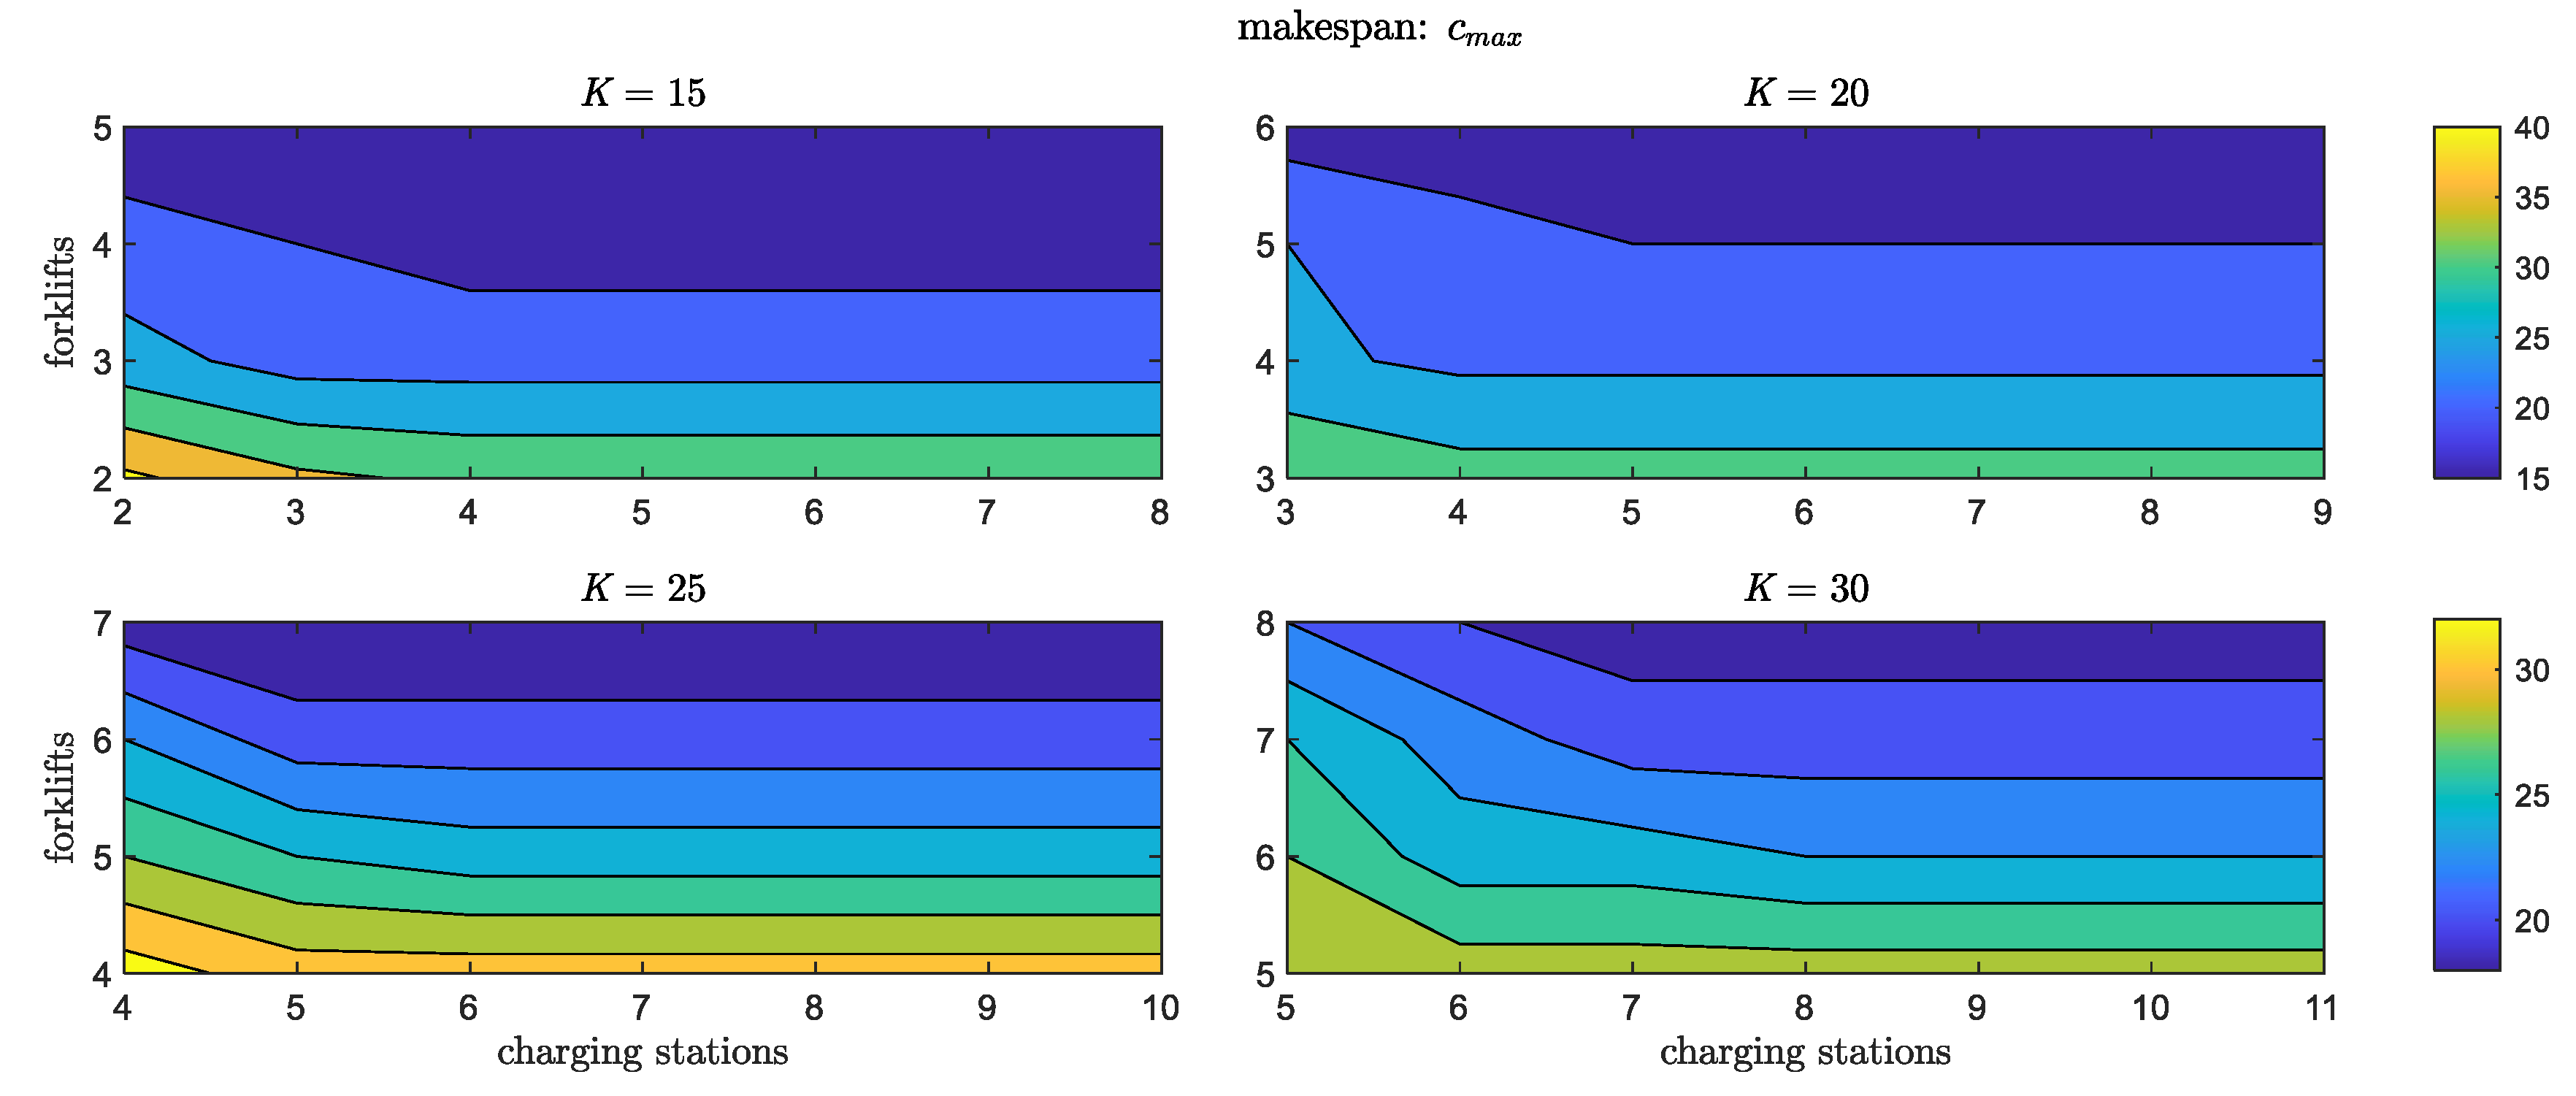
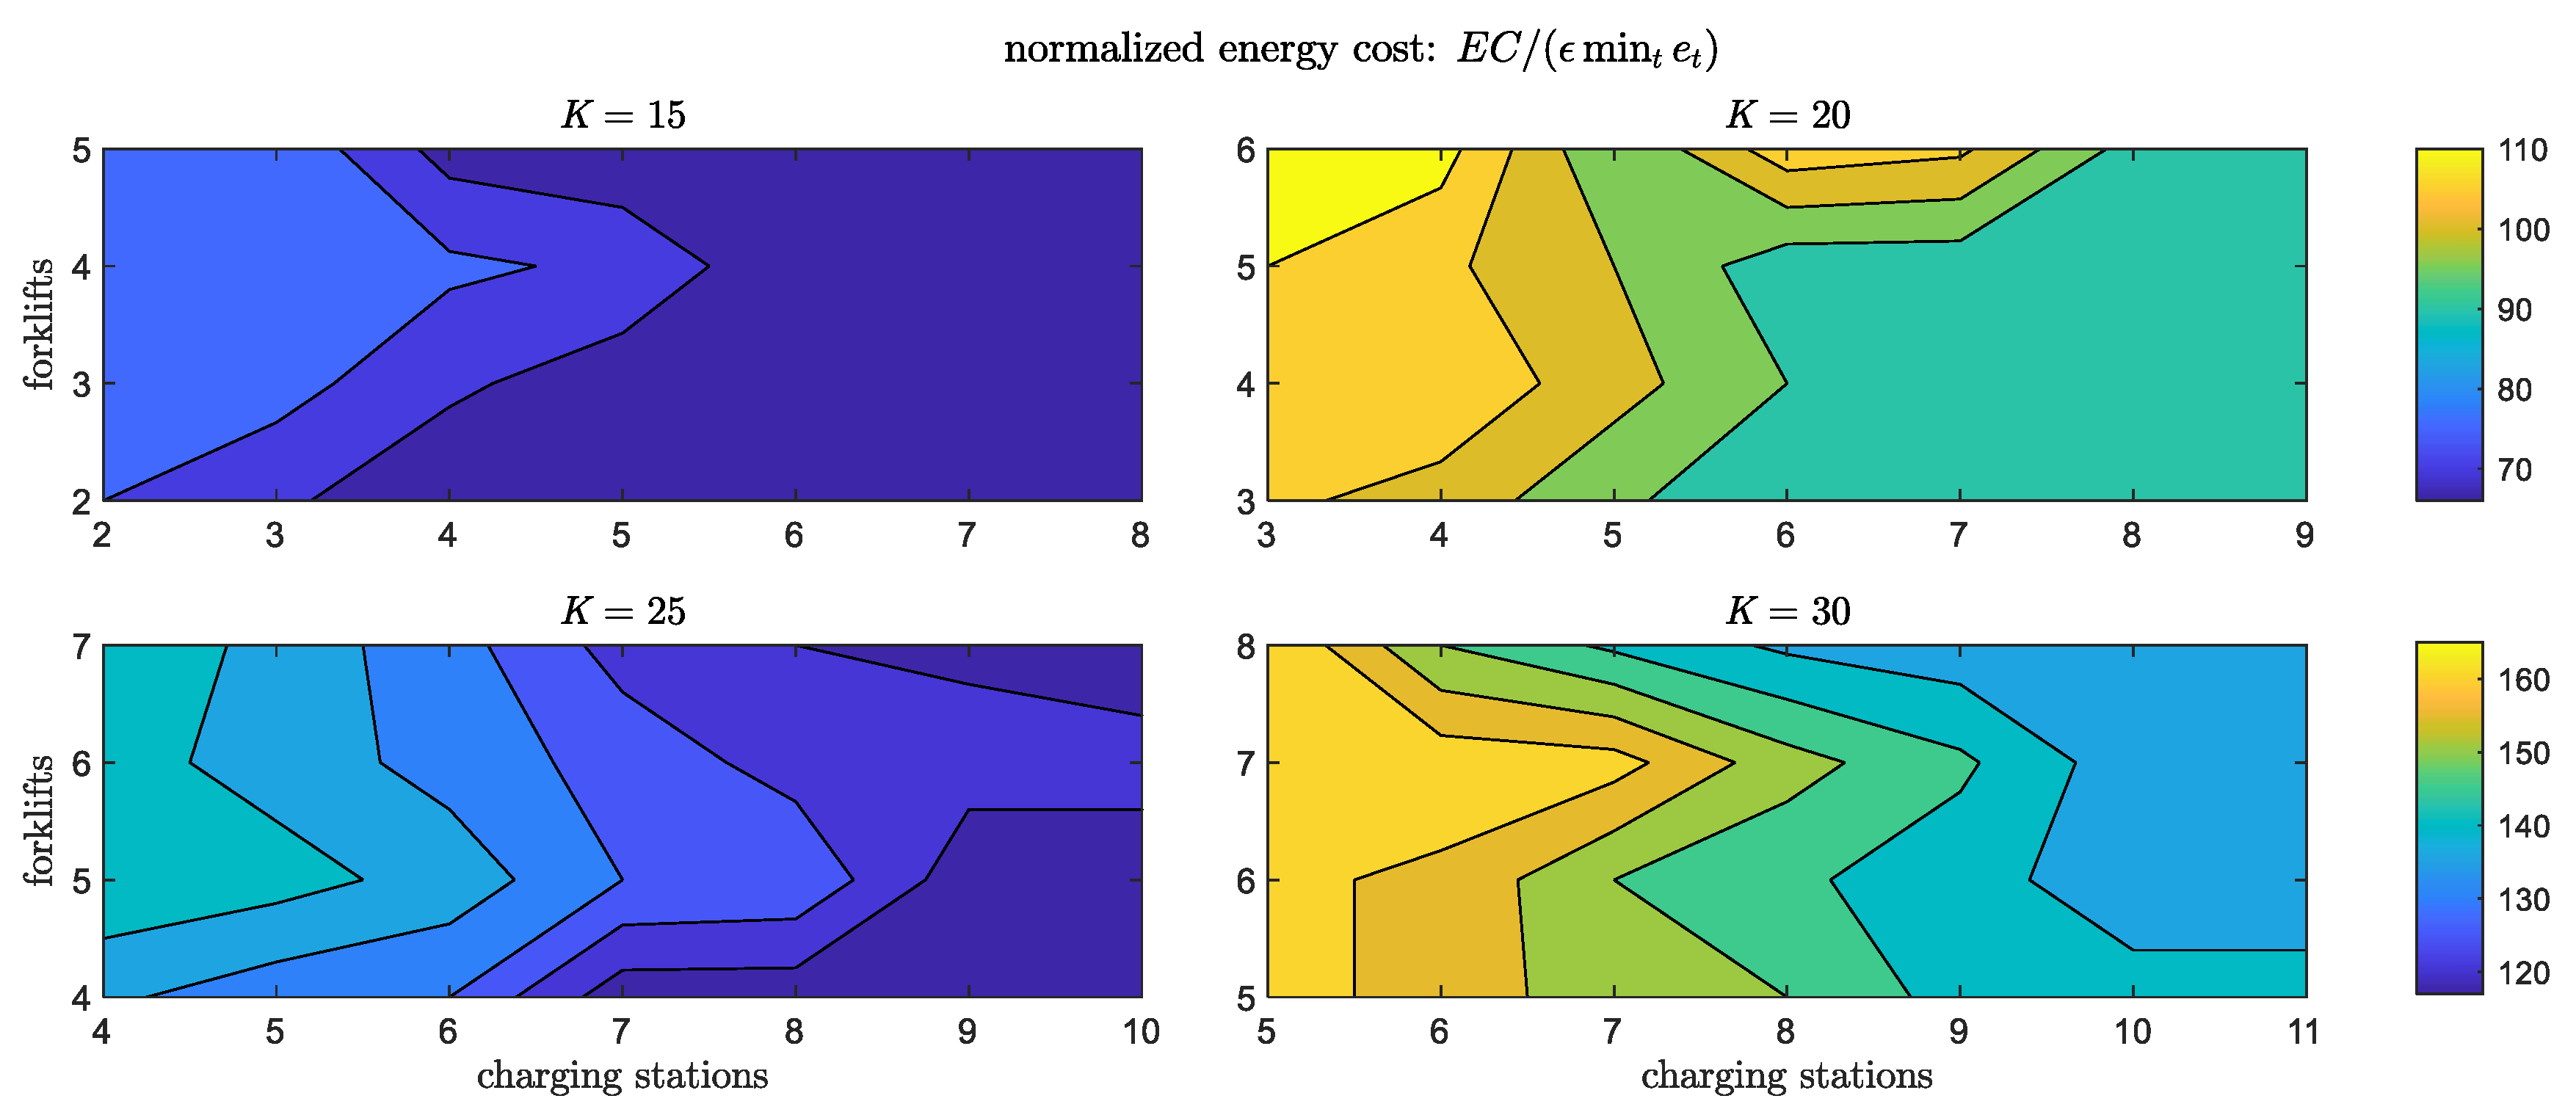
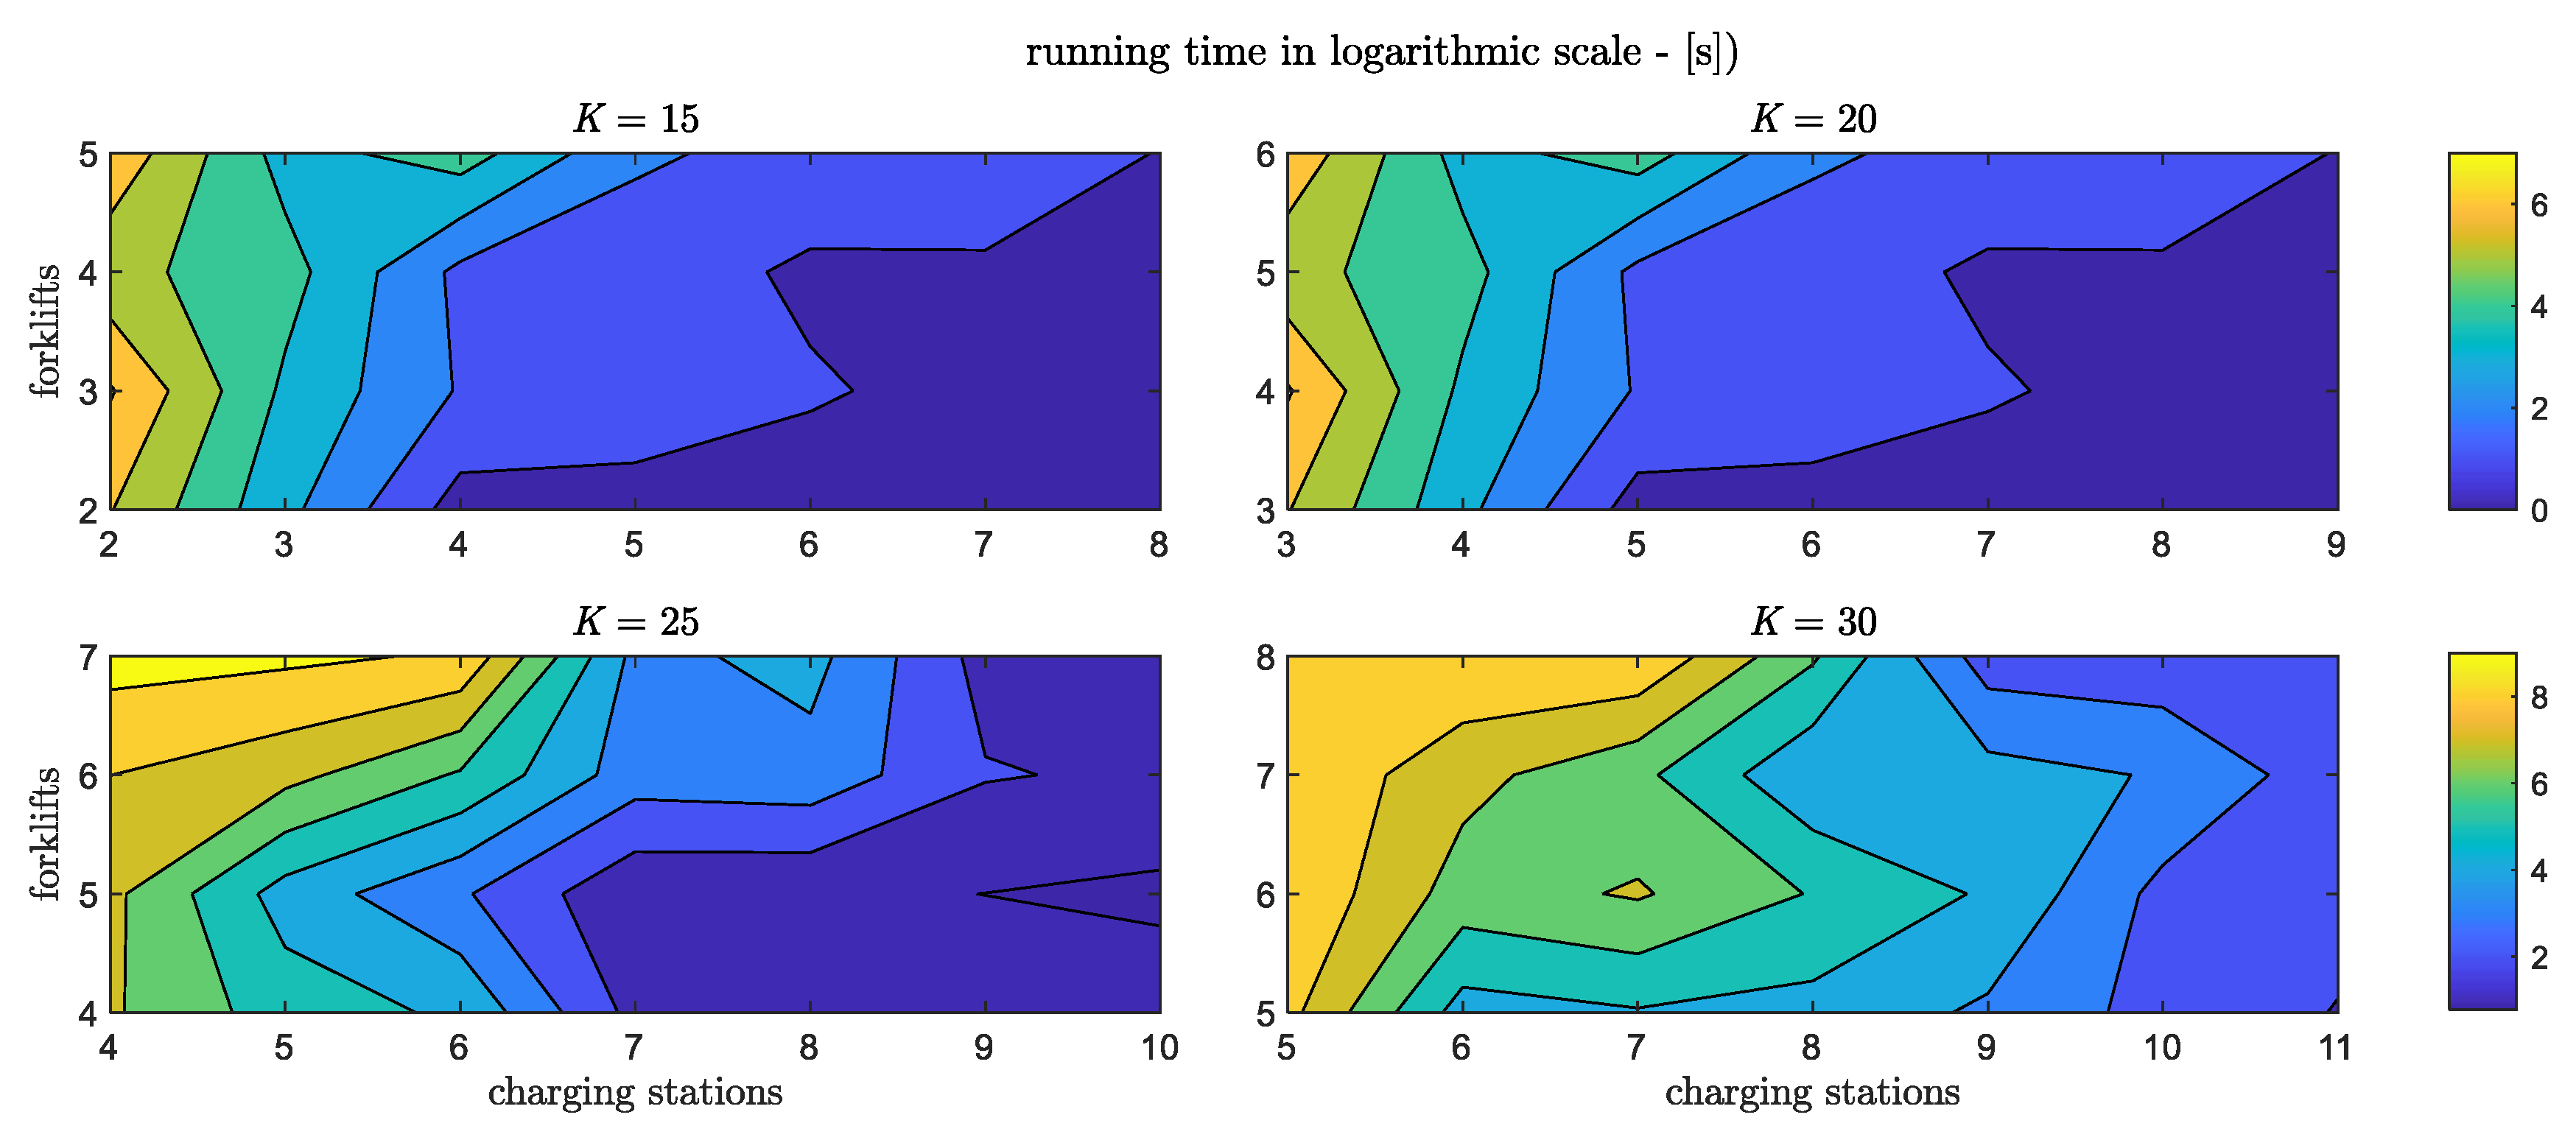
- Scenario III: We analyze how the results in terms of makespan, total completion time of recharging process, and energy cost are affected by variations in the number of jobs (changed in the range 15 ÷ 30), while varying the number of forklifts (changed in the range 2 ÷ 8), and the number of charging stations (changed in the range 2 ÷ 11).
4.2. Results and Discussion
5. Conclusions
Author Contributions
Funding
Conflicts of Interest
References
- Dhooma, J.; Baker, P. An exploratory framework for energy conservation in existing warehouses. Int. J. Logist. Res. Appl. 2012, 15, 37–51. [Google Scholar] [CrossRef]
- Doherty, S.; Simchi-levi, D.; Roos, J. Supply Chain Decarbonization: The Role of Logistics and Transport in Reducing Supply Chain Carbon Emissions; Report Prepared with the Support of Accenture; World Economic Forum: Geneve, Switzerland, 2009. [Google Scholar]
- Bartolini, M.; Bottani, E.; Grosse, E.H.; Bottani, E. Green warehousing: Systematic literature review and bibliometric analysis. J. Clean. Prod. 2019, 226, 242–258. [Google Scholar] [CrossRef]
- D’Amato, G.; Avitabile, G.; Coviello, G.; Talarico, C. Toward a novel architecture for beam steering of active phased-Array antennas. In Proceedings of the 2016 IEEE 59th International Midwest Symposium on Circuits and Systems (MWSCAS), Abu Dhabi, UAE, 16–19 October 2016; pp. 1–4. [Google Scholar]
- Bianchi, A.; Pizzutilo, S.; Vessio, G. Comparing AODV and N-AODV Routing Protocols for Mobile Ad-hoc Networks. In Proceedings of the 13th International Conference on Advances in Mobile Computing and Multimedia (MoMM 2015), Brussels, Belgium, 11–13 December 2015; pp. 159–168. [Google Scholar]
- Casalino, G.; Castellano, G.; Pasquadibisceglie, V.; Zaza, G. Contact-Less Real-Time Monitoring of Cardiovascular Risk Using Video Imaging and Fuzzy Inference Rules. Information 2018, 10, 9. [Google Scholar] [CrossRef]
- D’Amato, G.; Avitabile, G.; Coviello, G.; Talarico, C. A beam steering unit for active phased-array antennas based on FPGA synthesized delay-lines and PLLs. In Proceedings of the 2015 International Conference on Synthesis, Modeling, Analysis and Simulation Methods and Applications to Circuit Design, SMACD 2015, Istanbul, Turkey, 7–9 September 2015. [Google Scholar]
- Kozlowski, A.; Searcy, C.; Bardecki, M. Innovation for a Sustainable Fashion Industry: A Design Focused Approach toward the Development of New Business Models. In Green Fashion. Environmental Footprints and Eco-design of Products and Processes; Springer: Singapore, 2016. [Google Scholar]
- Yang, B.; Cho, H. Engine Technology and Research Trends of Advanced Biofuel As Alternative Fuel for Transportation Vehicles. Int. J. Mech. Eng. Technol. 2019, 10, 576–584. [Google Scholar]
- Energy Information Administration. International Energy Outlook; Energy Information Administration: Washington, DC, USA, 2019; pp. 70–99. [Google Scholar]
- Zhang, Q.; Grossmann, I.E. Enterprise-wide optimization for industrial demand side management: Fundamentals, advances, and perspectives. Chem. Eng. Res. Des. 2016, 116, 114–131. [Google Scholar] [CrossRef]
- Song, M.; Alvehag, K.; Widén, J.; Parisio, A. Estimating the impacts of demand response by simulating household behaviours under price and CO2 signals. Electr. Power Syst. Res. 2014, 111, 103–114. [Google Scholar] [CrossRef]
- Strbac, G. Demand side management: Benefits and challenges. Energy Policy 2008, 36, 4419–4426. [Google Scholar] [CrossRef]
- Palensky, P.; Dietrich, D. Demand Side Management: Demand Response, Intelligent Energy Systems, and Smart Loads. IEEE Trans. Ind. Informatics 2011, 7, 381–388. [Google Scholar] [CrossRef]
- Moon, J.-Y.; Park, J. Smart production scheduling with time-dependent and machine-dependent electricity cost by considering distributed energy resources and energy storage. Int. J. Prod. Res. 2013, 52, 3922–3939. [Google Scholar] [CrossRef]
- Fichtinger, J.; Ries, J.M.; Grosse, E.H.; Baker, P. Assessing the environmental impact of integrated inventory and warehouse management. Int. J. Prod. Econ. 2015, 170, 717–729. [Google Scholar] [CrossRef]
- Žulj, I.; Glock, C.H.; Grosse, E.H.; Schneider, M. Picker routing and storage-assignment strategies for precedence-constrained order picking. Comput. Ind. Eng. 2018, 123, 338–347. [Google Scholar] [CrossRef]
- Bortolini, M.; Faccio, M.; Ferrari, E.; Gamberi, M.; Pilati, F. Time and energy optimal unit-load assignment for automatic S/R warehouses. Int. J. Prod. Econ. 2017, 190, 133–145. [Google Scholar] [CrossRef]
- Ghalehkhondabi, I.; Masel, D.T. Storage allocation in a warehouse based on the forklifts fleet availability. J. Algorithms Comput. Technol. 2018, 12, 127–135. [Google Scholar] [CrossRef]
- Meneghetti, A.; Borgo, E.D.; Monti, L. Rack shape and energy efficient operations in automated storage and retrieval systems. Int. J. Prod. Res. 2015, 53, 1–14. [Google Scholar] [CrossRef]
- Meneghetti, A.; Monti, L. Multiple-weight unit load storage assignment strategies for energy-efficient automated warehouses. Int. J. Logist. Res. Appl. 2013, 17, 304–322. [Google Scholar] [CrossRef]
- Ene, S.; Küçükoğlu, I.; Aksoy, A.; Öztürk, N. A genetic algorithm for minimizing energy consumption in warehouses. Energy 2016, 114, 973–980. [Google Scholar] [CrossRef]
- Anand, V.; Lee, S.; Prabhu, V.V. Energy-Aware Models for Warehousing Operations. In IFIP Advances in Information and Communication Technology, vol. 439; Springer: Berlin/Heidelberg, Germany, 2014. [Google Scholar]
- Taljanovic, K.; Salihbegovic, A. A new strategies in picking from the forward pick locations. In Proceedings of the ICAT 2009—2009 22nd International Symposium on Information, Communication and Automation Technologies, Sarajevo, Bosnia and Herzegovina, 29–31 October 2009. [Google Scholar]
- Boysen, N.; Briskorn, D.; Emde, S. Parts-to-picker based order processing in a rack-moving mobile robots environment. Eur. J. Oper. Res. 2017, 262, 550–562. [Google Scholar] [CrossRef]
- Elbert, R.M.; Franzke, T.; Glock, C.H.; Grosse, E.H. The effects of human behavior on the efficiency of routing policies in order picking: The case of route deviations. Comput. Ind. Eng. 2017, 111, 537–551. [Google Scholar] [CrossRef]
- Dukić, G.; Česnik, V.; Opetuk, T. Order-picking methods and technologies for greener warehousing. Strojarstvo 2010, 52, 23–31. [Google Scholar]
- Fekete, P.; Lim, S.; Martin, S.; Kuhn, K.; Wright, N. Improved energy supply for non-road electric vehicles by occasional charging station location modelling. Energy 2016, 114, 1033–1040. [Google Scholar] [CrossRef]
- Akandere, G. The Effect of Logistic Businesses’ Green Warehouse Management Practices on Business Performance. In Proceedings of the 25th International Academic Conference, Paris, France, 6–9 September 2016; pp. 10–23. [Google Scholar]
- Petljak, K.; Zulauf, K.; Štulec, I.; Seuring, S.; Wagner, R. Green supply chain management in food retailing: Survey-based evidence in Croatia. Supply Chain Manag. Int. J. 2018, 23, 1–15. [Google Scholar] [CrossRef]
- Xin, L.J.; Xien, K.C.; Wahab, S.N. A Study on the Factors Influencing Green Warehouse Practice. In E3S Web of Conferences, Proceedings of the 2019 International Conference on Building Energy Conservation, Thermal Safety and Environmental Pollution Control (ICBTE 2019), Hefei, China, 1–3 November 2019; EDP Sciences: Les Ulis, France, 2019; Volume 136. [Google Scholar] [CrossRef]
- Ries, J.M.; Grosse, E.H.; Fichtinger, J. Environmental impact of warehousing: A scenario analysis for the United States. Int. J. Prod. Res. 2017, 55, 6485–6499. [Google Scholar] [CrossRef]
- Manghisi, V.M.; Uva, A.E.; Fiorentino, M.; Gattullo, M.; Boccaccio, A.; Evangelista, A. Automatic Ergonomic Postural Risk Monitoring on the factory shopfloor—The ErgoSentinel Tool. Procedia Manuf. 2020, 42, 97–103. [Google Scholar] [CrossRef]
- Manghisi, V.M.; Uva, A.E.; Fiorentino, M.; Bevilacqua, V.; Trotta, G.F.; Monno, G. Real time RULA assessment using Kinect v2 sensor. Appl. Ergon. 2017, 65, 481–491. [Google Scholar] [CrossRef] [PubMed]
- Pamungkas, D.; Pipattanasomporn, M.; Rahman, S.; Hariyanto, N. Suwarno Impacts of Solar PV, Battery Storage and HVAC Set Point Adjustments on Energy Savings and Peak Demand Reduction Potentials in Buildings. In Proceedings of the 2018 International Conference and Utility Exhibition on Green Energy for Sustainable Development (ICUE), Phuket, Thailand, 24–26 October 2018. [Google Scholar]
- Ardiyanto, D.; Pipattanasomporn, M.; Rahman, S.; Hariyanto, N. Occupant-based HVAC Set Point Interventions for Energy Savings in Buildings. In Proceedings of the 2018 International Conference and Utility Exhibition on Green Energy for Sustainable Development (ICUE), Phuket, Thailand, 24–26 October 2018. [Google Scholar] [CrossRef]
- Minav, T.; Laurila, L.I.; Pyrhönen, J.J. Analysis of electro-hydraulic lifting system’s energy efficiency with direct electric drive pump control. Autom. Constr. 2013, 30, 144–150. [Google Scholar] [CrossRef]
- Minav, T.; Virtanen, A.; Laurila, L.; Pyrhönen, J. Storage of energy recovered from an industrial forklift. Autom. Constr. 2012, 22, 506–515. [Google Scholar] [CrossRef]
- Freis, J.; Vohlidka, P.; Günthner, W.A. Low-Carbon Warehousing: Examining Impacts of Building and Intra-Logistics Design Options on Energy Demand and the CO2 Emissions of Logistics Centers. Sustainability 2016, 8, 448. [Google Scholar] [CrossRef]
- Schneider, M.; Stenger, A.; Goeke, D. The Electric Vehicle-Routing Problem with Time Windows and Recharging Stations. Transp. Sci. 2014, 48, 500–520. [Google Scholar] [CrossRef]
- Schiffer, M.; Schneider, M.; Walther, G.; Laporte, G. Vehicle Routing and Location Routing with Intermediate Stops: A Review. Transp. Sci. 2019, 53, 319–343. [Google Scholar] [CrossRef]
- Carli, R.; Dotoli, M. Decentralized control for residential energy management of a smart users microgrid with renewable energy exchange. IEEE/CAA J. Autom. Sin. 2019, 6, 641–656. [Google Scholar] [CrossRef]
- Finn, P.; Fitzpatrick, C. Demand side management of industrial electricity consumption: Promoting the use of renewable energy through real-time pricing. Appl. Energy 2014, 113, 11–21. [Google Scholar] [CrossRef]
- Xie, C.; Allen, T.T. Simulation and experimental design methods for job shop scheduling with material handling: A survey. Int. J. Adv. Manuf. Technol. 2015, 80, 233–243. [Google Scholar] [CrossRef]
- Minav, T.; Hänninen, H.; Sinkkonen, A.; Laurila, L.; Pyrhönen, J. Electric or hydraulic energy recovery systems in a reach truck—A comparison. Stroj. Vestnik/J. Mech. Eng. 2014, 60, 232–240. [Google Scholar] [CrossRef]
- Glover, F. Improved Linear Integer Programming Formulations of Nonlinear Integer Problems. Manag. Sci. 1975, 22, 455–460. [Google Scholar] [CrossRef]
- Çelebi, E.; Fuller, J.D. Time-of-Use Pricing in Electricity Markets under Different Market Structures. IEEE Trans. Power Syst. 2012, 27, 1170–1181. [Google Scholar] [CrossRef]
- Achterberg, T. SCIP: Solving constraint integer programs. Math. Program. Comput. 2009, 1, 1–41. [Google Scholar] [CrossRef]


| Time [year] | Energy consumed [MWh per year] | |||||||||||
|---|---|---|---|---|---|---|---|---|---|---|---|---|
| MHE | Δ [%] | HVAC | Δ [%] | Lighting | Δ [%] | Plug Load | Δ [%] | |||||
| 1976 | 500 | 6300 | 1100 | 300 | ||||||||
| 1979 | 400 | −20 | 2850 | −55 | 2600 | +136 | 200 | −33 | ||||
| 1991 | 800 | +100 | 1400 | −51 | 900 | −65 | 600 | +20 | ||||
| 2000 | 2200 | +175 | 2600 | +86 | 1300 | +44 | 300 | −50 | ||||
| 2010 | 3000 | +36 | 2400 | −8 | 1000 | −23 | 350 | +17 | ||||
| 2017 | 3900 | +30 | +680 | 2600 | +8 | −59 | 800 | −20 | −27 | 600 | +71 | +100 |
| Description | Symbol | Value |
|---|---|---|
| Job index | [ 1, 2, 3, 4, 5, 6, 7, 8, 9, 10, 11, 12, 13, 14, 15, 16, 17, 18, 19, 20, 21, 22, 23, 24, 25, 26, 27, 28, 29, 30 ] | |
| Job priority | [ 30, 29, 28, 27, 26, 25, 24, 23, 22, 21, 20, 19, 18, 17, 16, 15, 14, 13, 12, 11, 10, 9, 8, 7, 6, 5, 4, 3, 2, 1 ] | |
| Job processing duration | [ 9, 9, 9, 6, 3, 4, 8, 1, 3, 2, 5, 2, 9, 2, 2, 1, 4, 3, 4, 4, 1, 3, 8, 4, 4, 9, 5, 1, 9, 3 ] |
| Description | Symbol | Value |
|---|---|---|
| Setup completion time slot for each forklift | [ 0, 0, 0, 0, 0, 0, 0, 0, 0, 0 ] | |
| Initial state of charge of the on-board battery for each forklift | [ 10, 10, 10, 10, 10, 10, 10, 10, 10, 10 ] | |
| Final state of charge of the on-board battery for each forklift | [ 10, 10, 10, 10, 10, 10, 10, 10, 10, 10 ] | |
| Initial availability of a fully charged battery in charging stations | 1, , |
| Description | Symbol | Value |
|---|---|---|
| Fully charged battery capacity | 10 | |
| Minimum battery capacity | 1 | |
| Penalty unitary cost related to the job makespan | 1 | |
| Penalty unitary cost related to the job ordering | 1 | |
| Penalty unitary cost related to the battery recharging completion time | 1 | |
| Weighting factors of the objective function terms in the first-step optimization | , | 1/2, 1/2 in case I.a, scenario II and III 1, 0 in case I.b |
| Weighting factors of the objective function terms in the second-step optimization | 1/3, 1/3, 1/3 in case I.a, scenario II and III 1, 0, 0 in case I.b |
| Case I.a | Case I.b | Case II.a | Case II.b | |
|---|---|---|---|---|
| Makespan: | 34 | 35 | 24 | 24 |
| Recharging process completion time: | 44 | 46 | 34 | 33 |
| Normalized energy cost: | 69 | 77 | 74 | 67 |
© 2020 by the authors. Licensee MDPI, Basel, Switzerland. This article is an open access article distributed under the terms and conditions of the Creative Commons Attribution (CC BY) license (http://creativecommons.org/licenses/by/4.0/).
Share and Cite
Carli, R.; Dotoli, M.; Digiesi, S.; Facchini, F.; Mossa, G. Sustainable Scheduling of Material Handling Activities in Labor-Intensive Warehouses: A Decision and Control Model. Sustainability 2020, 12, 3111. https://doi.org/10.3390/su12083111
Carli R, Dotoli M, Digiesi S, Facchini F, Mossa G. Sustainable Scheduling of Material Handling Activities in Labor-Intensive Warehouses: A Decision and Control Model. Sustainability. 2020; 12(8):3111. https://doi.org/10.3390/su12083111
Chicago/Turabian StyleCarli, Raffaele, Mariagrazia Dotoli, Salvatore Digiesi, Francesco Facchini, and Giorgio Mossa. 2020. "Sustainable Scheduling of Material Handling Activities in Labor-Intensive Warehouses: A Decision and Control Model" Sustainability 12, no. 8: 3111. https://doi.org/10.3390/su12083111
APA StyleCarli, R., Dotoli, M., Digiesi, S., Facchini, F., & Mossa, G. (2020). Sustainable Scheduling of Material Handling Activities in Labor-Intensive Warehouses: A Decision and Control Model. Sustainability, 12(8), 3111. https://doi.org/10.3390/su12083111