Article

Anthropogenic Disturbances and Precipitation Affect Karst Sediment Discharge in the Nandong Underground River System in Yunnan, Southwest China

1
School of Environmental Studies, China University of Geosciences, Wuhan 430074, China
2
Institute of Karst Geology, Chinese Academy of Geological Sciences, Guilin 541004, China
3
Key Laboratory of Karst Ecosystem and Treatment of Rocky Desertification, Guilin 541004, China
4
Department of Sediment Research, China Institute of Water Resources and Hydropower Research, Beijing 100038, China
5
Guangxi Institute of Botany, Chinese Academy of Sciences, Guilin 541006, China
6
Guilin Meteorological Administration, Guilin 541001, China
7
Department of Physical Geography, University of Trier, 54296 Trier, Germany
8
Soil Erosion and Degradation Research Group, Department of Geography, Valencia University, Blasco Ibàñez, 28, 46010 Valencia, Spain
*
Author to whom correspondence should be addressed.
Sustainability 2020, 12(7), 3006; https://doi.org/10.3390/su12073006
Submission received: 7 January 2020 / Revised: 25 March 2020 / Accepted: 2 April 2020 / Published: 9 April 2020

Abstract

:
In fragile karst environments that have seen past and current human exploitation of agricultural and forest resources, the quantification of underground riverine sediment has been widely used to evaluate subterranean stream basin erosion. These measures are highly influenced by both precipitation and anthropogenic factors; therefore, soil erosion control measures must be urgently designed and applied. In this study, 17 years of sediment discharge across the Nandong underground river system in southwest China was monitored. To achieve this goal, the Mann–Kendal mutation test and proxy indicators were used to estimate the general influence of human activities and precipitation on sediment discharge. The results showed that: (1) Both anthropologic disturbance and rainfall have impacted the sediment discharge, although the influence of the anthropologic factor on sediment discharge was greater (61.53%), and (2) rainfall showed a hysteresis effect on sediment discharge. We obtained three different stages based on the mutation points and variation characteristics of the studied sediment discharge resulting from different driving forces, from 1998 to 2014. Prior to 2004, in the whole basin, the decrease of sediment yield was the result of the Natural Forest Protection Project. During the period from 2004 to 2008, due to continuous droughts, flood disasters, and intensive cultivation practices on the steeper hillslopes, the total sediment discharge of the whole basin increased. After 2009, the sediment discharge decreased due to the development of soil conservation projects and mushrooming reservoirs. These findings are expected to provide insights into watershed management and ecological restoration in fragile karst ecosystems, specifically, in southwestern Chinese river systems. More research must be conducted to monitor, with in situ measurements and observations, possible extreme events that can determine the exact erosion control measures that need to be designed and applied.

1. Introduction

Soil erosion has long been identified as an adverse geo-environmental hazard to both humans and the environment [1,2,3,4,5]. It is well known that the negative impacts of soil erosion, such as the losses of fertile soil and biodiversity, aggravate the effects of droughts, waterlogging, landslides, land subsidence, and other disasters if control measures, such as nature-based solutions or organic farming, etc. [6,7,8], are not applied efficiently. Soil erosion is, therefore, a serious threat to ecological security at the hillslope, regional, and even at the global scale as it directly affects the development, application, and protection of indispensable natural resources [9,10]. During the last few decades, it has been estimated that an increasing amount of land is being degraded and shows light to severe forms of soil erosion. These accelerated forms of soil erosion have become a widespread phenomenon, representing a major challenge to the achievement of sustainable development goals [11].
Karst ecosystems are some of the most severely-threatened ecosystems in the world due to the thin soil layer, which has been caused by erosion. In karst areas, the soil layer can have a thickness of ten to several centimeters, which can be easily washed away, leaving pure carbonate rock and causing karst rocky desertification [4]. Rocky desertification was defined by Jiang et al. [12] as a relatively less well-known process than desertification, referring to the “processes and human activities that transform a karst area covered by vegetation and soil into a rocky landscape.” These processes are common in the European Mediterranean and Dinaric Karst regions of the Balkan Peninsula, southwest China, and even in tropical rainforests such as Haiti and Barbados [13].
In contrast, a low silicate mineral content in carbonate rock results in a low soil formation rate. Previous studies showed that it required one- to three-quarters of a million years and a 25-m thickness of carbonate rocks to form just a 1-m soil layer in a typical karst ecosystem [14]. However, it is important to remark that, until recently, many authors believed there was no evidence that soil genesis on limestone could be possible due to the parent material, or at least that the parent material could represent a key factor in soil genesis [15]. While the conservation of water and soil is very important, such efforts are often restricted by the geology, gravitational (underground) erosion, and surface water erosion.
Conservation efforts also compete with economic developments, such as cultivation on steeper hillslopes and reservoir construction [16]. Furthermore, changes in rainfall regimes over the last 60 years (e.g., a reduction in the rainfall amount by 11.4 mm per decade) [17] can aggravate the rocky desertification processes in karst ecosystems. In the karst ecosystem of southwest China, for example, rocky desertification affects 24% of the total karst area [18] and negatively influences the life of 1.7 million people [19].
Southwest China has approximately 540,000 km2 of karst area, about 5.6% of its total land and 2.5% of all the 22 million km2 karst areas in the world. Previous studies indicated that more than 80% of the karst rocky desertification is located in southwest China, which registers the most varied areas of karst relief, including Yunnan, Guizhou, Guangdong, Chongqing, Hunan, Hubei, Sichuan, and the Guangxi Zhuang autonomous region [12]. These areas used to discharge, during the dry season, more than 1 × 10⁹ m3 of water to the Nandong underground river system (NURS), which covers an area of over 1000 km2 [20]. Furthermore, the NURS flows through a graben basin located at the industrial center of southeast Yunnan, which has experienced a tremendous change in land cover over the last few decades.
Land-use change, which has undoubtedly been induced by anthropogenic activities, has profound influences on water resources, such as runoff, sediment flux, and non-point pollutions over a range of temporal and spatial scales [21]. It is generally accepted that human activities and climate change are two active factors that significantly affect catchment hydrology, and the majority of previous studies evaluated the hydrological impacts according to scenario analysis and modelling studies [22,23]. However, their contributions to soil erosion are still not fully understood in karst underground river systems.
Sediment discharge is a reflection of soil erosion, and research on sediment discharge can provide feedback on the local soil erosion conditions. Based on long-time sediment discharge monitoring, precipitation, and land-use change datasets, the aims of this study were to analyze the contribution of anthropogenic activities and changes in precipitation regimes on sediment discharge in the Nandong underground river system using mutation tests and simple proxy indicators. To achieve these goals, we calculated the variations in rainfall and sediment concentration of the Nandong underground river system from 1998 to 2014 and determined the effect of anthropogenic activities and precipitation on sediment discharge during the application of ecological restoration.
We used the Universal Soil Loss Equation (USLE), which has been successfully used in other karst areas in China, applying some variations to adapt for specific factors for each basin or watershed [24,25]. We hypothesize that the results of this study could provide not only a scientific basis on the prevention of soil loss, but also technical support for the sustainable use of water and land in the graben basin and karst regions of southwest China that have been highly affected by intensive land-use changes.

2. Materials and Methods

2.1. Study Region

The Nandong underground river system covers the cities of Mengzi, Kaiyuan, and Gejiu (103°10′–103°42′ E, 23°10′–23°43′ N), and these are located in the Yunnan Province in China. This river system belongs to the Nan Pan river drainage in the Upper Pearl River basin and drains an area of approximately 1628 km2. The boundary of the NURS consists of a surface watershed, underground watershed, aquifuge, and faults. The underground river system emerges at the Nandongtai village, about 8 km from Kaiyuan County with an altitude of 1067 m a.s.l. at the southern end of Kaiyuan graben basin. Although there are subsystems in the NURS, water is discharged to the Nandong outlet. The whole underground river is about 75 km. The underlying bedrock of the basin is characterized by a parent material of Triassic carbonate rocks, overlying the sediment of the Tertiary or Quaternary period.
Due to the movement of the earth surface in the Tertiary period, there are 700-m elevation differences between the basin and the surrounding mountains, which consist of Gejiu and Yongningzhen formation limestones [26]. They have developed peak-cluster depressions, caves, sinkholes, shafts, and so on. During different field observations, we detected in these karst morphologies that they provide perfect natural channels for soil and water losses. Soil can be mobilized to underground channels with water, and discharged to the ground surface from the outlet of the Nandong underground river system (Figure 1).
The climate is primarily subtropical monsoonal with a mean annual precipitation of 834 mm and mean air temperature of 16.0 °C. The monsoonal climate results in a rainy season from June to September and a dry season from October to May. Due to its landform, the research area has a stereoscopic climate, resulting in the formation of the seasonal river (i.e., Shadian River). This river includes the Dazhuang, Zhadian, and Heishui branches, which dry up between March and April. The only perennial river is the Yangliu River located in the east mountain area of Mengzi. The system can be divided into the upper plateau zones (from the east to south mountain areas of the system), middle reach basin zones (deposition plain area of the system), and the lower hilly zones (in the north of the system).

2.2. Geological Conditions and Soil Properties

The Nandong underground river system is located in the southwest part of the Kang-Dian rhombus plate, which is crossed by north-west and north-south fault zones. So, mountain and basin areas coexist in the NURS. The outcrop stratum includes a wide range of Cambrian, Devonian, Carboniferous, Permian, Triassic, Tertiary, and Quaternary materials with a total approximate thickness of 11,176 m [27]. Mesozoic stratum is widely distributed in the study region with a lithology characterized by calcareous and silty shales, argillaceous limestone, fine siltstone, medium-thick massive limestones, dolomite, and dolomitic ones. Gejiu (T2g) and Yongningzhen geological formation (T1y) are the main strata of karst development in this study area. The composition and structure of the rocks are key factors affecting the weathering velocity of the carbonate rocks. The mean average values of the CaO, MgO, Fe2O3, SiO2, and Al2O3 contents in the T2g strata are 41.8%, 10.0%, 0.5%, 0.3%, and 3.3%, respectively. On the other hand, the average CaO, MgO, Fe2O3, SiO2, and Al2O3 contents in the T1y strata are 48.7%, 1.2%, 1.1%, 2.8%, and 5.3%, respectively. The content of acid-insoluble is low, which results in the slow weathering rate.
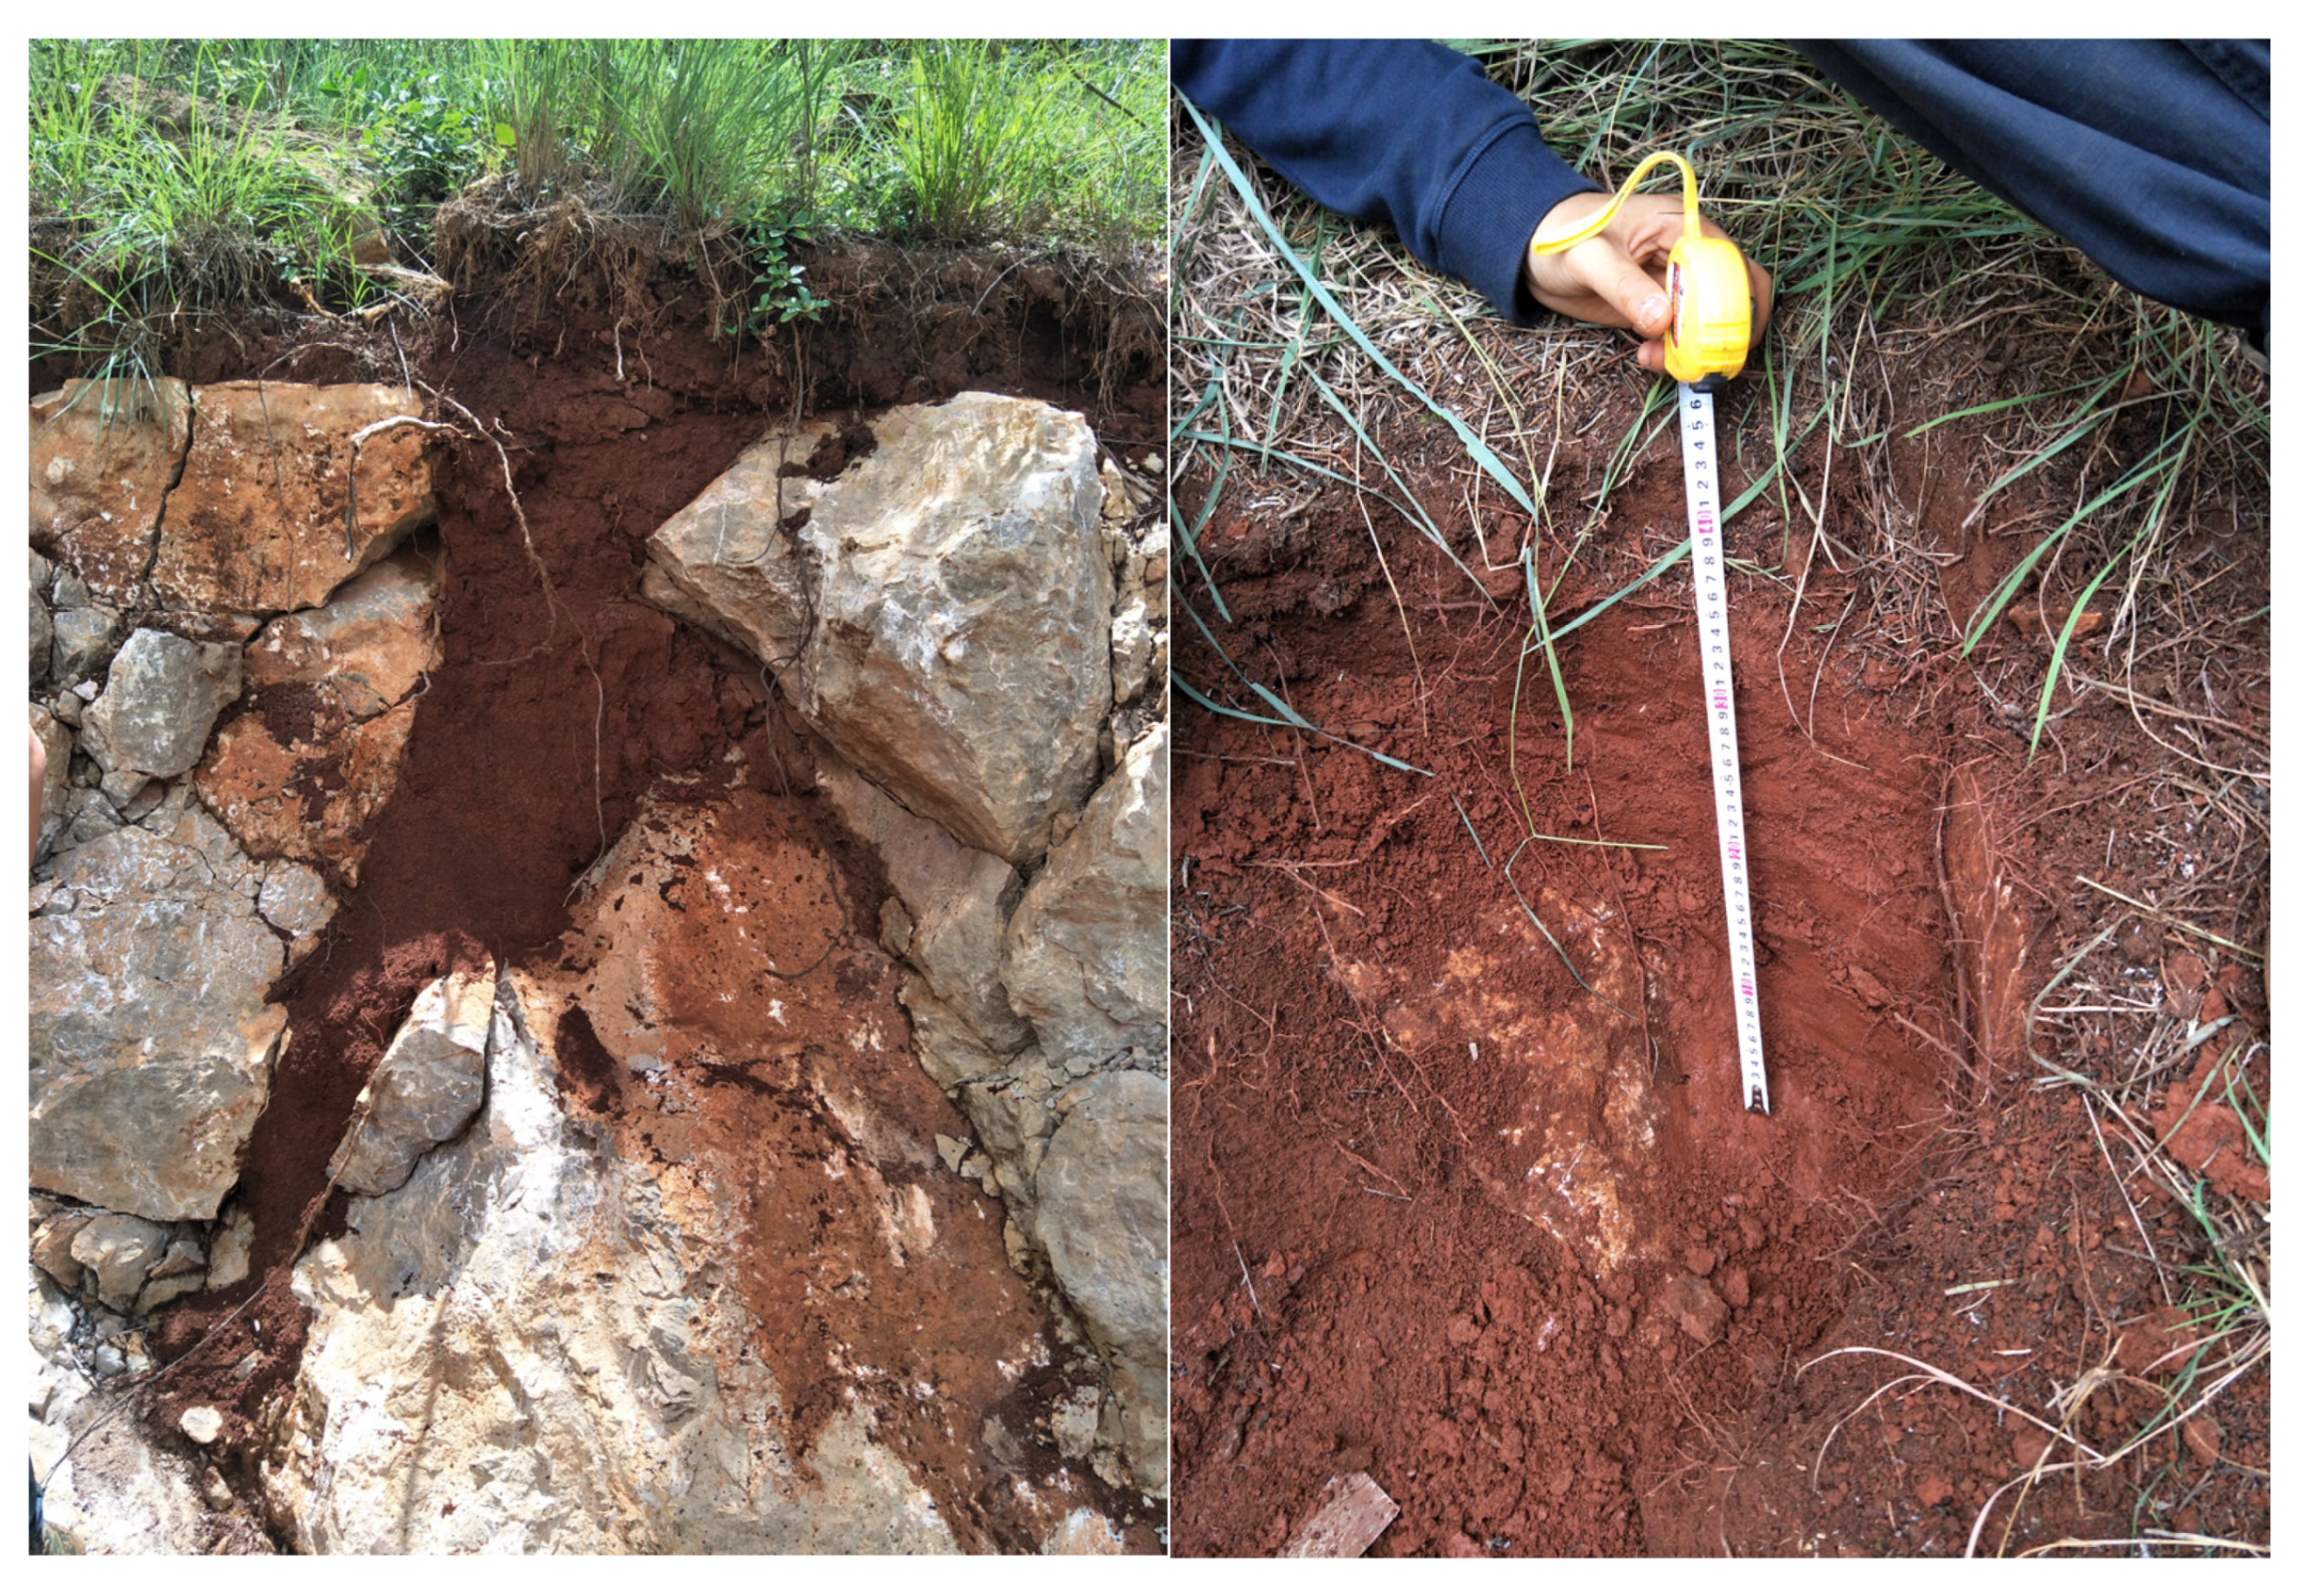
Soils in the main recharge area of the NURS are limestone soils characterized by high viscosity. The contents of clay (<2μm), silt (2–50 μm) and sand (50–2000 μm) are 30.5%, 50.6%, and 18.9%, respectively. The soil pH is neutral and, in some points, slightly alkaline. The soil layers are generally thin and scattered, and are difficult to recover once the soil is lost. The soil generally lacks layer C (Figure 2), and layer B is directly connected with the carbonate rock. The affinity and adhesion between the rock and soil are very poor; subsequently, they are unstable. Induced by rainfall, the soil is prone to creep along the rock surface.

2.3. Sediment Discharge Estimations

Water flows to the surface ground from the karst cave, and then into the surface river. Samples were collected using plastic bottles in the Nandong outlet of the underground river every day from 1998 to 2014. The samples were immediately transported into the laboratory. Sediment concentration was obtained using the traditional drying method by filtering the sediments from the collected water samples. First, we dried the filter paper and obtained the weight (m1). Then, we filtered the sediment of the filter paper and dried this (105 °C) in an oven to obtain the total weight (m2). The difference between m2 and m1 was the concentration of the suspended sediment. To know the sediment discharge variation, we analyzed the monthly and annual data of the sediment discharge. The water discharge of the underground river was measured by a propeller velocity meter. The data of the sediment yield were obtained from the Yunnan Provincial Hydrology and Water Resources Bureau.

2.4. Land-Use Change

We used remote sensing images over the last three decades (1995, 2005, and 2015) to find the data on land-use change. Based on Landsat 8 remote sensing images, the artificial visual interpretation method was used in ArcMap software. The data set was provided by the Data Center for Resources and Environmental Sciences, Chinese Academy of Sciences (RESDC). The land-use types were categorized as cultivated land, forestland, grassland, water bodies, and urban areas, based on Jiang et al. [28].

2.5. Statistical Analysis

2.5.1. Rainfall and Rainfall Erosivity

We obtained the daily rainfall data from 1998 to 2014 from the Honghe Prefecture Meteorological Bureau. Our research area was large, and one single station could not represent the rainfall situation of the whole area. Thus, we selected the rainfall data of the Mengzi, Kaiyuan, and Gejiu stations, and used the Tessellation polygon method to extend the coverage to the whole research area [29].
The rainfall erosivity model was selected based on suitability analysis as commonly used in southern China. In this study, a simple estimation model of daily rainfall was proposed by Zhang et al. [30], which has been widely used by other scholars under similar conditions [31]. The formula was as follows:
M i = α j = 1 k ( D j ) β .
Mi is the value of rainfall erosivity in the i half month (MJ·mm·hm−2·y−1); α and β are model parameters; k is the number of days in the half-month period; and Dj represents the daily rainfall on the j day of the half-month period, if the rainfall is more than the erosive rainfall standard. Otherwise, it is calculated as zero; parameters α and β reflect the regional rainfall characteristics, which are calculated as follows:
β = 0.8363 + 18.144 / P d + 24.455 / P y
α = 21.586 β 7.1891 .
Pd is the average daily rainfall that is higher than the erosive rainfall standard. Py is the annual average rainfall with day rainfall higher than the erosive rainfall standard. In our study region, the erosive rainfall standard was 10 mm.

2.5.2. Variability of Sediment Concentration

The Mann–Kendal test (M-K) is a non-parametric test method widely used for type variables and order variables. When researching mutations, the Mann–Kendal test not only clarifies the time of mutation but also detects the area where the mutation occurs. To conduct the Mann–Kendal test, we used the following S statistics for verification purposes [32]:
S = i = 1 n 1 j = i + 1 n s g n ( x j x i )
s g n = { 1 , θ > 0 0 , θ = 0 1 , θ < 0 .
The mean and variance of the statistic S are:
E ( S ) = 0
v a r s = [ n ( n 1 ) ( 2 n + 5 ) i = 1 n t i i ( j 1 ) ( 2 i + 5 ) ] 18
where t i represents the number of data that appear i times in the sequence. Finally, the Kendall test statistic Z can be obtained, which satisfies the standard normal distribution, and the calculation is as follows:
Z = { S 1 v a r ( s ) 1 2 , S > 0 0 , S = 0 S + 1 v a r ( s ) 1 2 , S < 0 .
If Z > 0, this indicates that the sequence has an upward trend. If Z < 0, this indicates that the sequence has a downward trend. If Z = 0, this indicates that the sequence has no trend. For any given significance level α, if | Z | Z α / 2 , then there is a significant change in the sequence; otherwise, the variation trend is not significant.
For a stochastic stationary independent time series: X1, X2, …, Xn, mi represents the cumulative number of the ith sample. If Xi is greater than Xj, then
S k = i = 1 k r i , 2 k n
r i = { 1 , x i x j     0 , x i x j               j = 1 , 2 , 3 n .
The mean and variance of Sk are:
E ( S k ) = 1 4 n ( n 1 )
v a r ( S k ) = n ( n 1 ) ( 2 n + 5 ) 72
U F k = U B k = S k E ( S k ) v a r ( S k ) 1 2 , k = n + 1 k .
The UF(k) and UB(k) curves can be used to test the year and trend of the sequence mutation. If UF(k) and UB(k) intersect and the intersection is within the critical line, the intersection time is the specific year. If UF(k) > UB(k), the sequence is on the rise, and vice versa. When UF(k) exceeds the critical line, the trend is significant. The range exceeding the critical line is determined as the time zone in which the mutation occurs. If there is an intersection point between UF(k) and UB(k), and the intersection point is between the critical lines, then the moment corresponding to the intersection point is the moment when the mutation starts.

2.5.3. Anthropogenic Index

According to the equation of USLE (universal soil loss equation) [33]:
A = R × K × L × S × C × P.
The factors of influencing erosion and sediment yield were rainfall erosivity (R), soil erodibility (K), slope length (L), slope (S), vegetation coverage (C), and management measures (P). K is determined by the soil properties, which have nothing to do with anthropogenic activities and will remain invariant for a long time. If no anthropogenic activities are affecting the hillslopes by the terrace and transforming the micro-topography, the K and S will also remain invariant. However, with the development of soil and water conservation, the K and S can be classified into anthropogenic activity factors. L, S, C, and P are closely related to anthropogenic activities. The anthropogenic activity factors are summarized as E. Wei and He [34] obtained the formula for the contribution of rainfall and anthropogenic activities to sediment discharge using the following equations:
A = k × R × E
ΔA = k × (ΔE × R2 + ΔR × E1)
ω r = k × Δ R × E 1 k × Δ E × R 2 + k × Δ R × E 1 × 100 % = Δ R × E 1 Δ E × R 2 + Δ R × E 1 × 100 %
ω e = k × Δ E × R 2 k × Δ R × E 1 + k × Δ E × R 2 × 100 % = Δ E × R 2 Δ R × E 1 + Δ E × R 2 × 100 % .
k is the constant term, which refers to the factor that is unchangeable for a long time, E is the index of human activity, R represents the rainfall erosivity, ω r is the contribution ratio of rainfall, and represents the contribution ratio of human activity. If the mathematical notations of ΔA and ΔR are the same, the rainfall plays an important part in the change of sediment. If ΔA and ΔR have different notations, the sediment change should be analyzed according to the current situation and land-use change. If the increase of rainfall erosivity has no obvious effect on sediment, the human activity of water and soil conservation played an important positive effect.

2.5.4. Double Cumulative Curve Method

The double accumulation curve method is the usual method to test the consistency and change of the relationship between two parameters [35]. It can be used to analyze the trend change and the intensity of specific hydro-meteorological events. The double cumulative curve of runoff/sediment discharge and rainfall can be used to analyze whether human activities caused the trend change of sediment discharge (or river runoff), and then to analyze the year of a trend change. The basic principle is to observe the change process of the slope of the straight line. If the slope of the straight line does not deviate significantly, this indicates that human activities had no significant impact on the sediment discharge or river runoff. Otherwise, this indicates that human activities have a significant trend impact.

2.5.5. Correlation Analysis

To understand the correlation between the sediment discharge and individual rainfall, we chose part of the daily data to analyze the linear correlation (Pearson) between the rainfall and sediment discharge using SPSS Statistics 22.0 (IBM, USA).

3. Results

3.1. Sediment Concentration Changes in the NURS between 1998 and 2014

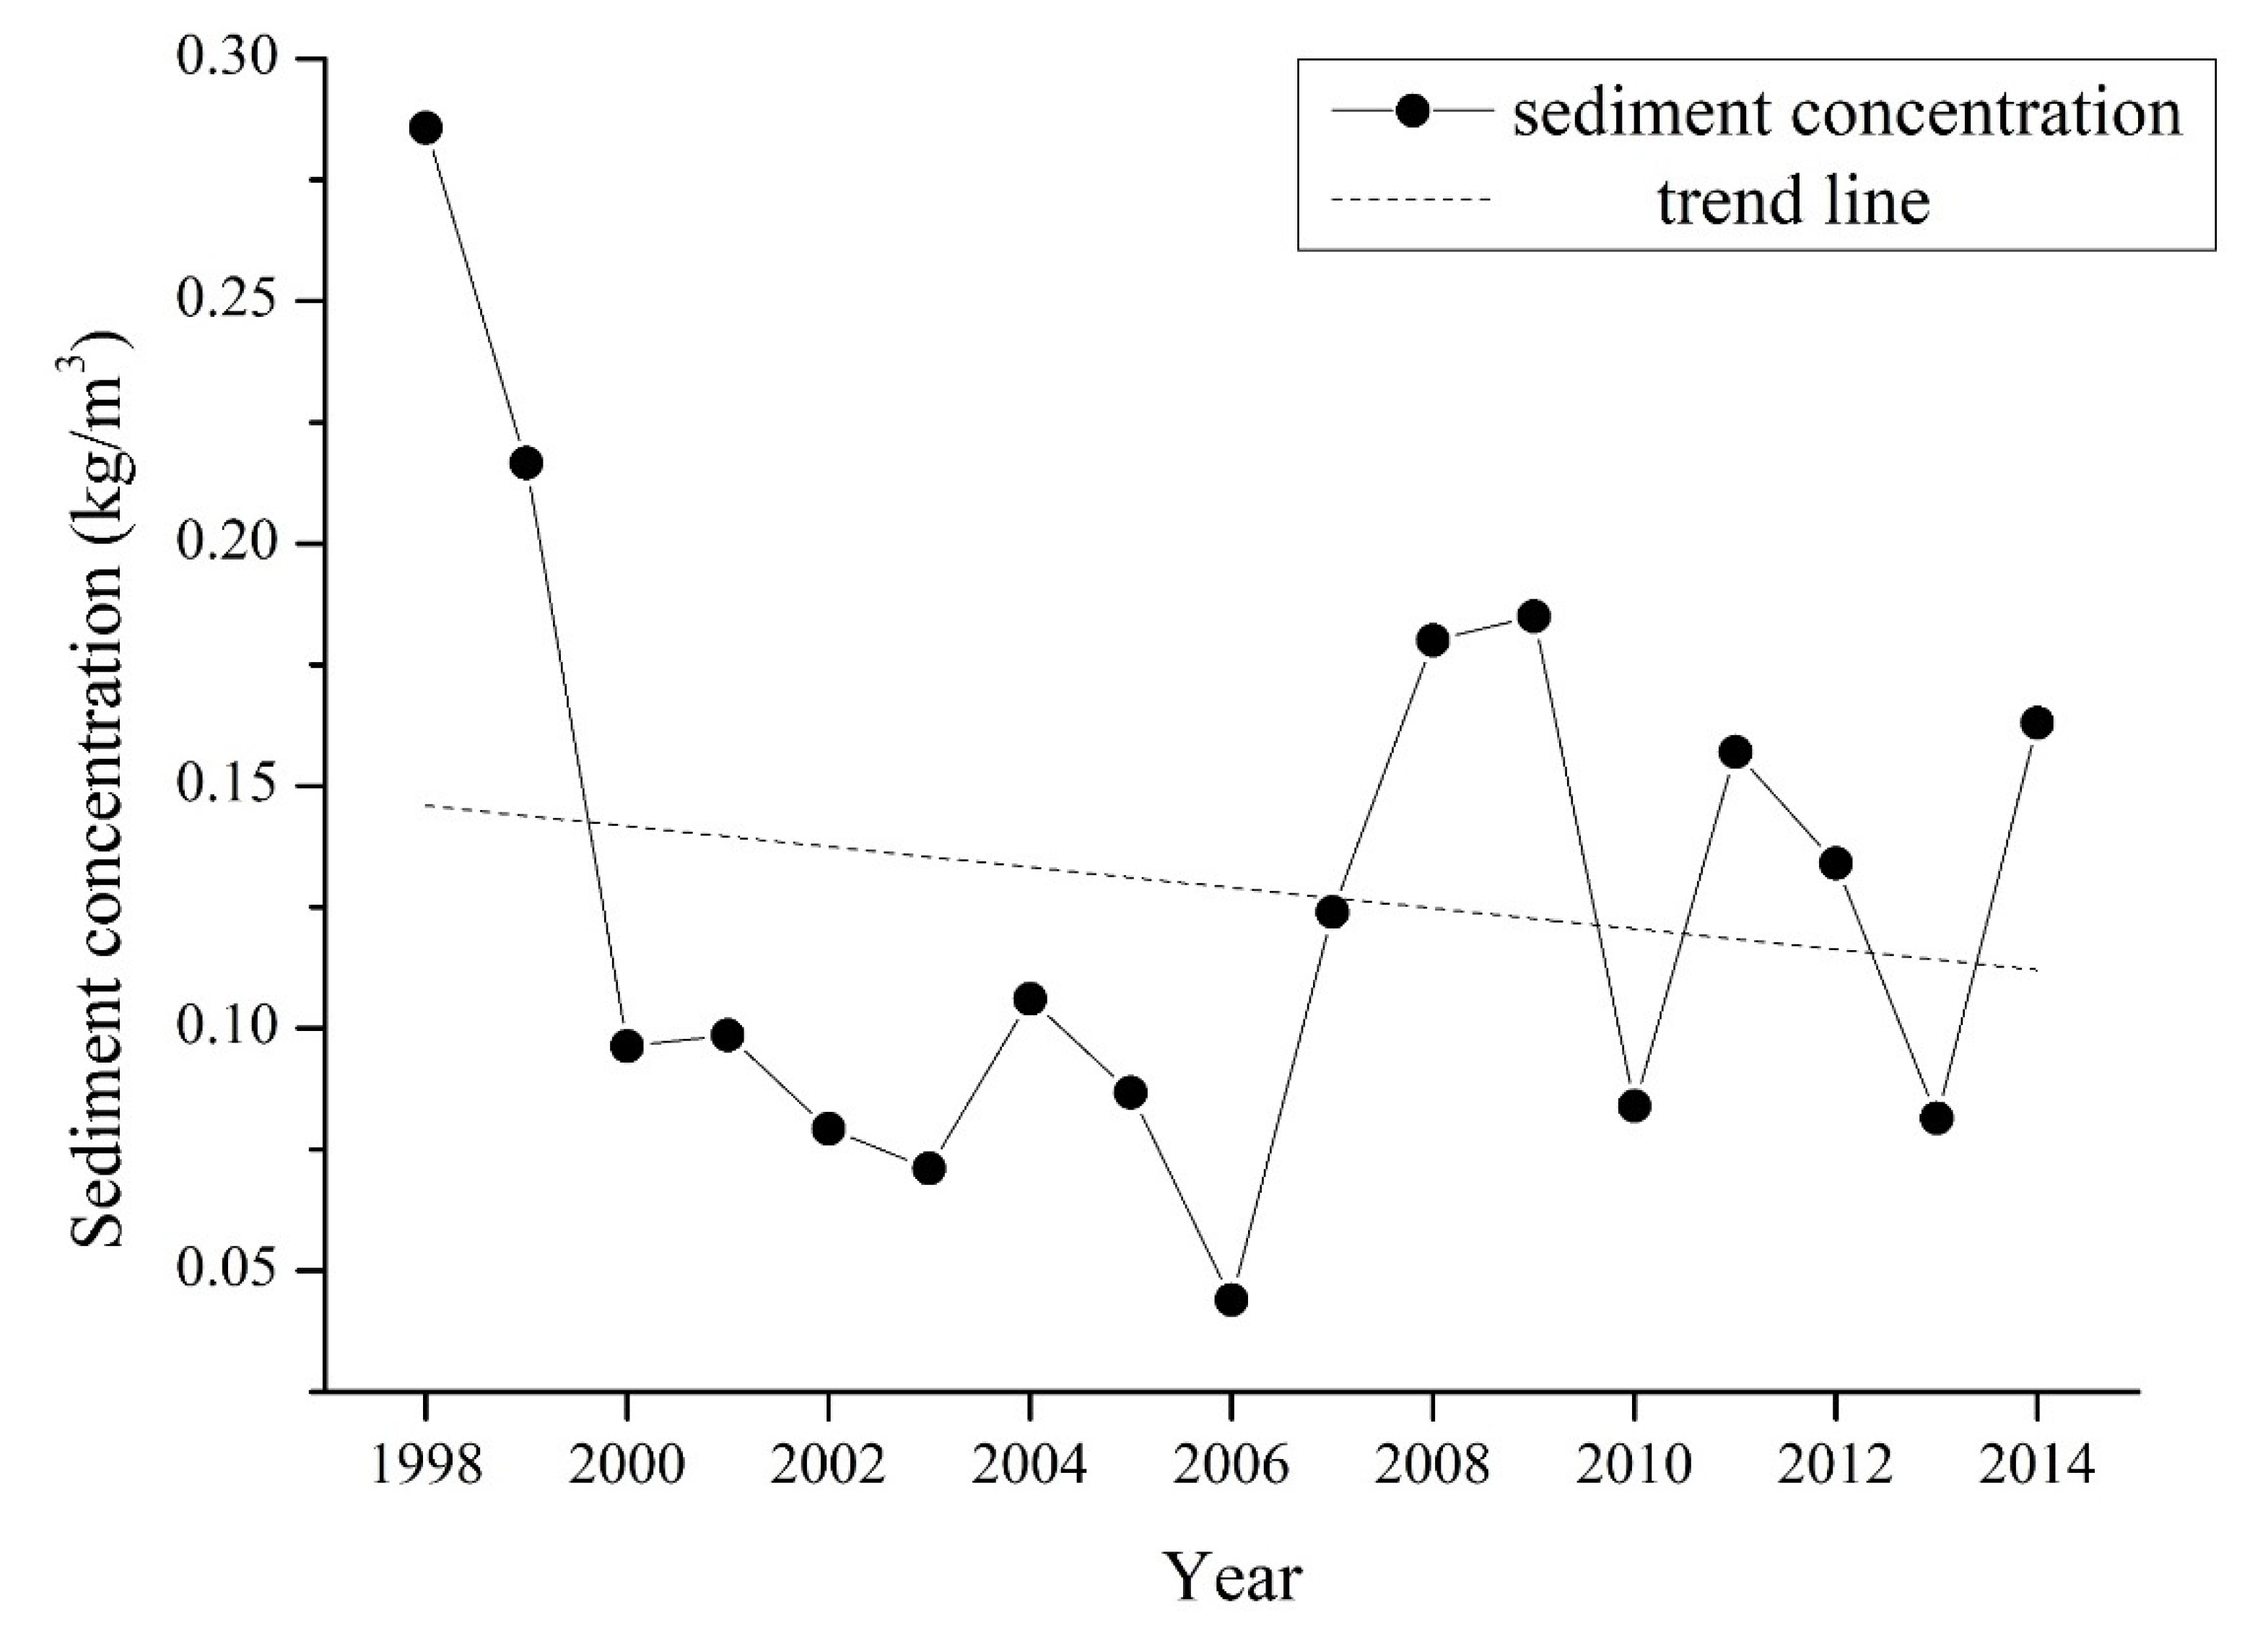
The annual average sediment concentration in the NURS between 1998 and 2014 was 0.13 kg/m3. The maximum value reached 0.29 kg/m3 in 1998 and the minimum value was 0.044 kg/m3 in 2006. The sediment concentration varied greatly, with the maximum value being 6.59 times higher than the minimum. According to the discharge of the underground river and sediment concentration, the annual average sediment discharge totaled 3.29 million tons with the maximum value being 10.17 times higher than the minimum. The maximum value was 8.83 million tons in 1998 and the minimum value was 0.87 million tons in 2006. Most erosion occurred from June to September (the maximum value was 0.817 kg/m3 in July). However, it was lower in April and May, in which the minimum value was found (0.005 kg/m3 in May).
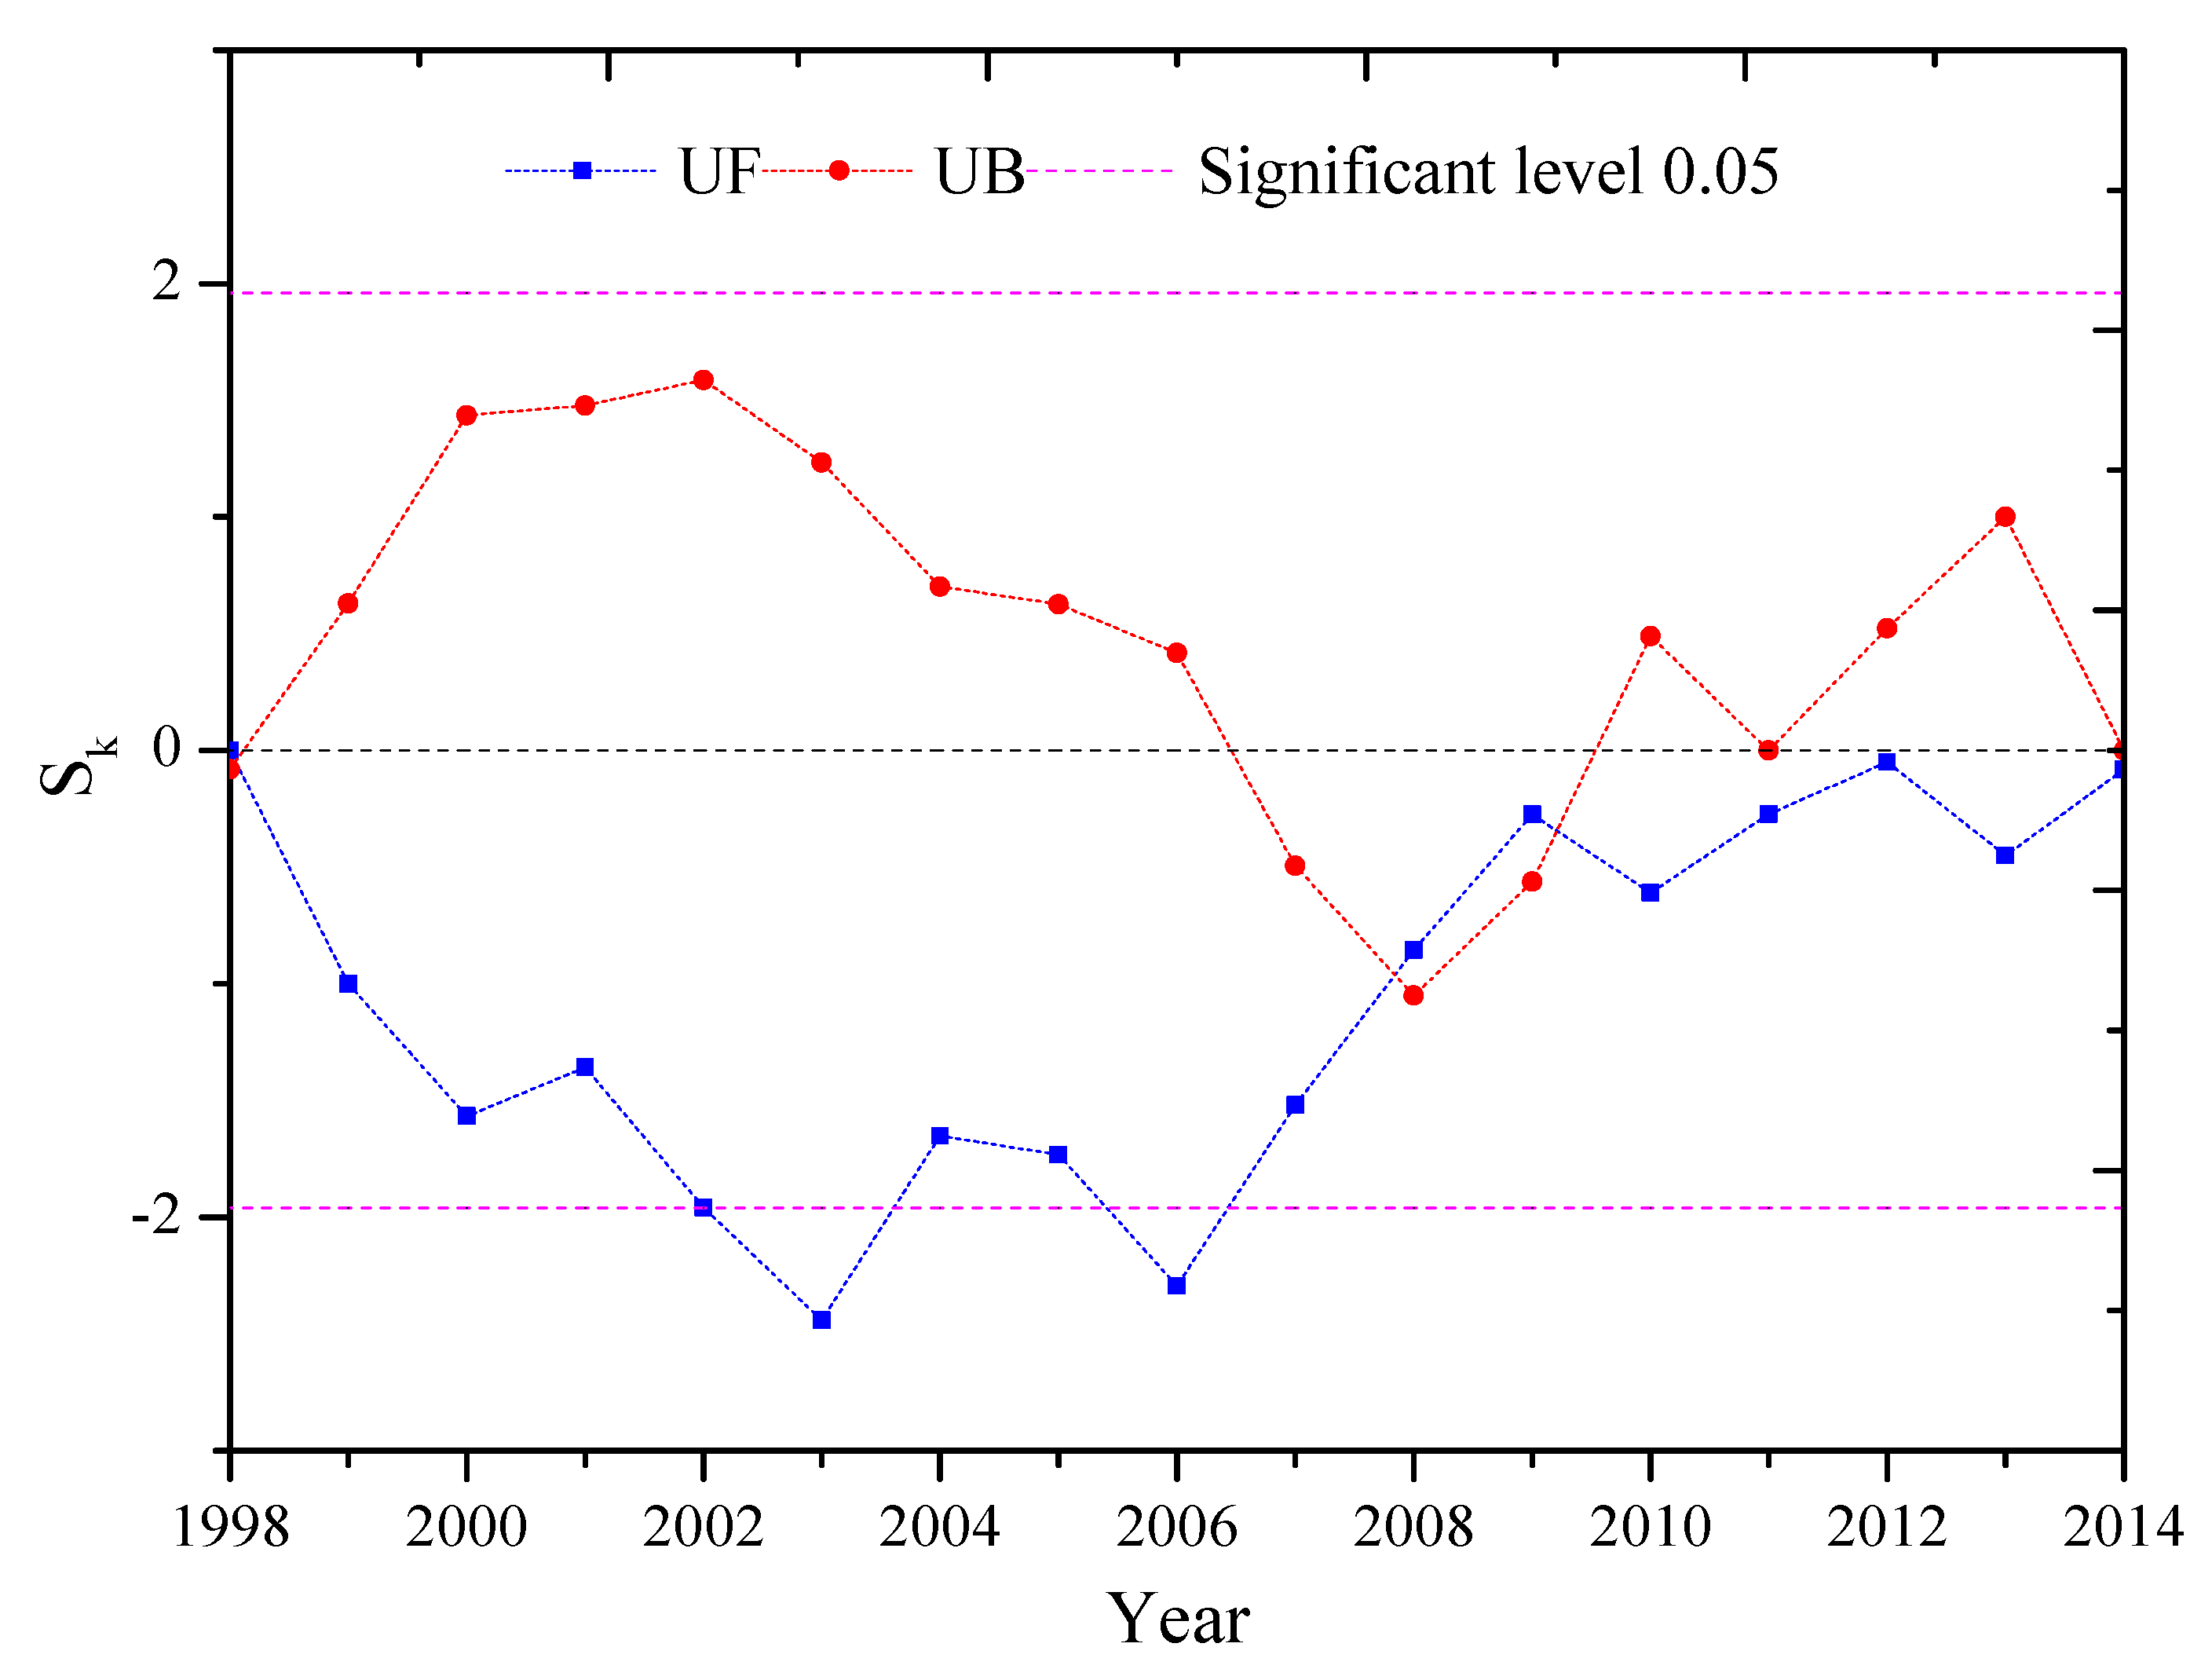
The trend analysis of sediment discharge was carried out by the M-K trend analysis and 95% confidence was used for the significance test. The test result showed that the annual sediment discharge decreased between 1998 and 2004, but increased from 2005 to 2008. After that, the average sediment concentration fluctuated (Figure 3). Our results showed that UF (test statistic of positive sequence) and UB (test statistic of reverse sequence) had three different intersections: in 1998, 2008, and 2009, indicating that the sediment discharge underwent three mutations in these years. Based on these intersections and the sediment discharge variation tendency between 1998 and 2014, there were three distinct trends: decrease (1998–2003), increase (2004–2008), and fluctuating (2009–2014) (Figure 4).

3.2. Variation of Annual Rainfall in the NURS

According to the rainfall data of multiple stations in addition to the Thiessen Polygon Method, the annual average rainfall was 834.5 mm, and most of this was concentrated from May to September. July was the month in which the average rainfall was the highest (171.8 mm); meanwhile, February was the month in which the average rainfall was the lowest (17.4 mm). The variation coefficient of the annual rainfall erosivity was 0.31 with a moderate annual variation. The range of rainfall erosivity was between 1074.64 and 3405.19 MJ·mm·hm−2·h−1·y−1. We observed a relatively high rainfall erosivity in 1998, which coincided with high precipitation events. In contrast, drought was responsible for a low rainfall erosivity in 2010. The rainy season occupied a large proportion (> 75%) of the erosivity force in most years, except in 2006 (49.8%).
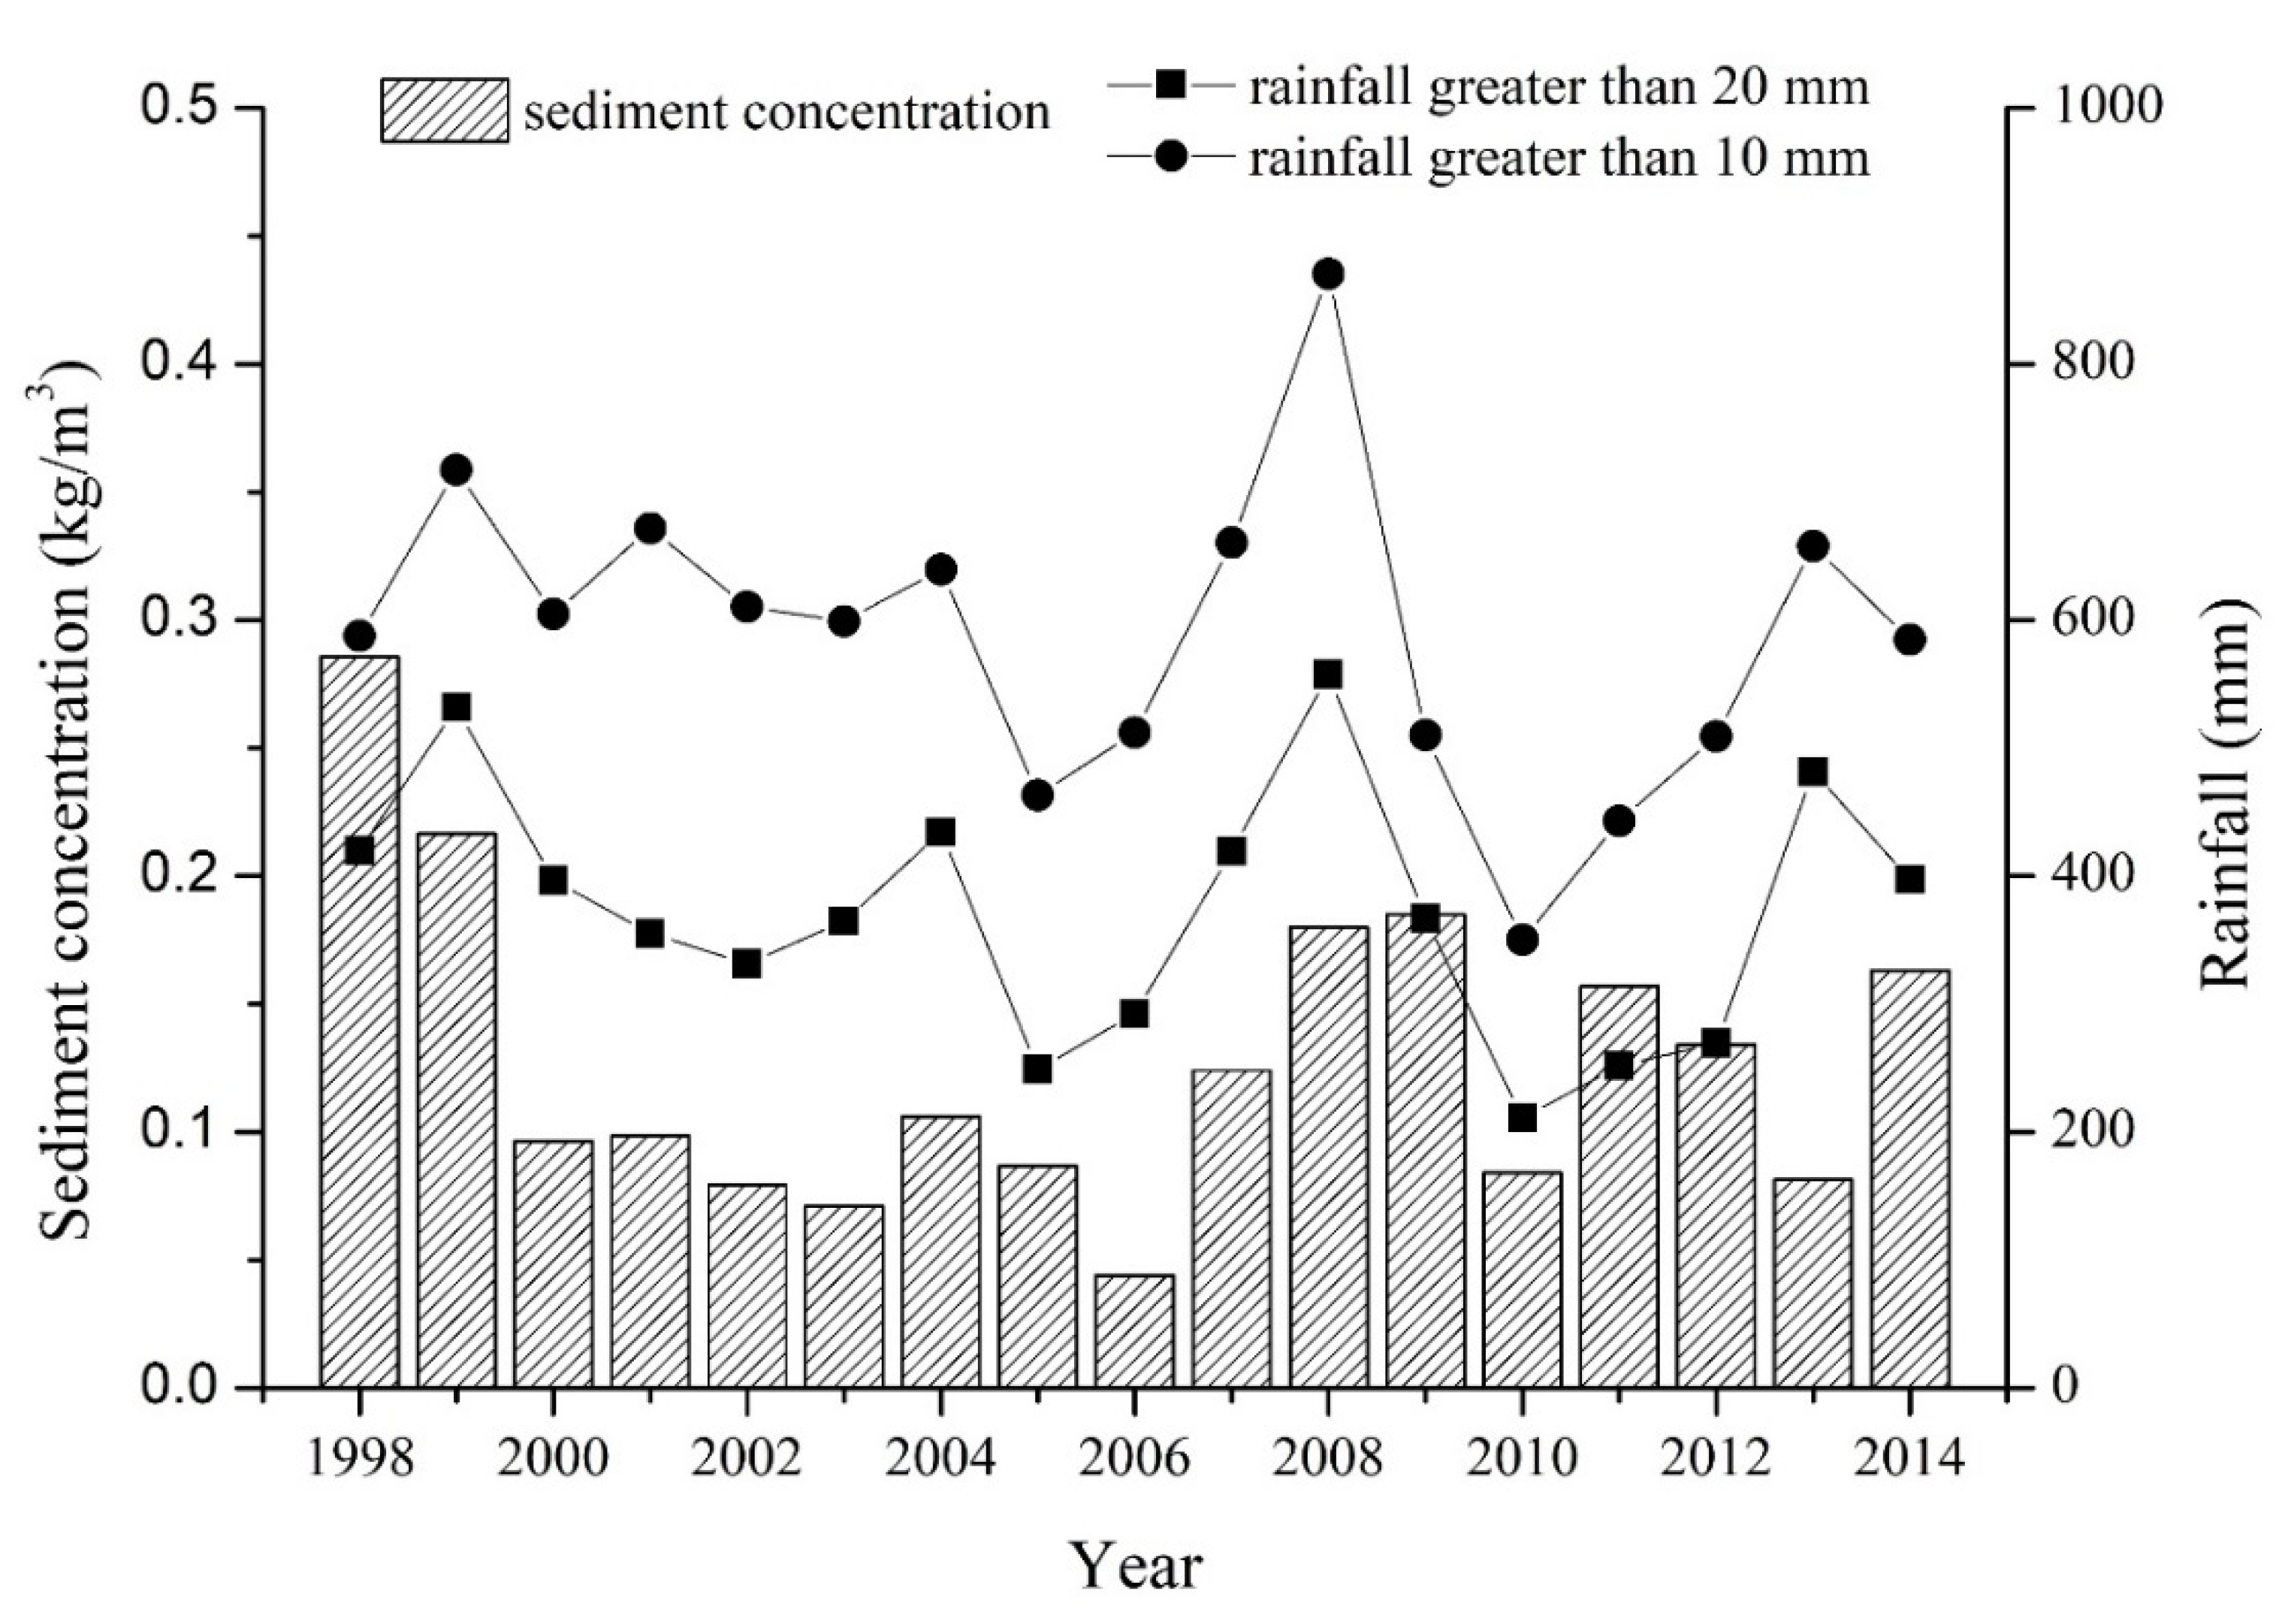
We chose 10-mm and 20-mm rainfall events as the threshold for analyzing this dataset. The day numbers of rainfall higher than 10 mm varied from 17 to 40 in different years. The maximum repetitions were registered in 2008, when the total rainfall was higher than 10 mm (870.5 mm). The lowest values were recorded in 2010, with a rainfall higher than 10 mm, reaching 350.2 mm. The daily numbers of rainfall higher than 20 mm varied from 7 to 17. On the other hand, the total rainfalls higher than 20 mm varied from 210.8 to 557.8 mm.

3.3. The Influence of Human Activities on Sediment Discharge

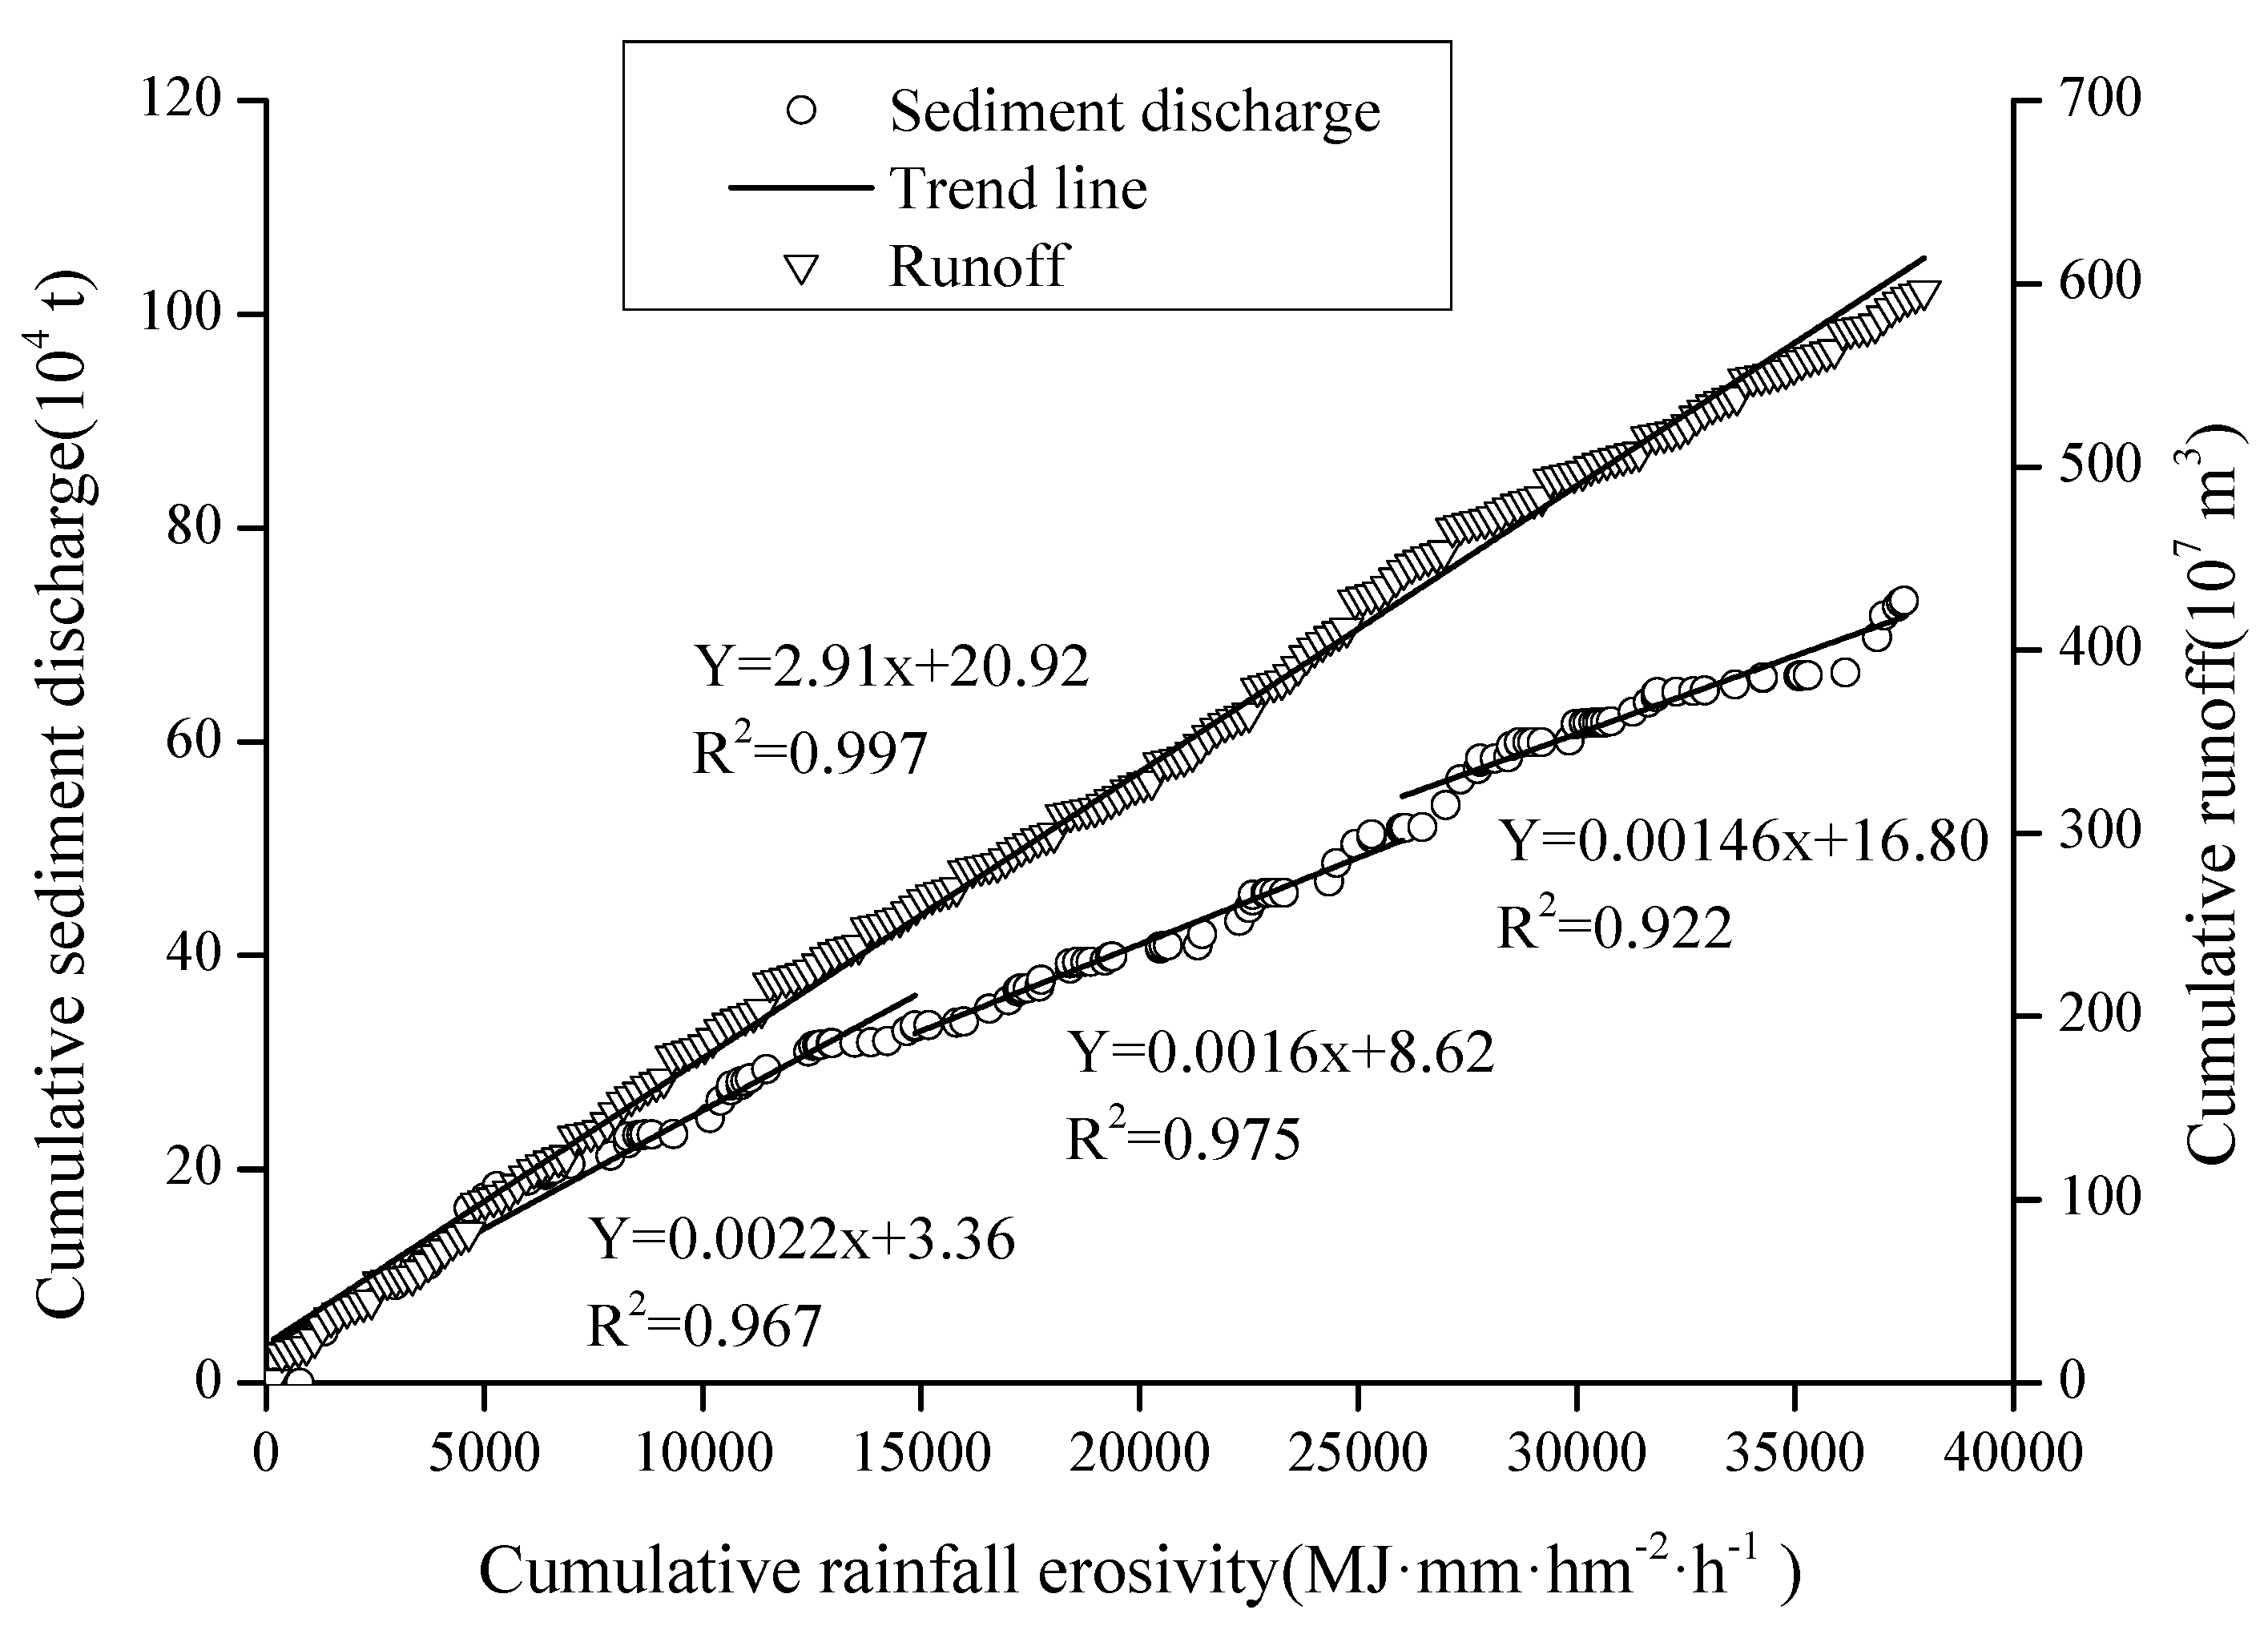
The double mass curves of the rainfall erosivity, sediment discharge, and runoff along with the linear regression lines are shown in Figure 5. The relationships between the cumulative rainfall erosivity and cumulative runoff are expressed with one straight line. The double mass curves exhibited the best fit between the rainfall erosivity and runoff (R2 = 0.997). This result indicated that the runoff was almost influenced by rainfall erosivity variability. Unlike runoff, the double mass curves showed the change points for the sediment discharge, which indicated that sediment discharge variations were not only affected by rainfall but also by human activities. Using the above M-K method and actual sediment discharge, we divided the data into three periods of sediment discharge (1998–2003, 2004–2008, and 2009–2014). The cumulative rainfall erosivity and sediment discharge in the different periods were fitted linearly, and the R2 were 0.967, 0.975, and 0.922, respectively. The slope of the three sections changed distinctly, which indicated that the human activities played a certain impact on the sediment discharge.

3.4. Anthropogenic Index and Land-Use Changes

According to sediment discharge variation and intersections, we quantitatively analyzed the anthropogenic influence of sediment changes during pre- and post-intersections. Rainfall and human activity affected the sediment discharge in the NURS, but the degrees were different. From 1998 to 2003, the annual sediment discharge decreased by 87.3%, from 8.8 to 1.7 million tons. At the same time, the annual rainfall erosivity also decreased from 3405.19 to 2168.34 MJ·mm·hm−2·h−1·y−1, and the anthropogenic index decreased by 25.92 to 7.67 units. The decrease of sediment discharge was mainly caused by an increase in human activity, with a 55.24% contribution rate. From 2004 to 2008, the annual sediment discharge increased from 2.41 to 6.02 million tons, the annual rainfall erosivity increased by 2395.93 to 3126.53 MJ·mm·hm−2·h−1·y−1, and the anthropogenic index increased by 10.07 to 19.27 units. The increase of the sediment discharge in this stage was the result of negative human activity development, with a 74.24% contribution rate. From 2009 to 2014, the annual sediment discharge decreased from 5.30 to 1.37 million tons, the annual rainfall erosivity decreased by 1789.9 to 1449.26 MJ·mm·hm−2·h−1·y−1, and the anthropogenic index decreased by 29.59 to 21.05 units. Based on the calculation, the contribution rate of human activity for the sediment discharge variation was about 55.11%, meanwhile, the rainfall contribution rate was up to 44.89% (Table 1).
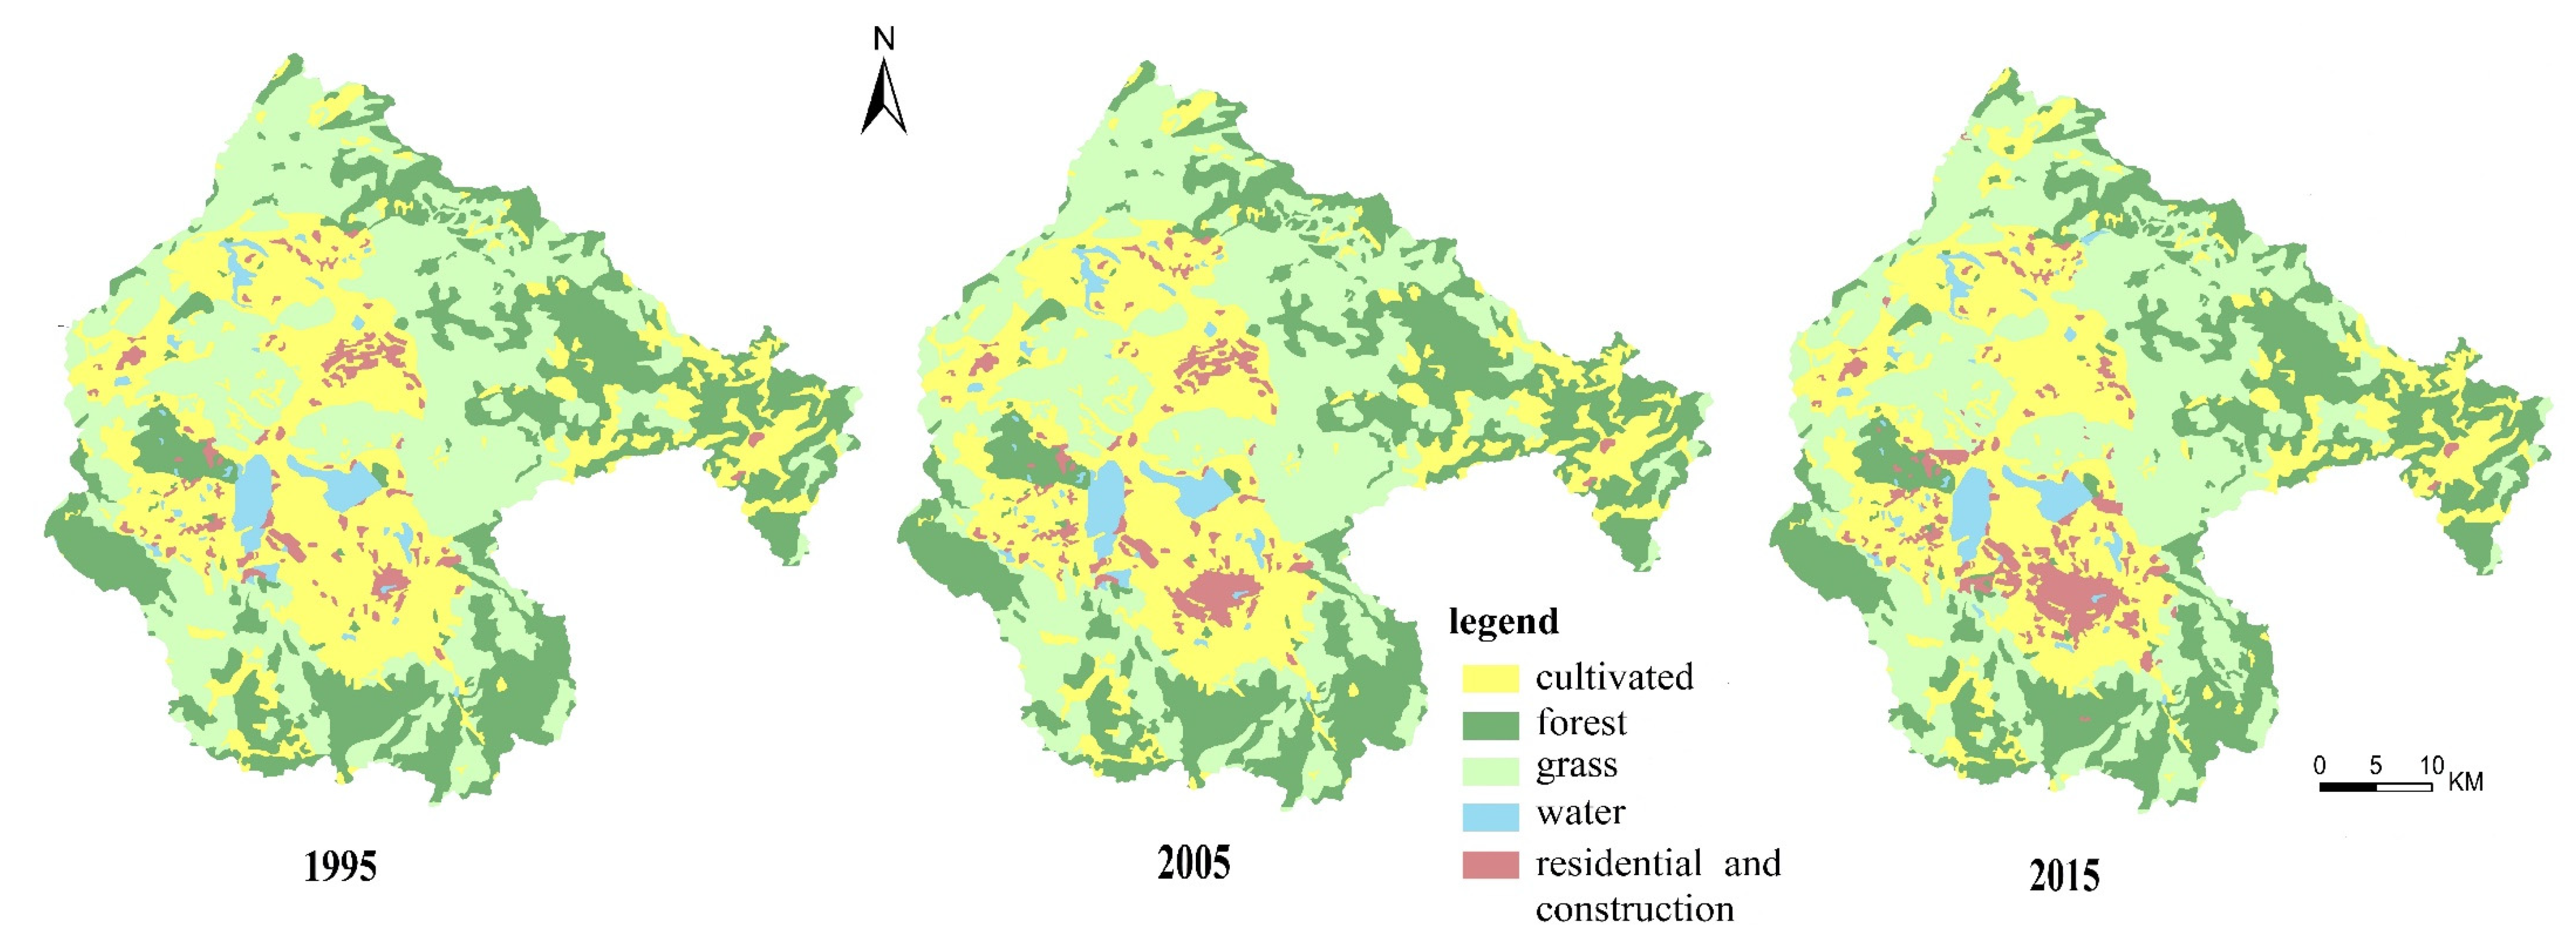
According to the land-use map between 1995 and 2005, land conversion generated a decrease in cultivated land, but an increase in residential and construction areas. At the same time, there was a slight increase in the forests and grassland. Most changes occurred from 2005 to 2015, where the forests, grasslands, and cultivated fields showed different degrees of decreasing trends, as opposed to increasing the waterbody areas. The increase of residential house and construction lands to 32% demonstrated a significant increase in human activity (Figure 6, Table 2).

4. Discussion

4.1. Correlation between the Rainfall and Sediment Discharge

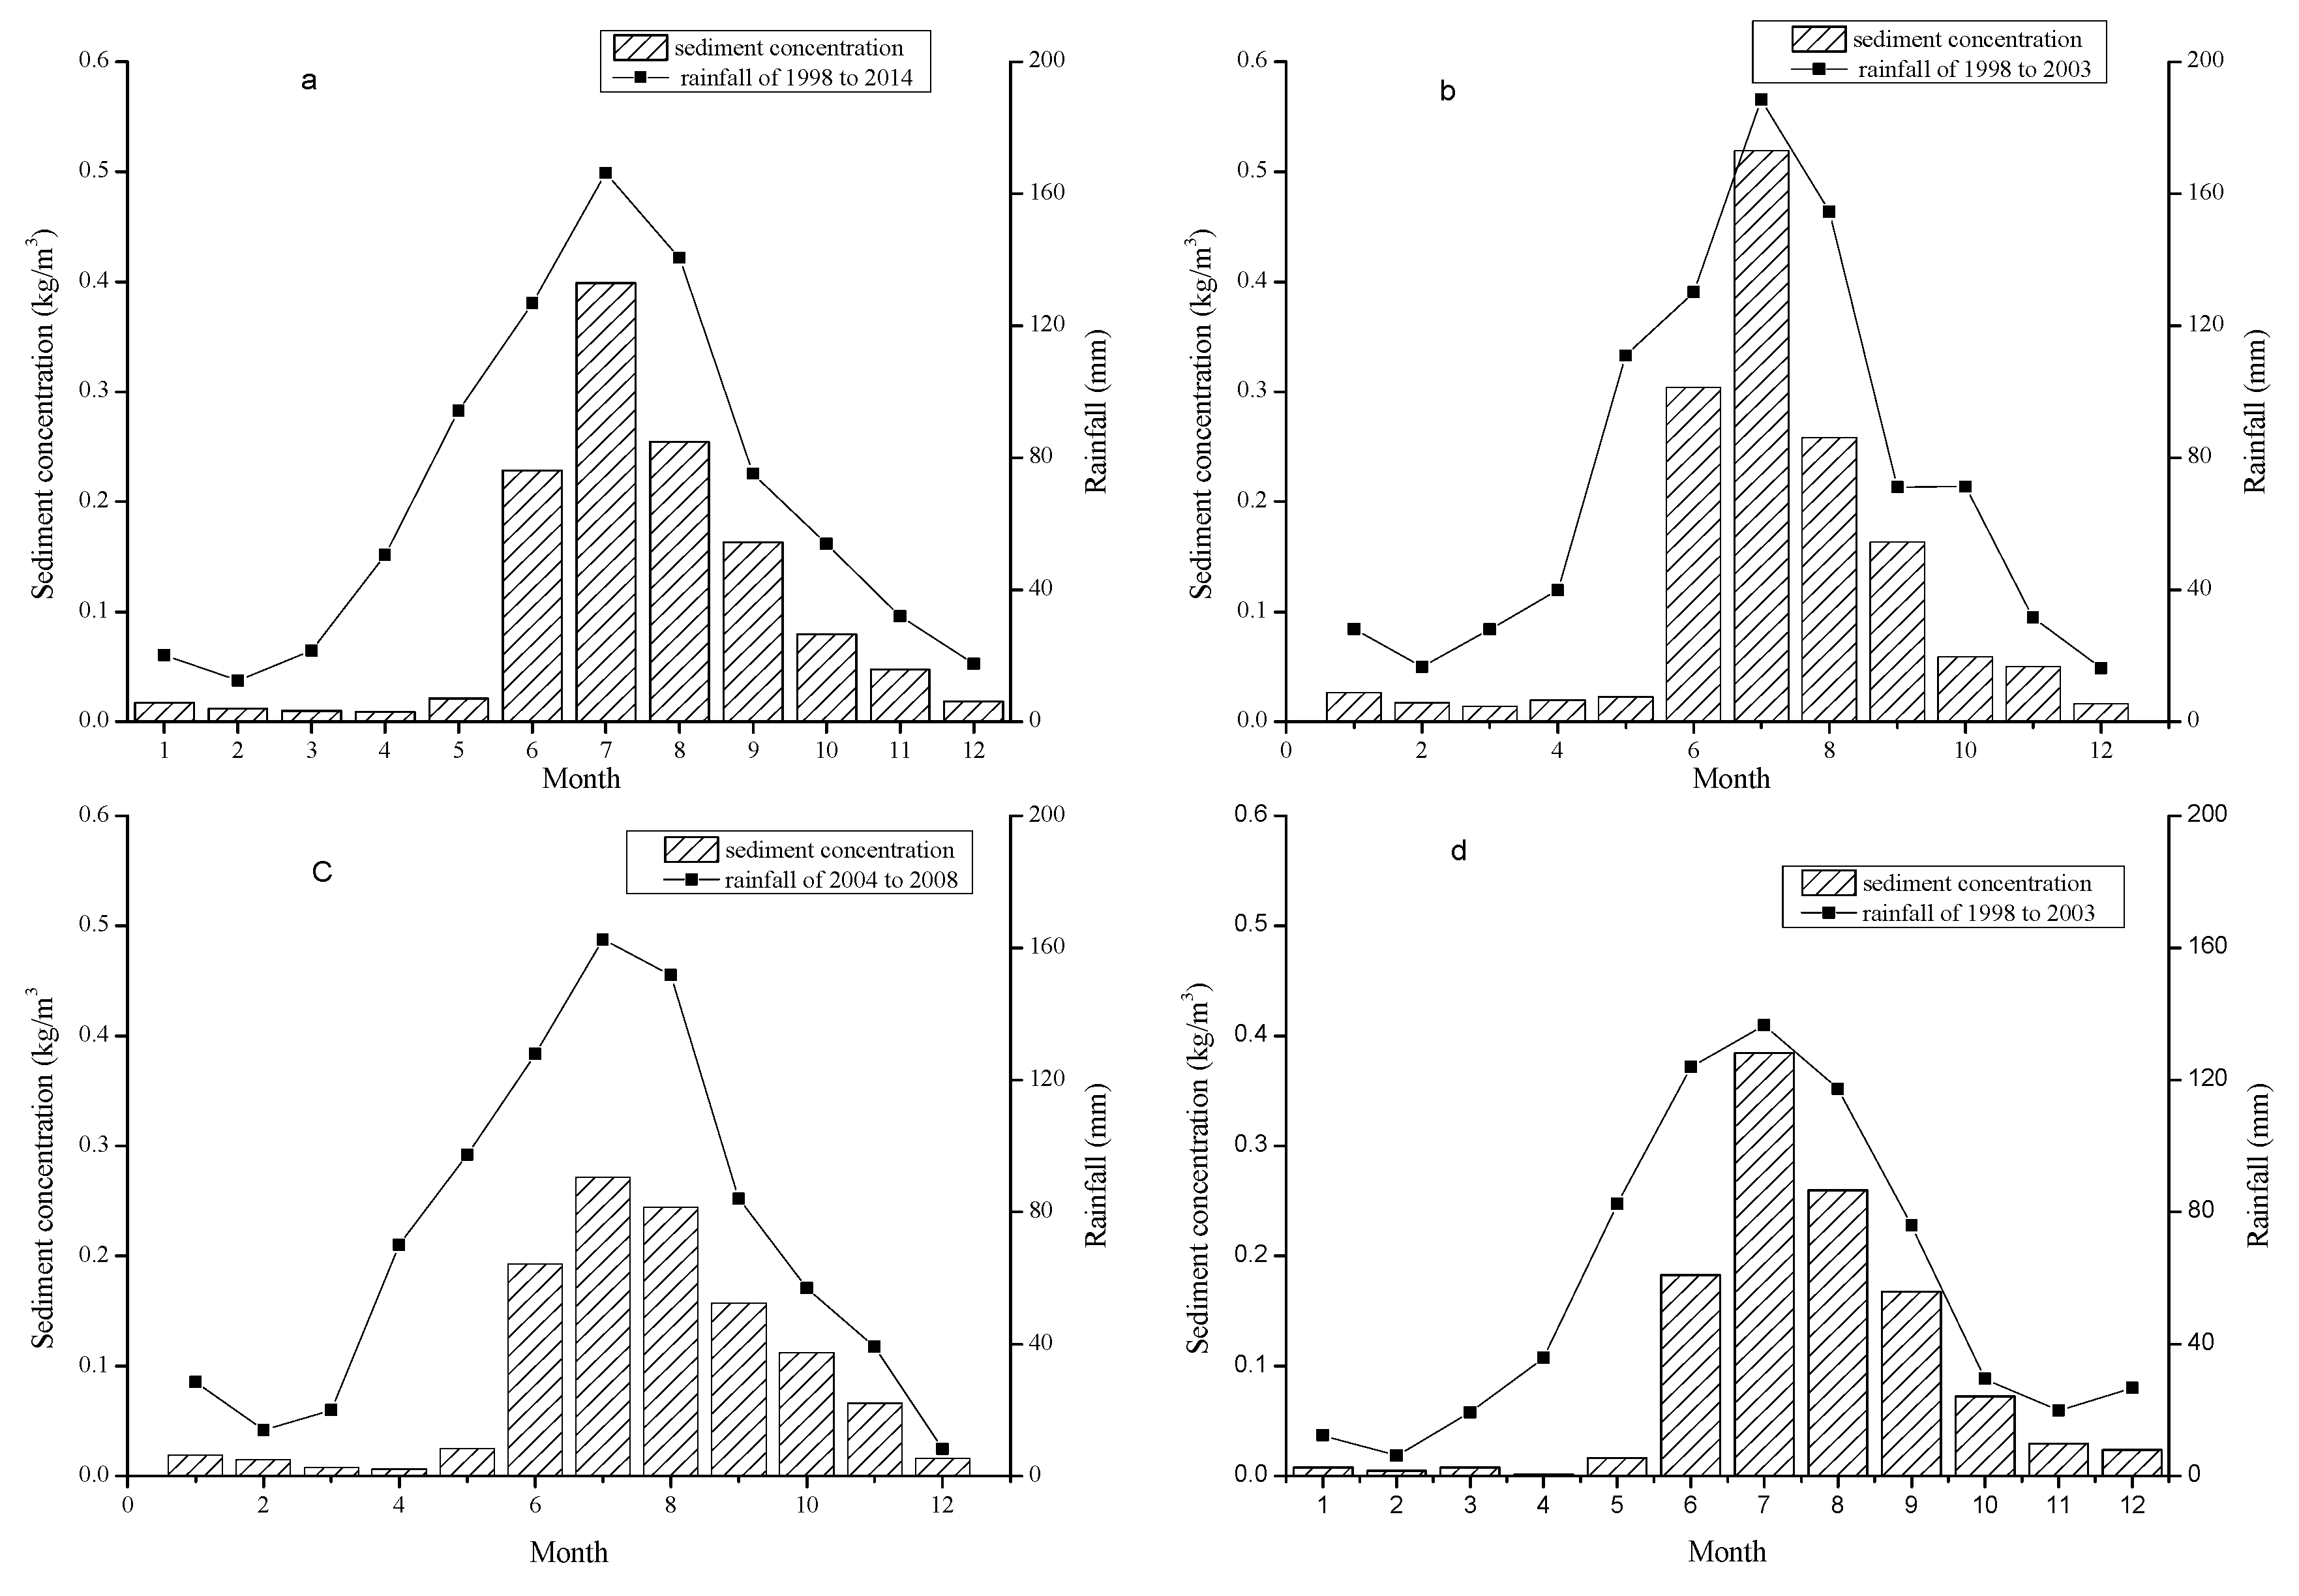
Our results showed that the sediment concentration was positively correlated with the annual rainfall (R = 0.42). Similarly, the mean monthly sediment concentration was also positively correlated with the mean monthly rainfall (R = 0.84), with the most rainfall occurring from May to September with strong intensity (Figure 7). Our research showed that rainfall was not only correlated with seasonal distribution but also with erosivity. This is consistent with the findings of previous studies carried out in these kinds of environments [36]. In karst ecosystems, water is the transmission medium of soil loss/leakage [15] from the surface runoff and percolation by fissures, sinkholes, and so on; both are preconditioned by rainfall. In the karst mountain with steep hillslopes, deep cutting, multi-layers, and extensive karst development [16], rainfall can only be detained shortly on the surface. With about 4500 depressions in the upstream mountain area of the NURS according to our prophase investigation (~5.17 depressions in one square kilometre), in addition to the karst funnels, karst shafts, and pores that are widely distributed, soil water loss and erosion through percolation is common.
The correlation between the daily rainfall and the daily sediment concentration was not significant. To better know the greater rainfall influence on the daily sediment concentration, we analyzed the correlation between the greater rainfall and daily sediment concentration. There was no significant correlation between the greater than 10 mm daily rainfall and sediment concentration, but there was a significant correlation between the greater than 20 mm daily rainfall and sediment concentration (R = 0.50) (Figure 8).
According to the statistics of the erosivity under the large daily rainfall dataset, rainfall events greater than 30 mm occurred 67 times, and the cumulative rainfall was 2858.45 mm, which accounted for 2.2% of the total days from 1998 to 2014. The cumulative rainfall erosivity was 19,452.91 MJ·mm·hm−2·h−1, accounting for 51.9% of the total rainfall erosivity during the monitoring period. This showed that the change of rainfall erosivity was more sensitive than the total rainfall. In 1998, the rainfall was 896 mm, which registered values located in the middle level. The rainfall erosivity was 3405 MJ·mm·hm−2·h−1. The single rainfall on July 26 reached 102 mm, which was the maximum daily rainfall in the study period. This rainfall erosivity was 1269 MJ·mm·hm−2·h−1, and the rainfall erosivity was even larger than for the whole year of 2010. The sediment discharge in 1998 was also the highest in the study period. This indicated that the extremely heavy rainfall events had a great impact on the sediment discharge.
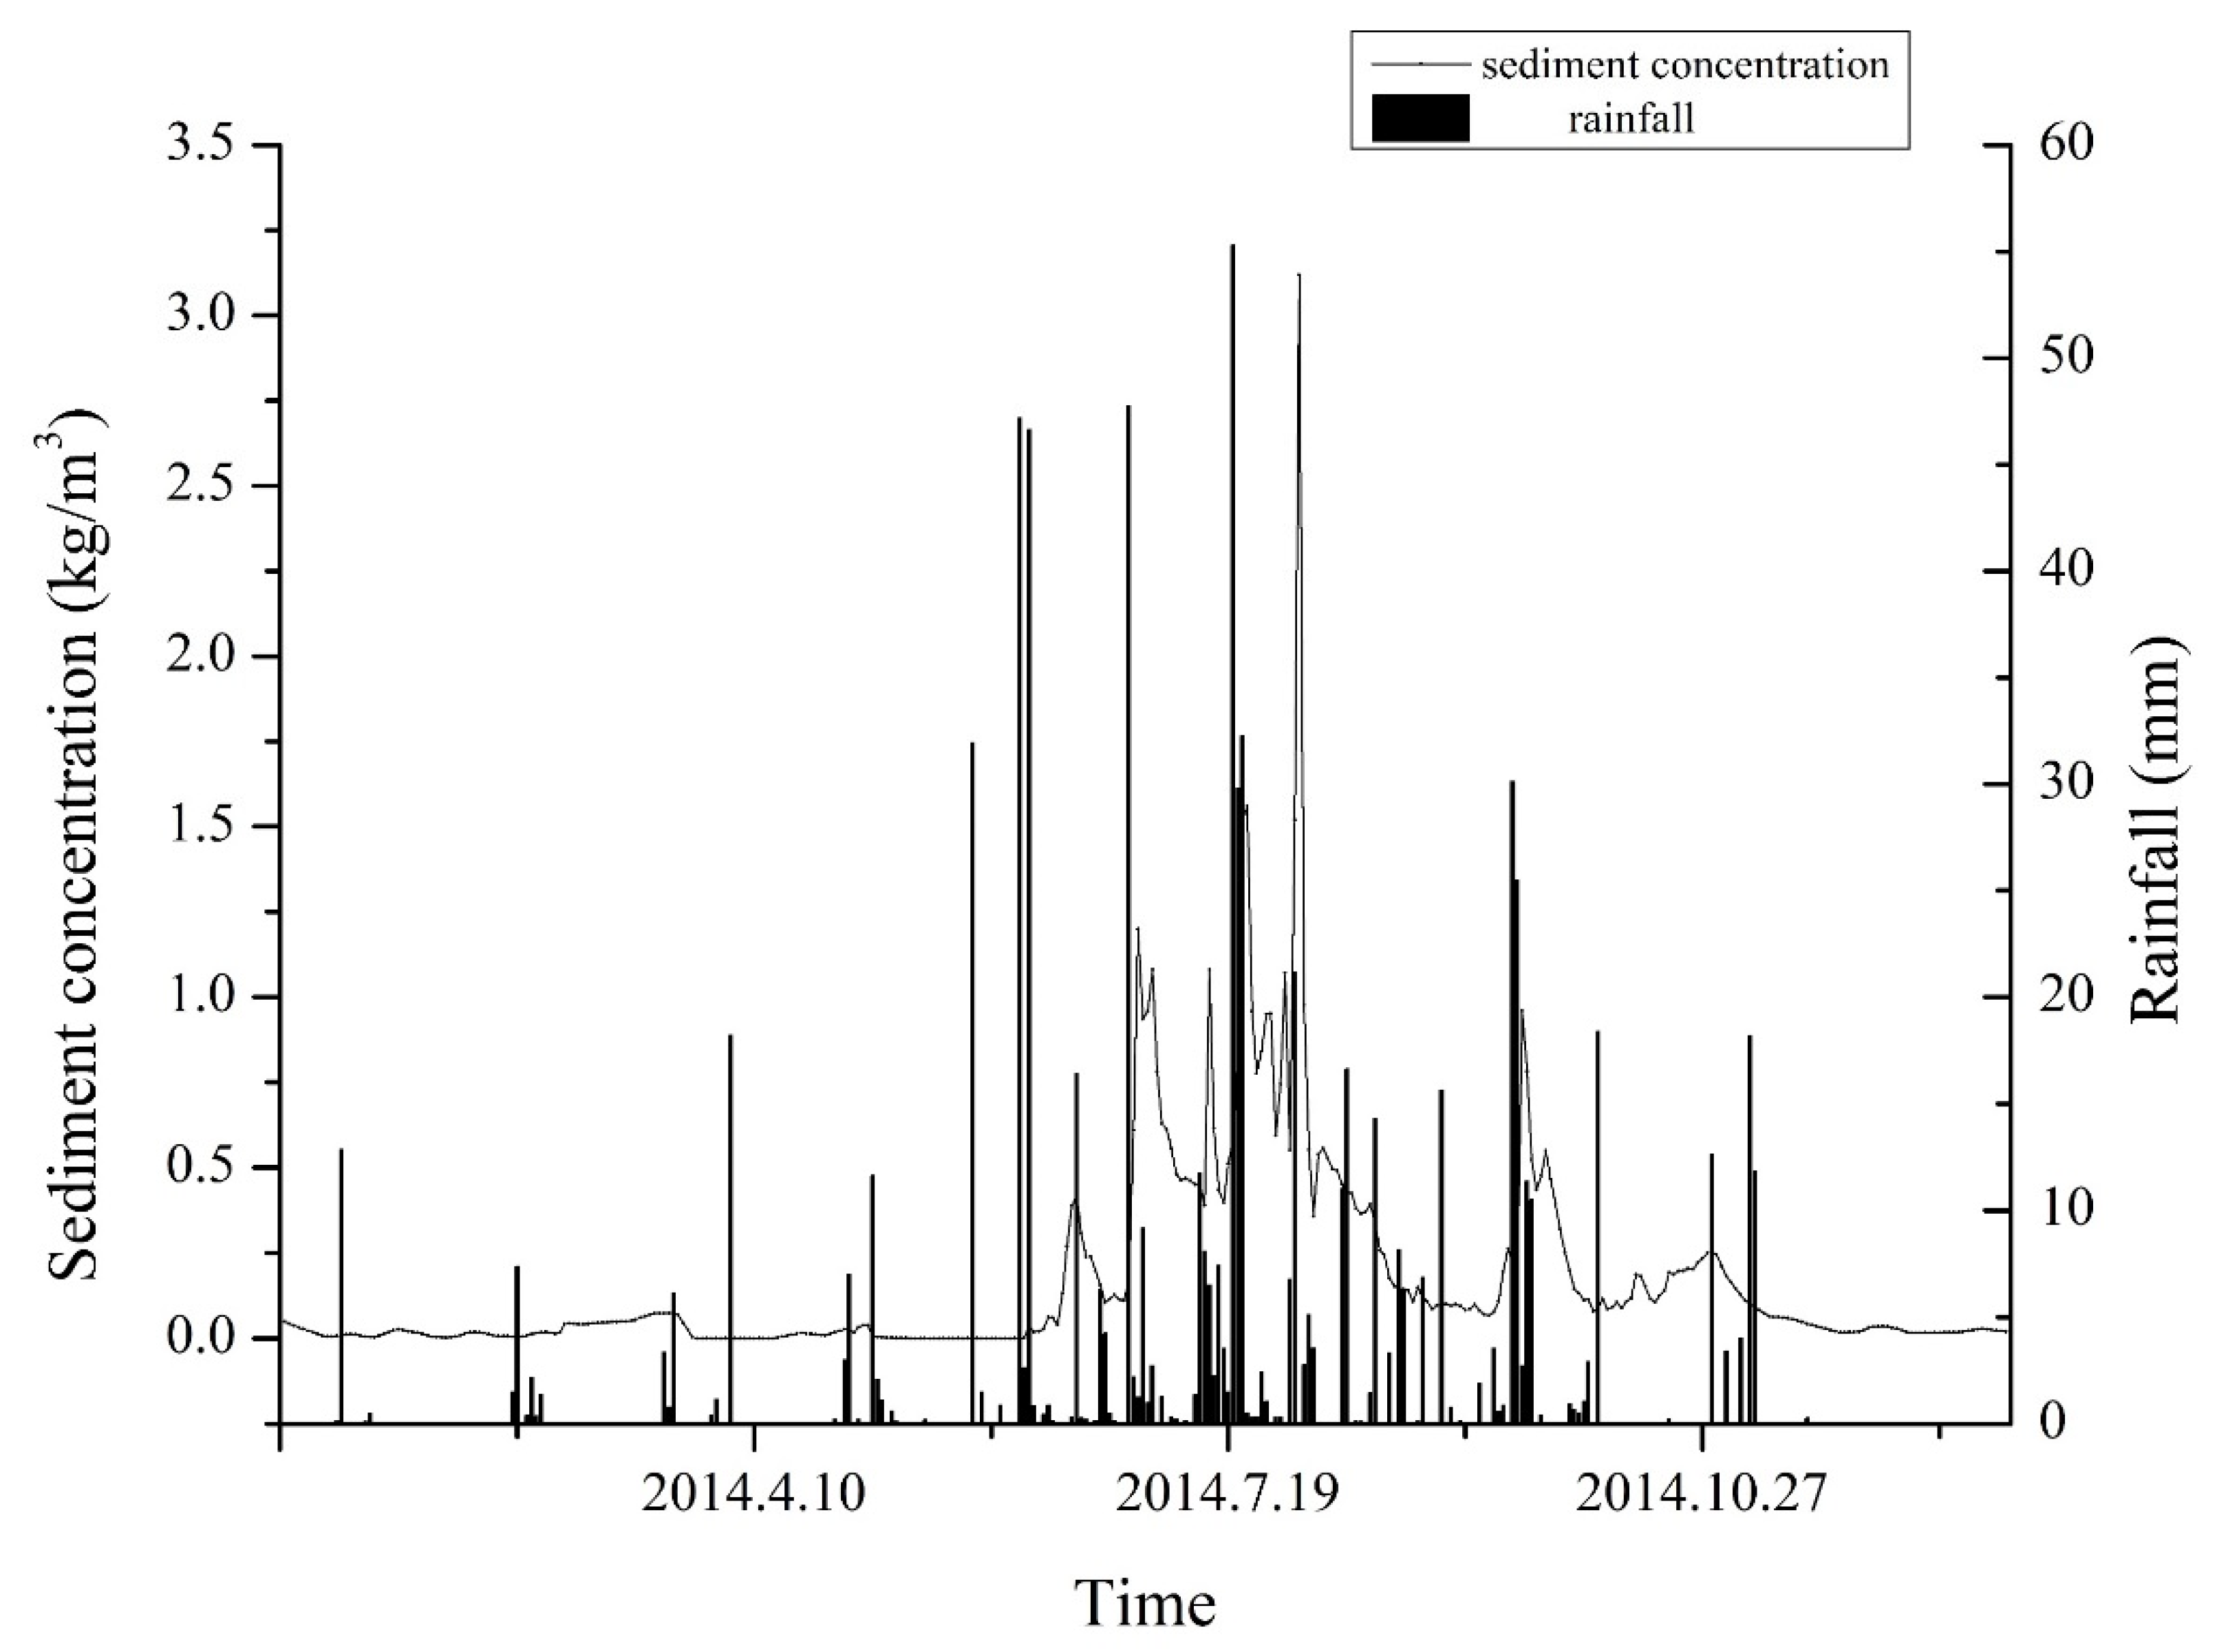
According to the contrast between the daily rainfall and the daily sediment concentration in 2014, the rainfall showed a hysteresis effect on the sediment concentration (Figure 9). The hysteresis effect was consistent with the finding that reported the relationship between the rainfall and the karst spring discharge by Lin et al. in the eastern margin of the Taihang Mountains [37]. Different from the epi-karst zone, this effect can be mainly caused by the large area that the NURS covers. It requires a long time for soil and water to move from the depression and aven in basin margin or southern mountain recharge area to the underground river conduit and eventually to the outlet. A fluorescein sodium trace experiment showed that it requires 72 h for the water to flow from the Mengzi basin margin to the underground river outlet, which supported the rainfall hysteresis effect on sediment [38]. The complexity of the underground river structure may add to the time required for the water and soil to travel. In the NURS, because of the surface and underground dual hydrogeology structure, the underground river structure is very complex. The underground river system consists of one primary flow, three branches, and two relatively independent underground systems (the Pingshiban and Heilongtai underground river systems). The whole NURS length is about 75 km across the Mengzi, Caoba, and Dazhuang basins.
The annual rainfall fluctuation was consistent with the sediment discharge fluctuation, but the sediment concentration change was more obvious than the rainfall. Therefore, rainfall was not the only factor influencing sediment discharge. Human activities also influenced the underlying surface, sediment generation, and transport of the whole watershed [39]. By studying the sediment discharge on the Loess Plateau, Xin et al. [40] pointed out that rainfall played a certain part in sediment discharge, but human activities played a major role in sediment discharge. Li et al. [31] also found that water discharge was mainly influenced by precipitation, while sediment discharge was mainly influenced by human activities (relative contribution 70–111%, regardless of whether the effect is negative or positive) in the karst region of China.
Last but not least, in the future, rainfall data should be re-analyzed and not only the average values should be presented. There is a connection of the present amount of rainwater and sediment loads but this does not confirm anything about the sources of the sediments. This should be further elaborated in the context of extreme rainfall or prolonged occurrences of rain. We took some first steps in this direction, which should be continued. Here, the statistical analysis of high-resolution rainfall data might allow for some indications on sediment sources. However, we can obtain more specific conclusions if we study the origin of sediments proved by additional methods, e.g., tracer experiments or sediment boxes. We cannot assess what happens in the vast underground karst systems, and, as well, we do not know whether anthropogenic activities will lead to extreme rainfall events or droughts (this is not a fact but only a possibility). What is certain is that climatic extremes have always happened and may have played a major role in landscape transformations, in particular in karst regions, but we know very little about their “normal” frequency.
Another issue to be discussed is the discontinuous nature of soil movements in karst areas. Recent research in northern Jordan showed that clay-rich soils were erosion-resistant due to the presence of soil cracks and underlying karst, which can swallow huge amounts of rainwater [15]. However, when water-saturated, soil cracks close and the erodibility increased dramatically. Yet, clayey soils might not be transported grain-by-grain, but in slumps and other viscous flows, which could invalidate the application of each specific model. Therefore, sometimes the use of average rainfall is not suited to assess the soil erosion unless the main goal is to show just the general conditions without considering specific events. This is true for all soils: it is the extremes that matter to develop successful soil control measures.
In karst areas, the temporal distribution of rains is key, not only due to the widespread presence of clay-rich soils but also because strong rains exceeding a certain threshold might trigger hillslope collapses. Such (erratic) slope collapses could release very significant amounts of sediment. In our study, we tried to correlate the general indicators of human activity with erodibility. The effects of human action can be locally highly variable, in particular in karst regions. Our statistical analysis demonstrated a potential causal connection of land use and sedimentation since the data were deduced from satellite imagery. In the future, long-term monitoring should be carried out to observe other possible reasons, such as hillslope instabilities or landslides.
In this context, it is still debated how successful land preservation measures in karst areas can be. What is certain is that forests do not necessarily reduce erosion. This depends on the details, such as whether tree crowns are closed or not, whether monocultures are present or not, and what soils are there. For example, authors demonstrated that maquis could often provide erosion protection [41,42], meanwhile, forests may increase the fire risk (with respective irregular, but heavy erosion events) and lower groundwater tables. Different combinations of biological and engineering measures can be built in different karst areas to prevent the soils from being eroded. Sand shelter dams and biological fences can be built in front of the sinkholes, while reservoirs can be built to regulate the water flow and intercept soils in a basin. Finally, concerning other successful regions, ecological migration can be implemented as a last resort if pressure from the population is beyond the environmental capacity.
To date, in our studied area, no historical landslide or hillslope collapses occurred and there is only one outlet of the groundwater river system, which means that whether the hillslope collapses, the soil will eventually enter the only outlet. Therefore, according to the characteristics of our study area, it is feasible to estimate the amount of soil loss at the regional scale. Also, in our study, we were able to quantify the contribution of both anthropogenic disturbances and precipitation on sediment discharge, due to the stable and special ecosystem characteristics where no natural disasters occurred.
These all provided good conditions for our research. Land use is considered an important human activity in the study region, at the watershed scale. We aimed to analyze the contribution of anthropogenic activities and changes in precipitation regimes on sediment discharge in a closed underground river system. As the most important indicator, land-use change was the key to characterizing the impacts of human activities.

4.2. The Influence of Anthropogenic Activities on Sediment Discharge

Compared to rainfall impacts (38.47%), our results showed that the contribution rate of anthropogenic activities for sediment discharge was larger (61.53%) from 1998 to 2014. Wei et al. [34] indicated the anthropogenic activities contribution rate for sediment yield was about 72% to 97% in the Upper Yangtze River basin. On the other hand, Xin et al. [40] studied 10 branches in the Yellow River basin and determined that anthropogenic activities played a key role in sediment discharge; the contribution rate was about 61% to 93%. Guo et al. confirmed that the contribution of human activities was over 90% on runoff decline in Kuye River watershed [43].
In the karst peak cluster depression area, seven large watersheds were selected to study the change of sediment discharge over the years. The results showed that the decrease in runoff was mainly due to rainfall, and the change of sediment discharge was mainly due to human activities (contribution 70–111%). The main reason for the decrease of sediment discharge was the efficient ecological restoration and dam constructions [31].
In the Mediterranean basin and Dinaric karst area of Europe, cutting forests, overgrazing, farming on steep hillslopes, and burning of forests were related human activities that caused soil loss [12]. Andriani and Walsh stated that human activities induced irreversible alterations in the karst landscape, which increased the flood frequency and sediment loadings [44]. In another example, in Guizhou Province, human activities, including road construction, house construction, steep slope cultivation, tourism development, and grazing, accelerated local soil loss [13]. Due to the different rainfall mechanisms and different human activities in different research areas, the contribution for sediment yield variation was different.
We observed that there were positive and negative effects of human activities on this underground river system. Sediment interception by water conservation measures, including afforestation, planting grass, and reservoir construction, could reduce erosion [45]. In past decades, with the attention on the karst ecological environment, measures were carried out to control soil erosion. Historic farming practices resulted in the abandonment of the once intensively farmed karst land. In other countries, such as southern France, Corsica, and Sardinia, the lands are reverting to garrigue [46]. Deforestation and cultivation on steep hillslopes can increase erosion.
However, in southwest China, there are approximately 220 million people. To feed themselves, residents have to grow corn on steep hillslopes, cut shrubs and trees for cooking and heating, and burn bushes for fertilization in the fall, which accelerates soil loss. The population growth has forced the people to farm the steep hillslopes. Grazing by goats and sheep caused severe soil loss in the epikarst regions [47,48].
From 1998 to 2003, sediment discharge decreased because the Natural Forest Protection Project was implemented from the 1990s in the upper Yangtze River and the upper reaches of the Pearl River. The project included returning farmland to forests and planting trees and grasses, which changed the underlying surface of the whole basin and reduced the sediment yield. In the NURS, according to the statistical yearbook of the Honghe Prefecture, aerial seeding afforestation was implemented on a large scale a second time in 1996, after being first implemented in 1986. Reservoir construction can reduce the sediment of the underground outlets by intercepting the soil from hillslopes.
In contrast, the sediment discharge increased between 2004 and 2008 due to several reasons. Anthropogenic activities, such as coal mining, and highway, railway, and urban construction, were growing. Anthropogenic activities led to extreme climates (i.e., frequent droughts and floods). Due to unusually heavy snow in the south and east of the NURS in January of 2008, the vegetation and its underlying surface that conserved soil and water were destroyed.
In response to the increasing erosion and rocky desertification, the state council then promulgated a comprehensive plan and started a pilot project to control the rocky desertification in 100 counties of the karst area in 2008. With support from the State Forestry Administration and the National Development and Reform Commission, many measures, including reforestation in the hillside with slopes over 25°, were conducted. Several reservoirs and other water conservancy facilities were constructed in the NURS, such as Dazhuang reservoir. These measures resulted in a decrease in sediment yield between 2009 and 2014.

5. Conclusions

We concluded that rainfall distribution in the NURS is non-uniform because 80% was concentrated from May to October. The annual rainfall erosivity was from 1074.64 to 3405.19 MJ·mm·hm−2·h−1·y−1. We confirmed that not only could rainfall be the most important factor related to sediment yield but that it also showed a hysteresis effect for the sediment concentration. We considered that anthropogenic activities could also affect the sediment yield. We observed that the sediment yield decreased when the anthropogenic activities were lower. The contribution rate of the anthropogenic activities varied at different stages.
The contribution rate was 55.2% from 1998 to 2003. From 2004 to 2008, the anthropogenic activities were more active, with the contribution rate up to 74.2%. From 2009 to 2014, the anthropogenic activities decreased, and subsequently, the contribution rate was 55.1%. The east and south mountain areas, which have steep hillslopes and thousands of topographic irregularities, were of particular concern because they provide channels for water and soil loss.
As the population is expected to increase, we should focus on these areas and carry out measures to decrease the soil loss, using biological or engineering measures. Due to the thin soil and intensively rocky desertification, biological measures such as afforestation using deep-rooted species should be prioritized, particularly for steep crests. This measure could be reinforced using engineering measures (e.g., concrete) in the middle and lower hillside where the soil becomes relatively thick.

Author Contributions

Y.L. and Y.Y. conceived and designed the experiments; P.L. and F.L. performed the experiments; Z.J., Z.C., Z.S., Y.S. and X.T. contributed materials tools; Y.L. wrote the paper; Y.Y. and J.R.-C. modified the paper. All authors have read and agreed to the published version of the manuscript.

Funding

This research was funded by the National Key Research and Development Program (Evolution, integrating treatment and technological demonstration of rocky desertification in Karst Graben basin. Grant No. 2016YFC0502503), the National Natural Science Foundation of China (project #41502342), and Guangxi Natural Science Foundation (Grants No. 2017GXNSFBA198037; 2017JJA150639y). Yang Yu received the young elite scientist sponsorship program by the China Association for Science and Technology (2017 to 2019). National Public Institute of Chinese Academy of Geological Sciences (JYYWF20182003).

Conflicts of Interest

The authors declare no conflict of interest.

References

  1. Rodrigo Comino, J.; Iserloh, T.; Morvan, X.; Malam Issa, O.; Naisse, C.; Keesstra, S.D.; Cerdà, A.; Prosdocimi, M.; Arnáez, J.; Lasanta, T.; et al. Soil erosion processes in European vineyards: A qualitative comparison of rainfall simulation measurements in Germany, Spain and France. Hydrology 2016, 3, 6. [Google Scholar] [CrossRef] [Green Version]
  2. Nearing, M.A.; Xie, Y.; Liu, B.; Ye, Y. Natural and anthropogenic rates of soil erosion. Int. Soil Water Conserv. Res. 2017, 5, 77–84. [Google Scholar] [CrossRef]
  3. Borrelli, P.; Panagos, P.; Märker, M.; Modugno, S.; Schütt, B. Assessment of the impacts of clear-cutting on soil loss by water erosion in Italian forests: First comprehensive monitoring and modelling approach. Catena 2017, 149, 770–781. [Google Scholar] [CrossRef]
  4. Parise, M.; Waele, J.D.; Gutierrez, F. Current perspectives on the environmental impacts and hazards in karst. Environ. Geol. 2009, 58, 235–237. [Google Scholar] [CrossRef]
  5. Martínez-Casasnovas, J.A.; Ramos, M.C.; Benites, G. Soil and Water Assessment Tool Soil Loss Simulation at the Sub-Basin Scale in the Alt Penedès–Anoia Vineyard Region (Ne Spain) in the 2000s. Land Degrad. Dev. 2013, 27, 160–170. [Google Scholar] [CrossRef] [Green Version]
  6. Rodrigo-Comino, J.; Giménez-Morera, A.; Panagos, P.; Pourghasemi, H.R.; Pulido, M.; Cerdà, A. The potential of straw mulch as a nature-based solution for soil erosion in olive plantation treated with glyphosate: A biophysical and socioeconomic assessment. Land Degrad. Dev. 2019, in press. [Google Scholar] [CrossRef]
  7. Cerdà, A.; Rodrigo-Comino, J.; Giménez-Morera, A.; Novara, A.; Pulido, M.; Kapović-Solomun, M.; Keesstra, S.D. Policies can help to apply successful strategies to control soil and water losses. The case of chipped pruned branches (CPB) in Mediterranean citrus plantations. Land Use Policy 2018, 75, 734–745. [Google Scholar]
  8. Rickson, R.J. Can control of soil erosion mitigate water pollution by sediments? Sci. Total Environ. 2014, 468–469, 1187–1197. [Google Scholar] [CrossRef]
  9. Cai, Q.; Liu, J. Evolution of Soil Erosion Models in China. Prog. Geogr. 2003, 22, 242–250. [Google Scholar]
  10. Ligonja, P.J.; Shrestha, R.P. Soil Erosion Assessment in Kondoa Eroded Area in Tanzania using Universal Soil Loss Equation, Geographic Information Systems and Socioeconomic Approach. Land Degrad. Dev. 2015, 26, 367–379. [Google Scholar] [CrossRef]
  11. Visser, S.; Keesstra, S.; Maas, G.; de Cleen, M.; Molenaar, C. Soil as a Basis to Create Enabling Conditions for Transitions Towards Sustainable Land Management as a Key to Achieve the SDGs by 2030. Sustainability 2019, 11, 6792. [Google Scholar] [CrossRef] [Green Version]
  12. Jiang, Z.; Lian, Y.; Qin, X. Rocky Desertification in Southwest China: Impacts, Causes, and Restoration. Earth Sci. Rev. 2014, 132, 1–12. [Google Scholar] [CrossRef]
  13. Zhao, L.; Hou, R. Human causes of soil loss in rural karst environments: A case study of Guizhou, China. Sci. Rep. 2019, 9, 1–11. [Google Scholar] [CrossRef]
  14. Yuan, D. On the karst environmental system. Carsologica Sin. 1988, 7, 179–186. [Google Scholar]
  15. Lucke, B.; Kemnitz, H.; Bäumler, R.; Schmidt, M. Red Mediterranean Soils in Jordan: New insights in their origin, genesis, and role as environmental archives. Catena 2014, 112, 4–24. [Google Scholar] [CrossRef] [Green Version]
  16. Dai, Q.; Peng, X.; Wang, P.; Li, C.; Shao, H. Surface erosion and underground leakage of yellow soil on slopes in karst regions of southwest China. Land Degrad. Dev. 2018, 29, 2438–2448. [Google Scholar] [CrossRef]
  17. Liu, M.; Xu, X.; Sun, A.Y.; Wang, K.; Liu, W.; Zhang, X. Is southwestern China experiencing more frequent precipitation extremes? Environ. Res. Lett. 2014, 9, 064002. [Google Scholar] [CrossRef] [Green Version]
  18. Wang, J.; Zou, B.; Liu, Y.; Tang, Y.; Zhang, X.; Yang, P. Erosion-creep-collapse mechanism of underground soil loss for the karst rocky desertification in Chenqi village, Puding county, Guizhou, China. Environ. Earth Sci. 2014, 72, 2751–2764. [Google Scholar] [CrossRef]
  19. Wang, S.; Li, Y. Problems and development trends about researches on karst rocky desertification. Adv. Earth Sci. 2007, 22, 573–582. [Google Scholar]
  20. Kang, Y.; Liang, B. Hydrogeological characteristics of Nandong underground river system in Kaiyuan, Yunnan province. Hydrogeol. Eng. Geol. 1996, 28–30. [Google Scholar]
  21. Zhu, C.; Li, Y. Long-Term Hydrological Impacts of Land Use/Land Cover Change From 1984 to 2010 in the Little River Watershed, Tennessee. Int. Soil Water Conserv. Res. 2014, 2, 11–21. [Google Scholar] [CrossRef] [Green Version]
  22. Ling, Z.; Zhuotong, N.; Yi, X.; Shuo, L.; Maite, D. Hydrological Impacts of Land Use Change and Climate Variability in the Headwater Region of the Heihe River Basin, Northwest China. PLoS ONE 2016, 11, e0158394. [Google Scholar]
  23. Barnett, T.P.; Pierce, D.W.; Hidalgo, H.G.; Bonfils, C.; Santer, B.D.; Das, T.; Bala, G.; Wood, A.W.; Nozawa, T.; Mirin, A.A.; et al. Human-Induced Changes in the Hydrology of the Western United States. Science 2008, 319, 1080–1083. [Google Scholar] [CrossRef] [PubMed] [Green Version]
  24. Xu, Y.Q.; Shao, X.-M.; Kong, X.-B.; Peng, J.; Cai, Y.-L. Adapting the RUSLE and GIS to model soil erosion risk in a mountains karst watershed, Guizhou Province, China. Environ. Monit. Assess. 2008, 141, 275–286. [Google Scholar]
  25. Zeng, C.; Wang, S.; Bai, X.; Li, Y.; Tian, Y.; Li, Y.; Wu, L.; Luo, G. Soil erosion evolution and spatial correlation analysis in a typical karst geomorphology, using RUSLE with GIS. Solid Earth 2017, 8, 1–26. [Google Scholar] [CrossRef] [Green Version]
  26. Gan, F.; Han, K.; Lan, F.; Chen, Y.; Zhang, W. Multi-geophysical approaches to detect karst channels underground—A case study in Mengzi of Yunnan Province, China. J. Appl. Geophys. 2017, 136, 91–98. [Google Scholar] [CrossRef]
  27. Ma, Z. Preliminary study on the geomorphology and its evolution of Nandong River Basin, Yunnan province. Carsologica Sin. 1993, 12, 92–102. [Google Scholar]
  28. Jiang, Y. Sources of sulfur in the Nandong underground river system, southwest China: A chemical and isotopic reconnaissance. Appl. Geochem. 2012, 27. [Google Scholar] [CrossRef]
  29. Huang, X.; Li, H.; Jin, B. Hydrology; Higher Education Press: Beijing, China, 2003. [Google Scholar]
  30. Zhang, W.; Fu, J. Rainfall erosivity estimation under different rainfall amount. Resour. Sci. 2002, 25, 35–41. [Google Scholar]
  31. Li, Z.; Xu, X.; Yu, B.; Xu, C.; Liu, M.; Wang, K. Quantifying the impacts of climate and human activities on water and sediment discharge in a karst region of southwest China. J. Hydrol. 2016, 542, 836–849. [Google Scholar] [CrossRef]
  32. Martin, H.; Alena, P.; Jan, K. Trends in characteristics of sub-daily heavy precipitation and rainfall erosivity in the Czech Republic. Intern. J. Climatol. 2016, 1833–1845. [Google Scholar]
  33. Walter, H.W.; Dwight, D.S. Rainfall energy and its relationship to soil loss. Trans. Am. Gephys. Union 1958, 39, 285–291. [Google Scholar]
  34. Wei, J.; He, X. The impacts of human activities on riverine sediment load: A case study of the Upper Yangtze River Basin. Geogr. Res. 2012, 31, 2259–2269. [Google Scholar]
  35. Hu, C.; Wang, Y.; Guan, J.; Shi, Z. The causes of runoff variation based on double cumulative curve analysis method. J. Water Resour. Res. 2012, 1, 204–210. [Google Scholar] [CrossRef]
  36. Dai, Q.; Peng, X.; Zhao, L.; Shao, H.; Zhi, Y. Effects of Underground Pore Fissures on Soil Erosion and Sediment Yield on Karst Slopes: Soil Erosion and Sediment on Karst Slopes. Land Degrad. Dev. 2017, 7, 1922–1932. [Google Scholar]
  37. Lin, Y.; Qu, P.; Lv, H.; Wu, Y. Variation characteristics of typical karst springs in the eastern margin of the Taihang Mountains. Carsologica Sin. 2018, 37, 671–679. [Google Scholar]
  38. Zhao, Y.; Yi, Y.; Qin, X.; Hong, T.; Cheng, R.; Lan, F. Tracer tests on distribution and structural characteristics of karst channels in Nandong underground river drainage. Carsologica Sin. 2017, 2, 226–233. [Google Scholar]
  39. Yang, S.; Zhao, Q.; Belkin, I.M. Temporal variation in the sediment load of the Yangtze River and the influences of human activities. J. Hydrol. 2002, 263, 56–71. [Google Scholar] [CrossRef]
  40. Xin, Z.B.; Xu, J.; Zheng, W. Spatiotemporal variations of vegetation cover on the Chinese Loess Plateau(1981–2006):Impacts of climate changes and human activities. Sci. China 2009, 69–80. [Google Scholar] [CrossRef]
  41. Pirastru, M.; Niedda, M.; Castellini, M. Effects of maquis clearing on the properties of the soil and on the near-surface hydrological processes in a semi-arid Mediterranean environment. J. Agric. Eng. 2014, 45, 176. [Google Scholar] [CrossRef]
  42. Sardans, J.; Peñuelas, J. Plant-soil interactions in Mediterranean forest and shrublands: Impacts of climatic change. Plant Soil 2013, 365, 1–33. [Google Scholar] [CrossRef] [Green Version]
  43. Guo, Q.; Yang, Y.; Su, N.; Li, J.; Wang, X. Impact assessment of climate change and human activities on runoff variation in coal mining watershed, NW China. Water Resour 2019, 46, 871–882. [Google Scholar]
  44. Andriani, G.F.; Walsh, N. An example of the effects of anthropogenic changes on natural environment in the Apulian karst (southern Italy). Environ. Geol. 2008, 58, 313–325. [Google Scholar] [CrossRef]
  45. Xu, J.X.; Sun, J. Sediment yield in major sediment source areas of the upper Changjiang River basin in response to human activities. Sci. Geogr. Sin. 2007, 27, 211–218. [Google Scholar]
  46. Ford, D.; Williams, P. Karst Hydrogeology and Geomorphology; John Wiley & Sons Ltd.: Hoboken, NJ, USA, 2007. [Google Scholar]
  47. Zeng, F.; Jiang, Z.; Shen, L.; Chen, W.; Yang, Q.; Zhang, C. Assessment of multiple and interacting modes of soil loss in the karst critical zone, Southwest China (SWC). Geomorphology 2018, 322, 97–106. [Google Scholar] [CrossRef]
  48. Chen, H.; Yang, J.; Fu, W.; He, F.; Wang, K. Characteristics of slope runoff and sediment yield on karst hill-slope with different land-use types in northwest Guangxi. Trans. Chin. Soc. Agric. Eng. 2012, 28, 121–126. [Google Scholar]
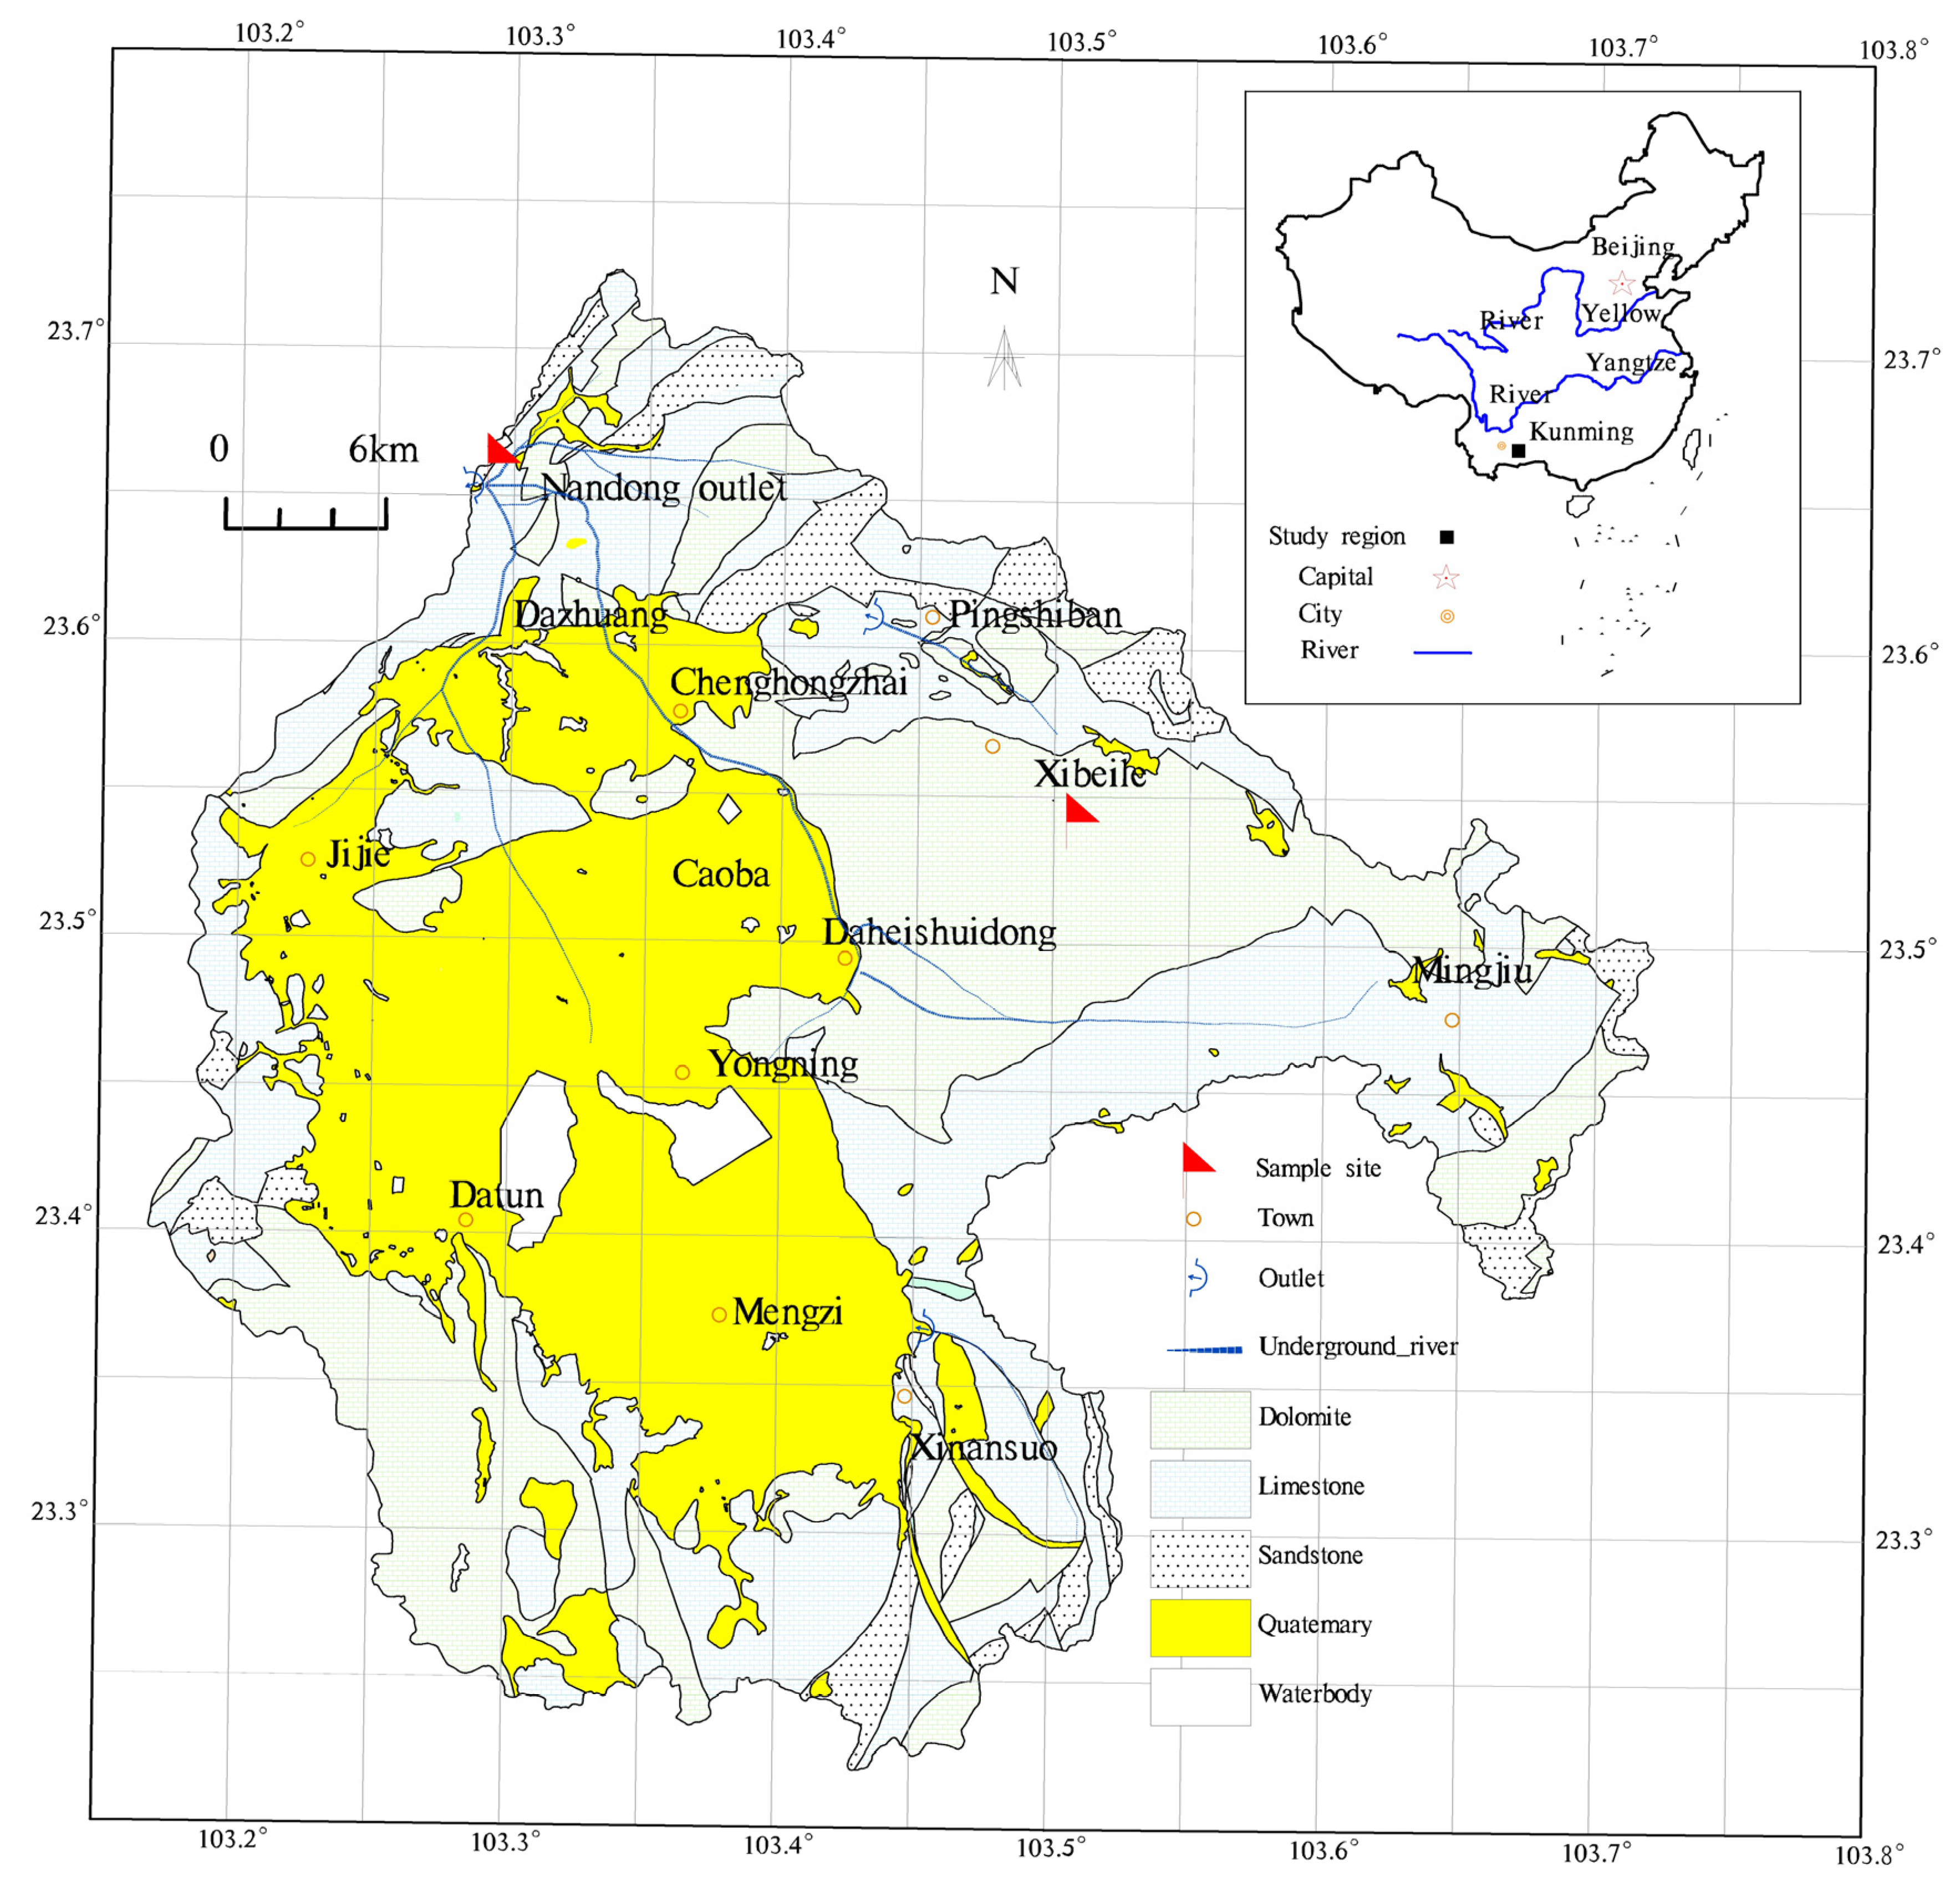
Figure 1. Location and geological map of the NURS (Nandong underground river system).
Sustainability 12 03006 g001
Figure 2. Calcareous parent material and representative soil profile in the study area.
Sustainability 12 03006 g002
Figure 3. The annual average sediment concentration of the NURS.
Sustainability 12 03006 g003
Figure 4. Mutation test of the sediment discharge.
Sustainability 12 03006 g004
Figure 5. The double mass curves of the rainfall erosivity, sediment discharge, and runoff.
Sustainability 12 03006 g005
Figure 6. Land-use change of the NURS (Nandong underground river system) in 1995, 2005, and 2015.
Sustainability 12 03006 g006
Figure 7. Monthly sediment and rainfall variations in different stages. (a) is the monthly sediment and rainfall variation in 1998 to 2014, (b) is 1998 to 2003, (c) is 2004 to 2008, and (d) is 2009 to 2014.
Sustainability 12 03006 g007
Figure 8. Sediment concentration and higher rainfall variation.
Sustainability 12 03006 g008
Figure 9. The variation of daily rainfall and sediment in 2014.
Sustainability 12 03006 g009
Table 1. Variations of sediment, rainfall erosivity, and human impact index in the NURS (Nandong underground river system).
PeriodPre-Intersection YearPost-Intersection Year
Sediment Discharge
(×106 t)
Rainfall Erosivity
(MJ·mm·hm−2·h−1·y−1)
Anthropogenic IndexSediment Discharge
(×106 t)
Rainfall Erosivity
(MJ·mm·hm−2·h−1·y−1)
Anthropogenic Index
1998–20038.833405.1925.921.662168.347.67
2004–20082.412395.9310.076.023126.5319.27
2009–20145.301789.9029.591.371449.2621.05
Table 2. Land-use change (Km2) of different stages in the NURS.
Cultivated LandForestlandGrasslandWaterbodyResidential and Construction Land
1995478.3447.3615.34145.2
2005466.9447.3615.34156.6
2015461.4443.9605.841.374.7