Article

Carbon Mineralization under Different Saline—Alkali Stress Conditions in Paddy Fields of Northeast China

1
Key Laboratory of Groundwater Resources and Environment, Ministry of Education, Jilin University, Changchun 130012, China
2
College of Environment and Resources, Jilin University, Changchun 130012, China
3
College of Construction Engineering, Jilin University, Changchun 130026, China
4
Engineering Research Center of Geothermal Resources Development Technology and Equipment, Ministry of Education, Jilin University, Changchun 130026, China
*
Author to whom correspondence should be addressed.
Sustainability 2020, 12(7), 2921; https://doi.org/10.3390/su12072921
Submission received: 13 March 2020 / Revised: 31 March 2020 / Accepted: 2 April 2020 / Published: 6 April 2020

Abstract

:
Soil organic carbon (SOC) mineralization (conversion of carbonaceous material to carbon dioxide) plays a central role in global carbon cycle. However, the effects of SOC mineralization under different saline–alkali stress conditions are poorly understood. In order to understand the carbon mineralization processes, four paddy fields with different saline and alkali degrees were chosen as the experimental samples and the soil CO2 emission fluxes at nine different time steps of the whole simulation experiment were observed. The physical and chemical properties of soils of four field conditions were compared for the dynamic changes of CO2 flux in the progress of paddy field cultivation simulations. The results showed that the first three fields (P1, P2, and P3) were weakly alkaline soils and the last one (P4) was strongly alkaline soil. The SOC content of each plot was significantly different and there was a near-surface enrichment, which was significantly negatively correlated with the degree of alkalization. The accumulation process of the SOC mineralization during the incubation time was consistent with the first-order kinetic model. In the initial stage of mineralization, the amount of CO2 released massively, and then the release intensity decreased rapidly. The mineralization rate decreased slowly with time and finally reached a minimum at the end of the incubation period. This study indicates that the SOC mineralization process is affected by a variety of factors. The main factors influencing SOC mineralization in the saline–alkaline soils are the exchangeable sodium percentage (ESP), followed by enzyme activities. Salinization of the soils inhibits the rate of soil carbon cycle, which has a greater impact on the carbon sequestration than on the carbon source process. The intensity and completeness of the SOC mineralization reactions increase with increasing SOC contents and decrease with increasing ESP levels.

1. Introduction

The process of CO2 exchange between soil and atmosphere is affected by soil conditions, environment, and land management [1]. Different soil temperatures, moistures, pH, and soil textures cause CO2 flux to exhibit different characteristics for different soil systems in the carbon cycle [2,3]. In the situation of global climate changes, some extreme weather conditions or natural disasters (such as rainstorms, droughts, floods, etc.) can exacerbate the formation and proportion of saline–alkali lands and increase the threat of the salinization and alkalinization of soils in arid or semi-arid areas [4,5,6] which can cause the destruction of ecological main function areas [7,8]. Land management, such as farming, fertilization, land use, and agricultural expansion is also one of the main driving factors of the CO2 increase, which in turn leads to an increase in saline–alkali soil areas [2,9]. It is estimated that the degree of soil salinization in the world would be further aggravated and deteriorated, and the impacted scope or area would be further expanded. Therefore, soil salinization is becoming a major environmental threat affecting soil structures and functions [10].
In the global carbon cycle, soil respiration is the main form of carbon flux exchange between the soil and atmosphere [11]. Soil organic carbon (SOC) accounts for about 50% of the total terrestrial carbon pool (depth of 1 m) [12]. A small change of SOC can lead to a large variation of atmospheric CO2 concentrations, and its important role in the global carbon cycle cannot be ignored [13,14]. SOC also plays an important role in the soil quality of the agro-ecosystem [15], and in maintaining crop productivity and yield stability [16]. Some studies have shown that increasing land use and human activities have reduced the carbon pool of the agricultural land by about 133 Pg carbon [10]. Understanding the factors affecting SOC and the main indicators of soil quality is one of the key issues for soil sustainable agriculture. A major process affecting SOC is its mineralization process, which has a large impact on the terrestrial sources of CO2 fluxes in the atmosphere [17]. The SOC mineralization essentially is a biochemical process in which microbes utilize and degrade soil organic matter and carbon flow out of the soil [18]. From the point of view of biochemical reactions, the reaction process is generally considered to consist of two stages [19]. First, microbes secrete extracellular enzymes to convert insoluble SOC polymers into compounds that can be absorbed by microbial cells. In the second step, carbon (C) is released as CO2 and the assimilated compounds react through the oxidative metabolism processes. A series of reactions are carried out under the catalysis of the required enzyme and coenzyme factors and under suitable pH conditions. The mechanism of redox reactions [20] is affected by the chemical composition of the SOC, soil temperature, soil moisture and texture, etc. [21,22].
In the exchange between atmosphere and soil, the contribution of CO2 released from the alkaline soil is mainly from carbonate [23], and the saline–alkali soil is one of the important carbon sources because of low carbon input [9]. The variety and content of salt in soils make the physical properties and chemical components of saline–alkali soil very complex and variable [24]. The CO2 flux is influenced by both biological and physicochemical processes, and the carbon cycle process in saline–alkali soil is different from that in the not saline–alkali soil [25]. During the past decade, many studies have investigated the effects of the saline–alkali stress on soils and crops [25,26,27,28]. Zhang et al. concluded that moderate to high concentrations of salt significantly reduced the absorption of CO2 in soil land and affected the accumulation density of organic matters [9]. In addition, the toxicity of the alkaline stress (high pH soil produced by NaHCO3 and Na2CO3) to grassland plants such as Chinese wildrye (Aneurolepidium chinense) and Kochia sieversiana was more serious than the salinization stress [29,30]. Soil salinity and alkalinity are harmful to the growth of wetland plants. However, most of the previous studies have focused on the effects of saline stresses. There have been only a few studies regarding the soil carbon cycle and paddy ecosystem under salinization and alkalization stresses, and little attention has been devoted to field research and control experiments. This study focuses on characterizing the carbon mineralization process in saline–alkali soil. Four sample plots with different saline–alkali extents are selected as our research fields. The first-order dynamic mathematical model is utilized to simulate the process of carbon mineralization. The monitoring data from the field tests are compared with those of laboratory incubations to obtain the fitting parameters of the model.
The area of saline–alkali lands is approximately one million km2 in China, while there is 23.33 thousand km2 in the Songnen Plain of the western Jilin Province, which is one of the three most concentrated saline–alkali land areas in the world, and where the Qianguo Irrigation District with typical saline-alkali characteristics was selected as the research object. NaHCO3, CaCO3, and other soda salts are used as the main inorganic sources in this region [21,31]. The district is located in the northwest of Jilin Province in Northeast China, in the hinterland of the Songnen Plain, and there have been a large number of paddy fields transformed from saline–alkali lands in this region. However, the response of carbon mineralization to soils with different salinization and alkalinization degrees were poorly understood. The objectives of this study include the following: (1) To evaluate the impact of the soil salinization and alkalinization on the SOC contents, (2) analyze the SOC mineralization process and its dynamic simulation processes under different saline–alkaline stresses, and (3) assess whether and how the soil salinization and alkalization impact on the global carbon source or carbon sequestration processes.

2. Materials and Methods

2.1. Study Sites and Sampling Design

The study area, Qianguo County, was located in western Jilin Province (43°22′ to 46°18′ N, 121°38′ to 126°11′ E) (Figure 1) of Northeast China, where the climate is semi-arid and sub-humid continental monsoon with four distinct seasons. The annual mean temperature is about 4.5 °C, the lowest temperature is in January (the extreme minimum temperature −36.1 °C), and the highest temperature is in July (the extreme maximum temperature 37 °C). Annual precipitation is between 400 mm and 500 mm [32].
Four plots (P1, P2, P3, and P4) with different saline–alkali stresses were selected after pre-experiments and initial data analysis of the project (Table 1). Representative plots were distributed in different parts of the Qianguo County. According to the primary study, the development period, the fertilization rate, and the soil management mode are diverse. The profile soil (0 to 20 cm and 20 to 40 cm) was randomly collected by mixed sampling method at each sample site. Each soil sample was about 3 kg by weight and placed in a prepared plastic sampling bag. The soil properties are shown in Table 1. The surface soil (0 to 20 cm deep) and the bottom soil (20 to 40 cm deep) were collected on 27 September 2017 and the mineralization characteristics of different soil layers were studied. The vertical 40 cm deep soil was directly related to rice growth. The collected soil samples were mixed together after the visible animal and plant residues were removed. One part was immediately stored in a 4 °C refrigerator freezer for incubation experiments, and another part of the soil samples was naturally dried at room temperature, and then milled and sifted to measure the physicochemical properties of the soils.

2.2. Soil Analysis

Soil samples were air dried after animal and plant residues and stones were removed, and then sieved by 2 mm for soil properties (except for bulk density) and enzymes analysis, as well as sieved by 0.149 mm for the SOC assay.

2.2.1. Measurement of Soil Alkalinity

The alkalinity of soil is expressed by the saturation of Na+, which refers to the percentage of exchangeable Na+ adsorbed on soil colloids as a percentage of cationic exchange capacity. The exchangeable Na+ was measured by atomic emission spectrometry (TAS-990 atomic absorption spectrophotometer) and the cation exchange capacity (CEC) was measured by EDTA-ammonium acetate exchange method. The exchangeable sodium percentage (ESP) formula for calculating soil alkalinity is as follows:
ESP = Na+/CEC × 100%

2.2.2. Measurements of Other Indicators

The soil pH value was measured by the pH meter (Shanghai Yiliang Scientific Instruments Co., Ltd., PHS-3C type, Shangai, China) (dry soil: deionized water, 1:2.5, mass concentration). Soil salinity was measured by the conductance method. Water holding capacity (WHC) was measured by the cutting ring method. Electrical conductivity (EC) was measured by the conductometer (Shanghai Yiliang Scientific Instruments Co., Ltd., DDSJ-308 type, Shangai, China) (dry soil: deionized water, 1:2.5, mass concentration), and the SOC was determined by the total organic carbon analyzer (Shimadzu TOC-V, SSM-5000A, Kyoto, Japan), and total nitrogen (TN) was determined by Kjeldahl distillation with the nitrogen determination instrument (Shanghai Yiliang Scientific Instruments Co., Ltd., KDN-04C, Shangai, China).

2.3. Experimental Design

The basic physicochemical properties of soils were measured and cultivated on 15 November 2017. Soil samples were collected from four saline paddy fields (P1, P2, P3, and P4) with different salinization extents in western Jilin Province. The samples were obtained using 0 to 20 cm and 20 to 40 cm stratified sampling below the surface. Before the incubation experiment was carried out, the fresh soil samples stored in the refrigerator at 4 °C were taken out, and the soil moisture contents and the soil WHC in the field were measured in order to calculate the soil moisture contents and the weighing quality of each treatment. Each soil sample was treated with 3 parallel treatments and a blank control experiment was set in order to eliminate error. Each incubation bottle selected a wide mouth plastic incubation bottle with a good 1000 mL seal. Weighing 20.0 gr of soil (dry weight) was adjusted to 60% of WHC in the field. It was laid flat on the bottom of the incubation bottle, and a spare space was reserved in the middle of the bottom to hold a small 25 ml beaker. There was 10 mL 0.1 mol·L−1 NaOH solution in the small beaker (Figure 2). The blank control bottle was the same as the experiment beaker but without any soil in it. The preincubation time was one week, the total length of the incubation cycle was set at 70 days, the first 14 days were monitored every two days, then every other week, and when monitored after 35 days, the frequency of monitoring changed to once a month. During the incubation experiment, the absorbent cup was changed periodically to obtain the CO2 mineralization flux within a certain period of time, and the weighing method was used to ensure that the soil moisture was kept at 60% of the field WHC. All the incubation bottles were weighed at each measurement, and when the initial value was lower, the moisture was replenished according to the difference value.
The method of the assay of soil enzyme is not quantitative determination of enzyme content in soil, but according to the functions of enzyme-catalytic chemical reactions, the commonly used biochemical method was used to characterize enzyme activities [33]. The types of enzymes in the soil can be classified as redox enzymes, transferases, hydrolases, and lysozyme, etc. Among them, hydrolase and oxidoreductase have been widely studied. In this study, amylase, invertase, catalase, and polyphenol oxidase, which are the most direct enzymes neutralizing the natural carbon cycle, were tested and analyzed to monitor the changes of soil enzymes in soil. The relationships among those enzyme activities and soil organic carbon content and soil organic carbon mineralization were also analyzed.

2.4. Modeling Methods

The mineralization process of all treated SOC was simulated with a first-order dynamic model [34]. The formula is as follows:
Ct = C0 × (1 − e−kt)
where Ct (g kg−1) represents the accumulated mineralization amount of soil organic carbon after t days (d) or the days of incubation, C0 is the equation to simulate the potential value of soil mineralization (g kg−1), and k is the turnover rate constant of organic carbon pool (d−1). The half cycle period is T1/2 = ln2/k. The formula for calculating the mineralization rate of soil organic carbon is as follows:
CO2 (g/kg) d = CO2 (g/kg)/t
where CO2 (g kg−1) represents the amount of organic carbon mineralization during the incubation period B (g kg−1).
The formula for calculating the SOC mineralization amount is as follows:
CO2 (g/kg) = CHCl × (V0 − V1) × 22/0.03
where CHCl is the concentration of hydrochloric acid (mol·L−1), V0 is the volume of blank titration (mL), and V1 is the volume of consumed hydrochloric acid (mL).

2.5. Calculations and Statistical Analysis

Single factor analysis of variance (ANOVA) and multiple comparisons were conducted to analyze the differences between different soil layers (significant level, p < 0.05). The Pearson correlation coefficient matrix was used for correlation analysis, and the first-order kinetic equation was used for data fitting and parameter estimation.

3. Results

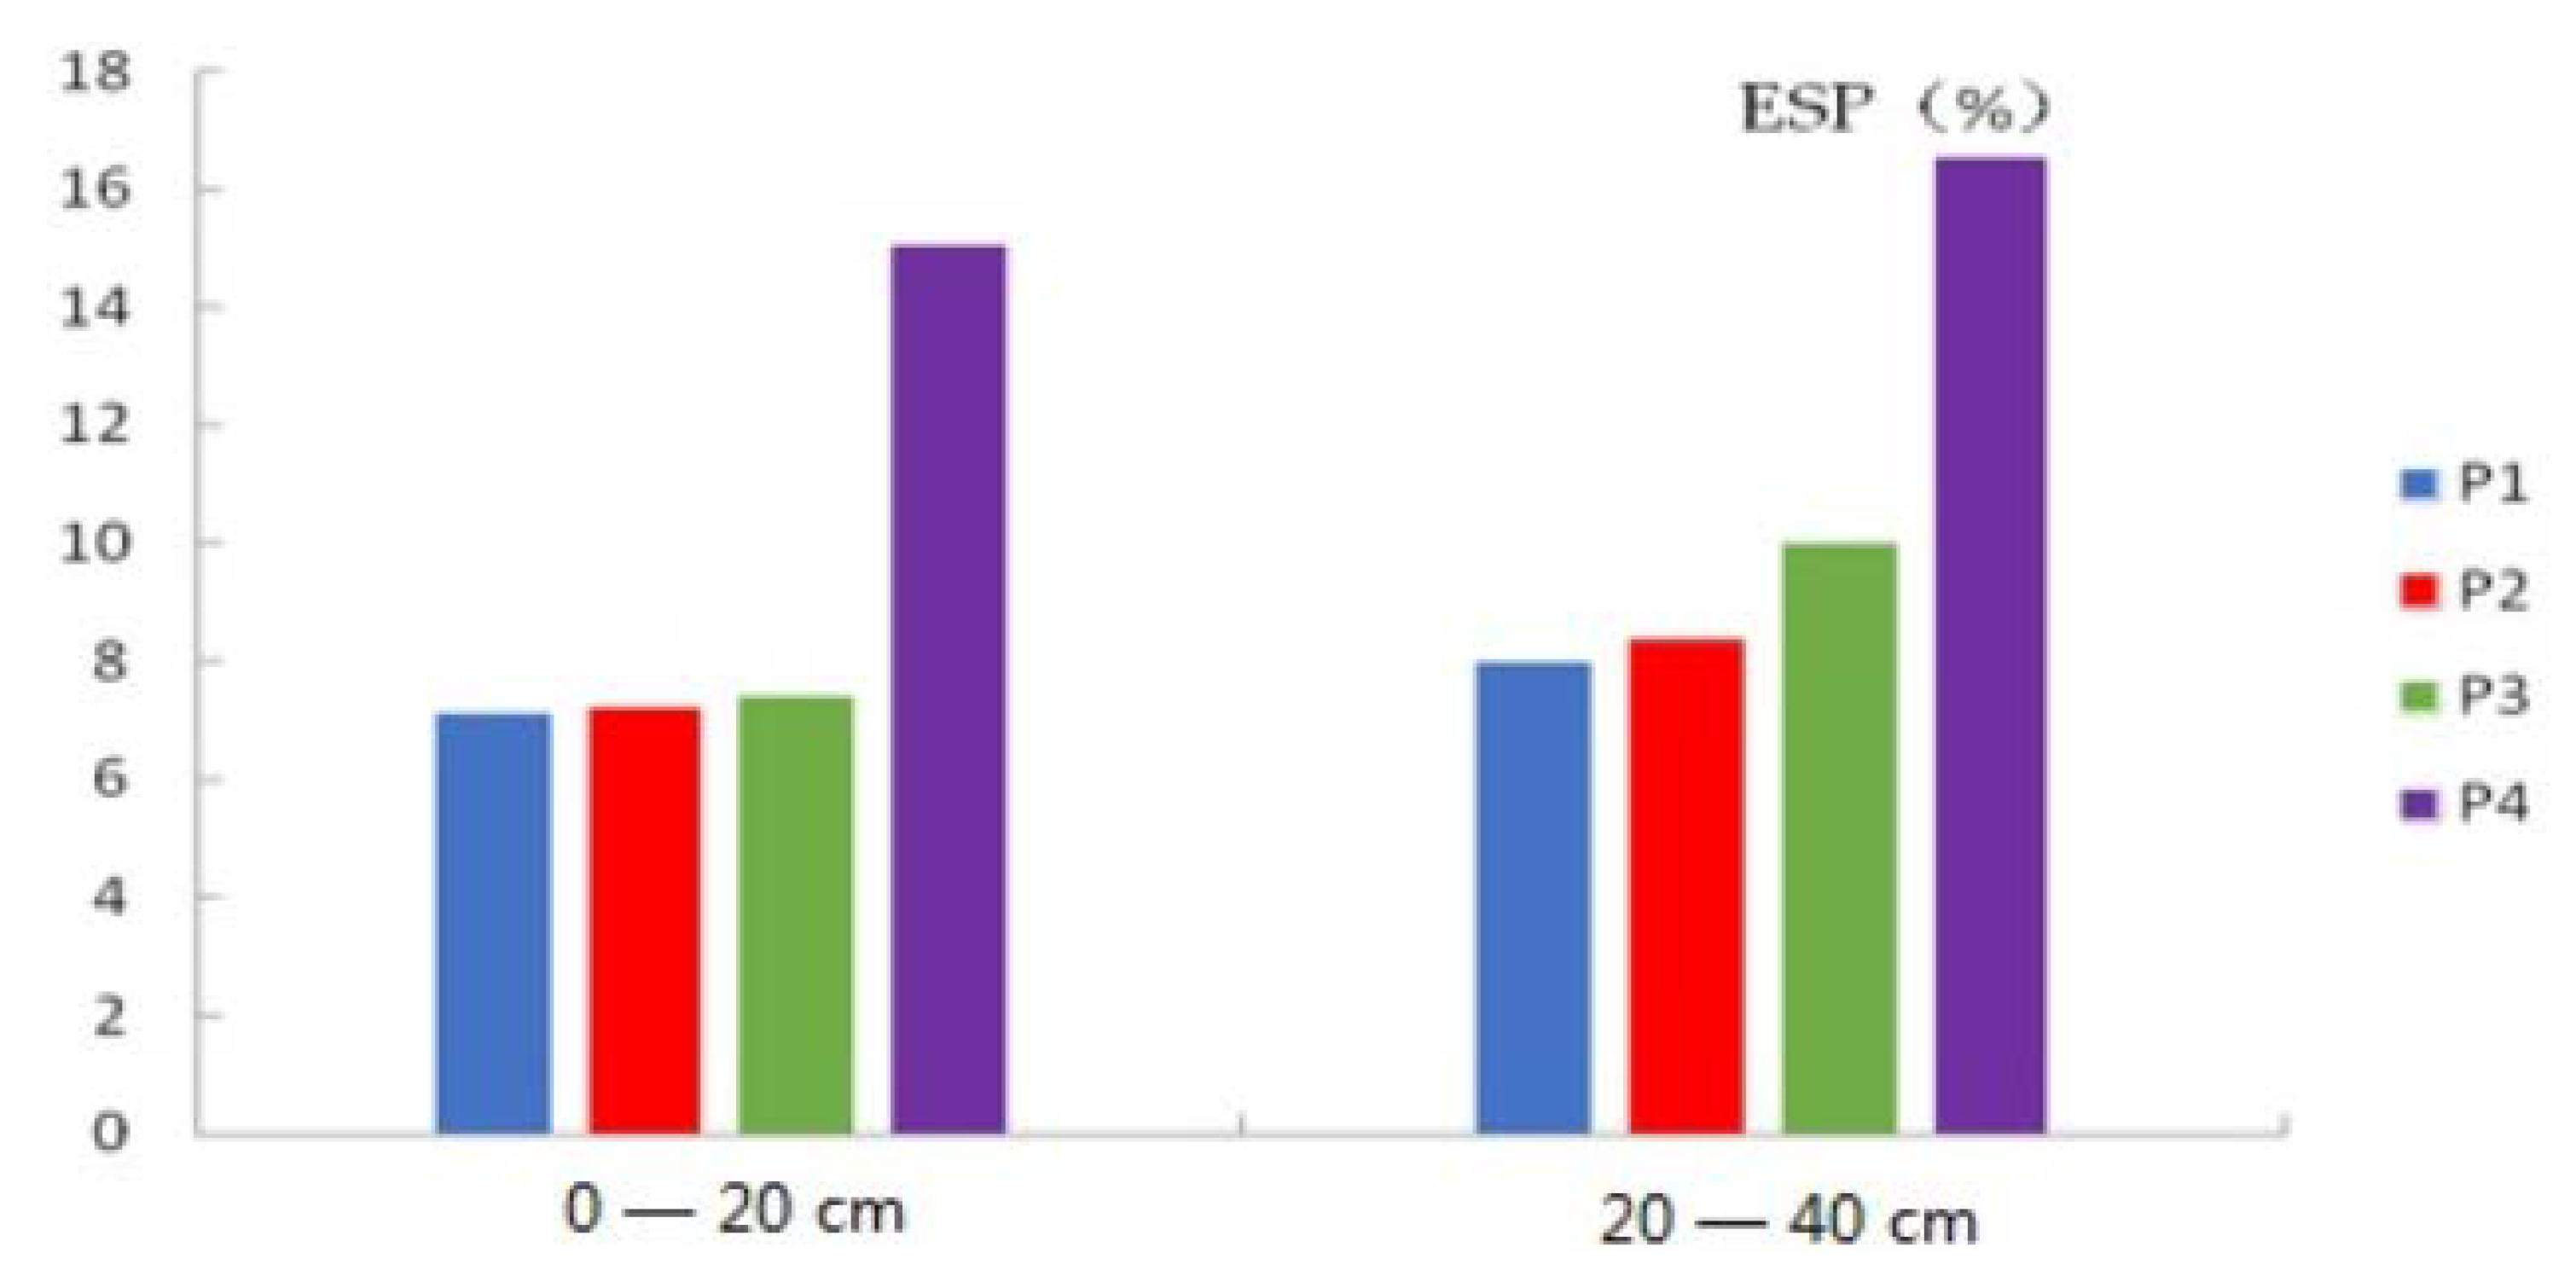
3.1. Characteristics of the SOC and Soil Alkalinity

Referring to the International Alkali Soil Partition Standard [9], soil with ESP between 5% to 20% is defined as alkaline soil (5% to 10% for mildly alkaline soil, 10% to 15% for moderately alkaline soil, and 15% to 20% for heavily alkaline soil). The P1, P2, and P3 samples were weakly alkaline soils, while the P4 sample was strongly alkaline soil with ESP showing P4 > P3 > P2 > P1. The vertical distribution of ESP showed that ESP in a deeper layer was higher than that in the surface layer, i.e., 20 to 40 cm was higher than that in the surface layer (Figure 3).
As shown in Figure 4, the overall average SOC content in the four samples was 14.74 g kg−1, while the maximum and minimum values of P1 and P4 samples were 22.36 g kg−1 and 9.24 g kg−1, respectively. The SOC content of each sample in the 0 to 20 cm soil layer was higher than that in the 20 to 40 cm soil layer, which showed a certain surface enrichment phenomenon. The trend of the SOC content among four samples was P1 > P2 > P3 > P4. In the P1 and P2 samples, the SOC content in the upper layer was close to that in the lower layer, and it was significantly higher than that in the other two samples, which could be caused by the relatively average mechanical composition and better heat transfer performance of the upper-layer soil. The soil quality conditions of these two samples were relatively good. The Pearson correlation analysis showed that there was a significant negative correlation between the SOC content and salinization (Figure 4). In the 0 to 20 cm soil layer, the SOC contents of P1, P2, and P3 samples were 1.55, 1.47, and 1.31 times higher than that of the P4 sample, respectively. In the 20 to 40 cm soil layer, the organic carbon contents of P1, P2, and P3 samples were 2.09, 2.02, and 1.5 times higher than that of the P4 sample, respectively. Univariate analysis of variance (ANOVA) showed that alkalinity had a higher effect on the SOC content in deep soil than that in surface soil. The differences of the SOC content between different soil samples and different depth samples mainly depend on the differences of alkalinity.

3.2. SOC Mineralization Rate

The results of 70 days incubation monitoring experiments showed that the mineralization rate of the SOC in all treatments was approximately the same with the incubation time, and the release rate of CO2 showed a tendency of first increasing and then decreasing (Figure 5), which was consistent with the previous findings [35,36]. According to the decreasing rate of the SOC, the mineralization rate can be divided into three stages. In Stage I of incubation (one to seven days), the content of CO2 production was high, and from the first day it became rapid decline, but overall at a higher level. In Stage II of incubation (7 to 35 days), the microbial activity was in a stable dynamic equilibrium under suitable temperatures and nutrient conditions. Figure 5 shows that the CO2 production rate fluctuates slightly at this stage, but it is basically at a relatively stable level. On the fourth and 35th day, the CO2 production rate was 0.03 to 0. 12 g kg−1 d and 0.02 to 0.13 g kg−1 d, respectively. In Stage III (the 35th to 70th day), the rate of CO2 production decreased significantly, and the mineralization rate of each sample gradually decreased at the later stage of incubation, and finally reached the lowest point on the 70th day, which was around 7.54 to 10.79 times of the initial value.
As the extent and level of soil salinization were different, obviously, the SOC mineralization rate also shows its own characteristics respectively. On the whole, the higher the degree of soil salinization was, the lower the SOC mineralization rate. Although there were some fluctuations in different incubation stages, the average SOC mineralization rate was generally P1 > P2 > P3 > P4. The content of clay also affected the carbon mineralization rate, i.e., the higher the clay content, the faster the mineralization rate, which was consistent with the results of Muller et al. [37]. Figure 5 shows that the SOC mineralization rates of each stage of the four samples were higher than that of the bottom layer. The initial (the first day of the incubation period) CO2 release rates of 0 ot 20 cm were P2 (2.123 g kg−1 d) > P1 (1.639 g kg−1 d) > P3 (1.514 g kg−1 d) > P4 (1.162 g kg−1 d), which was consistent with the trend of C/N (Table 2). However, at the end of the incubation experiment, the SOC mineralization rate was P1 (0.162 g kg−1 d) > P2 (0.160 g kg−1 d) > P3 (0.158 g kg−1 d) > P4 (0.125 g kg−1 d), which was consistent with the trend of the SOC contents (Table 2).

3.3. SOC Mineralization and Kinetic Equation Simulation

In all the soil incubation experiments with different salinity, the accumulative release of CO2 followed the first-order kinetic model: Ct = C0 (1 − e−kt) with time, the curve was fitted well, and the R2 value ranged from 0.98 to 0.99. The results of the processing fitting parameters are shown in Table 3.

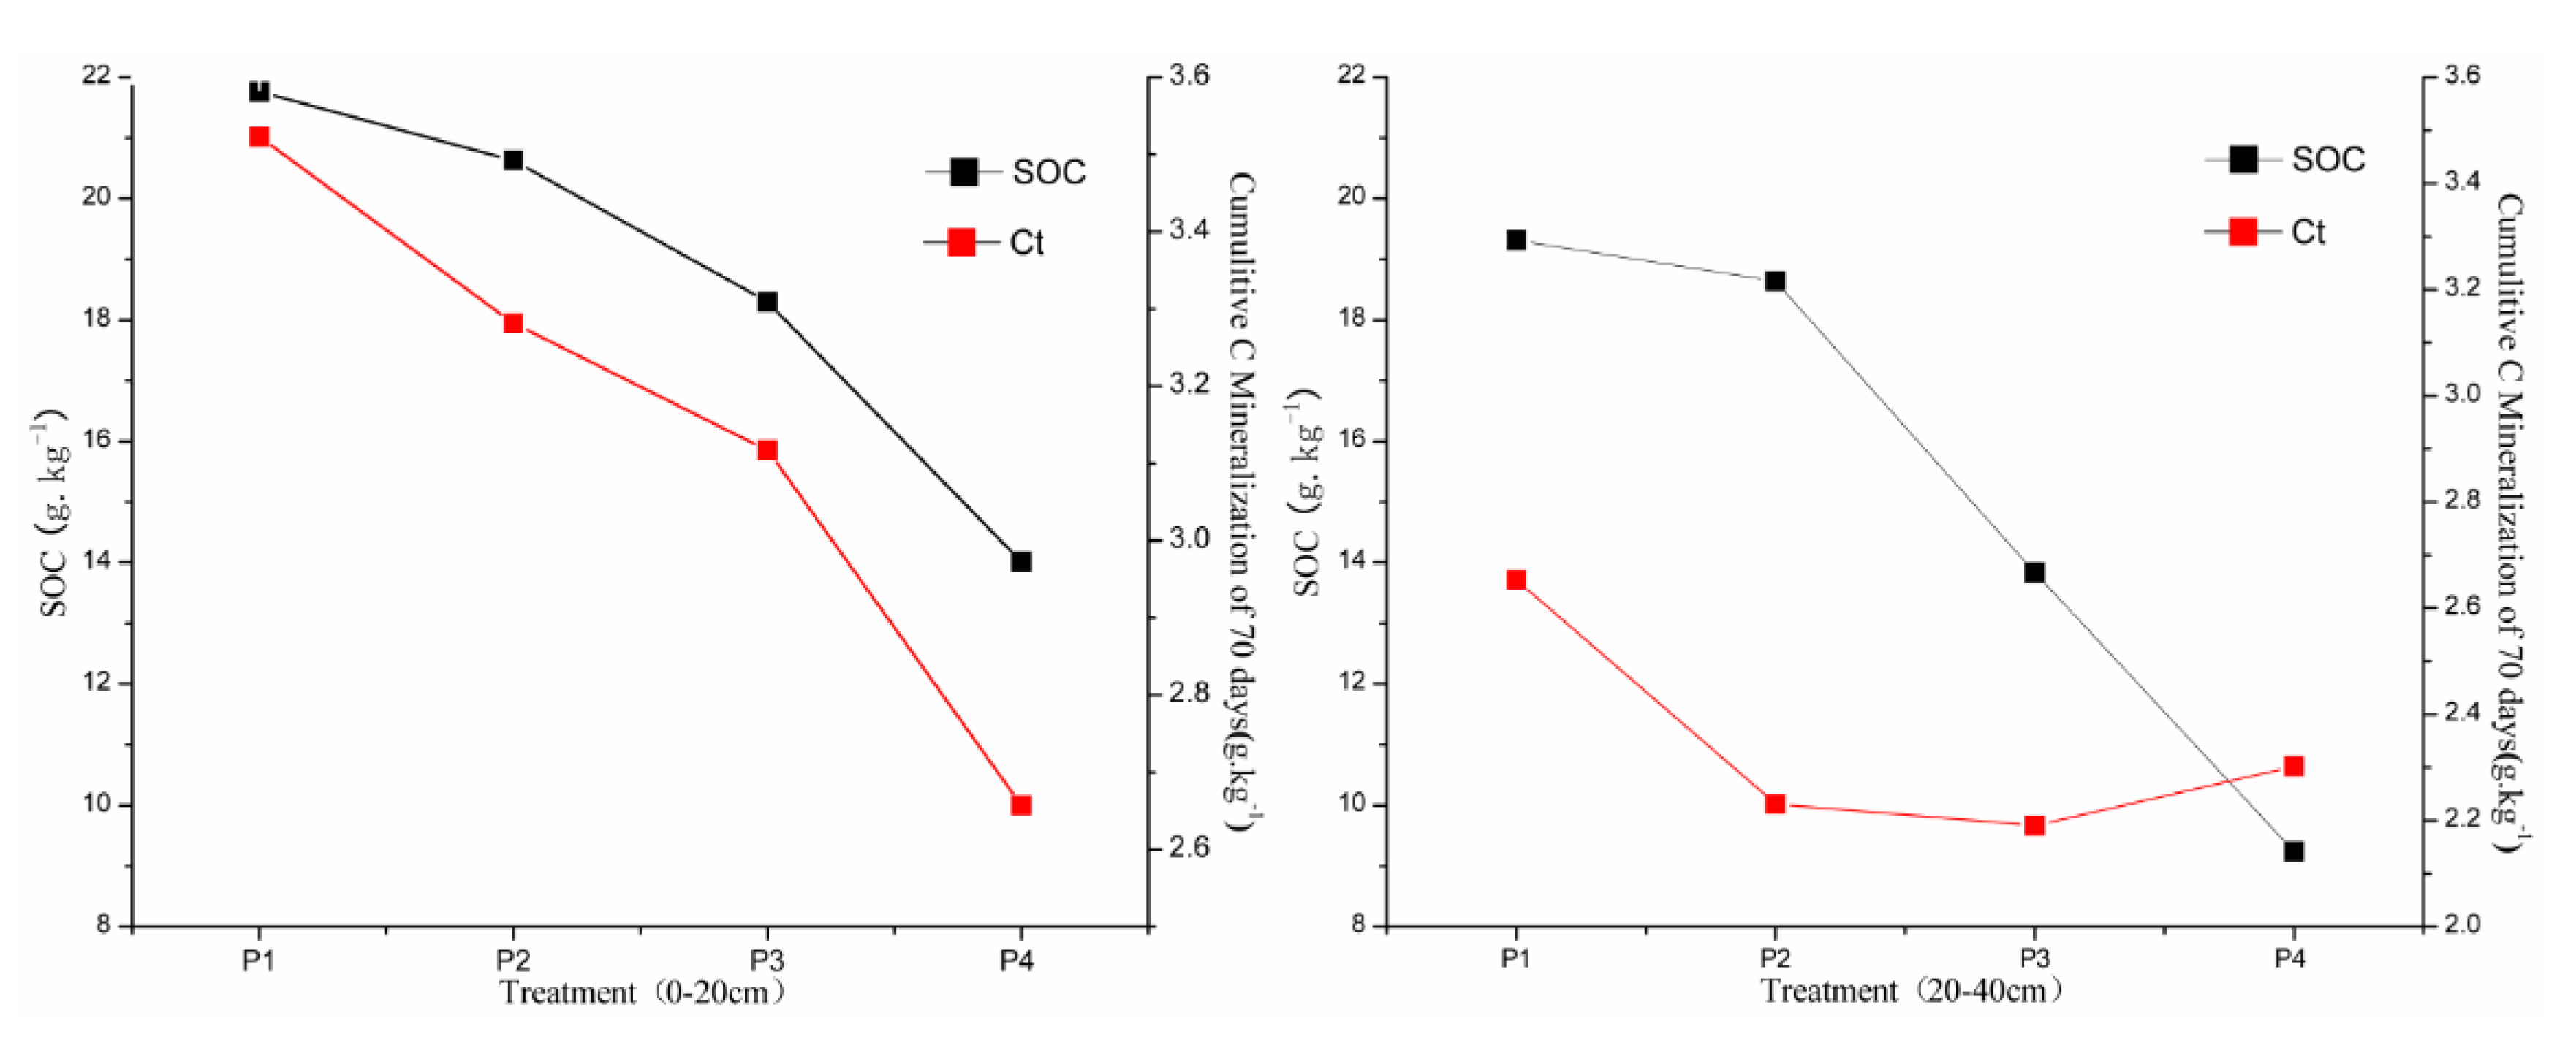
3.4. Accumulated SOC Mineralization Amount

The accumulated SOC mineralization amount refers to the total CO2 release (CO2-C) of soils from the beginning of incubation to a certain time point. The accumulated trend of CO2-C in each sample is approximately the same (Figure 6). The slope of mineralization accumulation is initially large, then gradually decreases, and finally tends to be gentle after a period of time. The CO2-C increased with the increase of incubation time, the intensity increased in the early stage, and the accumulation rate was faster and reached the same rate. At the 35th day, the CO2-C accounted for 81.97% to 83.83% of the whole incubation stage. At the end of the incubation period, the accumulation of CO2 tended to be gentle and approached the end point of accumulation. By the end of culture (70 days), the accumulated SOC mineralization amount in the four samples reached 3.52, 3.28, 3.12, and 2.66 g kg−1, respectively, taking the surface soil as an example. The total CO2-C of all the samples was P1 > P2 > P3 > P4, and the total CO2-C in the surface layer was significantly higher than that in the bottom layer, except for P4 (Table 2 and Figure 6). In the 0 to 20 cm soil layer, there was a significant difference in the total CO2-C between the P4 sample and the other three samples (p < 0.05), that is, P4 was lower than that in P1 0.87, P2 0.62, and P3 0.46 g kg−1, respectively. There was no significant difference in soil CO2-C among the P1, P2 and P3 samples (Table 3). In the soil layer of 20 to 40 cm, there was no significant difference in CO2-C among the four samples, and the total CO2-C was no longer consistent with the change of the SOC content (Table 3 and Figure 7). At the end of incubation period, CO2-C were significantly different in all ESP samples (p < 0.05), and highly negatively correlated with ESP (r = −0.838) (Table 3 and Table 4). With the increase of the extent of salinization and alkalinity, the soil accumulated mineralization amount tended to decrease, and the higher the extent of soil salinization was, the more disadvantageous it was with the SOC mineralization and decomposition.

3.5. Mineralization Potential of SOC

The accumulated SOC mineralization amount represents the amount of CO2 produced by mineralization, while the SOC mineralization potential represents the amount of CO2 released by the mineralization process under ideal conditions. The analysis of variance showed that the result of C0 of every sample was significantly different (p < 0.05) (Table 3), and the P4 sample was significantly lower than the other three. Compared with the same soil layer in different samples, the C0 value was P1 > P2 > P3 > P4. For the same sample but different soil layers, the C0 values in the 0 to 20 cm soil layer were higher than that of the 20 to 40 cm soil layer, Ct/C0 was 0.822 to 0.917, and the result was (Ct/C0) 0 to 20 cm < (Ct/C0) 20 to 40 cm except P4 (Table 3). This indicated that the soil active organic carbon components mainly existed in the surface layer, the mineralizable part of the soil did not completely react, and the complete extent of mineralization in the surface soil was higher than that in the bottom layer. According to the Pearson correlation analysis, C0 was significantly positively correlated with the SOC content and negatively correlated with alkalinity. As shown in Figure 7, the variation trend of C0 and the SOC content are basically the same, which indirectly indicates that the saline–alkali of soil affects its organic carbon content, and thus affects the SOC mineralization potential.

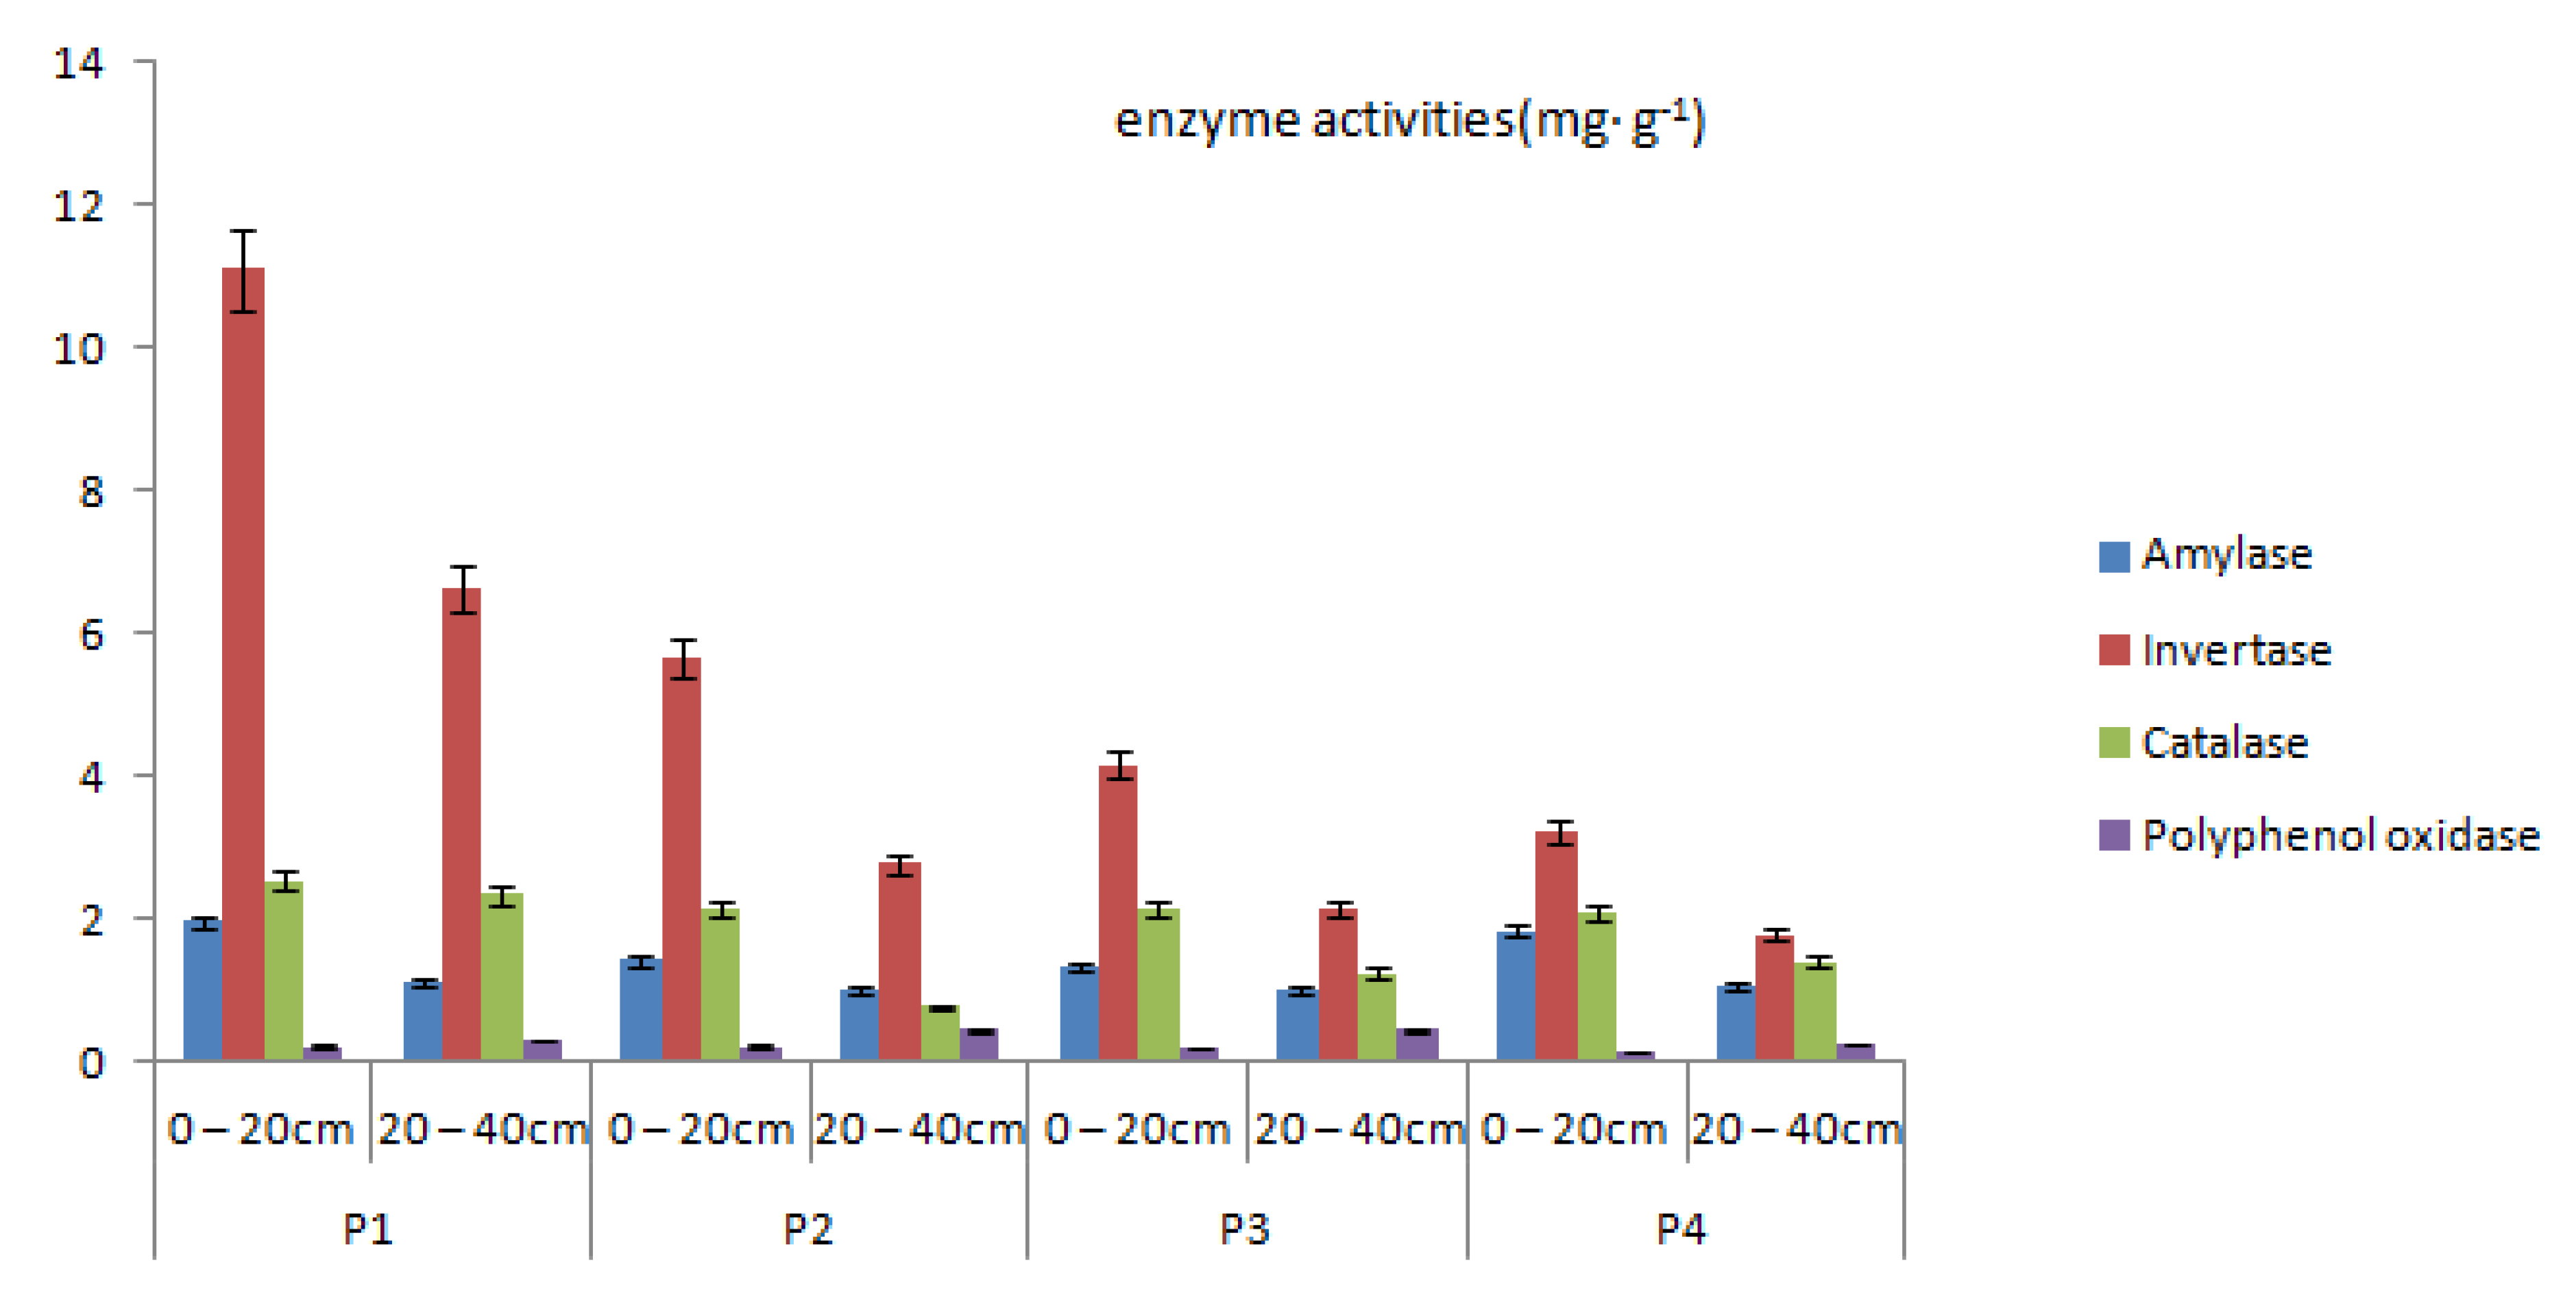
3.6. Soil Enzyme Activities

For the values of amylase, invertase, catalase, and polyphenol oxidase activities, the results were 1.32 to 1.94, 3.21 to 11.09, 2.09 to 2.53, and 0.12 to 0.21 (mg g−1), respectively, in the topsoil; and 1.00 to 1.10,1.76 to 6.63, 0.77 to 2.33, and 0.23 to 0.45 (mg g−1), respectively, in the subsoil (Figure 8). The polyphenol oxidase activities, in the topsoil were less than those of the subsoil in most plots. In the meantime, the difference of polyphenol oxidase activities between soil layers was not as significant as the other three enzymes.

4. Discussion

4.1. Soil Enzyme Activities

The change of the SOC content is affected by climate conditions and soil background nutrients in the study area. Organic carbon mainly comes from residues of plants, animals, microbial, and root exudates, and its content varies in the dynamic process of continuous decomposition and formation [38]. The characteristics of the SOC content in paddy fields in the Qianguo Irrigation area showed obvious surface enrichment characteristics, which are consistent with the results of Jobbagy et al. [39]. They found that the SOC reserves corresponded to 615 Gt carbon at the surface to 0.2 m deep and 2344 Gt carbon at depths up to 3 m [39]. For paddy field soils, root system development is relatively short and dense, organic matter return amount and soil root exudates are relatively concentrated in the surface layer, which is the main source of organic carbon content. In the deeper soil profile, the decrease of substrate required for microbial activity slows down its activity and material cycle, and the SOC content is reduced [40]. The effect of salinization in the profile is also a factor affecting the vertical distribution of the SOC content. The higher the salinization degree is, the lower the corresponding organic carbon content. On the one hand, with different effects of salinization, the physicochemical properties of the soil undergo a series of changes, showing texture consolidation and poor permeability of the soil, which hinder the extension and growth of the root system and thus reduce root exudates. On the other hand, because the SOC content is strongly dependent on root biomass, it is understood that the adverse effects of soil salinization on plant health is the result of a lower SOC content [9]. In medium to high salinity soils, changes in salinity also affect soil properties and material cycles, such as plant growth, organic matter accumulation, and SOC accumulation density. The alkaline soil environment destroyed the living environment of microorganisms, inhibited life activities, affected the decomposition and humification of plants, animal residues and litters, and reduced the recovery of organic matters in soil. For the study area of the west Jilin Province, its special saline–alkali property may be the main reason for the low SOC content.

4.2. Effects of Soil Salinization on SOC Mineralization Characteristics

The SOC mineralization process, driven by enzymes and microorganisms, is the key process of the soil carbon cycle [38]. In the first stage of the incubation, the SOC mineralization was more intense, due to the high content of active organic substances such as carbohydrate and protein in the soil at the early stage of mineralization after preincubation, which provided abundant carbon sources and nutrients for soil microbes. The microbial activity was at a higher level and the decomposition rate was faster. Promoting microbial activity or changing microbial communities enhances the SOC mineralization and affect the SOC stability through symbiosis [41]. In Stage II, the microbial activity was in a stable dynamic equilibrium state under the suitable temperature and nutrient condition. At the end of incubation, the reduction organic matter and available carbon sources limited the microbial activity with the prolongation of culture time, and the SOC mineralization rate showed a decreasing trend [9,42,43]. During the seven to ten days in the incubation stage, all treatments had a short period of accelerated mineralization rate, which could have been due to the strong mineralization reaction in the early stage, causing the intensity of available nutrients and water consumption in the soil to be high. On the seventh day, the soil moisture content increased suddenly after adding water to adjust the moisture content in the experimental bottle, and the microbial activity showed a transient active state. This phenomenon also appeared in the experiments of Zimmerman et al., and the accelerated release of CO2 in the early stage of incubation was due to soil rewetting [44]. The changes of the soil moisture content increased soil microbial biomass and its activity, thus promoting SOC mineralization [39,41].
In this study, in the 0 to 20 cm soil layer, the SOC accumulation mineralization, mineralization reaction complete degree, and average mineralization reaction intensity were higher than those in the 20 to 40 cm soil layer. The soil surface layer is dominated by the active carbon fraction, which is relatively low in years and circulates faster, while the bottom soil is dominated by the old slow cycle inert carbon, which is commonly referred to as the passive SOC component. The SOC decomposition in the deep soil would be greatly reduce [39]. Moreover, the low substrate content, weak microbial activity, and slow SOC conversion in the bottom layer are mostly due to the scarcity of fresh carbon (plant litter and exudates). The same results were obtained by previous similar experiments [40,45]. In addition, in the 20 to 40 cm soil layer, the kinetic fitting parameter R2 values were higher than those of the 0 to 20 cm soil layer by the first-order dynamics simulation. Under the conditions of the same temperature, water content, and soil quality, the correlation coefficient of Pearson was analyzed and compared. The results showed that the effects of pH and EC in soil environment on the mineralization reaction are much smaller than those on organic carbon content and soil alkalinity. In saline–alkaline soil, on the one hand, soluble ions are mainly HCO3− and CO32− [46], and the electrolysis and hydration reaction occur continuously, which promote the pH alkalinity of the soil microsystem. Under this condition, the enzyme activity is inhibited [47], the activity and process of microorganism are weakened, and the rate of mineralization reaction and accumulation process are slowed down. On the other hand, HCO3 and CO32− in soil microsystems continue to occur in the process of ionization and water summation [48,49], which forces the energy originally used in the carbon cycle process to be transferred partly for ion reactions, and decreases in energy also directly limit the mineralizability of the soil [50]. The effect of CH4 and other gas flux on carbon concentrations was not considered in this experiment due to the climatic conditions of the study area. The results can provide the data support and theoretical basis for understanding the carbon sink/source and the carbon cycle mechanism of the paddy fields in saline–alkali areas.

4.3. Evaluation of First-Order Dynamics of the SOC Mineralization Process

The SOC mineralization process is also the process of decomposition. The stronger the mineralization ability is, the greater the loss of carbon [51]. According to the results, with the increasing soil salinity, the SOC mineralization amount and the rate become lower. Did this result indicate that saline–alkaline soil was beneficial to the sequestration of SOC? Obviously not. First, the content of organic carbon in the strongly saline–alkaline soil was much lower than that in the weakly saline–alkaline soil, and the SOC content was the main influencing factor of soil organic carbon mineralization with a positive correlation. In this study, we evaluated the carbon sequestration capacity of soils with different saline–alkali degrees by the mineralized amount per unit of SOC [52,53]. As shown in Table 3 and Table 4, in this study, the Ct/SOC values were significantly different among different plots and were positively correlated with the alkalinity. The Ct/SOC of soils in various plots showed P2 < P1 < P3 < P4, and the surface and deep soils also showed this pattern. The SOC content might not always be consistent with carbon sequestration ability, and the stronger the saline–alkali soil was, the easier it produced carbon source, but the more unfavorable it was to carbon sequestration. We also found that the characteristics of the P4 plot were a low organic carbon content and a low total amount of CO2 released by the SOC mineralization, but its C0/SOC was relatively high. This indicated that the utilization of organic carbon in the soil was very high, but its total CO2-C was very low because of its serious salinization and alkalinity, and the utilization of organic matter was restricted. In Table 4, according to the correlation coefficient of alkalinity with C0 and C0/SOC, it can be concluded that the effect of soil salinization and alkalinity on carbon sequestration was greater than that of the carbon source process.
Correlation analysis showed that the turnover rate constant (k) of organic carbon pool was correlated with the physicochemical properties of the soil, the characteristic value and parameter of carbon mineralization, which was consistent with those results by Quan et al. and Trinsoutrot et al. [54,55]. The k value was affected by soil type, nutrient content, particle composition, and pH value, and was also related to soil parent material and the effect of long-term fertilization on k value was not significant [55]. There were significant differences in the k value between different plots (p < 0.05) (Table 4). The organic carbon turnover rate constant k was highly positively correlated with ESP, moderately positively correlated with EC and C0/SOC, and negatively correlated with total organic carbon (TOC), pH value (Table 4). The degree of salinization is the main factor affecting the turnover rate of organic carbon pool, followed by C0/SOC (soil carbon sequestration capacity).

4.4. Effects of Soil Enzyme Activities on the SOC Content and Mineralization

The formation and mineralization of soil organic carbon are impacted by almost all enzyme activities. Many studies have shown that soil enzyme activities were related to the changes of natural organic carbon contents in different terrestrial ecosystems. Therefore, they play an important role in the soil carbon cycles [56,57]. Some hydrolases can catalyze the hydrolysis of polysaccharides, release monosaccharides, provide available carbon and energy support for life activities such as microorganisms, and thus affect plants growth [58,59,60]. Soil oxidoreductase can catalyze the redox reaction in soils and participate in soil carbon cycles. In this paper, two hydrolytic enzymes, amylase and sucrase, and two oxidoreductase, catalase and polyphenol oxidase, which are closely related to soil carbon cycles, were selected to study the effects of their activities on soil organic carbon.
Soil amylase, a catalyst for the primary decomposition of starch organic matter in soil, can catalyze starch decomposition into oligosaccharides, which is conducive to the uptake of nutrients and energy by living organisms such as soil microorganisms. When the soil microbial biomass increased, it promoted the decomposition of some organic litters, thus increased the content of organic carbon in soils. The substrate catalyzed by soil sucrase was sucrose polysaccharide, and its catalytic decomposition products were glucose and fructose. Soil invertase was also involved in the synthesis and transformation of soil carbon, which was related to soil humification and soluble organic matter. As an important kind of enzyme in soil, hydrolase can characterize the microbial biomass and activities related to the carbon transformation and play a key role in soil carbon changes. Because paddy soils are flooded for a long period of time, which leads to the accumulation of hydrogen peroxide, a large amount of catalase is needed to catalyze the decomposition of hydrogen peroxide to reduce the toxicity. This effect is helpful to the accumulation of soil organic carbon [61]. Because of the low activities of polyphenol oxidase in the paddy fields, its effect on soil organic carbon was not significant.

5. Conclusions

On the basis of the four sample experiments of this study, the variations of salinization and alkalinity degrees show obviously different impacts on the mineralization process of organic carbon. The higher the degree of salinization and alkalinity, the weaker the mineralization and decomposition of SOC. The ability of soil carbon sequestration, the turnover rate of organic carbon pool, and the potential of the SOC mineralization are all weakened by saline–alkali stress. The following conclusions are made:
1.
The SOC content of the surface layer in the paddy fields in Qianguo irrigation area is higher than that of the bottom layer, showing the phenomenon of surface enrichment. The higher the degree of soil alkalinity, the lower the SOC content, and the greater the effect on the SOC content in the bottom layer.
2.
In the 70-day mineralization incubation experiment, the rate of CO2 release from the soil in the irrigated area show a tendency of first high and then reduced. The results of the incubation simulations are consistent with the first-order kinetic equation (Ct = C0 (1 − e−kt)).
3.
For enzyme activities, amylase, and invertase are significantly positively correlated with the SOC content, and the difference of polyphenol oxidase activities between different soil layers is not as significant as the other enzymes.
4.
The soil salinization and alkalinity is unfavorable to the SOC mineralization, and the extent of influence is related to the effects of saline–alkali, which is an important factor affecting the turnover of organic carbon pool, and the influence on the carbon sink is greater than that on the carbon source process.

Author Contributions

S.W., J.T., and Z.L. designed the research; Y.L. and Z.Z. tested the samples; J.W. and Y.Q. analyzed the data; Z.D. drafted the manuscript which was revised by J.T. and Y L.; and Z.D. modified the paper. All authors have read and approved the final manuscript.

Funding

This research was supported by National Natural Science Foundation of China (nos. 51179073 and 41471152) and the Specialized Research Fund for Doctoral Program of Higher Education (20130061110065).

Conflicts of Interest

The authors declare no conflict of interest.

References

  1. Zhang, J.; Qiao, W.; Gao, D.; Dai, Y.; Deng, J.; Yang, G.; Han, X.; Ren, G. Temperature sensitivity of soil carbon dioxide and nitrous oxide emissions in mountain forest and meadow ecosystems in China. Atmos. Environ. 2016, 142, 340–350. [Google Scholar] [CrossRef]
  2. Tate, K.R.; Ross, D.J.; Saggar, S.; Hedley, C.B.; Dando, J.; Singh, B.K.; Lambie, S.M. Methane uptake in soils from Pinus radiata plantations, a reverting shrubland and adjacent pastures: Effects of land-use change, and soil texture, water and mineral nitrogen. Soil. Biol. Biochem. 2007, 39, 1437–1449. [Google Scholar] [CrossRef]
  3. Dai, Z.; Viswanathan, R.; Pan, F.; Ampomah, W.; Yang, C.; Jia, W.; Xiao, T.; Lee, S.Y.; McPherson, B.; Griqq, R.; et al. CO2 Accounting and Risk Analysis for CO2 Sequestration at Enhanced Oil Recovery Sites. Environ. Sci. Technol. 2016, 50, 7546–7554. [Google Scholar] [CrossRef] [PubMed]
  4. Shang, H.; Wang, W.; Dai, Z.; Duan, L.; Zhao, Y.; Zhang, J. An ecology-oriented exploitation mode of groundwater resources in the northern Tianshan Mountains, China. J. Hydrol. 2016, 543, 386–394. [Google Scholar] [CrossRef]
  5. Wang, Y.; Li, Y. Land exploitation resulting in soil salinization in a desert–oasis ecotone. Catena 2013, 100, 50–56. [Google Scholar] [CrossRef]
  6. Lehner, B.; Döll, P.; Alcamo, J.; Henrichs, T.; Kaspar, F. Estimating the impact of global change on flood and drought risks in Europe: A continental, integrated analysis. Nat. Clim. Chang. 2006, 75, 273–299. [Google Scholar] [CrossRef]
  7. Lou, Y.; Pan, Y.; Gao, C.; Jiang, M.; Lu, X.; Xu, Y.J. Response of Plant Height, Species Richness and Aboveground Biomass to Flooding Gradient along Vegetation Zones in Floodplain Wetlands, Northeast China. PLoS ONE 2016, 11, e0153972. [Google Scholar] [CrossRef]
  8. Sim, L.L.; Davis, J.A.; Chambers, J.M. When is it too salty for saline wetlands? Conceptual models for the examination of ecological regime shifts in saline wetlands. In Proceedings of the 29th Congress of the International-Association-of-Theoretical-and-Applied-Limnology, Lahti, Finland, 8–14 August 2004. [Google Scholar]
  9. Zhang, J.; Li, Z.; Ning, T.; Gu, S. Methane uptake in salt-affected soils shows low sensitivity to salt addition. Soil. Biol. Biochem. 2011, 43, 1434–1439. [Google Scholar] [CrossRef]
  10. Garssen, A.G.; Pedersen, A.B.A.; Voesenek, L.A.C.J.; Verhoeven, J.A.; Soons, M.B. Riparian plant community responses to increased flooding: A meta-analysis. Glob. Chang. Biol. 2015, 21, 2881–2890. [Google Scholar] [CrossRef]
  11. Tang, J.; Wang, J.; Li, Z.; Wang, S.; Qu, Y. Effects of irrigation regime and Nitrogen fertilizer management on CH4, N2O and CO2 emissions from saline–alkaline paddy fields in Northeast China. Sustainability 2018, 10, 475. [Google Scholar] [CrossRef] [Green Version]
  12. Sanderman, J.; Hengl, T.; Fiske, G.J. Soil carbon debt of 12,000 years of human land use. Proc. Natl. Acad. Sci. USA 2017, 114, 9575–9580. [Google Scholar] [CrossRef] [Green Version]
  13. Wu, H.; Guo, Z.; Gao, Q.; Peng, C. Distribution of soil inorganic carbon storage and its changes due to agricultural land use activity in China. Agric. Ecosyst. Environ. 2009, 12, 413–421. [Google Scholar] [CrossRef]
  14. Li, Z.; Zhang, R.; Wang, X.; Wang, J.; Zhang, C.; Tian, C. Carbon dioxide fluxes and concentrations in a cotton field in Northwestern China: Effects of plastic mulching and drip irrigation. Pedosphere 2011, 21, 178–185. [Google Scholar] [CrossRef]
  15. Joseph, S.D.; Camps-Arbestain, M.; Lin, Y.; Munroe, P.; Chia, C.H.; Hook, J.; van Zwieten, L.; Kimber, S.; Cowie, A.; Singh, B.P.; et al. An investigation into the reactions of biochar in soil. Aust. J. Soil Res. 2010, 48, 501–515. [Google Scholar] [CrossRef]
  16. Pan, G.; Smith, P.; Pan, W. The role of soil organic matter in maintaining the productivity and yield stability of cereals in China. Agric. Ecosyst. Environ. 2009, 129, 344–348. [Google Scholar] [CrossRef]
  17. Wei, X.; Ma, T.; Wang, Y.; W., Y.; Hao, M.; Shao, M.; Zhang, X. Long-term fertilization increases the temperature sensitivity of OC mineralization in soil aggregates of a highland agroecosystem. Geoderma 2016, 272, 1–9. [Google Scholar] [CrossRef]
  18. Kéraval, B.; Lehours, A.C.; Colombet, J.; Amblard, C.; Alvare, Z.; Fontaine, S. Soil carbon dioxide emissions controlled by an extracellular oxidative metabolism identifiable by its isotope signature. Biogeosciences 2016, 13, 6353–6362. [Google Scholar] [CrossRef] [Green Version]
  19. Blankinship, J.C.; Becerra, C.A.; Schaeffer, S.M.; Schimel, J. Separating cellular metabolism from exoenzyme activity in soil organic matter decomposition. Soil Biol. Biochem. 2014, 71, 68–75. [Google Scholar] [CrossRef]
  20. Kéraval, B.; Fontaine, S.; Lallement, A.; Revaillot, S.; Billard, H.; Alvarez, G.; Maestre, F.; Amblard, C.; Lehours, A.C. Cellular and non-cellular mineralization of organic carbon in soils with contrasted physicochemical properties. Soil Biol. Biochem. 2018, 125, 286–289. [Google Scholar] [CrossRef]
  21. Ma, Y.F.; Gao, Y.H.; Feng, Q.L. Effects of pH and temperature on CaCO3 crystallization in aqueous solution with water soluble matrix of pearls. J. Cryst. Growth 2010, 312, 3165–3170. [Google Scholar] [CrossRef]
  22. Varadhrajan, C.; Tinnacher, R.M.; Pugh, J.D.; Trautz, R.C.; Zheng, L.; Spycher, N.F.; Birkholzer, J.T.; Castillo-Michel, H.; Esposito, R.A.; Nico, P.S. A laboratory study of the initial effects of dissolved carbon dioxide (CO2) on metal release from shallow sediments. Int. J. Greenh. Gas Control 2013, 19, 183–211. [Google Scholar] [CrossRef]
  23. Serrano-Ortiz, P.; Roland, M.; Sanchez-Moral, S.; Janssens, I.A.; Domingo, F.; Godderis, Y.; Kowalski, A.S. Hidden, abiotic CO2 flows and gaseous reservoirs in the terrestrial carbon cycle: Review and perspectives. Agric. For. Meteorol. 2010, 150, 321–329. [Google Scholar] [CrossRef]
  24. Yang, W.; Yang, M.; Wen, H.; Jiao, Y. Global Warming Potential of CH4, uptake and N2O emissions in saline–alkaline soils. Atmos. Environ. 2018, 191, 172–180. [Google Scholar] [CrossRef]
  25. Zhao, X.; Zhao, C.; Wang, J.; Stahr, K.; Kuzyakov, Y. CaCO3 recrystallization in saline and alkaline soils. Geoderma 2016, 282, 1–8. [Google Scholar] [CrossRef]
  26. Gorai, M.; Vadel, A.M.; Neffati, M.; Khemira, H. The effect of sodium chloride salinity on the growth, water status and ion content of Phragmites communis trin. Pak. J. Biol. Sci. 2007, 10, 2225–2230. [Google Scholar] [CrossRef] [Green Version]
  27. Pagter, M.; Bragato, C.; Malagoli, M.; Brix, H. Osmotic and ionic effects of NaCl and Na2SO4 salinity on Phragmites australis. Aquat. Bot. 2009, 90, 43–51. [Google Scholar] [CrossRef]
  28. Zhou, C.; Shen, W.; Lu, C.; Wang, H.; Xiao, Y.; Zhao, Y.; An, S. Effects of Salinity on the Photosynthesis of Two Poaceous Halophytes. Clean Soil Air Water 2015, 43, 1660–1665. [Google Scholar] [CrossRef]
  29. Shi, D.; Sheng, Y. Effect of various salt–alkaline mixed stress conditions on sunflower seedlings and analysis of their stress factors. Environ. Exp. Bot. 2005, 54, 8–21. [Google Scholar] [CrossRef]
  30. Yang, C.; Chong, J.; Li, C.; Kim, C.M.; Shi, D.; Wang, D. Osmotic adjustment and ion balance traits of an alkali resistant halophyte Kochia sieversiana during adaptation to salt and alkali conditions. Plant Soil 2007, 294, 263–276. [Google Scholar] [CrossRef]
  31. Li, B.; Wang, Z.; Sun, Z.; Chen, Y.; Yang, F. Resources and sustainable resource exploitation of salinized land in China. Agric. Res. Arid Areas 2005, 23, 154–158. (In Chinese) [Google Scholar]
  32. Zhang, H.; Tang, J.; Liang, S.; Li, Z.; Yang, P.; Wang, J.; Wang, S. The emissions of carbon dioxide, methane, and Nitrous Oxide during winter without cultivation in local saline-alkali rice and maize fields in northeast China. Sustainability 2017, 9, 1916. [Google Scholar] [CrossRef] [Green Version]
  33. Wang, Y. Effcets of Bensulfuron-Methyl and Its Degrader Brevibacterium sp. BH on Microbial Community and Bioremediation of Bensulfuron-Methyl in Paddy Soil. Master’s Thesis, Zhejiang University, Zhejiang, China, 2007. (In Chinese). [Google Scholar]
  34. Veen, J.; Ladd, J.; Amato, M. Turnover of carbon and nitrogen through the microbial biomass in a sandy loam and a clay soil incubated with [14C(U)]glucose and [15N](NH4)2SO4 under different moisture regimes. Soil Biol. Biochem. 1985, 17, 747–756. [Google Scholar] [CrossRef]
  35. Heuck, C.; Spohn, M. Carbon, nitrogen and phosphorus net mineralization in organic horizons of temperate forests: Stoichiometry and relations to organic matter quality. Biogeochemistry 2016, 131, 229–242. [Google Scholar] [CrossRef]
  36. Marklein, A.R.; Winbourne, J.B.; Enders, S.K.; Gonzale, D.J.X.; van Huysen, T.L.; Izquierdo, J.E.; Light, D.R.; Liptzin, D.; Miller, K.E.; Morford, S.L.; et al. Mineralization ratios of nitrogen and phosphorus from decomposing litter in temperate versus tropical forests. Glob. Ecol. Biogeogr. 2016, 25, 335–346. [Google Scholar] [CrossRef]
  37. Müller, T.; Höper, H. Soil organic matter turnover as a function of the soil clay content: Consequences for model applications. Soil Biol. Biochem. 2004, 36, 877–888. [Google Scholar] [CrossRef]
  38. Zhang, H.; Tang, J.; Liang, S.; Li, Z.; Wang, J.; Wang, S. Early thawing after snow removal and no straw mulching accelerates organic carbon cycling in a paddy soil in Northeast China. J. Environ. Manag. 2018, 209, 336–345. [Google Scholar] [CrossRef]
  39. Jobbagy, E.G.; Jackson, R.B. The vertical distribution of soil organic carbon and its relation to climate and vegetation. Ecol. Appl. A Publ. Ecol. Soc. Am. 2000, 10, 423–436. [Google Scholar] [CrossRef]
  40. Carney, K.M.; Hungate, B.A.; Drake, B.G.; Megonigal, J.P. Altered soil microbial community at elevated CO₂ leads to loss of soil carbon. Proc. Natl. Acad. Sci. USA 2007, 104, 4990–4995. [Google Scholar] [CrossRef] [PubMed] [Green Version]
  41. Jiang, X.; Tan, X.; Cheng, J.; Haddix, M.L.; Cotufo, M.F. Interactions between aged biochar, fresh low molecular weight carbon and soil organic carbon after 3.5 years soil-biochar incubations. Geoderma 2019, 333, 99–107. [Google Scholar] [CrossRef]
  42. Ouyang, L.; Yu, L.; Zhang, R. Effects of amendment of different biochars on soil carbon mineralisation and sequestration. Soil Res. 2014, 52, 46–54. [Google Scholar] [CrossRef] [Green Version]
  43. Zhang, A.; Zhou, X.; Li, M.; Wu, H. Impacts of biochar addition on soil dissolved organic matter characteristics in a wheat-maize rotation system in Loess Plateau of China. Chemosphere 2017, 186, 986–993. [Google Scholar] [CrossRef] [PubMed]
  44. Zimmerman, A.R.; Gao, B.; Ahn, M.Y. Positive and negative carbon mineralization priming effects among a variety of biochar-amended soils. Soil Biol. Biochem. 2011, 43, 1169–1179. [Google Scholar] [CrossRef]
  45. Tian, J.; Wang, J.; Dippold, M.; Gao, Y.; Blagodatskaya, E.; Kuzyakov, Y. Biochar affects soil organic matter cycling and microbial functions but does not alter microbial community structure in a paddy soil. Sci. Total Environ. 2016, 556, 89–97. [Google Scholar] [CrossRef] [PubMed]
  46. Bughio, M.A.; Wang, P.; Meng, F.; Qing, C.; Kuzyakov, Y.; Wang, X.; Junejo, S.A. Neoformation of pedogenic carbonates by irrigation and fertilization and their contribution to carbon sequestration in soil. Geoderma 2016, 262, 12–19. [Google Scholar] [CrossRef]
  47. Zhao, Q.; Tang, J.; Li, Z.; Yang, W.; Duan, Y. The influence of soil physico-Chemical properties and enzyme activities on soil quality of saline-alkali agroecosystems in western Jilin Province, China. Sustainability 2018, 10, 1529. [Google Scholar] [CrossRef] [Green Version]
  48. Moore, J.; Jacobson, A.D.; Holmden, C.; Craw, D. Tracking the relationship between mountain uplift, silicate weathering, and long-term CO2 consumption with Ca isotopes: Southern Alps, New Zealand. Chem. Geol. 2013, 341, 110–127. [Google Scholar] [CrossRef]
  49. Manning, D.S.A.; Renforth, P.; Lopez-Capel, E.; Robertson, S.; Ghazireh, N. Carbonate precipitation in artificial soils produced from basaltic quarry fines and composts: An opportunity for passive carbon sequestration. Int. J. Greenh. Gas Control 2013, 17, 309–317. [Google Scholar] [CrossRef] [Green Version]
  50. Cheng, W.; Johnson, D.W.; Fu, S.L. Rhizosphere effects on decomposition: Controls of plant species, phenology, and fertilization. Soil Sci. Soc. Am. J. 2003, 67, 1418–1427. [Google Scholar] [CrossRef]
  51. Fontaine, S.; Barot, S.; Barre, P.; Bdioui, N.; Mary, B.; Rumpel, C. Stability of organic carbon in deep soil layers controlled by fresh carbon supply. Nature 2007, 450, 277–280. [Google Scholar] [CrossRef]
  52. Aslam, D.N.; Vandergheynst, J.S.; Rumsey, T.R. Development of models for predicting carbon mineralization and associated phytotoxicity in compost-amended soil. Bioresour. Technol. 2008, 99, 8735–8741. [Google Scholar] [CrossRef]
  53. Ribeiro, H.M.; Fangueiro, D.; Alves, F.; Vasconcelos, E.; Coutinho, J.; Bol, R.; Cabral, F. Carbon-mineralization kinetics in an organically managed Cambic Arenosol amended with organic fertilizers. J. Plant Nutr. Soil Sci. 2010, 173, 39–45. [Google Scholar] [CrossRef]
  54. Quan, Q.; Wang, C.; He, N.; Zhang, Z.; Wen, X.; Su, H.; Wang, Q.; Xue, J. Forest type affects the coupled relationships of soil C and N mineralization in the temperate forests of northern China. Sci. Rep. 2014, 4, 6584. [Google Scholar] [CrossRef] [PubMed] [Green Version]
  55. Trinsoutrot, I.; Recous, S.; Bentz, B.; Lineres, M.; Cheneby, D.; Nicolardot, B. Biochemical quality of crop residues and carbon and nitrogen mineralization kinetics under nonlimiting nitrogen conditions. Soil Sci. Soc. Am. J. 2000, 64, 918–926. [Google Scholar] [CrossRef]
  56. Theuerl, S.; Buscot, F. Laccases: Toward disentangling their diversity and functions in relation to soil organic matter cycling. Biol. Fertil. Soils 2010, 46, 215–225. [Google Scholar] [CrossRef]
  57. Song, Y.; Song, C.; Yang, G.; Miao, Y.; Wang, J.; Guo, Y. Changes in Labile Organic Carbon Fractions and Soil Enzyme Activities after Marshland Reclamation and Restoration in the Sanjiang Plain in Northeast China. Environ. Manag. 2012, 50, 418–426. [Google Scholar] [CrossRef]
  58. Sinsabaugh, R.; Lauber, C.; Weintraub, M.; Ahmed, B.; Allison, S.; Crenshaw, C.; Contosta, A.; Cusack, D.; Frey, S.; Gallo, M.; et al. Stoichiometry of soil enzyme activity at global scale. Ecol. Lett. 2008, 11, 1252–1264. [Google Scholar] [CrossRef]
  59. Luo, L.; Meng, H.; Gu, J. Microbial extracellular enzymes in biogeochemical cycling of ecosystems. J. Environ. Manag. 2017, 197, 539–549. [Google Scholar] [CrossRef]
  60. Zhang, C.; Liu, G.; Xue, S.; Wang, G. Soil bacterial community dynamics reflect changes in plant community and soil properties during the secondary succession of abandoned farmland in the Loess Plateau. Soil Biol. Biochem. 2016, 97, 40–49. [Google Scholar] [CrossRef]
  61. Guan, S. Soil Enzyme and Its Research Methods Beijing; Agriculture Press: Beijing, China, 1986. [Google Scholar]
Figure 1. Location of the study area.
Sustainability 12 02921 g001
Figure 2. The incubation experiment bottle. The incubation experiment bottle is composed of an incubation bottle and a lye absorption measuring cup. The bottom of the incubation bottle is paved with 20.0 g of soils, and the alkali absorption cup is placed above the soils with 10 mL 0.1 mol·L−1 NaOH solution in it.
Sustainability 12 02921 g002
Figure 3. Soil exchangeable sodium percentage (ESP) distribution characteristics.
Sustainability 12 02921 g003
Figure 4. Soil organic carbon (SOC) distribution characteristics.
Sustainability 12 02921 g004
Figure 5. The characteristics of the SOC mineralization rate. (a) 0 to 20 cm soil; (b) 20 to 40 cm soil.
Sustainability 12 02921 g005
Figure 6. Cumulative SOC mineralization and its kinetic simulations in different cultivation times.
Sustainability 12 02921 g006
Figure 7. The comparison of the SOC content and total CO2-C in different treatments.
Sustainability 12 02921 g007
Figure 8. Soil enzyme activities in different sites. The data are mean values of three parallel samples (n = 3). The bars represent the standard deviation of mean values.
Sustainability 12 02921 g008
Table 1. Soil properties of sampling sites.
Paddy FieldsLongitudeLatitudeSampling TextureClay (%)Silt (%)Sand (%)
P1124°43′03″ E45°00′19″ NLoam14.0740.1845.75
P2124°40′41″ E45°00′25″ NBlack soil13.9639.9246.12
P3124°41′40″ E45°00′23″ NSilt sandy loam10.7567.3321.92
P4124°42′27″ E45°00′05″ NSandy loam4.5831.3064.12
Table 2. Soil physicochemical properties.
Paddy FieldsSoil DepthpHEC (us·cm−1)ESP (%)TN (g·kg−1)C/NWHC (%)SOC (g·kg−1)CEC (cmol kg−1)
P10–20 cm7.74392.677.160.54 40.2243.2021.7616.36
20–40 cm8.26219.338.000.48 39.8139.1019.3117.42
P20–20 cm8.79202.277.220.49 42.5444.2020.6318.21
20–40 cm9.09184.808.410.47 39.9138.7018.6419.03
P30–20 cm8.84231.007.450.46 40.0443.5018.3016.02
20–40 cm9.16190.9010.020.42 32.9339.7013.8316.68
P40–20 cm9.19361.6715.060.45 31.2737.5014.0114.02
20–40 cm9.41263.0016.570.39 23.5735.209.2416.15
Table 3. Parameter values of the first-order kinetic simulation of the SOC mineralization in 0 to 20 cm and 20 to 40 cm soils and C0/SOC.
SamplesCt/g kg−1C0/g kg−1k/d−1T1/2R2Ct/SOCCt/C0
Treatment
P10–20 cm3.523 a4.211 a0.028 c4.254 b,c0.98440.194 c,d0.837
20–40 cm2.653 c3.030 c0.032 b4.139 d0.99110.191 f0.876
P20–20 cm3.281 a,b3.932 b0.028 c4.278 b0.98270.208 d0.835
20–40 cm2.23 d,e2.434 e0.037 a4.044 e0.99030.222 g0.917
P30–20 cm3.117 b3.812 b0.026 d4.335 a0.98390.157 c0.818
20–40 cm2.190 e2.448 e0.037 a4.309 a,b0.98460.295 e0.895
P40–20 cm2.657 c3.116 c0.030 b,c4.205 b,c0.98840.131 b0.853
20–40 cm2.446 d2.974 d0.027 c,d3.987 e0.98870.177 a0.822
Notes: The different lowercase letters indicate significant differences among treatments (p < 0.05).
Table 4. Correlation analysis of soil chemical properties and mineralization characteristic values.
IndicatorsSOCECpHESPCO2-CC0C0/sock
EC0.569
pH0.786−0.788
ESP−0.9450.470−0.118
CO2-C0.927−0.062−0.565−0.838
C00.952 *−0.139−0.495−0.8950.993 *
C0/SOC−0.985 *0.5440.0760.975 *−0.860−0.904
k−0.6780.706−0.3310.857−0.435−0.5380.792
W0.696−0.049−0.386−0.8500.7240.781−0.721−0.725
Note: * p < 0.05.

