Abstract
This study analyzes the relationship between agricultural foreign direct investment (FDI) and food security on Belt and Road Initiative (BRI) countries in a panel framework over the period 2006–2015 using correlation analysis, the specific-effect model, and the 2SLS technique. The study aims to: first, analyze the correlation between agricultural FDI and food security for each country, individually; then, investigate whether there is a direct relationship, using the specific-effect model. Finally, by taking one step further, this study uses the 2SLS method to determine whether there is an indirect relationship through agricultural productivity. Our results show that the sampled countries have clear differences in the direction of the relationship between food security and agricultural FDI. But, in general, the agricultural FDI has a positive direct and indirect effect on food security; this effect is seen clearly when the country attracts agricultural FDIs steadily.
1. Introduction
The world looks forward to achieving food security by 2030, but many countries still suffer from hunger and poverty, and lack the necessities of life. The United Nations’ Sustainable Development Goals (SDGs) include food security as a prime instrument of sustainable development. Specifically, Goal 2 of the SDGs includes achieving food security, promoting sustainable agriculture, and dedicating cooperation in agricultural investment to achieve food security [1].
The Belt and Road Initiative (BRI) promotes the countries’ economic prosperity and regional economic cooperation, strengthens mutual learning between civilizations, and enhances peace and development in the world. There is much evidence that affirms the positive role of BRI in encouraging economic cooperation and enhancing gross domestic product (GDP) growth [2,3,4]. Besides, along with many studies that refer to the positive effect of foreign direct investment (FDI) on host countries’ GDP [5,6,7], the World Bank predicted that FDI in BRI countries will increase the positive effect on GDP, trade, and employment, especially for the least developed countries [8]. The majority of BRI countries are agricultural developing countries that need much more investment to enhance agricultural productivity, especially considering that the expectations of the prospects for agricultural resources and food security across the BRI countries are not good [9]. This study spotlights the importance of agricultural foreign direct investment in achieving food security in BRI countries. In particular, this study aims to answer some questions that still need justifications in terms of the relationship between agricultural FDI and food security. First, are there differences in the direction of the relationship between agricultural FDI and food security among BRI countries? If the answer is “yes”, then how can these be explained? Second, is there a direct relationship between agricultural FDI and food security? Third, what is the nature of the relationship between agricultural FDI and the components of the food security index? Finally, is there an indirect relationship between agricultural FDI and food security through total factor productivity? This study attempts to answer these problematic questions.
Many researchers have sought to study the possibility of improving food security through its relation to agricultural productivity, whereas some researchers have suggested that agricultural productivity affects positively on household food security [10,11], and the others affirmed the same relation at macroeconomic level [12]. Although lots of attention has been paid to the relationship between FDI and food security at the macroeconomic level, we found these studies have reached different conclusions and therefore they have not given a general impression of the relationship between agricultural FDI and food security. Some researchers found the relationship to be positive using simultaneous equations and ordinary least squares (OLS) models [13,14,15,16,17], and others found the relationship to be negative using OLS and applying a double-logarithm functional form [18,19]. While some previous researchers have considered only one country, others studied several countries.
This study contributes to the development of this literature in three ways. First, it provides unique evidence from several BRI countries to validate the relationship between agricultural FDI and food security. Second, it provides an inductive analysis: it starts from individual observations of each country, and then moves to the general model, providing a more comprehensive picture of the relationship between agricultural FDI and food security. Finally, this study bridges the gap between previous studies in terms of the direction of the relationship between agricultural FDI and food security. Our results show that the sampled countries have conspicuous differences in the direction of this relationship. However, agricultural FDI, generally, has positive direct and indirect effects on food security. The positive effect is clearly seen when the country attracts agricultural FDIs steadily.
2. Literature Review and Hypotheses Development
This section of the study gives an account of previous studies conducted in the area of our focus, including food security and its relationship with agricultural FDI and agricultural productivity.
2.1. Food Security
According to the definition established at the 1996 World Food Summit, food security is defined as the situation when people at all times have physical, social, and economic access to sufficient and nutritious food that meets their needs for a healthy life [20]. The Food and Agricultural Organization (FAO) determined four aspects of food security. (1) Food availability: the availability of food in sufficient quantities and appropriate quality, supplied by domestic production or imports. (2) Food access: individual access to adequate resources for acquiring appropriate foods for a nutritious diet. (3) Food use: food utilization through adequate diet, clean water, sanitation, and healthcare to reach a state of nutritional well-being where all physiological needs are met. (4) Food stability: a population, household, or individual who must have access to adequate food at all times. They should not risk losing access to food as a consequence of sudden shocks (e.g., an economic or climatic crisis) or cyclical events (e.g., seasonal food insecurity) [21].
Theorizing food security and hunger has been based somewhat on Malthusian analytical scenarios involving shortfalls in food availability and poverty [22]. Concerns around the availability of food were responded to in the 1980s by governments and private sectors, particularly in developed countries, who invested in agriculture and seed technology to increase food production worldwide. This Green Revolution achieved productivity gains through research, technology transfers, and social reforms regarding the distribution of agricultural land [23]. The Green Revolution has assured us that, although knowledge is a solution for the world hunger problem, there should be consideration of the political and economic contexts. Moreover, many scientists affirm that food is available to feed the world’s population, but that people remain hungry because food has been affected by a highly uneven distribution of people’s vital needs. Therefore, the solution is to make food available for all people around the world [24]. By taking into account the economic context, we find that economic cooperation that achieves gains for all parties is a good way to achieve food security corresponding to the previous theory. There are many forms of economic cooperation, such as FDI and trade cooperation. This study focuses on FDI and its relation to food security.
2.2. Agricultural FDI and Food Security
Many theories explaining FDI in developing countries, such as development stage theory [25], small-scale technology theory [26], localized technological change theory [27], and technological competence theory [28]. In 2019, Xiaoyu Jiang et al. [29] tried to establish a theory of Chinese agricultural FDI under the BRI, in which they argue that investment in circulation and sales strengthens the connections between local farmers and the market, enhancing food security in developing countries, whereas the investment model of land leasing damages the interests of local farmers to a certain extent, and the excessive pursuit of profits lead to the unfair distribution of agricultural products.
Empirically, the relationship between agricultural FDI and food security has been highlighted in many studies, and due to differences in the findings of these studies, this relationship is still under discussion. On the one hand, we find that some studies referred to a positive relationship. For example, Chaudhuri and Banerjee (2010) [30] found that FDI in agriculture improves national welfare and also mitigates the problem of unemployment, which means improving the food security level. The paper theoretically explained the worth of FDI flow in the agriculture sector in developing economies. Rakotoarisoa (2011) [16] demonstrated that agricultural FDI in Sub-Saharan Africa leads to increases in factor returns and employment, and would uphold households’ real income to set off the loss from the potential increase in food prices. Liu (2014) [14] argued clearly that in developing countries the benefits of agricultural FDI cannot be expected to raise food security automatically, and local government and local legislation can define the type of agricultural FDI effects on food security, whereas some forms of large-scale investment carry risks for host countries. Wieck et al. (2014) [17] found that good governance boosts food security, and good guidelines for investment will contribute and maintain their potential positive influence on economic development and food security. Ben Slimane et al. (2016) [13] found that in developing countries the FDI in the agriculture sector supports food security, whereas FDI in the manufacturing and services sectors increases food insecurity. They also found a significant influence of FDI spillover on food security through agricultural production. However, on the other hand, we find that some studies referred to a negative relationship. Mihalache-O’Keef and Li (2011) [18] studied 56 developing and transition economies between 1981 and 2001, and found that agricultural FDI decreases food security. These results are largely robust under different statistical methods. Djokoto (2012) [19] also found that agricultural FDI inflow has had a detrimental effect on food security in Ghana. He indicated that efforts to develop Ghana’s economy and increase national income relative to population growth may not enhance food security unless the government directs final expenditure specifically towards food security programs specifically.
Finally, while all Investment Promotion Agencies in developing economies affirmed that agribusiness is the most attractive industry [31], the levels of FDI (in agriculture) were larger for the high-income country group than the middle- and low-income country groups [32,33]. We think that the small number of foreign investors in some developing countries could lead to monopoly behavior which can affect food security negatively; this can explain why developing economies have worries about attracting new agricultural FDI. Based on a theoretical and empirical review, we argue that, in general, more agricultural FDI will increase competition between all producers; consequentially, agricultural productivity will increase and the food security level will increase as well. Therefore, we develop the following hypotheses:
Hypothesis 1.
Agricultural FDI has a direct positive impact on food security in BRI countries.
Because this study will use a composite food security indicator, which reflects the four aspects of food security we develop the following hypothesis:
Hypothesis 2.
Agricultural FDI has a direct positive impact on the food security indicator’s components in BRI countries.
Finally, since the volumes of agricultural FDI in many developing economies are small, they cannot have clear effects on food security. So, we think that the volume of agricultural FDI could affect the direction of the relationship between food security and agricultural FDI, and, because we deal with different sized economies, we think the proportion of agricultural FDI to agricultural value-added can indicate the proportional importance of agricultural FDI in the country’s agricultural sector.
2.3. Food Security and Agricultural Productivity
In terms of the relationship between food security and agricultural productivity, many scholars have studied this relationship at the household level. Costa et al. (2013) [10] found that agricultural productivity gains are associated with greater household food security; however, in low proportions, because of the high influence of particular factors, such as education and income. Ogundari (2014) [11] identified the key drivers of efficiency levels of African agriculture and food production over the years to be education, years of experience, extension, credit, farm size, and membership of the cooperative society. These findings had policy implications for strengthening food security through an increase in the efficiency of African agriculture and food production. At the macroeconomic level, Brummer (2006) [12] revealed that boosting food security cannot be split from the agricultural total factor productivity (TFP) growth, and the improvement in the efficiency levels of agriculture is the major component of TFP growth. Consequentially, it is clear that the agricultural TFP affects food security positively, and we think that agricultural TFP could intermediate the indirect relationship between food security and agricultural FDI. We express this indirect relationship by the following two hypotheses:
Hypothesis 3.
Agricultural FDI has a direct positive impact on agricultural TFP in BRI countries.
Hypothesis 4.
Agricultural FDI has an indirect positive impact on food security through agricultural TFP in BRI countries.
This study investigates, in depth, the direct relationship between FDI in the agricultural sector and food security, attempting to give a general perception of this relationship by studying the relationship in each country and then presenting a comprehensive model for all countries. Previous studies have not presented these relationships in such a comprehensive way; consequently, they do not give a clear picture of the relationship between agricultural FDI and food security.
3. Data and Variables
This work was based on an unbalanced panel of 42 countries covered by BRI over the period 2006–2015, We tried to make our sample more reliable in representing the diversity that exists in BRI countries by selecting countries from different development levels, enabling us to generalize the conclusions to the rest of the BRI countries (see the counties list in Table A6). Table A1 and Table A2 in the Appendix A report the variables definitions and descriptive statistics. Most of the data were extracted from the World Development Indicators database of the World Bank. Other data were collected from the United Nations Conference on Trade and Development (UNCTAD) and the Food and Agriculture Organization (FAOSTAT).
First of all, a correlation analysis was performed between all variables (Table A3 in Appendix A). We observe that the correlation is low between variables. But, in fact, the sample of the study includes countries at different levels of development and food security, and we believe that investment cooperation in the agricultural sector between these countries will contribute significantly to enhancing food security.
We have selected the basic food security indicators from FAOSTAT, which can represent the food security well, according to FAO definition. First, dietary energy supply adequacy as an indicator of the sufficiency of calories in the food supply. This is calculated as a ratio of the average dietary energy requirement. Second, the food production per capita variability. We can use this indicator to compare the variations of the food supply across countries and time. The first and second indicators describe the first basic base of food security, food availability, and they are calculated by FAO using three years averages to correct errors in the measure. Third, the access to improved water sources, which is the ratio of the population with an access to an adequate amount of water that is necessary for agriculture and food. Fourth, the access to improved sanitation facilities. This is computed as a percentage of the population with adequate access to good sanitation. This indicator is important because improved sanitation reduces the pollution caused by human waste. If we take each indicator of these four indicators separately, we will not get enough information to accurately represent the level of food security. So in Section 4.1, we present a composite indicator that can represent these four indicators together [13]. Figure 1 shows the study sample and levels of composite food security in each country.
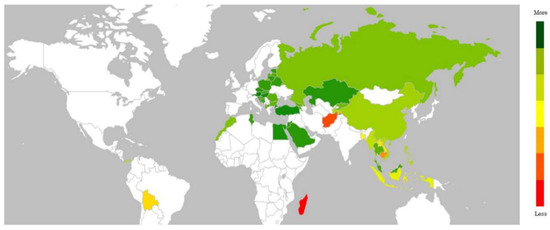
Figure 1.
Food security levels in study sample countries.
Our analysis will also shed light on the relationship between food security and agricultural FDI, in addition to other factors such as GDP Per Capita (GDPPC), food production, agricultural value-added, food imports, and agricultural pesticides as control variables. Besides, during this study, we will indicate a new calculated variable that can create a better understanding of this relation by applying a Fisher unit-root test of unbalanced panel data. Table A5 shows that all our variables are stable. Figure 2 presents the plots of the two main variables individually by country, and Figure A1 shows the plots of the other variables.
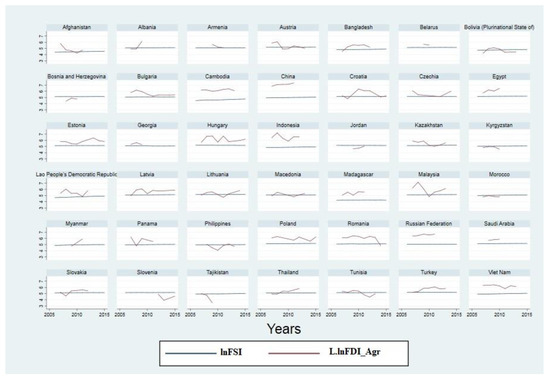
Figure 2.
The relationship between Food Security and agricultural FDI in the study sample countries. Where L.lnFDI_Agr denote the first lag of logarithm of agricultural FDI, and lnFSI denote the logarithm of food security indicator.
4. Methodology
In this research, we used many statistical methods, such as descriptive statistics to describe and summarize the main features of our data. In addition, we used correlation analysis, individually, to initially measure the strength of the relationship between the food security indicator (FSI) and agricultural FDI in the study sample countries. To investigate this relationship in a robust and consistent manner, we studied the direct relationship and then tested the existence of the indirect relationship, through agricultural productivity, using two-stage least squares (2SLS). We had unbalanced panel data, therefore, we used a specific effect model which can be a fixed-effect or random-effect model. In order to determine the appropriate model, we applied thee Hausman test where the null hypothesis is that the preferred model is random effects and the alternative is fixed effects [34]. In this section, we will explain the main methods that were used in this research, including principal components analysis, the direct relationship analysis model, the 2SLS model, and the total factor productivity method.
4.1. Principal Component Analysis (PCA)
Principal Component Analysis (PCA) is a dimension-reduction tool that can be used to reduce a large set of variables into a small set that still contains most of the information of the large set. PCA can be done by eigenvalue decomposition of a data covariance matrix or a singular value decomposition of a data matrix [35]. We will use PCA, aiming to get one variable FSI which can represent the four variables of the food security indicator, especially if we know that these four variables have different trends and relationships with FDI (as we will see in Section 5.3 of this paper). By applying PCA on our data, we will get these results, as shown in Table 1 and Table 2.

Table 1.
Principal component analysis results.
Table 2.
Coefficients of principal component analysis.
From Table 1 we can see that if we take just one component, this component can explain about 71% of the variation in the four indicators of food security.
Table 2 shows how the coefficients of the four variables were computed with the new variable FSI. These coefficients were used in creating FSI variable (Equation (1)):
4.2. The Direct Relationship
We studied the direct and indirect relationship between FSI and agricultural FDI, so we have two main models, and we used a specific effect model, as we mentioned before. We began with the direct relationship model that is shown in Equation (2):
where , , , , refer to the countries, years, the estimated coefficients, the country fixed effects, and error term, respectively. , , , , , , denote the logarithm of food security indicator, the first lag of logarithm of agricultural FDI, the first lag of logarithm of FDI in the manufacturing and services sectors, the first lag of logarithm of FDI_Agr to agricultural value added, the logarithm of GDP per capita, the logarithm of food production, and the logarithm of food imports, respectively.
Furthermore, we reran the same model (in Equation (2)) four times with FSI components as dependent variables. In this way, we know which component has greater effects on the main relation.
4.3. The Indirect Relationship (2SLS)
By running the correlational analysis individually between FSI and FDI_Agr for each country, firstly, we found that 24 countries have a positive correlation and 20 of them have a positive correlation between FDI_Agr and TFP. Secondly, we found that 18 countries have a negative correlation between FSI AND FDI_Agri, while 11 of them have a negative correlation between FDI_Agr and FTP. The correlation analysis results showed that the direction of the relationship between FDI_Agr and FSI is largely related to the direction of the relationship between FDI_Agr and TFP, which indicates the possibility of TFP being an intermediate variable in the relationship between FDI and FSI. That is why we decided to study the indirect relationship between FDI_Agr and FSI using the 2SLS method.
Before we used the 2SLS method, we ran the endogeneity test to decide whether it was necessary to use an instrumental variable, i.e., whether a set of estimates obtained by least squares is consistent or not. The endogeneity test (Durbin–Wu–Hausman (DWH) test) can be easily formed by including the residuals from first stage regression as an independent variable in the second stage and checking whether the coefficient value of the residuals is significant or not. If the p-value is small, that indicate that the OLS is not consistent, and that it is good to use the 2SLS method [36]. The p-value was small, as our study shows in Section 5.4. By using the 2SLS method, we aimed to examine the indirect relationship between the FSI and the FDI_Agri, where we generate the estimated TFP values from the first stage and then we use them instead of the actual value in the second stage as an explanatory variable.
4.3.1. First Stage
To compute TFP, we employed the simple Cobb–Douglas functional form [37]. To express the Cobb–Douglas production function, we need three variables: (1) the output (Y), which is a function of (2) labor (L), and (3) capital (K), with the labor and capital coefficients being and respectively. The production function is:
measures , which can be used to pick up the changes in production efficiency. By calculating the natural logarithms of Equation (3), we get a linear model that allowed us to estimate TFP [38]. After estimating TFP our first model became what is shown in Equation (4):
where , , , , , refer to the countries, years, the estimated coefficients, the country fixed effects, and error term, respectively. , , , represent the logarithm of total factor productivity, the first lag of logarithm of agricultural FDI, the first lag of logarithm of FDI_Agr to agricultural value added, and the logarithm of , respectively.
4.3.2. Second Stage
After we ran the first model used to estimate the value of TFP, we then used the estimated values as an independent variable in the second stage, as shown in Equation (5).
where , , , , , refer to the countries, years, the estimated coefficients, the country fixed effects, and the error term, respectively. , , , , , denote the logarithm of food security indicator, the estimated total factor productivity in logarithm, the first lag of logarithm of FDI in the manufacturing and services sectors, the logarithm of agricultural value added as a percentage, the logarithm of food production, and the logarithm of food imports, respectively.
5. Results and Discussion
5.1. Is There Any Difference in the Direction of the Relationship Between Agricultural FDI and Food Security among Countries?
To answer the first question, we plotted this relationship and used individual correlation analysis among all countries to make sense of the relationship between FSI and FDI_Agr. By calculating Pearson’s correlation coefficients between FSI and FDI_Agr individually for each country, we found that 24 countries have a positive correlation and 18 countries have a negative correlation that refers to clear differences in the direction of the relationship between FSI and FDI_Agr. As shown in Figure 2, we can see that the relationship direction is unclear in some countries with a low level of FDI_Agr, such as Afghanistan, the Philippines, and Tunisia. In contrast, some other countries, with enough levels of FDI_Agr at a specific level of FSI, show a clear positive relationship, such as China, Russia, and Egypt. Thus, when the level of FDI_Agr is low, its contribution to agricultural output will be very low, and it will be hard for FDI_Agr to make an effect on FSI. So we suppose that the proportion of the agricultural FDI to the value added of the agricultural sector (FDI_Agr/AgriValueAdd) as a new variable will make sense if we add it into our model, and that agrees with what we referred to at the end of the Section 2.2.
Before we answer the second question, we have to make sense of the direct relationship between FSI and FDI_Agr in our dataset. To avoid the bias that could be caused by the limitations and assumptions of the models used to judge the direction of the relationship, we try to have a priori knowledge of the relationship using graphs and simple calculations as shown in Figure 3.
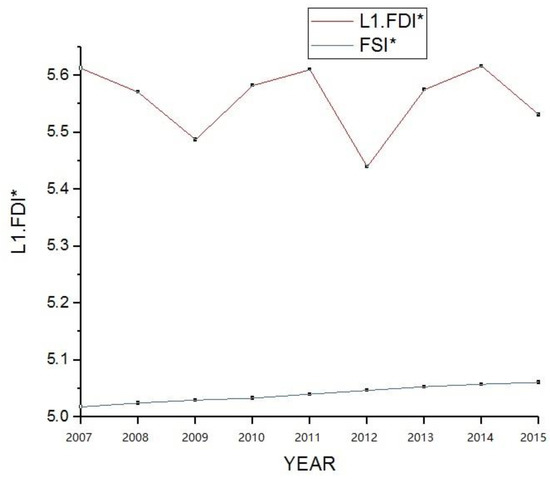
Figure 3.
The relationship between FSI and FDI_Agr. L1.FDI*= first lagged of average (ln (FDI_Agr)) /3; FSI*= average (ln (FSI)).
Figure 3 gives the impression that the relationship between the two variables is unclear. While food security continues to increase, agricultural FDI is unsteady. By applying some simple calculations, based on the same data that was used in Figure 3, we found that the changes in lnFSI to the changes in FDI_Agr on average are positive, with a value of about 0.01318, which refers to a positive relationship between these two variables. From Figure 3, we notice a sharp decline in the average agricultural FDI for the sampled countries in 2008 and 2011, followed by a new rise (where we use the lag values of FDI_Agr). If we return to the circumstances surrounding these two periods, we will find that the global financial crisis was in 2008, and in 2011 stock markets faced a sharp fall for about half a year in different countries. The situation in 2011 cannot be described as a real financial crisis, but it seems that the investors were very cautious, fearing reaching the same conditions as the financial crisis of 2008, This behavior can be explained in that the financial crisis and economic recession led to an increase in the uncertain conditions, access to credit from the banking and financial sectors became more restrictive, and, consequently, investors took a more cautious approach and the FDI in the agriculture sector decreased [39,40].
5.2. Is There a Direct Relationship between Agricultural FDI and Food Security?
To answer the second question, we applied the specific effect model and the fixed-effect model that had been chosen according to the Hausman test. We used the first lag for variables that need time to show their effect, such as (lnFDI_Agr), (lnFDI_M&S), (lnFDI_Agr/AgriValueAdd), and the results of the three models are shown in Table 3.
Table 3.
The direct relationship between the food security indicator and agricultural FDI.
In the first model, (lnFDI_Agr/AgriValueAdd) and (lnGDPPC) were excluded; by adding (lnGDPPC) in the second model the ln FDI_Agr became insignificant with a lower negative coefficient value. On the other hand, the power of explanation for the model interpretation jumped from 0.382 to 0.616. Then, by adding our proposed variable (FDI_Agr/AgriValueAdd) in the third model, it can be seen that (lnFDI_Agr) became significant, at a 0.05 significance level, with the same coefficient value (0.0131) that we got in Section 5.1, and the explanatory power of this model is close enough to the previous one. These results supports Hypothesis 1.
We can conclude that by adding (FDI_Agr/ AgriValueAdd), which presents the proportional value of agricultural FDI to the local agricultural value added, the model became closer to representing the real values, with significant coefficient values and good interpretation power. We conclude that this variable absorbed the random factors which could affect the relationship between FDI and food security. This result is consistent with the theoretical and practical literature which argues that that some countries fear the monopolistic behavior of agricultural FDI, so they hesitate to attract more foreign investment. In contrast, the more open countries attract more companies, creating a competitive atmosphere and the positive effect of agricultural FDI on food security. We refer to the fact that FSI had a logical positive relationship with GDPPC and food production, whereas its negative relationship with food imports can be explained as greater current food imports refer to more food gaps and food insecurity; however, we expect current food imports to enhance future food security. Finally, (L. ln FDI_M&S) showed an insignificant positive coefficient.
5.3. What is the Nature of the Relationship between Agricultural FDI and the Components of Food Security Index?
In order to have a deeper analysis of this relationship, in Table 4 we analyzed the relationship between FSI components and (FDI_Agr) according to the third model in Table 3.
Table 4.
The direct relationship between the food security indicator’s components and agricultural FDI.
From Table 4 we note that (FDI_Agr) has a positive effect on the access to improved sanitation facilities and on the access to improved water sources with significant coefficients, (0.0441) and (0.0291), respectively. This part of the results supported Hypothesis 2. On the other hand, we note that (FDI_Agr) has a negative effect on the dietary energy supply adequacy and on the per capita food production variability with a significant coefficient (−0.00435) and insignificant coefficient (−0.481) respectively. This part of the results did not support Hypothesis 2. From this, we can explain, first, that the negative effects of (FDI_Agr) on the dietary energy supply adequacy are insignificant; consequently, this does not represent the real effects. Second, the negative effects of (FDI_Agr) on the per capita food production variability, representing the shocks in food security [41], refer to the fact that (FDI_Agr) helped with achieving stable food production and support food security. We can conclude that our data supports the second hypothesis partially.
5.4. Is There an Indirect Relationship between Agricultural FDI and Food Security Through Agricultural Productivity?
To answer the fourth question, we used a 2SLS model. Before we used 2SLS we had to run the endogeneity test between the two models. We estimated the first stage model (Equation (4)), then we extracted the residuals and used them as an independent variable in the second stage model (Equation (5)). In the results of the second stage, we found that the p-value of residuals is equal (0.022). The small p-value indicates that OLS is not consistent, so it is more appropriate to use the 2SLS method (See Table A4). In this section, we present the results of the 2SLS. As shown in the Table 5, in the first stage we analyzed the relationship between TFP, as a dependent variable, and FDI_Agr. The fixed-effect model was chosen according to the Hausman test. We used first lag for variables that need time to show its effect such as (lnFDI_Agr), (L. lnFDI_M&S), and (lnFDI_Agr/ AgriValueAdd). By predicting the values of (lnTFP) from the first stage, we got a new variable, (lnTFP_hat), which we used as an explanatory variable in the second stage where the dependent variable is (lnFSI). The fixed-effect model has been also chosen according to the Hausman test. We used first lag for (lnFDI_M&S) because it need time to show the effect on lnFSI.
Table 5.
The results of the 2SLS model.
From Table 5, we can see that the (L. lnFDI_Agr) has a direct effect on (lnTFP) with a significant positive coefficient value of 0.278, and has an indirect effect on (lnFSI) through (lnTFP), with a significant positive coefficient value of 0.0850; these results clearly support Hypotheses 3 and 4. In the first stage, the negative effects of the interaction variable (L. lnFDI_Agr/ AgriValueAdd) on (lnTFP) should be explained in the context of (AgriValueAdd) and (L. lnFDI_Agr) together, where the increase in this variable’s value may result from an increase in agricultural investment, which leads to an increase in food security, but the increase in this variable’s value may result from a decrease in agricultural production, which leads to a decrease in food security. The supposed positive coefficient of (lnAgricultural Pesticides) was insignificant. In the second stage, we note that the significant coefficients of (lnFood) and (lnFood Imports) had decreased a little compared to the direct relationship model (Table 3). Moreover, the negative coefficient value of (lnAgri_Value%) makes sense, where higher development levels related to higher food security levels and less agricultural share in GDP. Finally, (L. lnFDI_M&S) showed an insignificant negative coefficient.
5.5. Robustness Check
We use the Generalized Method of Moments (GMM) to check robustness, where GMM can control for the country and year variables and unidentified characteristics that cannot be measured in an equation, which are the basis of possible unobserved heterogeneity. Given that GMM uses instruments, this method calculates the Hansen-J statistics of the over-identifying restrictions under the null hypothesis of the joint validity of the used instruments. In addition, GMM handles the Arellano–Bond first-order autocorrelation (AR (1)) problems and second-order autocorrelation (AR (2)) problems under the null hypothesis of no serial correlations. However, the absence of AR (2) is more important than AR (1) in order to get unbiased and consistent results from GMM. In the following we, re-estimate the Equations (2), (4), and (5) using GMM:
where , , , , , refer to the countries, years, the estimated coefficients, the unobserved individual effect, and the residuals, respectively. , L., L., , , , , and denote the logarithm of food security indicator, the logarithm of lagged food security indicator, the logarithm of lagged agricultural FDI, the logarithm of lagged FDI in the manufacturing and services sectors, the logarithm of lagged of FDI_Agr to agriculture value-added, the logarithm of GDP per capita, the logarithm of food production, and the logarithm of food imports, respectively., , represent the logarithm of total factor productivity, the logarithm of lagged total factor productivity, the logarithm of , respectively. and denote the estimated total factor productivity and the logarithm of agricultural value-added as percent, respectively.
By estimating the previous equations, we obtained three models (1), (2) and (3), as shown in Table 6. The significant Fisher-statistics (F) represents the joint significance of the GMM models. The results show that AR (1) statistics had significant values in all models, but the insignificant values of AR (2) indicate that there is no serial correlation and our estimations are valid. The insignificant values of Hansen-J in the models (1) and (3) and the significant value in the model (2) imply that the used instruments in models (1) and (3) are valid, whereas the used instruments in models (2) are invalid.
Table 6.
Regression results of Generalized Method of Moments (GMM).
By looking at our main results, we find that the GMM technique shows that the agricultural FDI has direct and indirect positive effects on food security, but that these effects are insignificant. These results do not refute the positive effects, but they suggest that these effects have a probability that is unimportant or marginal. On the other hand, we note that using the values of the lag dependent variable as an independent variable, in addition to using years as a dummy instrument variables, may not necessarily be fit for our data: where we noted that most variables that should have significant effects, they had insignificant effects.
6. Conclusions
In this study we presented an in-depth analysis of the relationship between FSI and FDI_Agr, that, as many previous studies have reached different conclusions, tried to bridge the gap between those studies. Our study dealt with the macroeconomic dimension of food security by using an unbalanced panel data of 42 countries of the BRI for the period 2006–2015, The main conclusions are as follows:
(1) By applying the correlation analysis on all countries individually, we found that there are clear differences in the relationship direction between FSI and FDI_Agr.
(2) Using a fixed-effect regression model, we found that FDI_Agr has positive direct effects on FSI. This result supports Hypothesis 1.
(3) By analyzing the relationship between the components of FSI and FDI_Agr, we concluded that FDI_Agr has a positive effect on the access to improved sanitation facilities and on the access to improved water sources. In addition, FDI_Agr showed insignificant negative effects on the dietary energy supply adequacy and supported achieving stable food production. This result supports Hypothesis 2 partially.
(4) Using the 2SLS technique, in the first stage we found that FDI_Agr had a positive effect on agricultural TFP and a positive indirect effect on FSI through agricultural TFP. These results support Hypotheses 3 and 4.
According to our results, generally, FDI in the agricultural sector has positive effects on food security. But these effects seem to be negative in some developing countries, which are often characterized by weak economic systems and do not open their doors to FDI, as these countries, due to their historical experiences, worry that the monopolistic behavior of foreign investors may harm the interests of local farmers. These findings seem to be consistent with the theory that was established recently by Xiaoyu Jiang et al. (2019) [29].
This study suggests several practical implications. First, this study suggests that governments under the BRI can enhance food security by attracting more agricultural FDI. Secondly, governments should choose the agricultural FDIs carefully, focusing on enhancing local agricultural productivity, which in its turn enhances food security. Thirdly, instead of isolation, countries should seek development and be ready to open up to foreign investment, and put in place plans and legislation that protect their rights and the rights of investors, creating a competitive atmosphere that benefits all.
Finally, based on our results that affirm the importance of cooperation in agricultural investment to achieving food security, we recommend more research to compare the effects of different forms of agricultural FDI on food security, using different food security indicators, and to provide the most current knowledge and suggestions to decision-makers continually.
Author Contributions
Conceptualization, M.I.A., O.A.R., and B.A.M.; methodology, M.I.A., O.A.R.; software, M.I.A.; validation, M.I.A, O.A.R., H.Y. and B.A.M.; formal analysis, M.I.A; investigation, M.I.A; resources, M.I.A; data curation, M.I.A; writing—original draft preparation, M.I.A; writing—review and editing, M.I.A and O.A.R.; visualization, M.I.A; supervision, H.Y.; project administration, H.Y.; funding acquisition, H.Y. All authors have read and agreed to the published version of the manuscript.
Funding
This work was supported by the National Natural Science Foundation of China No. (71701082 and 71271103).
Acknowledgments
We would like to thank the National Natural Science Foundation of China. This work would not have been possible without their support.
Conflicts of Interest
The authors declare no conflict of interest.
Appendix A
Table A1.
Definitions of variables.
Table A1.
Definitions of variables.
| Variables | Definition | Source |
|---|---|---|
| Access to improved sanitation facilities | The percentage of the population with access to improved sanitation facilities. | FAOSTAT |
| Access to improved water sources | The percentage of the population with access to an improved water source. | |
| Dietary energy supply adequacy | The dietary energy supply as a percentage of the average dietary energy requirement in each country (3-year average). | |
| Per capita food production variability | The total value of annual food production variability, in International Dollars, divided by the total population (kcal/capita/day) (I$ per person constant 2004–06) (3-year average) | |
| FSI | The composite indicator of food security | Authors’ calculation |
| TFP | Total Factor Productivity | Authors’ calculation |
| FDI_Agr | FDI inflows to Agriculture Sector (value in millions US$) | FAOSTAT |
| FDI_M&S | FDI inflows to Manufacturing and Services sectors (value in millions US$) | FAOSTAT, World Bank |
| GDPPC | GDP per capita (current US$) | World Bank |
| Agri_Value% | Agriculture, value-added (% of GDP) | |
| AgriValueAdd | Agriculture, value-added (current US$) | |
| Food production | Food production index (2004–2006 = 100) | World Development Indicators |
| Food Imports | Food imports (% of merchandise imports) | |
| Agricultural Pesticides | Pesticides (total) tons of active ingredients | FAOSTAT |
| FDI_Agr/ AgriValueAdd | Dividing FDI_Agr on AgriValueAdd | Authors’ calculation |
| Capital | Net Capital Stocks (Agriculture, Forestry and Fishing) US$, 2005 prices | FAOSTAT |
| Labor | Labor force in agriculture, in thousand people | UNCTAD |
Table A2.
Summary statistics.
Table A2.
Summary statistics.
| (1) | (2) | (3) | (4) | (5) | |
|---|---|---|---|---|---|
| Variables | Obs. | Mean | Standard Deviation | Min | Max |
| Access to improved sanitation facilities | 420 | 81.54 | 20.89 | 10.90 | 100 |
| Access to improved water sources | 420 | 90.87 | 13.16 | 40.80 | 100 |
| Dietary energy supply adequacy | 420 | 122.2 | 14.52 | 90 | 158 |
| Per capita food production variability | 420 | 13.23 | 11.84 | 0.400 | 70.10 |
| FSI | 420 | 156.8 | 26.04 | 69.91 | 186.8 |
| TFP | 402 | 14.91 | 0.613 | 13.31 | 16.95 |
| FDI_Agr | 223 | 1.205e+08 | 3.905e+08 | 37,579 | 3.607e+09 |
| FDI_M&S | 223 | 1.071e+10 | 2.719e+10 | 3.239e+07 | 2.437e+11 |
| GDPPC | 420 | 8168 | 8872 | 272.6 | 51,733 |
| Agri_Value% | 420 | 11.35 | 9.375 | 0 | 43.92 |
| AgriValueAdd | 420 | 2.764e+10 | 1.066e+11 | 0 | 9.773e+11 |
| Food production | 420 | 102.2 | 37.50 | 0 | 182.7 |
| Food Imports | 420 | 9.907 | 5.020 | 0 | 23.72 |
| Agricultural Pesticides | 370 | 55,613 | 281,045 | 0.0700 | 1.816e+06 |
| FDI_Agr/ AgriValueAdd | 216 | 0.0132 | 0.0287 | 9.38e-06 | 0.244 |
| Capital | 410 | 26,680 | 79,362 | 92.84 | 757,190 |
| Labor | 420 | 1.533e+06 | 3.969e+06 | 0 | 3.261e+07 |
Table A3.
Pearson’s correlation coefficients*.
Table A3.
Pearson’s correlation coefficients*.
| Variable | (1) | (2) | (3) | (4) | (5) | (6) | (7) | (8) | (9) |
|---|---|---|---|---|---|---|---|---|---|
| (1) ln FSI | 1 | ||||||||
| (2) ln FDI_Agr | 0.13359(a) | 1 | |||||||
| (3) ln FDI_M&S | 0.22178(a) | 0.1982(a) | 1 | ||||||
| (4) ln FDI_Agr/ AgriValueAdd | 0.06686(a) | 0.8823(a) | 0.1215(a) | 1 | |||||
| (5) ln GDPPC | 0.55285(a) | 0.2301(a) | 0.1350(a) | 0.125(b) | 1 | ||||
| (6) ln Agri_Value% | −0.31661 | 0.054689 | −0.12978 | 0.04055 | −0.33421 | 1 | |||
| (7) lnFood production | 0.55580 | 0.058527 | 0.03404 | -0.0164 | 0.67817 | −0.05722 | 1 | ||
| (8) lnFood Imports | 0.19727(c) | −0.10492 | −0.2783 | −0.1335 | 0.2367(b) | −0.12236 | 0.1677 | 1 | |
| (9) ln Agricultural Pesticides | 0.31957(b) | 0.1403(b) | 0.2042(b) | 0.117(b) | 0.2632(b) | −0.1056(b) | 0.2604 | −0.0283(b) | 1 |
| (10) lnTFP | 0.38895(a) | 0.2962(a) | 0.2083(a) | 0.182(a) | 0.8163(a) | 0.0664(b) | 0.6290 | −0.0283(b) | 0.259(a) |
* Pearson’s correlation coefficient computed on the average values of variables by years. Standard errors in parentheses (a) p < 0.01, (b) p < 0.05, (c) p < 0.1.
Table A4.
Endogeneity test results.
Table A4.
Endogeneity test results.
| Variables | FSI |
|---|---|
| lnTFP | 0.0693*** |
| (0.0164) | |
| L. lnFDI_M&S | −0.00129 |
| (0.00108) | |
| lnAgri_Value% | −0.0469*** |
| (0.00844) | |
| lnFood production | 0.0496*** |
| (0.0107) | |
| lnFood Imports | −0.00775 |
| (0.00617) | |
| Residuals | −0.0424** |
| (0.0182) | |
| Constant | 3.935*** |
| (0.221) | |
| Observations | 163 |
| Number of id | 35 |
| R-squared | 0.514 |
| R2 Overall | 0.257 |
Standard errors in parentheses *** p < 0.01, ** p < 0.05, * p < 0.1.
Table A5.
Fisher unit-root test.
Table A5.
Fisher unit-root test.
| Variable | Value |
|---|---|
| lnFSI | 155.5561*** |
| lnTFP | 281.3883*** |
| L. lnFDI_Agr | 212.9275*** |
| L. lnFDI_M&S | 243.0045*** |
| L. ln FDI_Agr/ AgriValueAdd | 162.0508*** |
| lnAgri_Value% | 118.7566*** |
| lnGDPPC | 357.5086*** |
| lnFood production | 133.6557*** |
| lnFood Imports | 171.2784*** |
| ln Agricultural Pesticides | 339.7884 *** |
| We report inverse chi-squared of Fisher’s unit-root test. | |
Standard errors in parentheses *** p < 0.01, ** p < 0.05, * p < 0.1.
Table A6.
The list of countries.
Table A6.
The list of countries.
| ID | Country | ID | Country | ID | Country |
|---|---|---|---|---|---|
| 1 | Afghanistan | 15 | Estonia | 29 | Panama |
| 2 | Albania | 16 | Georgia | 30 | Philippines |
| 3 | Armenia | 17 | Hungary | 31 | Poland |
| 4 | Austria | 18 | Indonesia | 32 | Romania |
| 5 | Bangladesh | 19 | Jordan | 33 | Russian |
| 6 | Belarus | 20 | Kazakhstan | 34 | Saudi Arabia |
| 7 | Bolivia | 21 | Kyrgyzstan | 35 | Slovakia |
| 8 | Bosnia and Herzegovina | 22 | Laos | 36 | Slovenia |
| 9 | Bulgaria | 23 | Latvia | 37 | Tajikistan |
| 10 | Cambodia | 24 | Lithuania | 38 | Thailand |
| 11 | China | 25 | Madagascar | 39 | Macedonia |
| 12 | Croatia | 26 | Malaysia | 40 | Tunisia |
| 13 | Czech Republic | 27 | Morocco | 41 | Turkey |
| 14 | Egypt | 28 | Myanmar | 42 | Vietnam |

Figure A1.
The average of the variables by year.
References
- Assembly, U.G. Transforming Our World: The 2030 Agenda for Sustainable Development; United Nations: New York, NY, USA, 2015.
- Boamah, J.; Appiah-Kubi, M. One belt one road: Capital investments, economic integration, and growth of participating countries. In Foreign Business in China and Opportunities for Technological Innovation and Sustainable Economics; IGI Global: Hershey, PA, USA, 2019; pp. 28–43. [Google Scholar] [CrossRef]
- Yang, Z.; Zeng, X. Envisioning the impact of the belt and road initiative on regional labor markets. Sustainability 2019, 11, 2189. [Google Scholar] [CrossRef]
- Chen, Y.; Fan, Z.; Zhang, J.; Mo, M. Does the connectivity of the belt and road initiative contribute to the economic growth of the belt and road countries? Emerg. Mark. Financ. Trade 2019, 55, 3227–3240. [Google Scholar] [CrossRef]
- Wang, Y.; Xie, L.; Zhang, Y.; Wang, C.; Yu, K. Does FDI promote or inhibit the high-quality development of agriculture in China? An agricultural GTFP perspective. Sustainability 2019, 11, 4620. [Google Scholar] [CrossRef]
- Gherghina, Ș.C.; Simionescu, L.N.; Hudea, O.S. Exploring foreign direct investment–economic growth nexus—Empirical evidence from central and eastern European countries. Sustainability 2019, 11, 5421. [Google Scholar] [CrossRef]
- Ahmad, F.; Umar Draz, M.; Su, L.; Ozturk, I.; Rauf, A.; Ali, S. Impact of FDI inflows on poverty reduction in the ASEAN and SAARC economies. Sustainability 2019, 11, 2565. [Google Scholar] [CrossRef]
- Chen, M.X.; Lin, C. Foreign Investment across the Belt and Road: Patterns, Determinants, and Effects; The World Bank: Washington, DC, USA, 2018. [Google Scholar]
- Shaofeng, C.; Yang, L.; Liyang, S. Sustainable agriculture in the “Belt and Road” region in conjunction with the Sustainable Development Goals. J. Resour. Ecol. 2019, 10, 649–656. [Google Scholar] [CrossRef]
- Costa, L.V.; Gomes, M.F.M.; de Lelis, D.A.S. Food security and agricultural productivity in Brazilian metropolitan regions. Procedia Econ. Financ. 2013, 5, 202–211. [Google Scholar] [CrossRef]
- Ogundari, K. The paradigm of agricultural efficiency and its implication on food security in Africa: what does meta-analysis reveal? World Dev. 2014, 64, 690–702. [Google Scholar] [CrossRef]
- Brummer, B. Food policy to alleviate rural poverty: The potential contribution of productivity growth in agriculture and agricultural trade liberalization. Q J. Int. Agric. 2006, 45, 1–6. [Google Scholar]
- Ben Slimane, M.; Huchet-Bourdon, M.; Zitouna, H. The role of sectoral FDI in promoting agricultural production and improving food security. Int. Econ. 2016, 145, 50–65. [Google Scholar] [CrossRef]
- Liu, P. Impacts of Foreign Agricultural Investment on Developing Countries: Evidence from Case Studies; FAO Commodity Trade Policy Research Working Papers: Rome, Italy, 2014. [Google Scholar]
- Ogalo, V. Foreign Investment in Agriculture in Eastern Africa, a General Overview of Trends and Issues; Friedrich Ebert Stiftung-Kenya: Nairobi, Kenya, 2011. [Google Scholar]
- Rakotoarisoa, M.A. A Contribution to the Analyses of the Effects of Foreign Agricultural Investment on the Food Sector and Trade in Sub-Saharan Africa; FAO: Rome, Italy, 2011. [Google Scholar]
- Wieck, C.; Rudloff, B.; Heucher, A. Agri-Investments and Public Spending in Selected Vulnerable Countries–Will They Contribute to Reduce Food insecurity? University of Bonn: Bonn, Germany, 2014. [Google Scholar]
- Mihalache-O’keef, A.; Li, Q. Modernization vs. dependency revisited: Effects of foreign direct investment on food security in less developed countries1. Int. Stud. Q. 2011, 55, 71–93. [Google Scholar] [CrossRef]
- Djokoto, J.G. Effects of foreign direct investment inflows into agriculture on food security in Ghana. J. Econ. Sustain. Dev. 2012, 3, 81–92. [Google Scholar]
- FAO. Rome Declaration on World Food Security and World Food Summit Plan of Action: World Food Summit 13–17 November 1996; FAO: Rome, Italy, 1996. [Google Scholar]
- FAO. Food Security. Policy Brief; FAO: Rome, Italy, 2006. [Google Scholar]
- Yaro, J.A. Theorizing food insecurity: Building a livelihood vulnerability framework for researching food insecurity. Norsk Geogr. Tidsskr. Nor. J. Geogr. 2004, 58, 23–37. [Google Scholar] [CrossRef]
- Carolan, M.S. Reclaiming Food Security; Routledge: London, UK, 2013. [Google Scholar]
- Vivero Pol, J.L. Food as a commons: Reframing the narrative of the food system. SSRN Electron. J. 2013. [Google Scholar] [CrossRef]
- Dunning, J.H. International Production and the Multinational Enterprise (RLE International Business); Routledge: London, UK, 2013. [Google Scholar]
- Louis, T. Third World Multinationals: The Rise of Foreign Investment from Developing Countries; The MIT Press: Cambridge, MA, USA, 1983. [Google Scholar]
- Lall, S.; Mohammad, S. Multinationals in Indian big business: Industrial characteristic of foreign investment in a heavily regulated economy. J. Dev. Econ. 1983, 13, 143–157. [Google Scholar] [CrossRef]
- Petit, M.L.; Sanna-Randaccio, F. Technological innovation and multinational expansion: A two-way link? J. Econ. 1998, 68, 1–26. [Google Scholar] [CrossRef]
- Jiang, X.; Chen, Y.; Wang, L. Can China’s agricultural FDI in developing countries achieve a win-win goal?—Enlightenment from the literature. Sustainability 2019, 11, 41. [Google Scholar] [CrossRef]
- Chaudhuri, S.; Banerjee, D. FDI in agricultural land, welfare and unemployment in a developing economy. Res. Econ. 2010, 64, 229–239. [Google Scholar] [CrossRef]
- UN. World Investment Report 2017: Investment and the Digital Economy; United Nations Conference on Trade Development: New York, NY, USA; Geneva, Switzerland, 2017. [Google Scholar]
- Lowder, S.K.; Carisma, B. Financial Resource Flows to Agriculture; A Review of Data on Government Spending, Official Development Assistance and Foreign Direct Investment; FAO: Rome, Italy, 2011; p. 44. [Google Scholar]
- Mergos, G.; Papanastassiou, M. Food Security and Sustainability; Springer: Berlin, Germany, 2017. [Google Scholar]
- Hausman, J.A. Specification tests in econometrics. Econom. J. Econom. Soc. 1978, 46, 1251–1271. [Google Scholar] [CrossRef]
- Abdi, H.; Williams, L.J. Principal component analysis. Wiley Interdiscip. Rev. Comput. Stat. 2010, 2, 433–459. [Google Scholar] [CrossRef]
- Davidson, R.; MacKinnon, J.G. Estimation and Inference in Econometrics; OUP Catalogue: Oxford, UK, 1993. [Google Scholar]
- Coma, C.W.; Douglas, P.H. A Theory of Production; American Economic Association: Nashville, TN, USA, 1928. [Google Scholar]
- Tuan, C.; Ng, L.F.Y.; Zhao, B. China’s post-economic reform growth: The role of FDI and productivity progress. J. Asian Econ. 2009, 20, 280–293. [Google Scholar] [CrossRef]
- O’Toole, C.M.; Newman, C.; Hennessy, T. Financing constraints and agricultural investment: Effects of the Irish financial crisis. J. Agric. Econ. 2014, 65, 152–176. [Google Scholar] [CrossRef]
- Suleman, A. Fostering FDI in the Agriculture Sector. The Pakistan Development Review; Pakistan Institute of Development Economics: Islamabad, Pakistan, 2009; pp. 821–838. [Google Scholar]
- FAO. New Approaches to the Measurement of Food Security. 2013; Available online: http://www.fao.org/ (accessed on 25 February 2020).
© 2020 by the authors. Licensee MDPI, Basel, Switzerland. This article is an open access article distributed under the terms and conditions of the Creative Commons Attribution (CC BY) license (http://creativecommons.org/licenses/by/4.0/).