1. Introduction
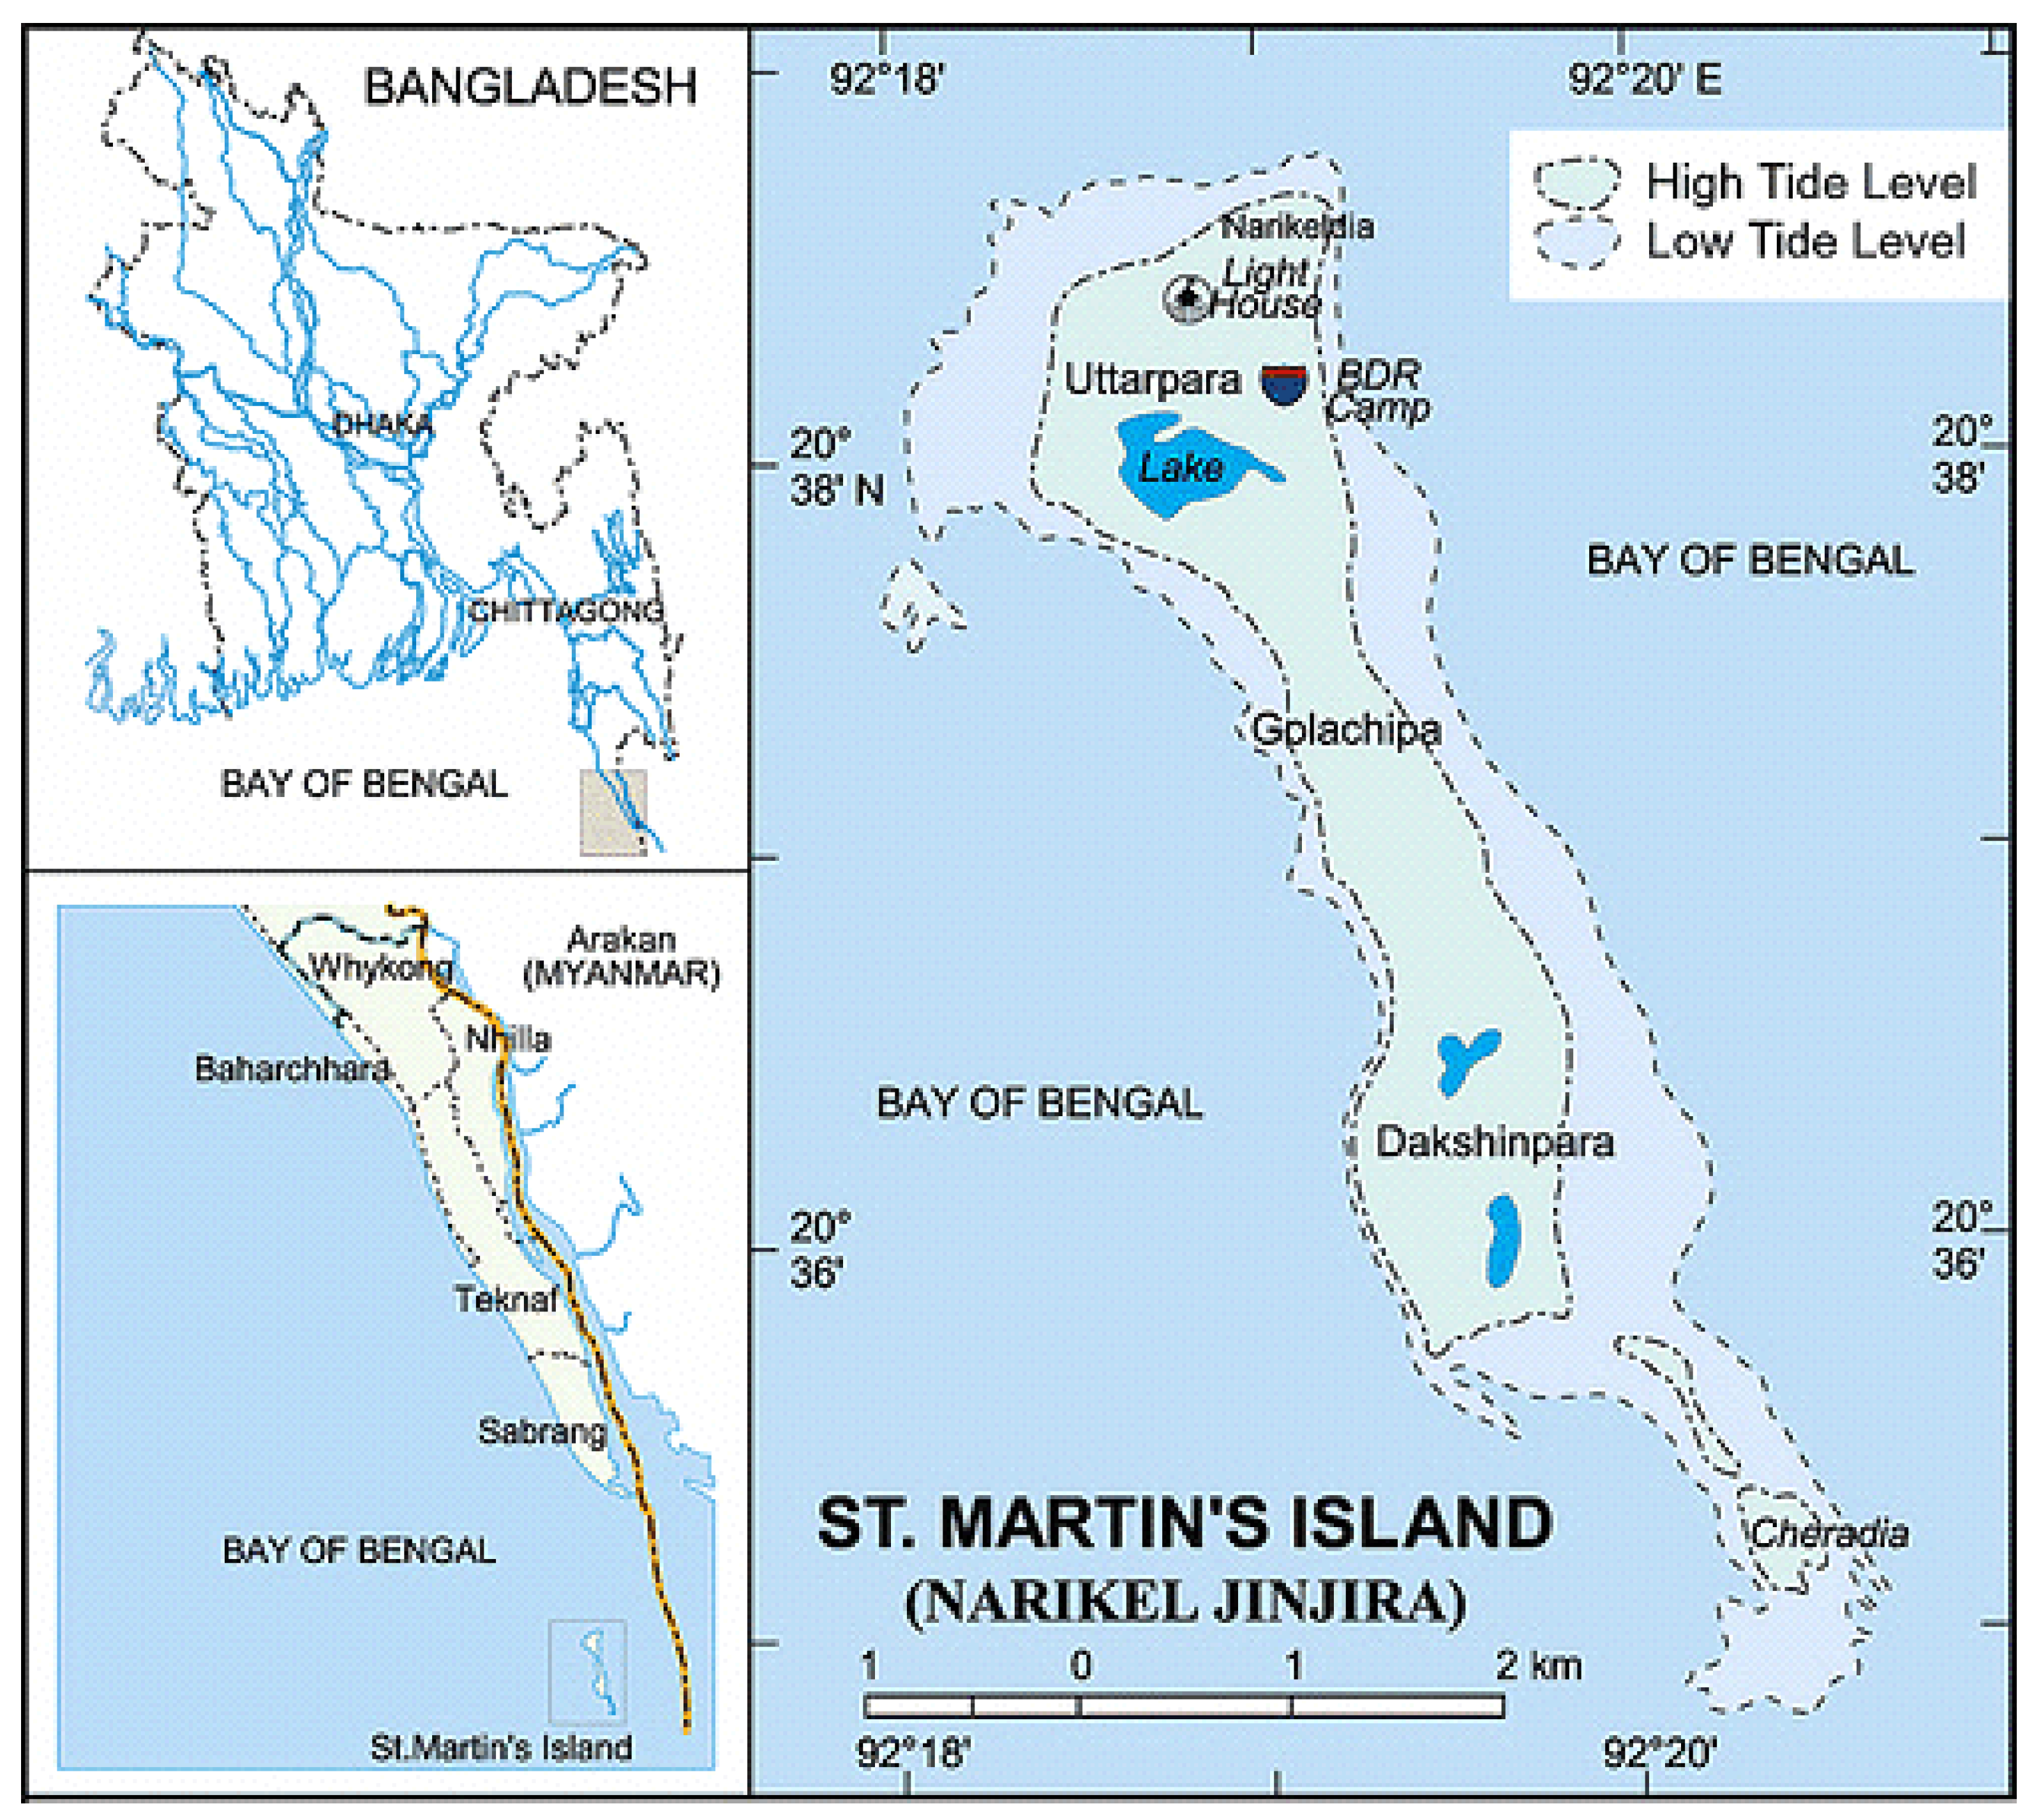
St. Martin’s (20037.9′ N, 92019.8′ E) is the only coral island in Bangladesh. It is situated on the north-eastern side of the Bay of Bengal, the ocean. Cox’s Bazar-Teknaf peninsula is about 9 km south of this island, in the southernmost part of Bangladesh. According to the Köppen climate classification, it belongs to the group of type A climates. One survey done in 2004 by the Local Government Engineering Department (LGED) found that around 8000 people resided here. This number goes up in the tourist season, as it is one of the most beautiful places in Bangladesh. The island has no grid connection, and it seems like there are less possibilities to connect in the near future by the government as well. Few diesel-fueled generators have been installed by the local authorities and by general people to meet their power demand, which is not enough at all. They are also not functioning properly. As natural gas supply is also not available, individuals meet their basic electricity demand plus cooking mainly through lamp oil (kerosene), coconut palm, leaves, and/or by different biomass plants. Since it is in the coastal region, wind is pretty much available almost all the time at a decent speed. Solar energy is also available here [
1].
Though more than 8000 individuals from 1220 families are living in St. Martin’s Island, not many of them are getting electricity. Besides, more than 32,000 travelers consistently visit this Island from home and abroad. There are around 120 lodgings and bungalows for the convenience of the sightseers. In 1985, the Power Development Board, Bangladesh (PDB) set up a huge generator (120 kVA) to give power to St. Martin’s Island which had been completely harmed by the typhoon season of 1991 [
2]. Ever since then, there has been no power supply given from the mainland by the government. A couple of privately settled generators and a couple of solar panels are currently the main sources of power in St. Martin’s. Thus, there is still no progression in power and most of the inhabitants are presently out of power.
As indicated by the Bangladesh Bureau of Statistics (BBS) [
3], just 26.4% of its population is getting power, and just for 4 hours (6:00 p.m. to 10:00 p.m.). They use diesel generators from neighborhood providers, and some Solar Home Systems (SHS) built up by different rustic advancement associations and NGOs. The number of homes with SHS installed is also not much, only 50, where every one of them are utilizing just a single 10W dc bulb. Not more than 100 generators have been claimed by various lodgings, bungalows, and a few other people for essentially providing power to sightseers, and a couple for neighborhood occupants.
Figure 1 shows the outline of this island.
The electricity that they use is very expensive, and costs more than 0.59 US Dollars (
$) for every unit of power. Sometimes it goes up to
$6 for utilizing one light and one fan just for 4 hours each day, which is really a burden for these people. This island is more than 17 km away from Teknaf, Bangladesh. Thus, electricity from the grid through to the mainland is not conceivable even in future, and at present there is also no such indication of this nor any effort from the government’s side. Though power transmission may be possible by utilizing the submarine link, it is way too expensive to establish. Considering the poor economic status of the inhabitants, the frequent increase in diesel prices, as well as GHG emission from diesel generators suggests that these arrangements should not be fully relied on. The reliance on wood and charcoal of some residents for fuel has also unavoidably prompted deforestation and desertification because of the absence of re-manor and soil restoration plans. On the other hand, St. Martin’s Island has abundant energy sources, such as sunlight, wind, and biomass. Thus, a hybrid microgrid power system (HMPS) utilizing renewable energy resources could work out an achievable arrangement of this power predicament of the people of this beautiful Island. Furthermore, it can be an example for the policymakers of Bangladesh and abroad to include such systems as a national energy supply unit within a regulatory framework, which can be learned from international legislation regarding microgrids [
4].
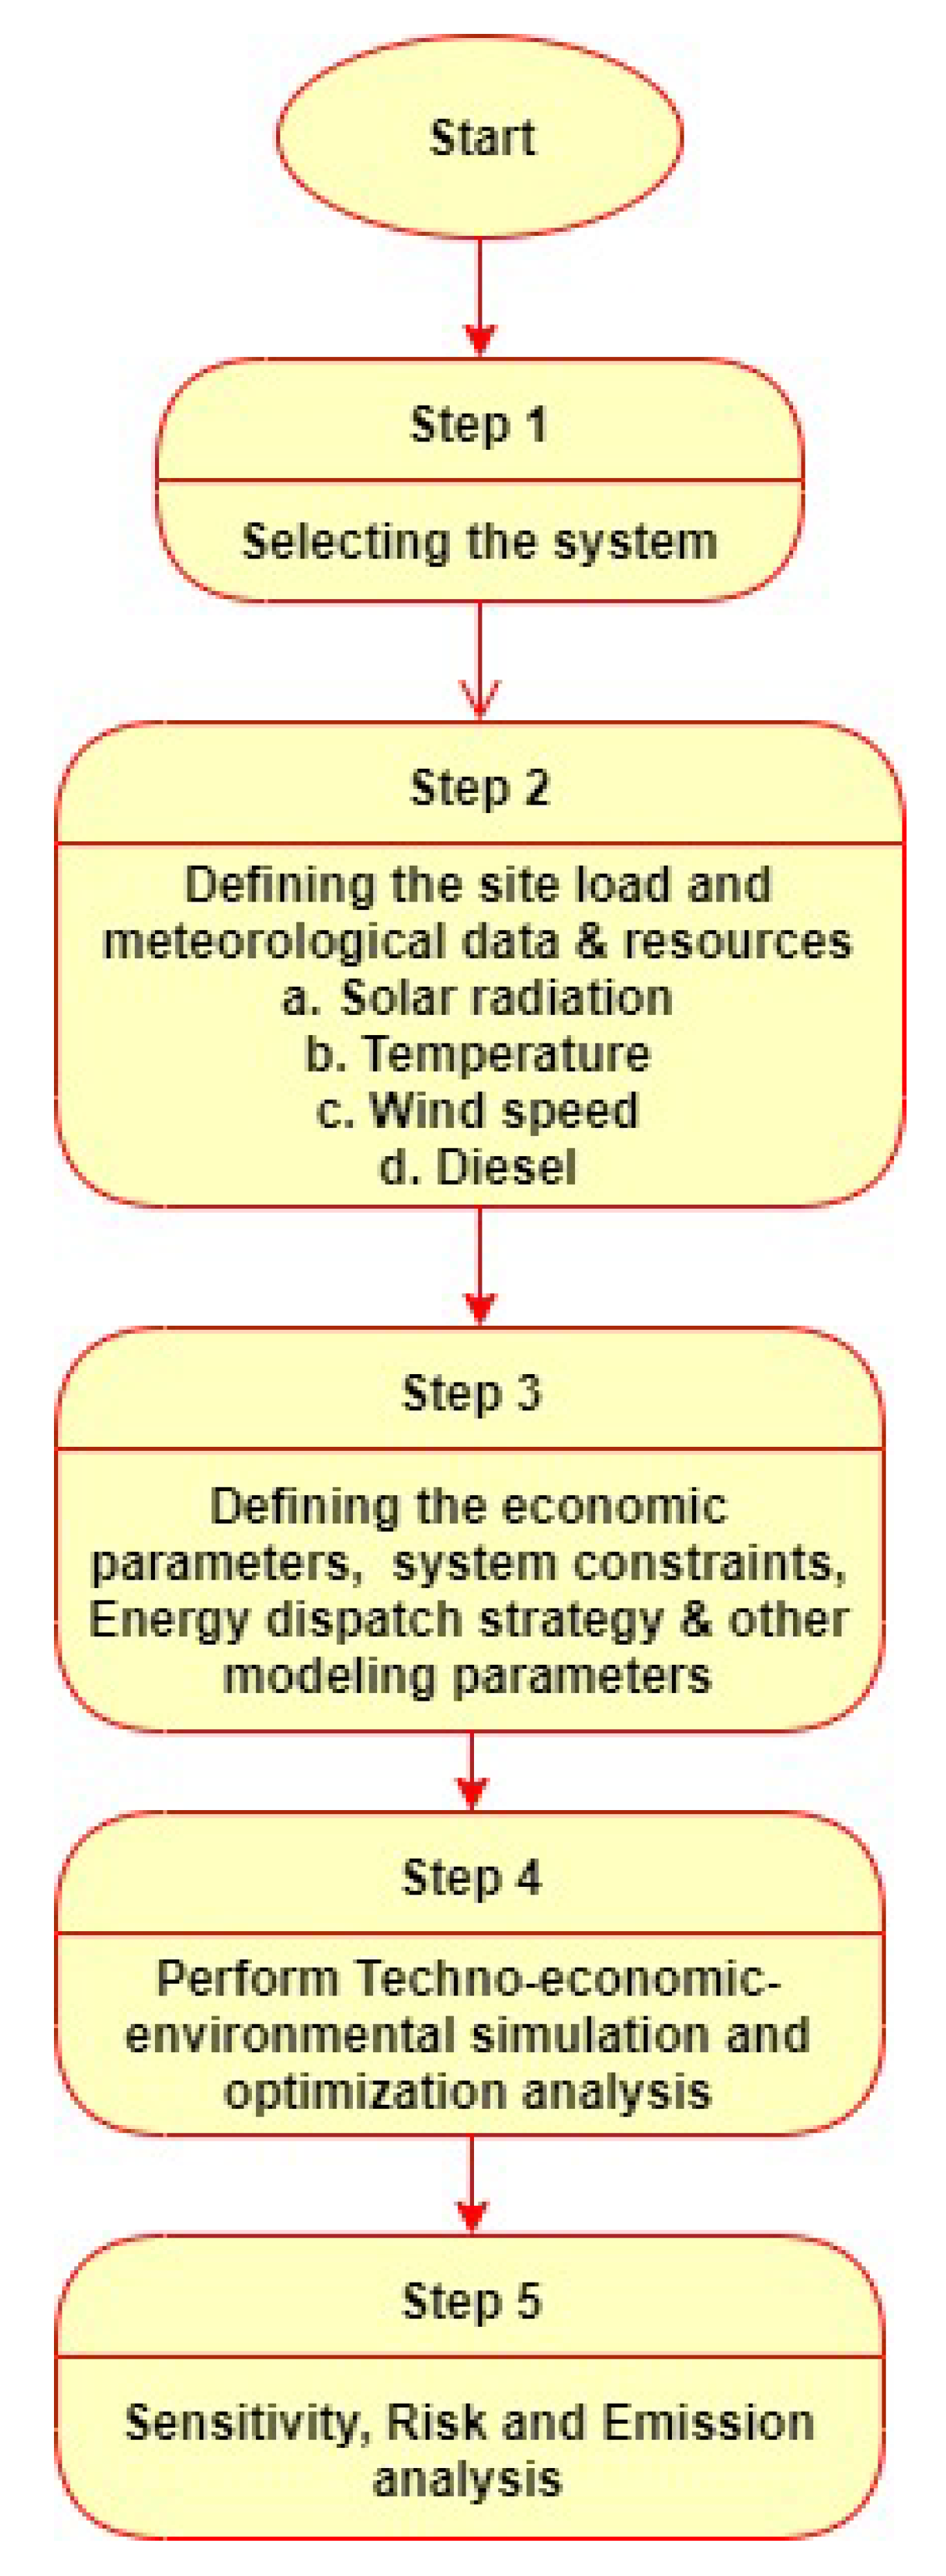
The overall objective of this study was to propose a renewable energy-based microgrid system in order to meet the load demand of St. Martin’s Island by running a technical and economic feasibility analysis. To achieve this objective, the following tasks were performed: (a) Evaluation and techno-economic analysis of the existing diesel-only electricity system. (b) Simulation of all possible combinations of the electricity system, including renewable energy sources, and finding out the best optimal system. (c) Optimization, sensitivity, risk, and emission analyses of the newly found best system.
This paper is organized in the following:
Section 1 shows the introductory part, which includes the background of the study, problem statement, and objectives of this study.
Section 2 describes the literature review, while
Section 3 discusses the research methodology and defines the whole system parameters.
Section 4 discusses the simulation results, whereas the last
Section 5 depicts the conclusion, along with future guidelines.
2. Literature Review
There are many types of simulation and optimization software that carry out research in terms of design and development of hybrid energy systems, like Hybrid2, HOGA, RETScreen, HOMER, TRANSYS, Aries, SOLES, RAPSYSM, HySym, and INSEL. Among all these tools, Hybrid Optimization of Multiple Energy Resources (HOMER) seems to be used most often [
6]. This study also adopted HOMER to perform our analysis.
There have been many significant works done by researchers around the world on the Hybrid power system with renewable energy, which are either off-grid [
7,
8,
9,
10,
11,
12,
13,
14,
15,
16,
17,
18,
19,
20,
21,
22,
23,
24,
25] or grid-connected [
26,
27,
28,
29,
30,
31,
32,
33]. In [
7], Groppi et al. focused on the hybrid storage (battery plus hydrogen) system while planning a smart energy system to ensure economic and environmental benefits. However, they did not explain the technical feasibility of their proposed system. Article [
8] discusses a methodology to integrate a high share of renewable energy in an island using PLEXOS software, which was cheaper (2.5%) than the fossil fuel-based system and met 78.1% of the final electricity demand. No risk or sensitivity analyses were performed, however, which are necessary to ensure the applicability of the planned power system. In a techno-economic feasibility study for a Chinese household [
9] with a hybrid wind/PV /battery system by HOMER, the effect of ambient temperatures and variation of loads were taken into account. They also assumed the load profile. Much emphasis was given to the PV tilt angle. They also presented economic, sensitivity, and PV tilt analyses of the system. They came up with a system which reduced the Net Present Cost (NPC) by about 10% for the same levelized Cost of Energy (COE) compared to other hybrid combinations. A microgrid system for a health clinic with a 31.6 kW aggregated load comprised of 6 kW PV modules, 80 batteries (225 Ah and 6 V), and a 3 kW inverter seemed to be the most techno-economic in the work of Al-Karaghouli and Kazmerski [
10] in southern Iraq. However, this study did not discuss the susceptibility of renewable energy sources to cost. A comprehensive feasibility study was performed by Abdirahman et al. [
11] in Somaliland’s urban places where a modern electricity grid is yet to be established. Their optimization and sensitivity analysis showed that it was more economically viable than the present “business-as-usual” scenario to implement a Renewable energy-based system in Somaliland. They found an almost 30% reduction in COE, followed by a 25% decrease in total net present cost and up to 58% achievement in renewable energy penetration for their proposed PV-wind-diesel-battery hybrid system. They also used HOMER for their analysis. However, they only showed the impact of load demand in sensitivity analyses without considering other factors, like diesel price, wind speed, and solar radiation. Almost the same type of study in three villages of Nigeria showed the dominance of an RE-based system over a locally supplied, stand-alone, diesel-only system [
12]. The author claimed that to establish a decent electricity supply for the rural clinics of those villages with a daily energy usage of 15.5 kWh and 2.75 kW peak demand, there was no other way but to implement a hybrid energy system without the presence of a main grid electricity supply. According to the optimization and sensitivity analysis, they found out that there was a more significant fluctuation in the COE due to the change of solar radiation at each site than the change in diesel price. They did not explain the sensitivity analysis broadly.
Researchers in [
13] investigated a PV-diesel-battery hybrid system in a remote village of Saudi Arabia compared to a diesel-only system. They found out that diesel-only plants were becoming more uneconomical due to the increase in fuel prices, and recommended establishing a hybrid system with 20% of solar PV penetration. Ibrahim et al. [
14] came up with a Wind/PV-solar Hybrid Energy System in Chennai, India for a Global System for Mobile communication (GSM)/Code-division multiple access (CDMA) system, which is a type of mobile telephone base station. The authors claimed a 70–80% reduction of fuel costs, likening it to the old diesel-only system achieving an emission drop in CO
, and other harmful particles as well. Akella and Sharma [
15] modeled an integrated, renewable-based power system with a micro-hydro, solar PV, wind turbine, and battery to meet the 808 MWh/yr load demand. The optimized system analyzed through LINDO software showed that the system would only become feasible if the optimizing power factor, known as an electric power delivery factor, exists in a range of 1.0–0.75 for the fulfilment of a 687 MWh/yr load demand. Kumaravel and Ashok [
16] presented an alternative hybrid power system with Solar PV, biomass, and pico-hydel for a present pico-hydel/diesel system. which would be more economically viable. Zoulias and Lymberopoulos [
17] proved the technical feasibility of hydrogen technologies, which would replace the conventional diesel-based generators and/or batteries, but the economic viability depended on several conditions regarding reduction of cost. Mohammed and khatib [
18] developed an optimization algorithm for obtaining the sizing of PV-wind-diesel system based on iterative simulation. Later, they validated it by conducting a HOMER optimization analysis and concluded claiming the superiority of the proposed algorithm in terms of accuracy level. Article [
19] analysed a CHP-PV-based microgrid in terms of microturbine efficiency of the CHP unit and its overall economic feasibility. It investigated the impact of variations in load changes and fuel prices without discussing the role of other sensitive parameters, such as solar irradiation.
A very interesting techno-economic optimization study done by Rajkumar et al. [
20] used an adaptive neuro-fuzzy interference system to gratify the Loss of Power Supply Probability (LPSP), obtaining the lowest COE. They obtained 96% accuracy after comparing the system to HOMER and HOGA tools. Diaf et al. [
21] came up with a hybrid PV-wind system and presented a reliable and economic model based on LPSP and a levelized cost of energy (LOCE). They said that without a large battery capacity, almost 30% of energy output becomes unused if one wants to obtain fullest RE penetration. They also suggested making system device choices carefully as it affects the optimal sizing of the system. Ekren et al. in [
22] carried out research where they found that the optimum area of solar PV (3.95 m
2), wind (29.4 m
2), and battery capacity was around 31.92 kWh, which costed 37,033.9 USD. They argued that for a distance of more than 4817 km between the hypothetical GSM base station and national grid, installing a hybrid power system would be more economical. Maouedj et al. [
23] tested a PV-wind hybrid experimental system in Adrar, Nigeria with a timeframe of 10 days. The excess electricity was stored in a battery bank, which was produced by the system in the daytime. They observed that solar radiation had a greater contribution than wind power technology by 69%, and that batteries were charged most within one hour in the afternoon due to the high availability of wind speed and solar power. Bekele et. al [
24] studied the stand-alone PV-wind microgrid system application in Ethiopia. The author considered a community comprising 1200 people. He selected the wind turbine, PV, and battery and compared this hybrid system to existing hydropower systems. He suggested that as there was less wind potential, the PV-diesel-battery system would make an excellent energy system for the people. In Malyasia, a feasibility study of a photovoltaic, battery, and wind-based energy system of island resorts by Ashourian [
25] showed their supremacy over a diesel-alone system in terms of NPC, COE, and renewable fraction. The proposed system appears to be green, environmentally friendly, and pollution-free.
In light of the above discussion, the renewable energy-oriented microgrid system can be classified into several categories, which are: (a) an off-grid stand-alone hybrid system, (b) a grid-tied hybrid system, (c) a system including generators, and (d) a system excluding generators.
While some researchers emphasize the technical aspects of a system, others focus on economic analysis. Almost everyone investigated the emission prospects. Many scholars tried to find optimal sizing of the proposed or existing power system using various noteworthy algorithms, like Monte Carlo, Particle Swarm Optimization, and the genetic algorithm, which mostly happened to be probabilistic, rather than a deterministic approach. Some studies also focused on the PV Array’s and wind turbine’s technical specifications by adding a tracking system and varying the hub height, respectively. Other properties of energy resources were also varied. Besides wind and solar energy, while doing simulations in HOMER, the run-off hydro, hydrogen tank, flywheel, reformer, and electrolyzer were considered for some studies. The cycle following the dispatch strategy has been discussed in almost all studies. Generators are allowed to operate concurrently in multiple numbers. Though there are various kinds of software and tools available to model and analyze this type of system, HOMER appears to be the one most widely used by researchers.
To the author’s best knowledge, very few researchers considered all the possible variation sensitive parameters applicable to HMPS, especially for remote islands. Again, reliability and risk analysis was found to be very rare in the reviewed literature, specifically in studies related to remote islands. Hence, the contributions of this study are as follows:
Detailed techno-economic-environmental benefits of the proposed hybrid microgrid are presented in comparison to the existing power system of the island.
The impact of four variables, including load demand, wind speed, solar radiation, and diesel price on HMPS is examined, which are sufficient for a sensitivity analysis.
A thorough risk assessment of the proposed system is performed using “scenario” analysis.
4. Results and Analysis
4.1. Optimization Result
There were several constraints, including the annual maximum allowable capacity shortage and minimum renewable fraction, which were set to zero. The percentage of per hour load that would be added to operating the reserve requirement was considered to be 10%. As for RE, the solar power would add half of the wind turbine output to the operating reserve, assuming the wind would have greater share of penetration. No minimum primary energy savings were taken into account.
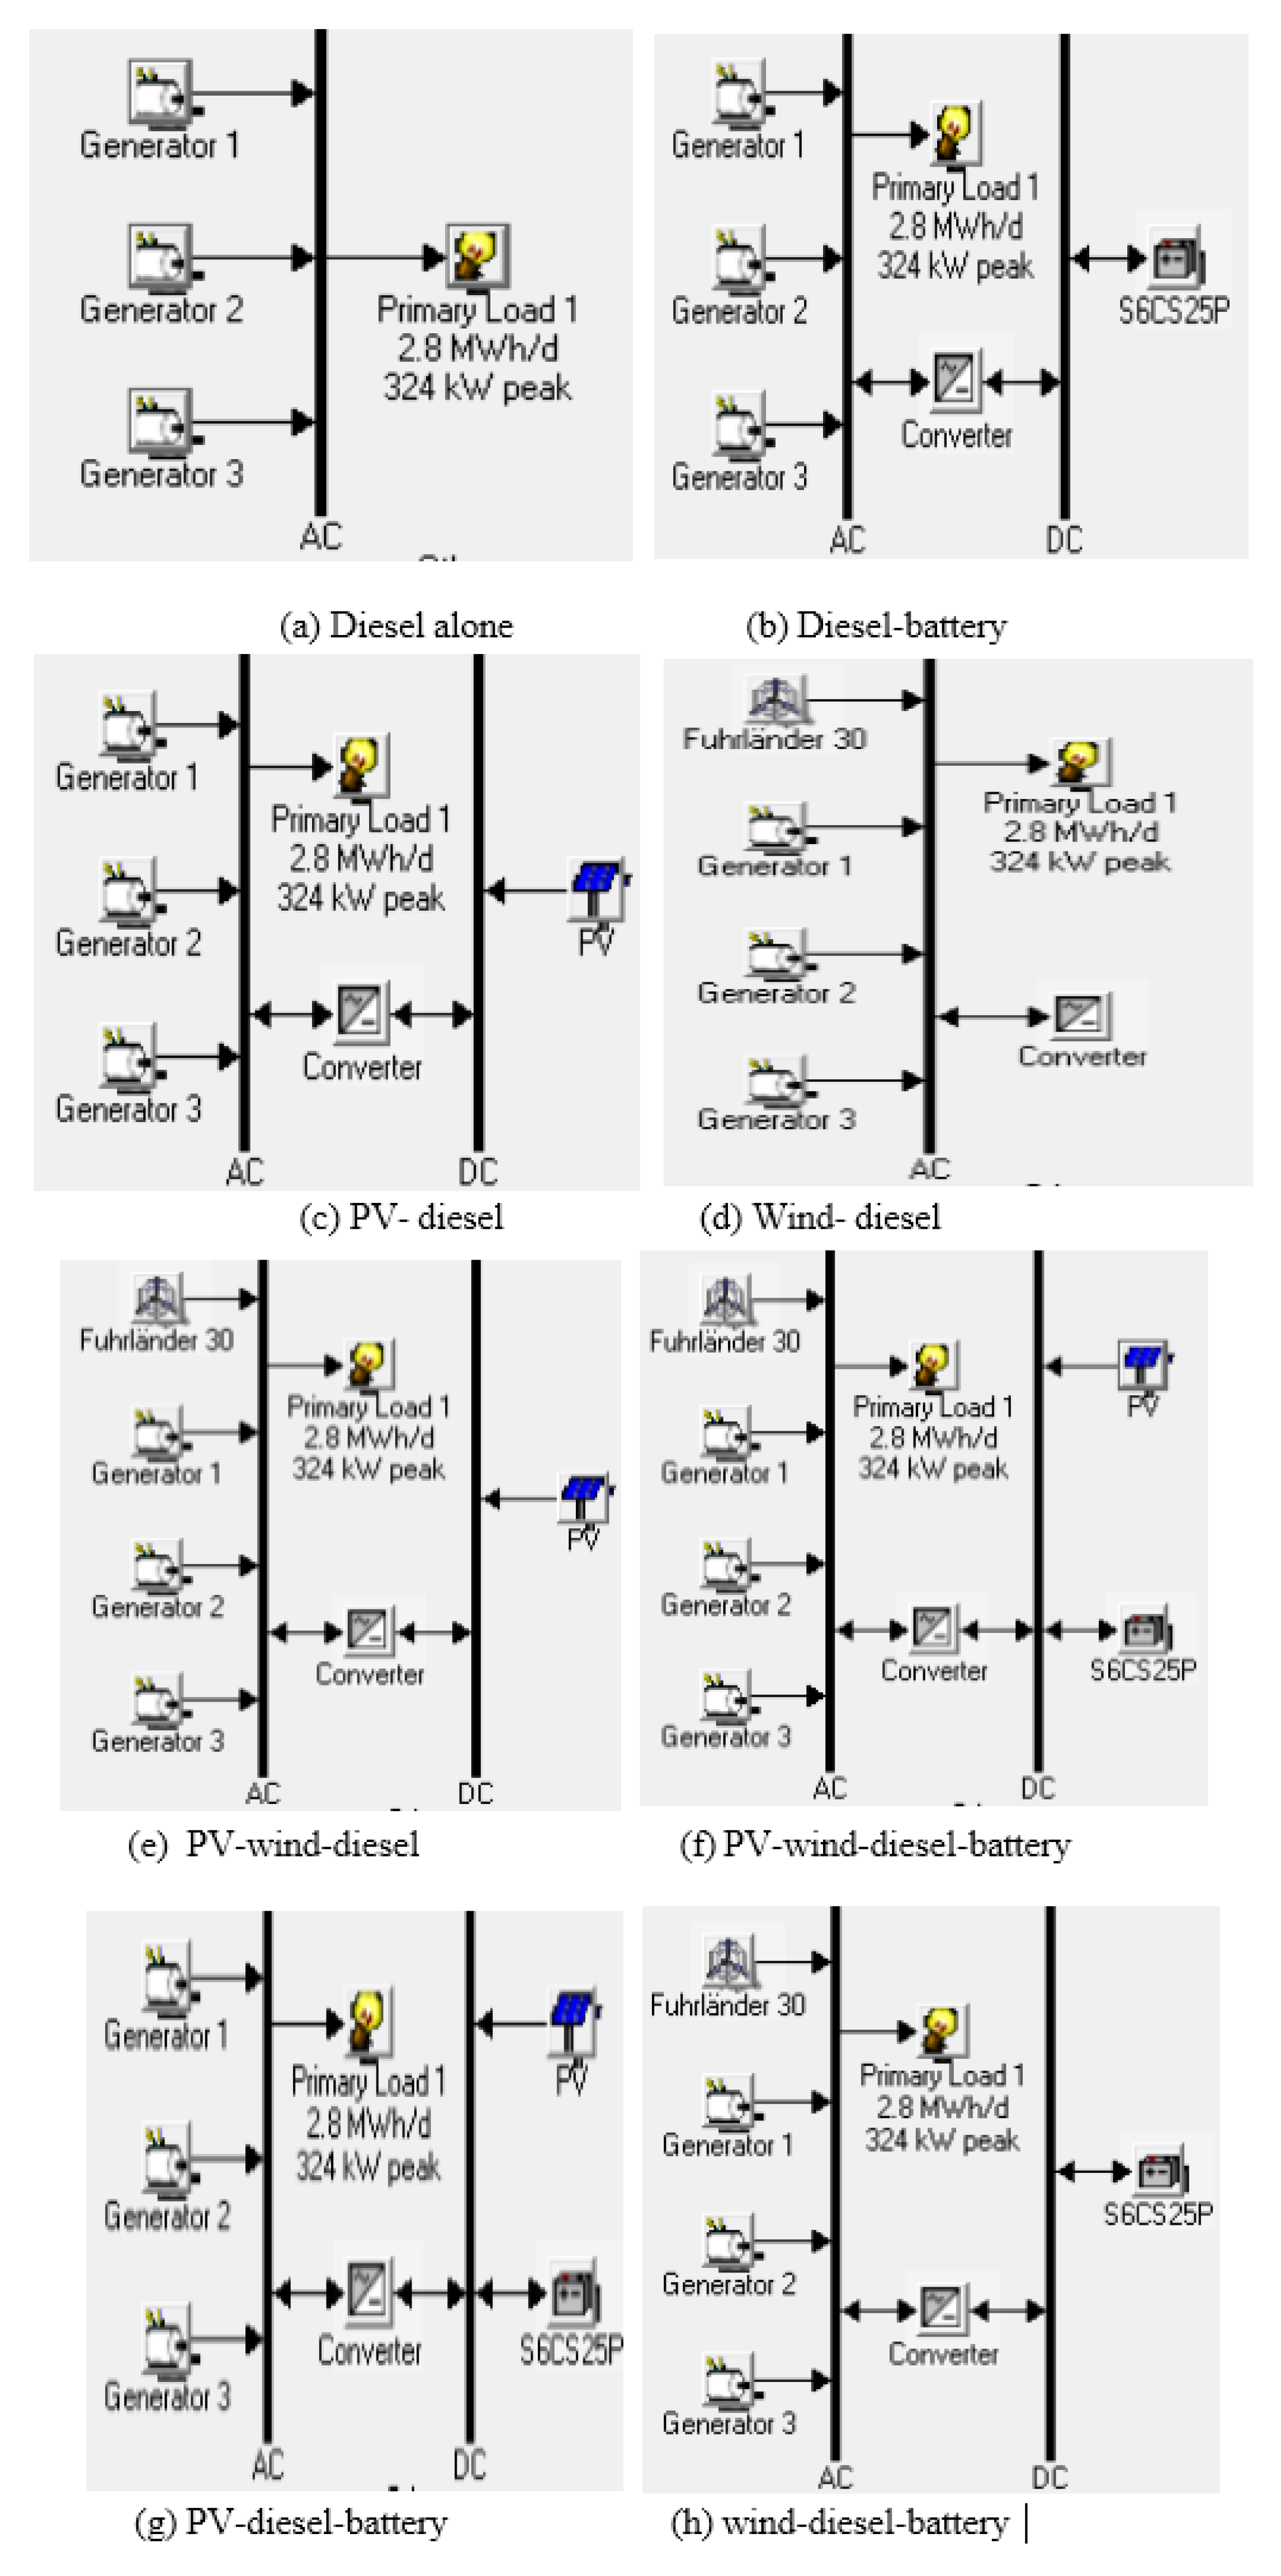
All eight possible configurations, including the existing base case, were simulated and optimized by the HOMER software (
Figure 6). It is evident from the results shown in
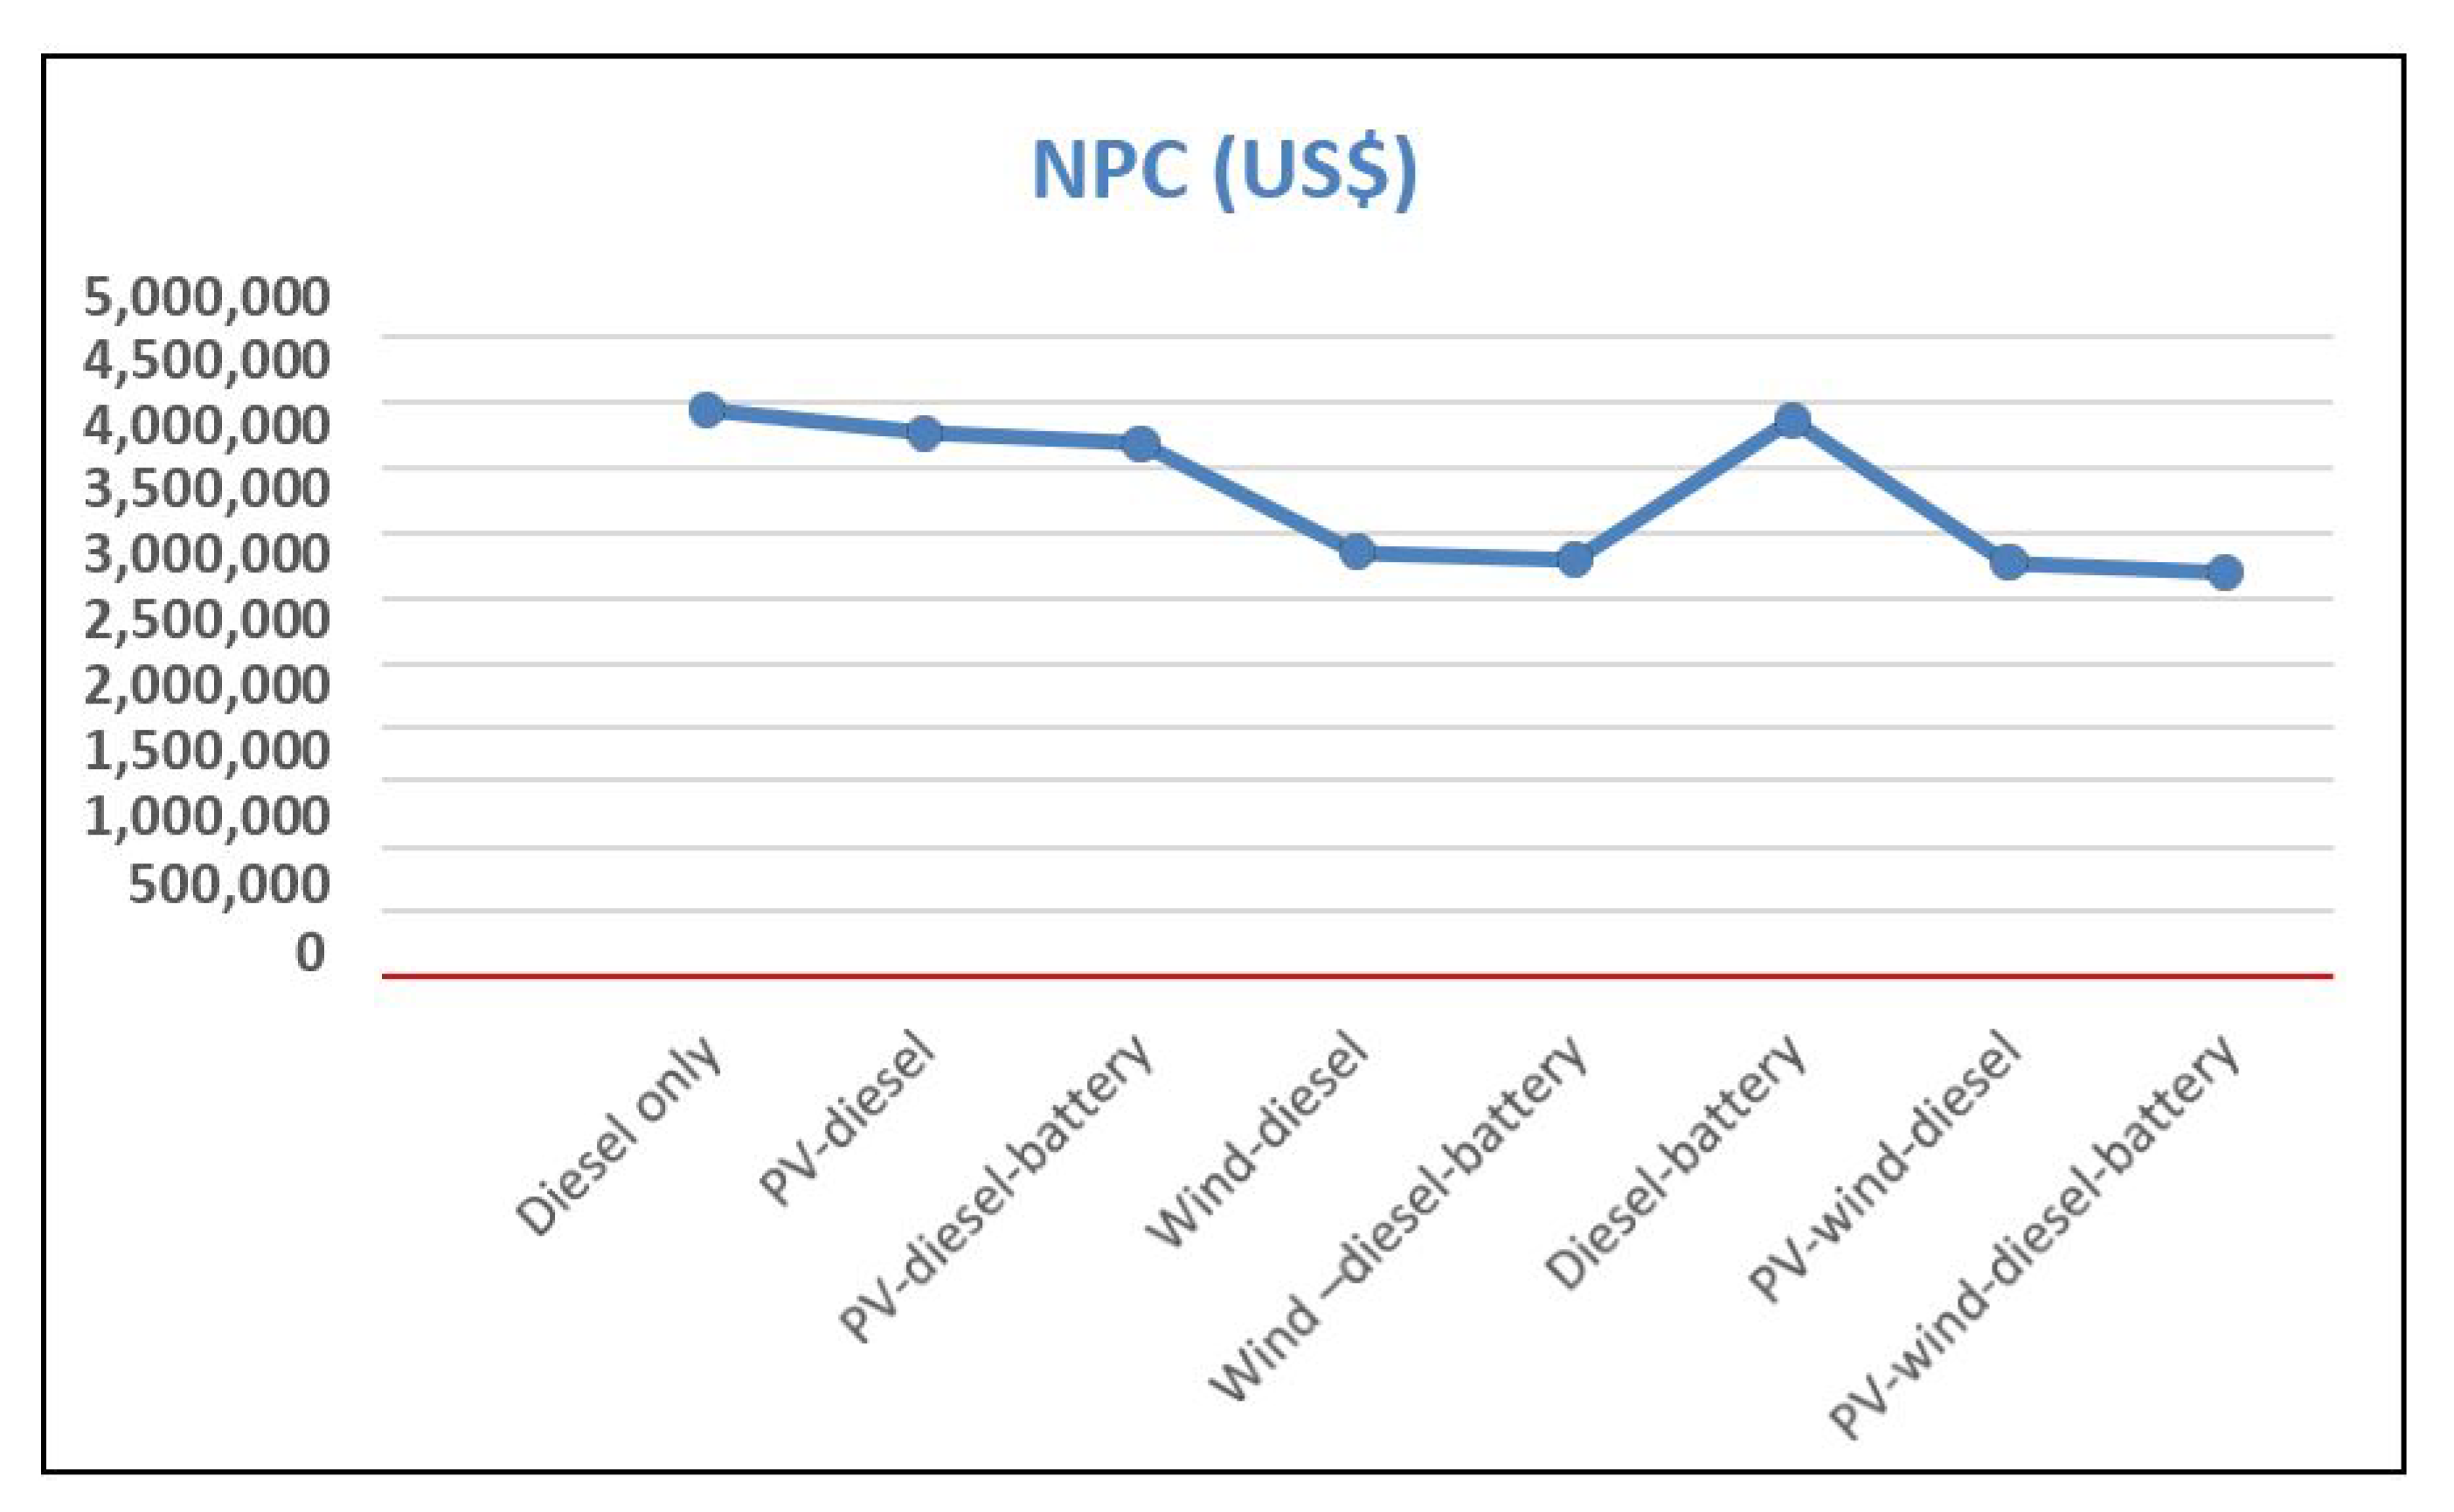
Table 2 that the PV-wind-diesel-battery hybrid system is the most feasible system, having the lowest COE and NPC. This can also be seen in
Figure 7.
In contrast, despite having the lowest initial capital cost, the diesel-only system seems to be the worst system in terms of the highest NPC and COE. This is because of the high consumption of fuel, as well as the high operation and maintenance costs associated with the generators. Replacement costs, which was the same as the initial capital cost for this system, is responsible for it as well.
However, in other systems, the initial capital cost is higher compared to the diesel-only system due to the involvement of lots of (100 kW) PV panels and wind turbines (240 kW). The third-highest diesel consumption goes to the PV-diesel system. It can be noted that wind provides better renewable energy fraction (RF) than solar energy for all possible combinations. Thus, the wind-diesel system reduces the energy cost by more than 50% compared to the PV-diesel system. Again, since the wind-diesel system does not need a converter to do DC-AC or AC-DC operation, it plays a small role in achieving low COE and NPC as well. However, if the O & M cost increases for wind turbines, which is most likely due to the transportation cost to St. Martin’s Island from the mainland, Chittagong, or Dhaka, the case would possibly be different. It is worth mentioning that HOMER used all three generators to optimize those systems and the best optimal case took the least capacity of generators to produce electricity.
Out of all eight cases, two cases were broadly analyzed by HOMER. The cases are the diesel-alone microgrid system, and the PV/Wind/Diesel/Battery Hybrid microgrid system.
Note that the first one is the base case, while the second case is the proposed power system for St. Martin’s Island. Comparative, optimization, risk, and sensitivity analyses of these two cases would show the viability of employing the proposed system. Firstly, the optimization analysis is broadly discussed in the following sections.
4.1.1. Case 01: Diesel-Based Microgrid System
A base case with a "business as usual" approach was optimized to observe the technical, social, and economic performance of a diesel-only system without supplying energy storage or any other renewable energy sources. It is worth mentioning that currently, St. Martin’s Island is operating using this scenario. In this case, three diesel generators were used, which were 500, 200, and 30 kW in size.
Table 3 indicates the optimized techno-economic simulation result of this system. It shows that the system has a total Net Present Cost (NPC) of
$4,430,795 and an operating cost of
$336,322 per year. HOMER estimated the levelized Cost of Energy (COE) of
$0.340 per kilowatt hour (kWh). This is around 27.40 Bangladesh taka (BDT) in Bangladeshi currency, which is quite close to what the island’s people are currently paying.
As the medium generator, G2 (200 kW) is mainly used to produce electricity, as the most substantial amount of NPC comes from it. From the optimization results, G2 had the most share in producing electricity for this specific system, scaling up to 82% of the total production, while G1 and G3 only contributed 15% and 3%, respectively. It is evident that G1 mainly serves at peak time, which is quite low at St. Martin’s. However, note that the total electricity production is estimated at 1,029,234 kW/year.
Understanding how the system works requires a focus on how the generator operates. Obviously, G2 has the longest operating hours in a year-6472 h with a 48.1% capacity factor and
$15.7/hr fixed generation cost. G1 operates 646 h/year with a low capacity factor and high fixed generation cost due to its larger size, compared to G2. The marginal cost appears to be the same for all three generators. The rest of the operational specifications are pointed out in
Table 4.
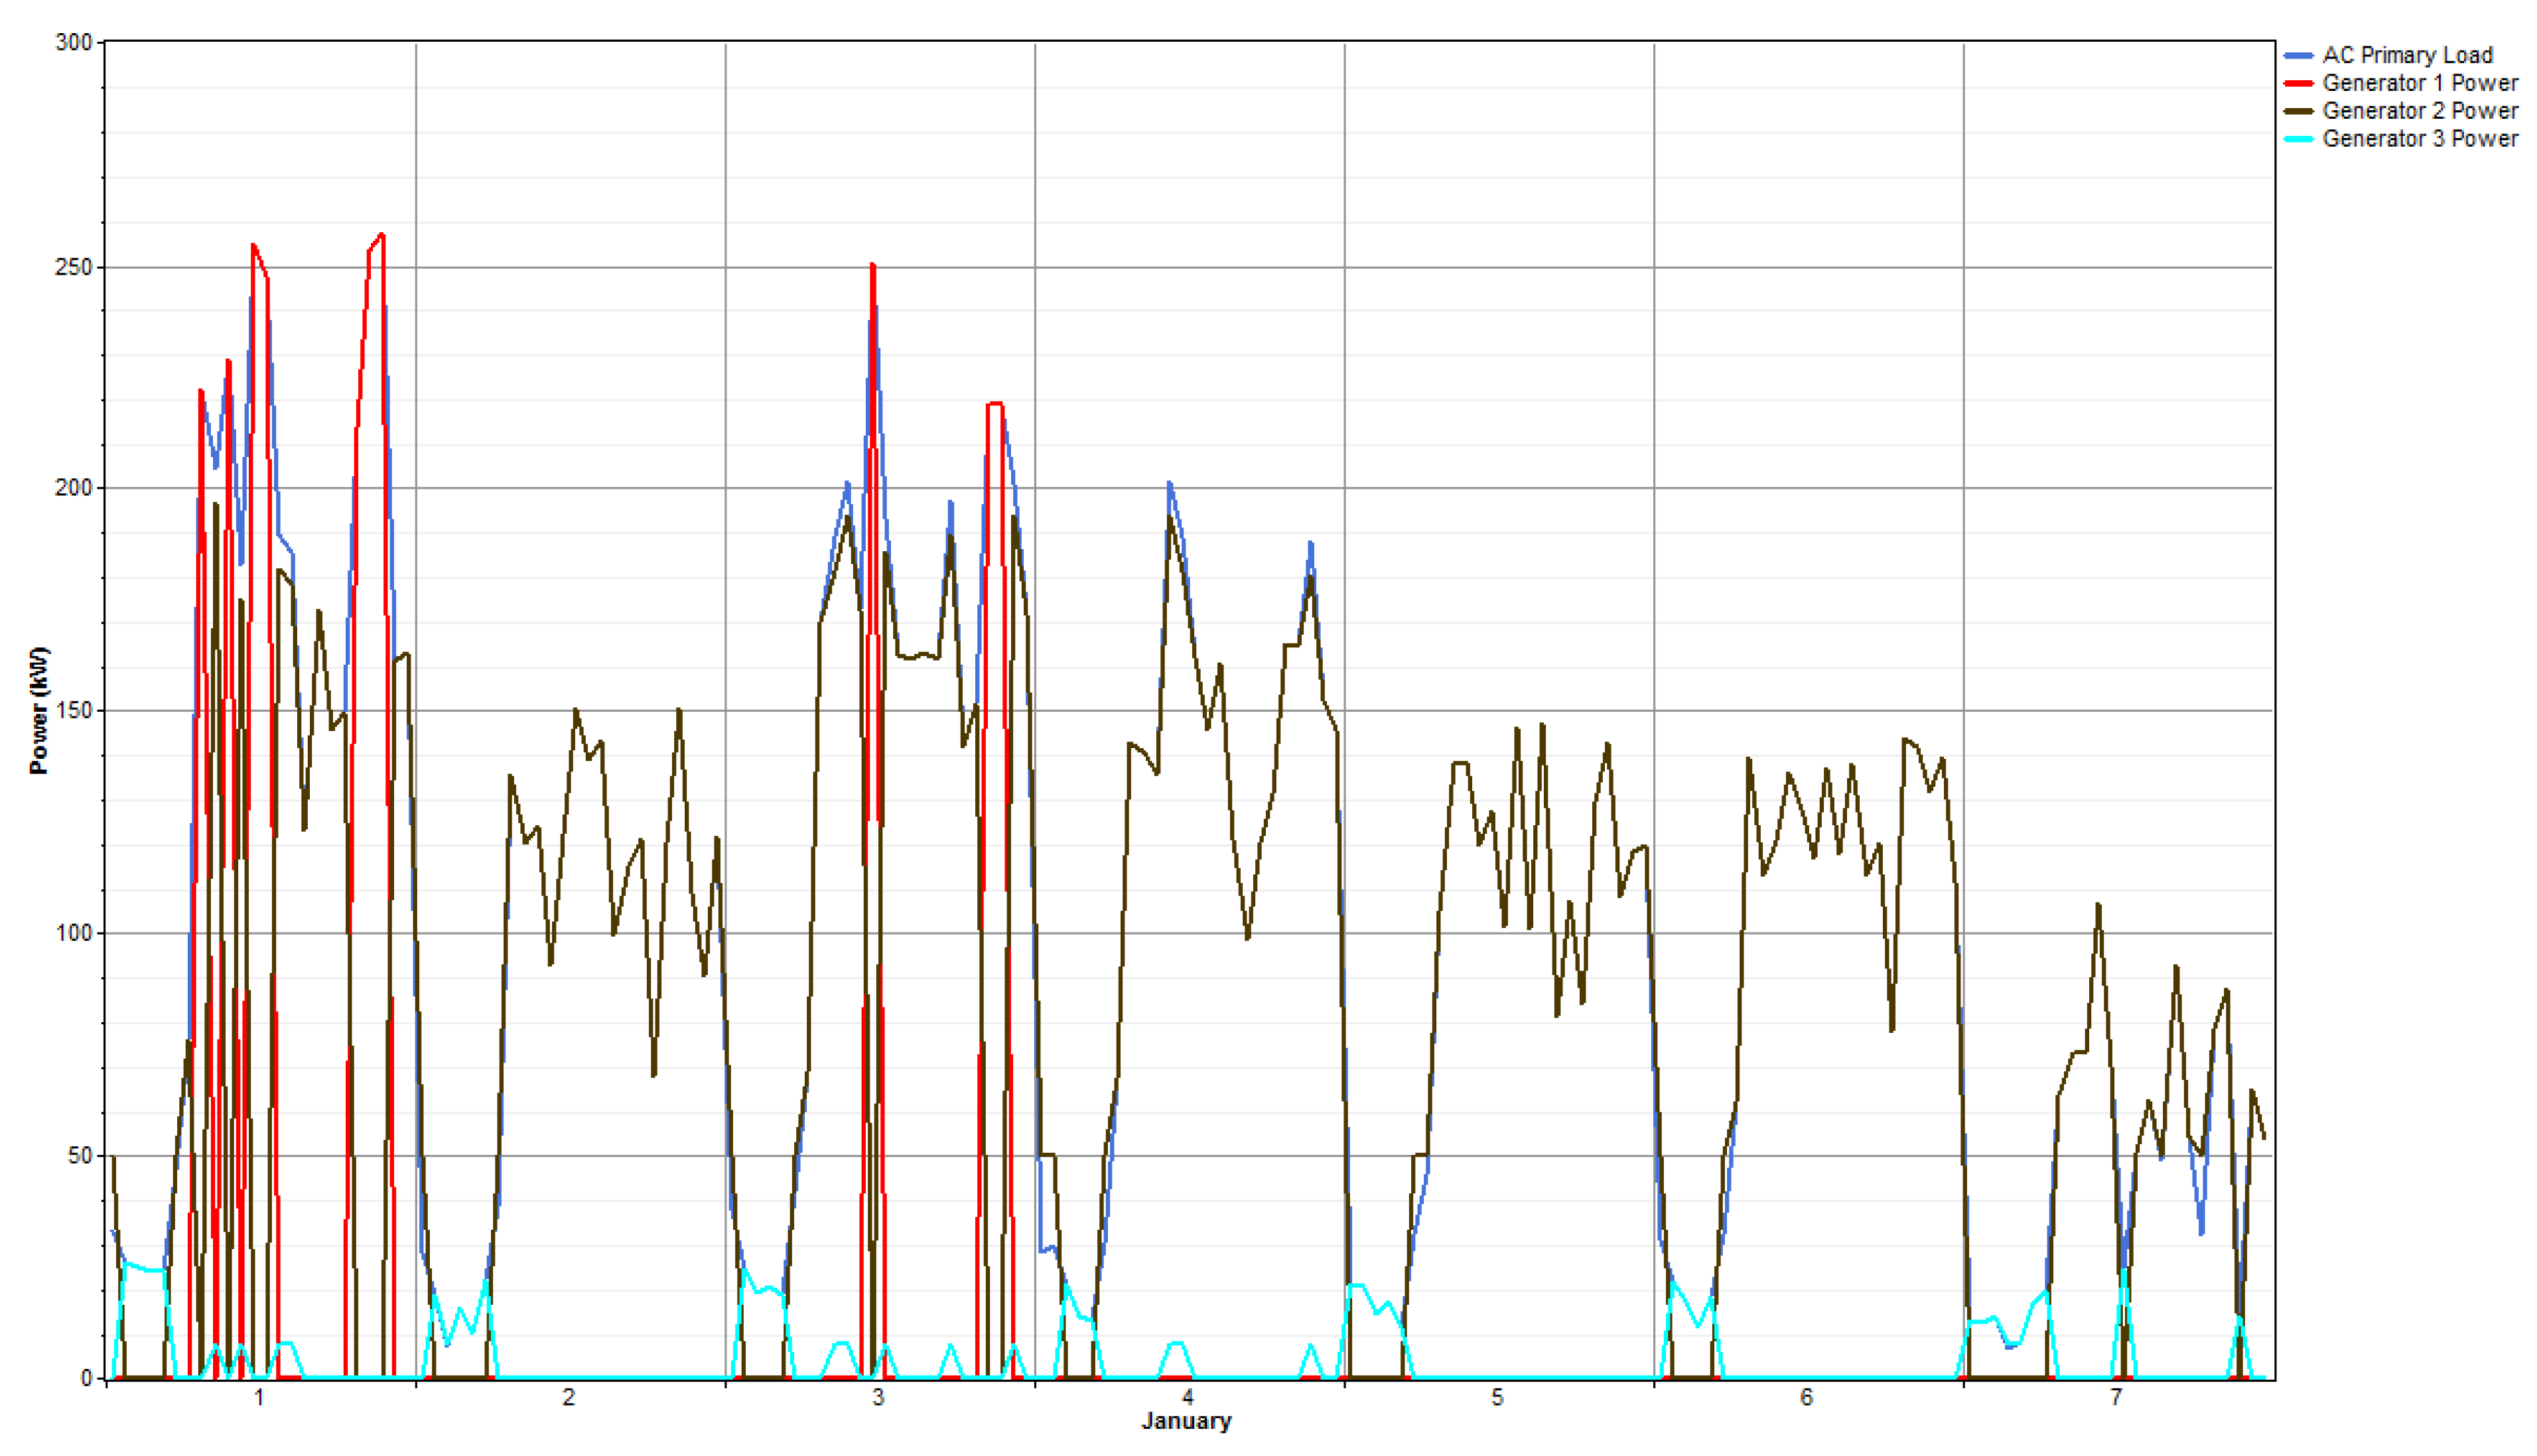
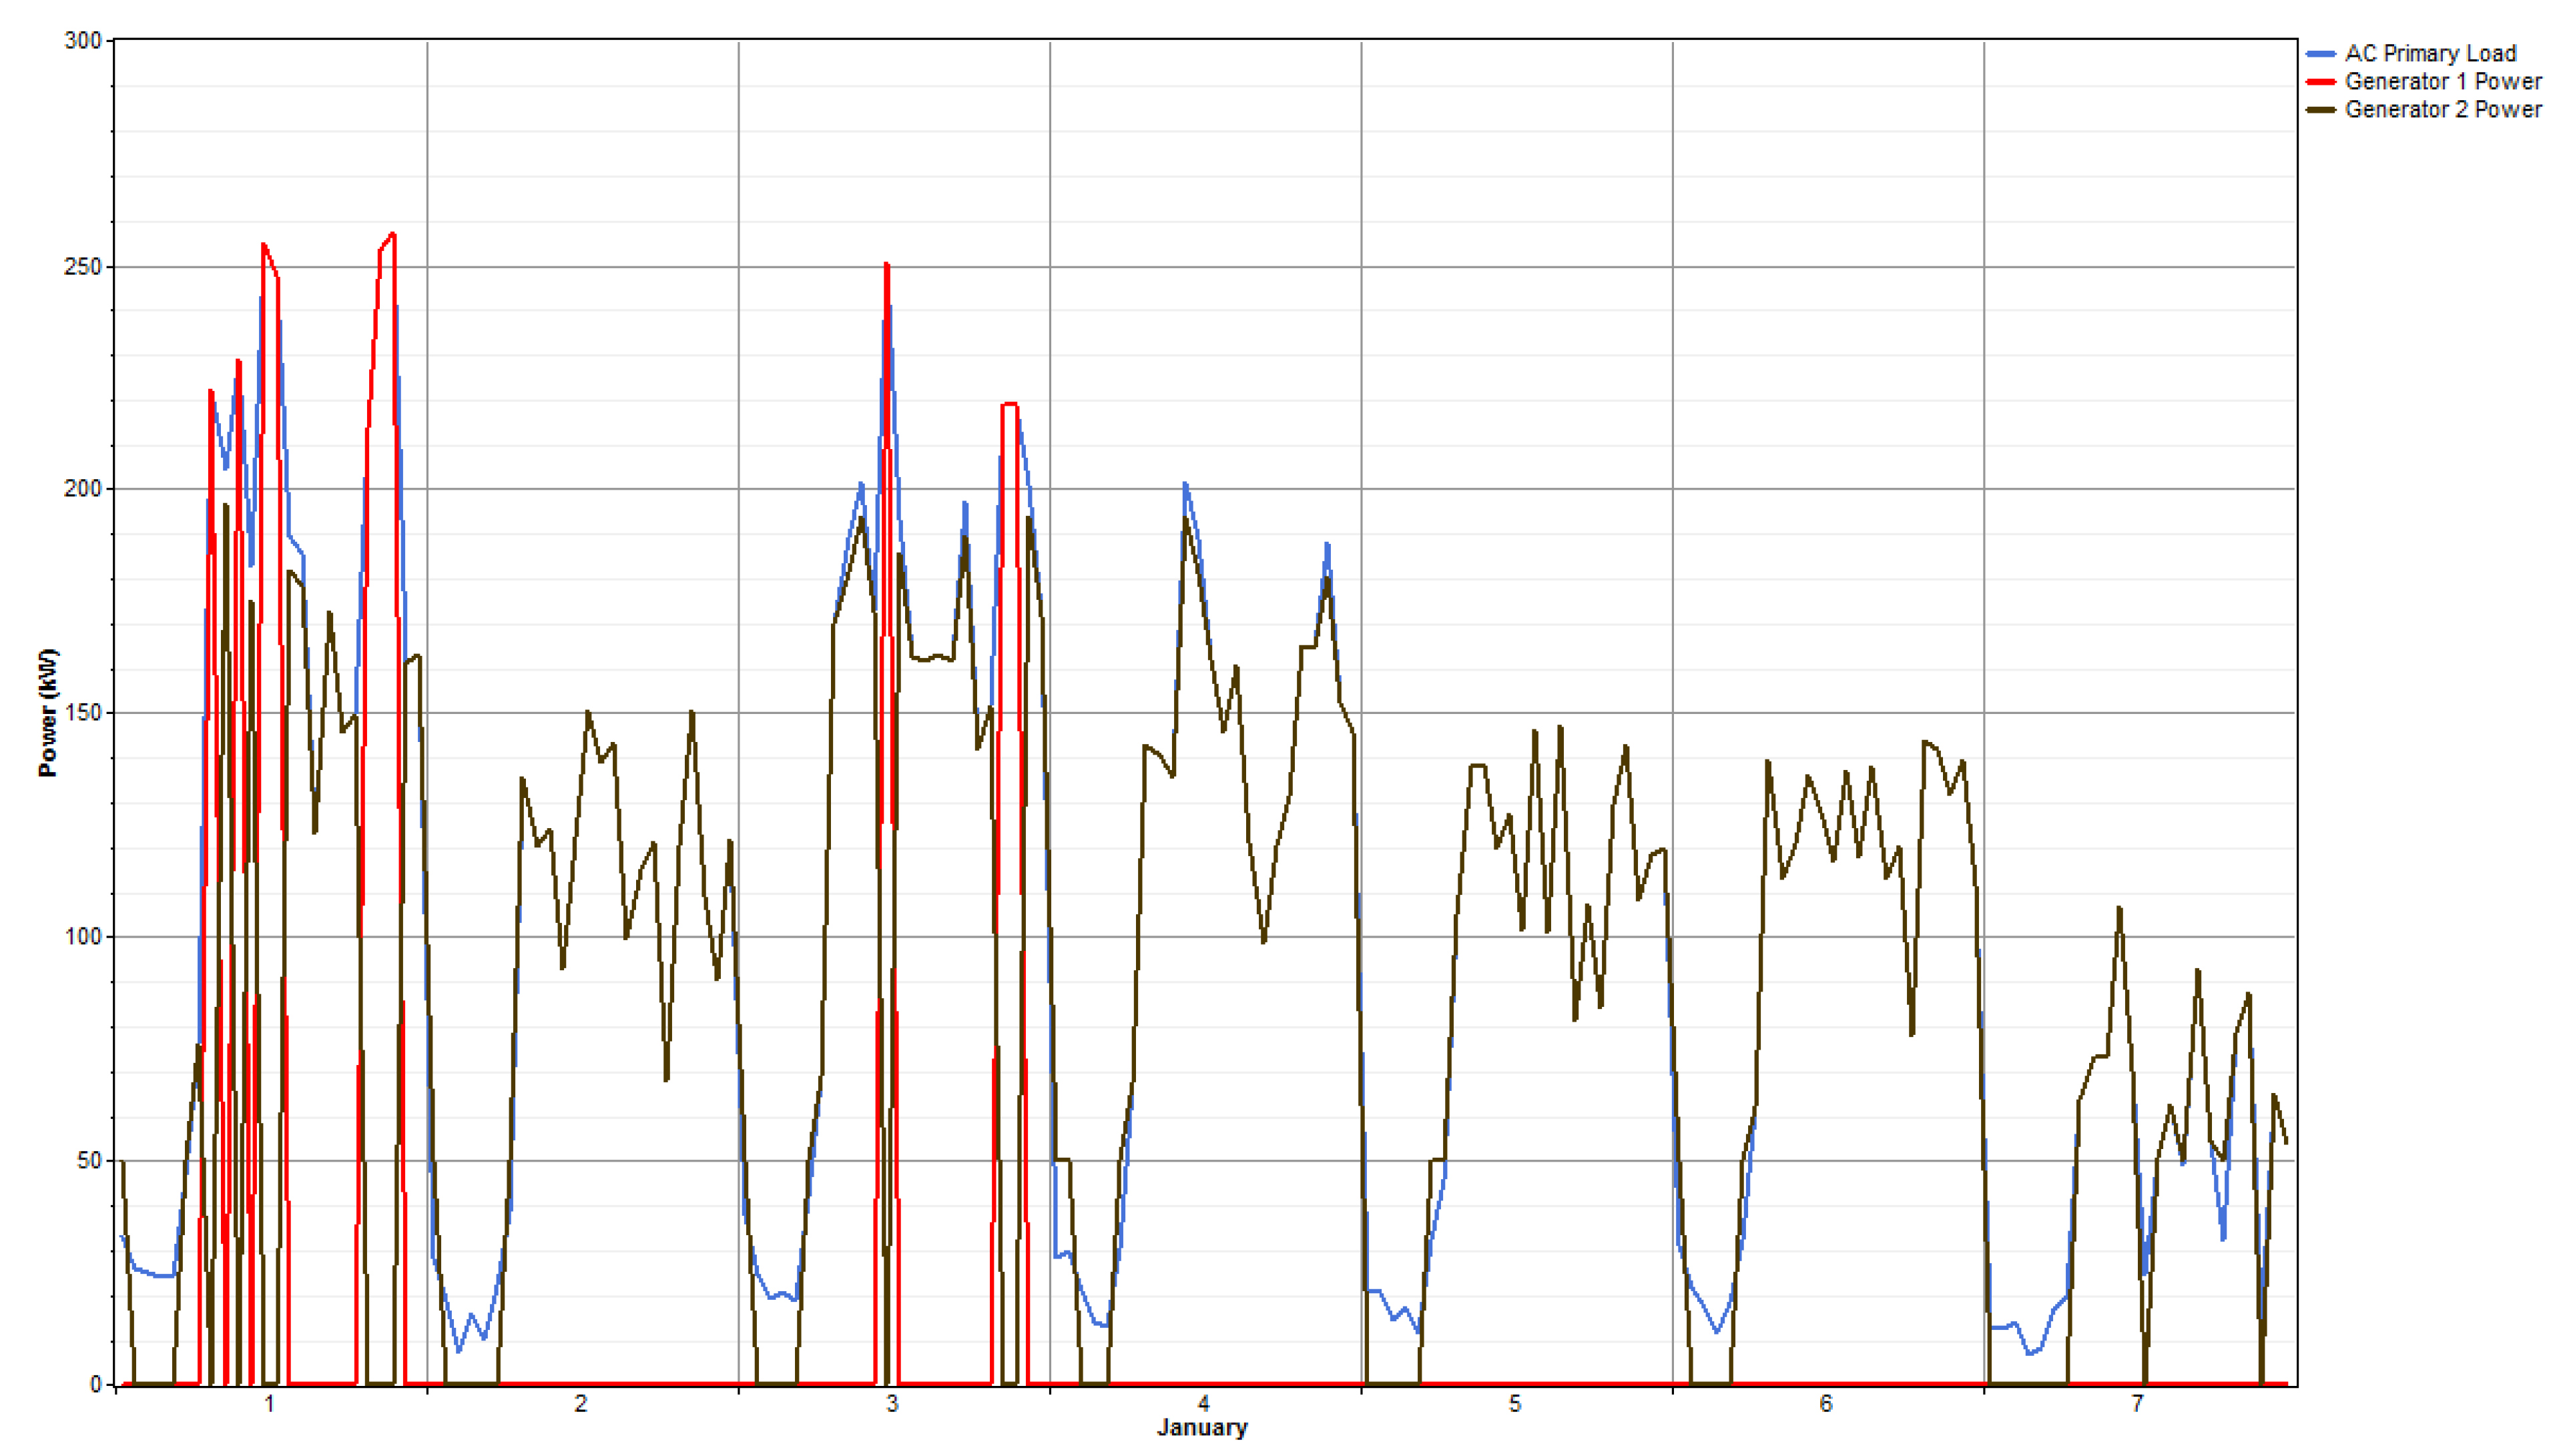
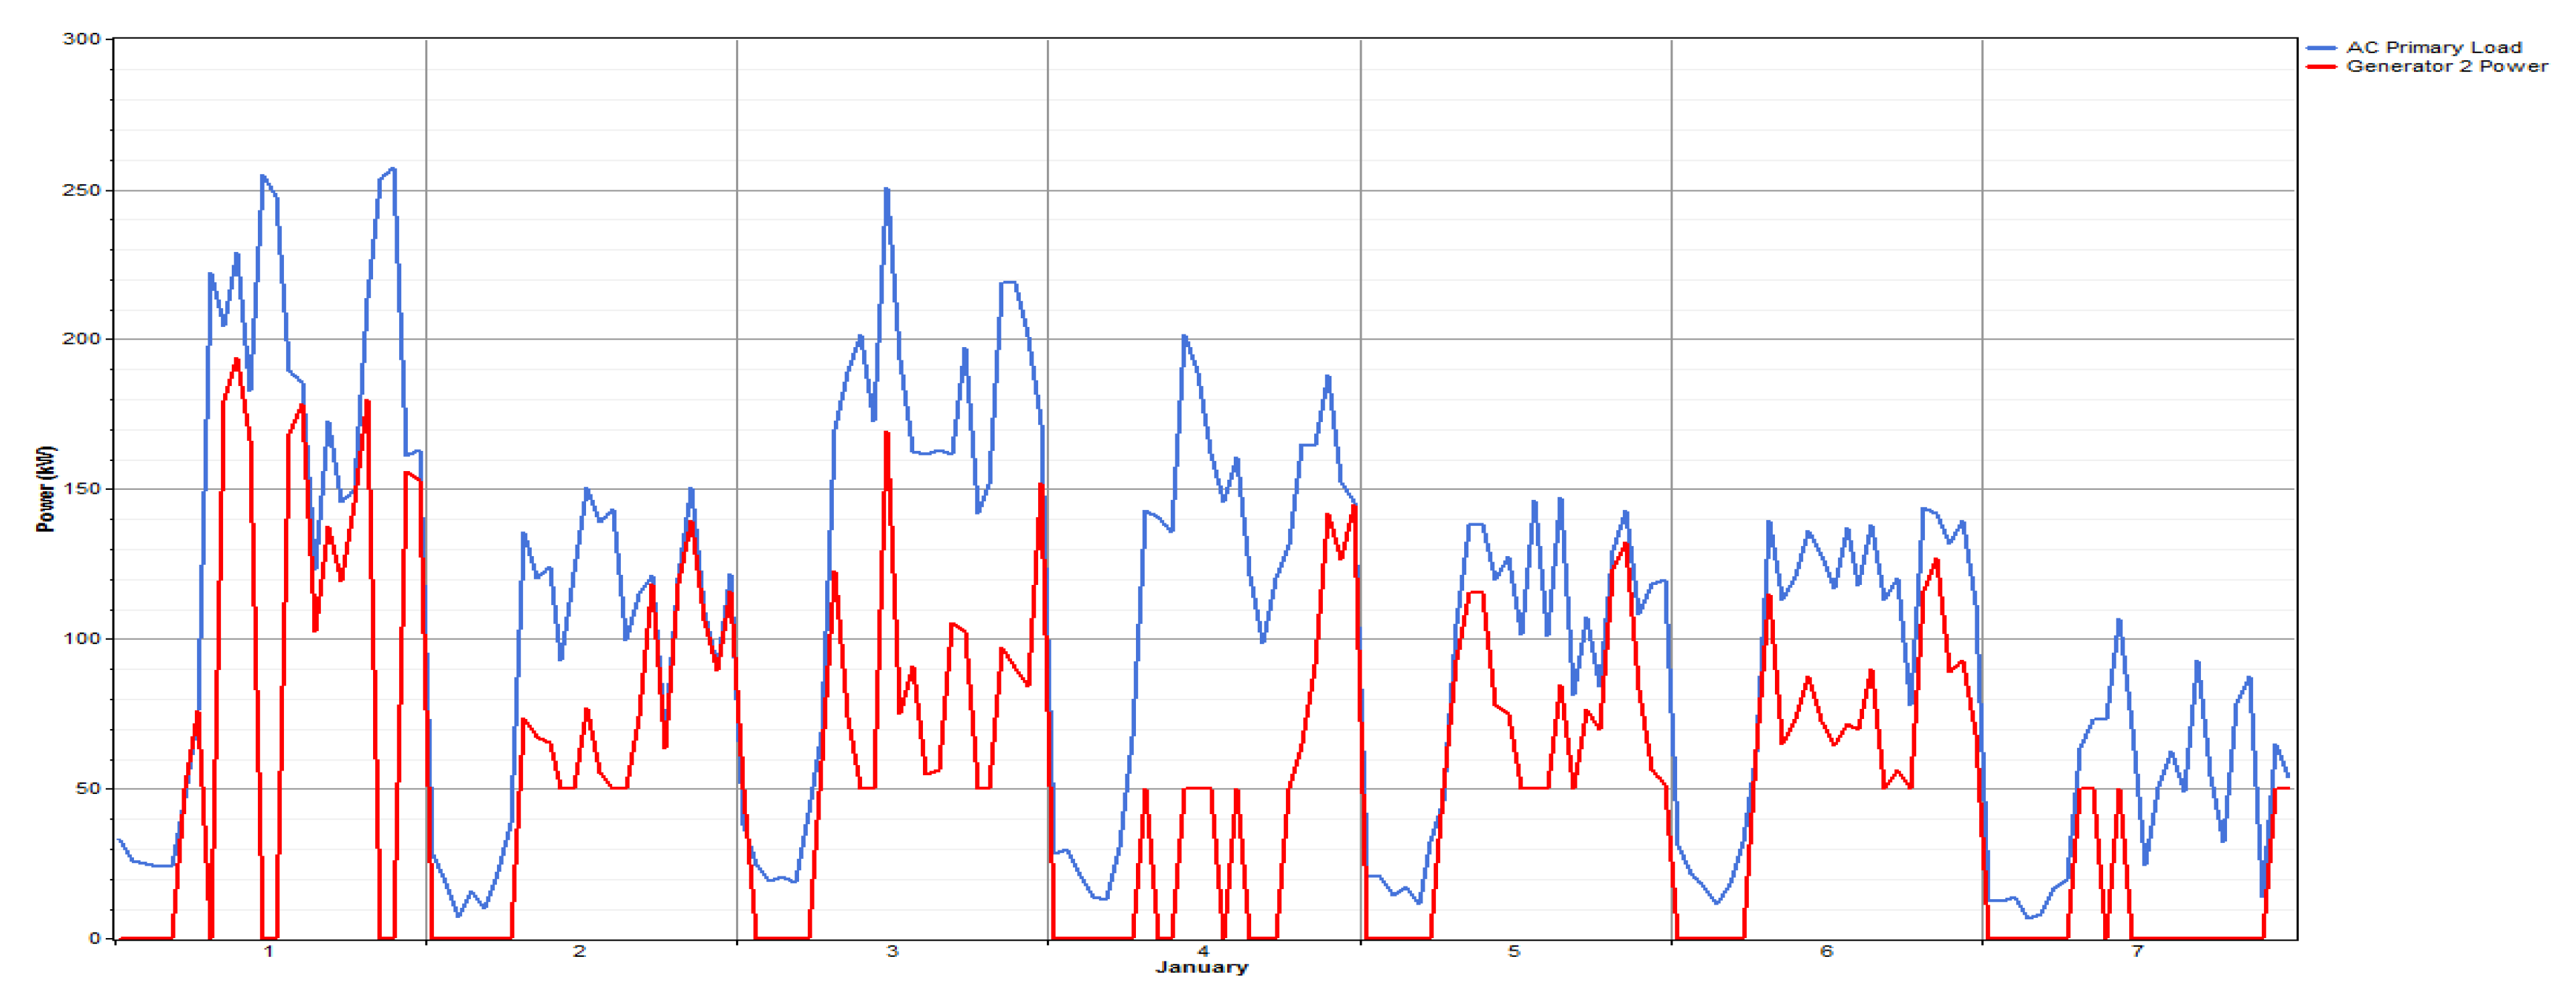
To have a closer look at how the system works, a sample week of January was simulated in HOMER.
Figure 8 indicates the behavior of all three generators to cover up the electricity demand.
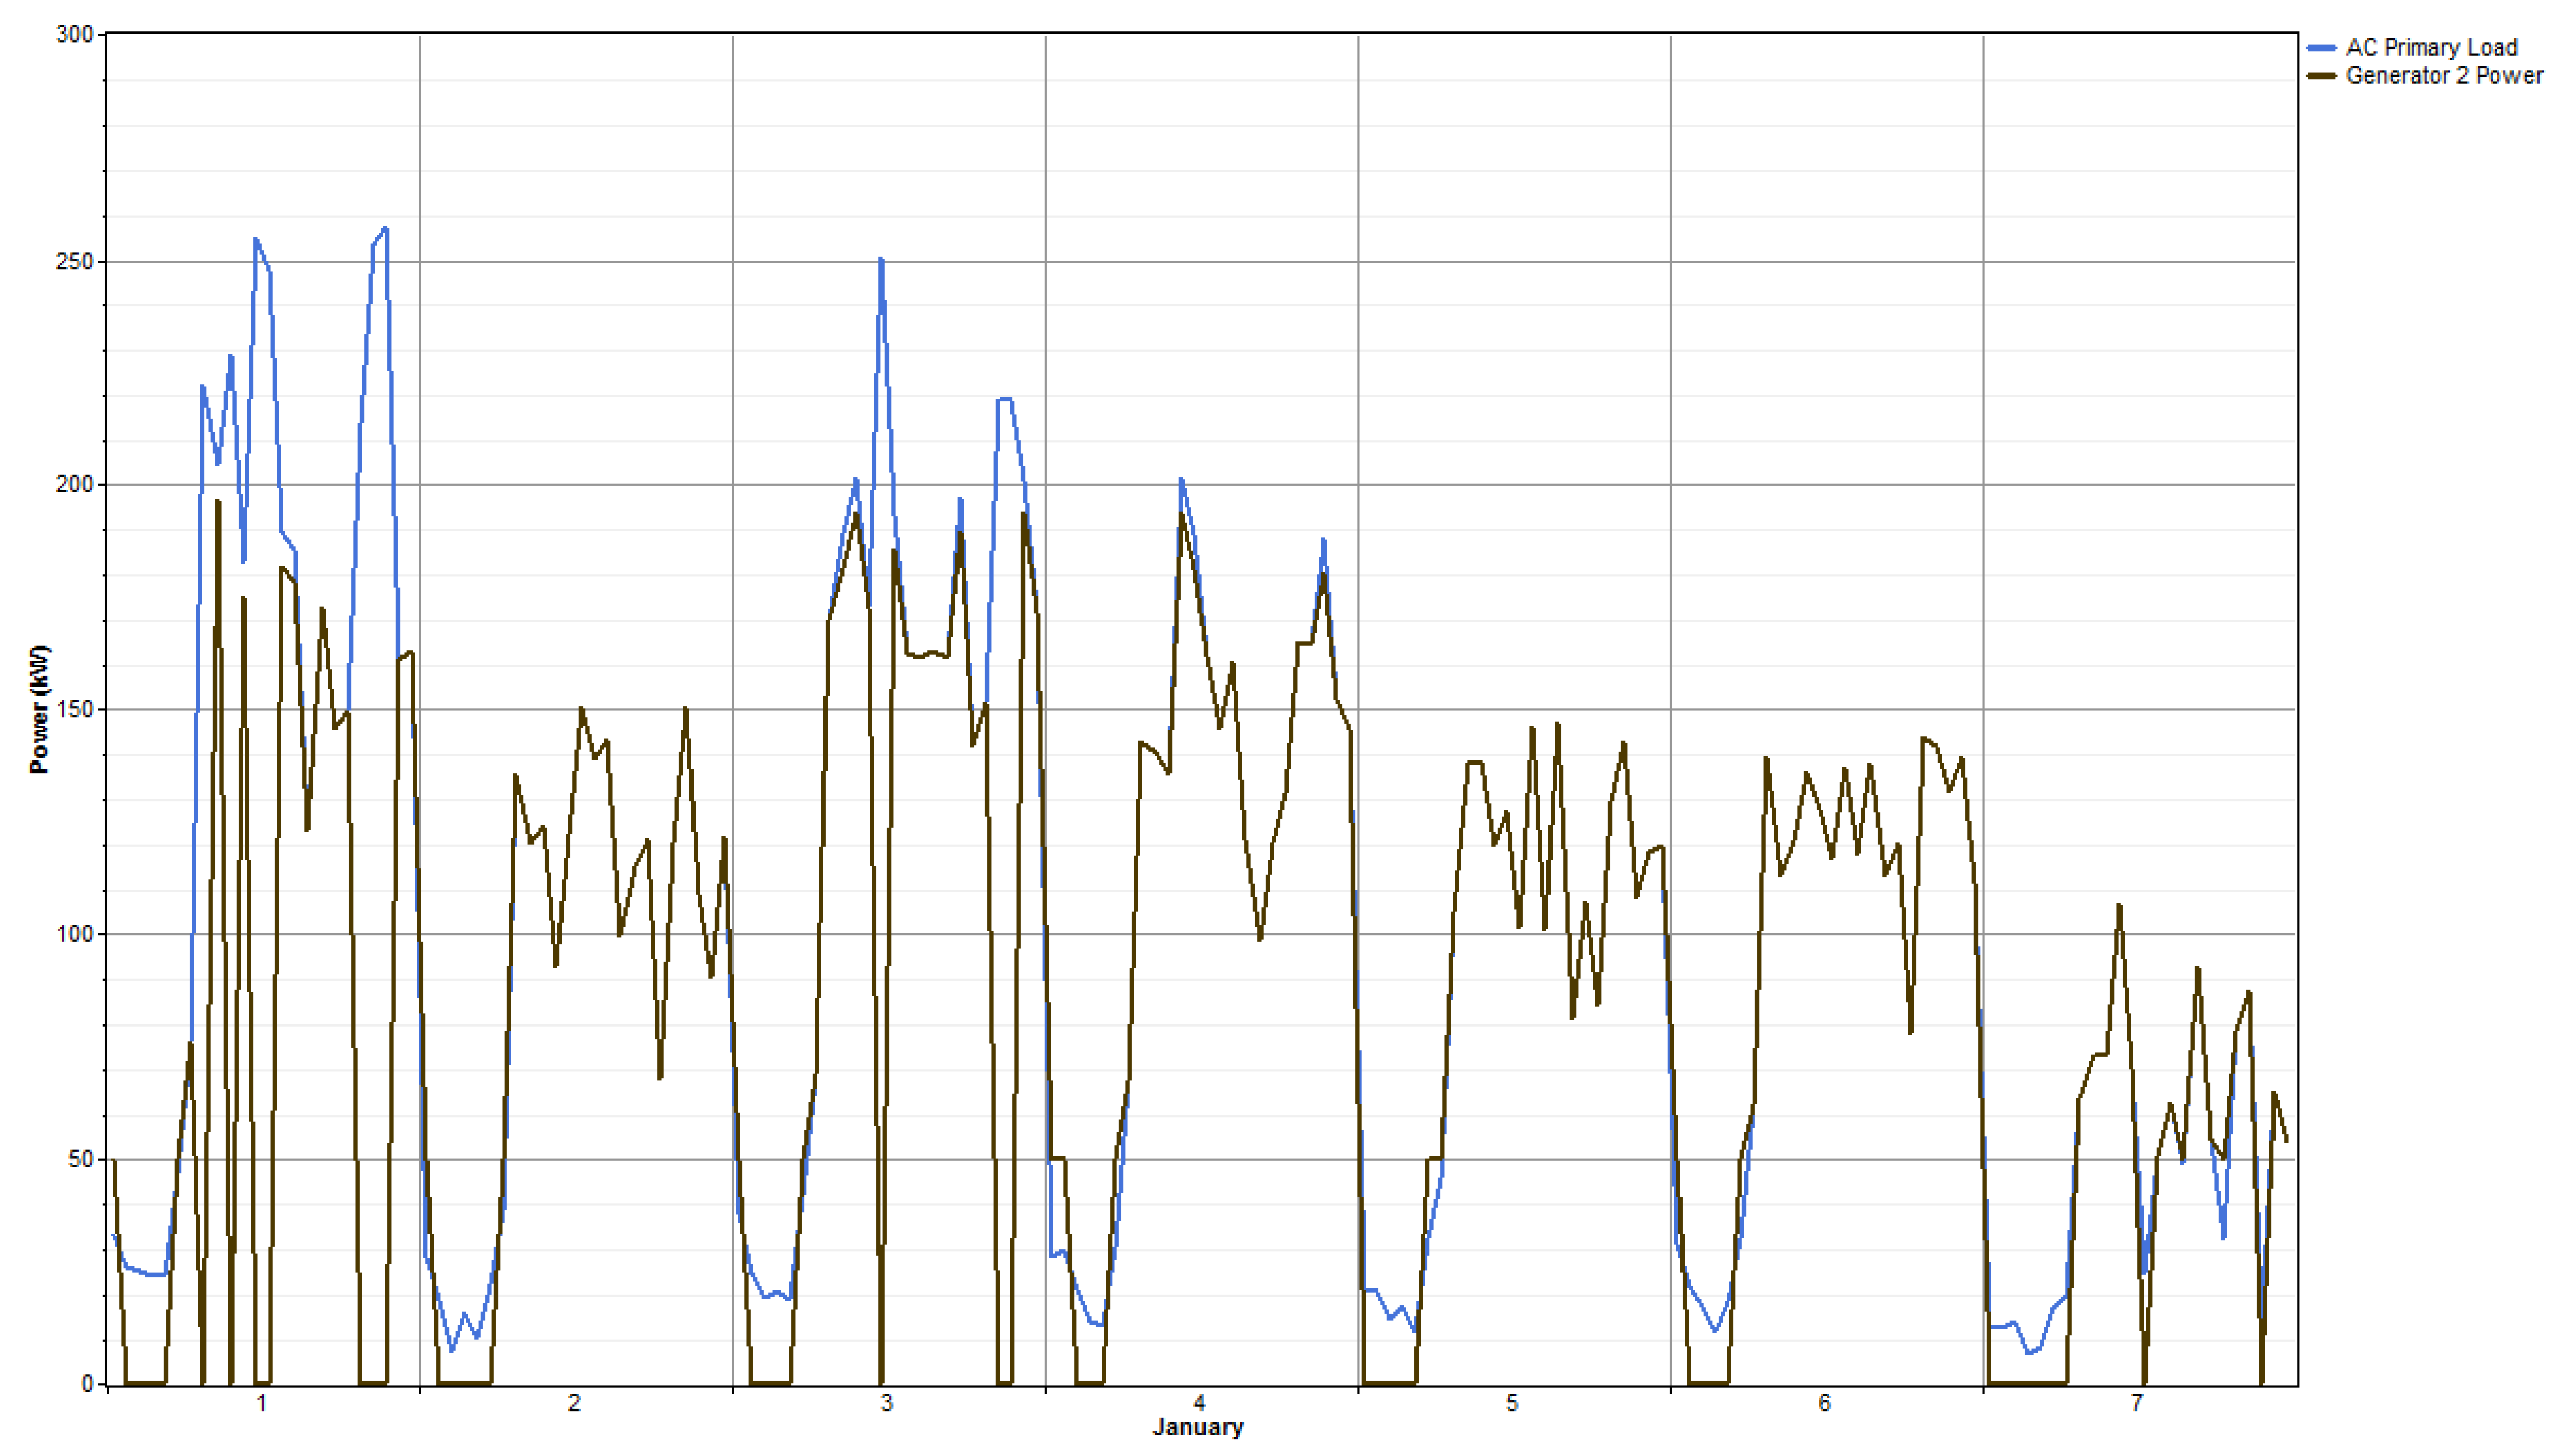
Figure 9 shows the impact of Generators 1 and 2 on the AC primary load, while
Figure 10 only considers the operational behavior of Generator 2.
It is clear from
Figure 10 that Generator 2 almost meets all the demands for this case. Comparing
Figure 9 and
Figure 10, it can be seen that the large 500 kW generator only covers the load when it increases over 190 kW for a few days at the start of a week. However, in that process, it produces practically all extra electricity of the all systems, resulting in high fuel consumption of the system, which ultimately leads to high operating costs. Moreover,
Figure 8 shows the activities of all three generators to meet the load.
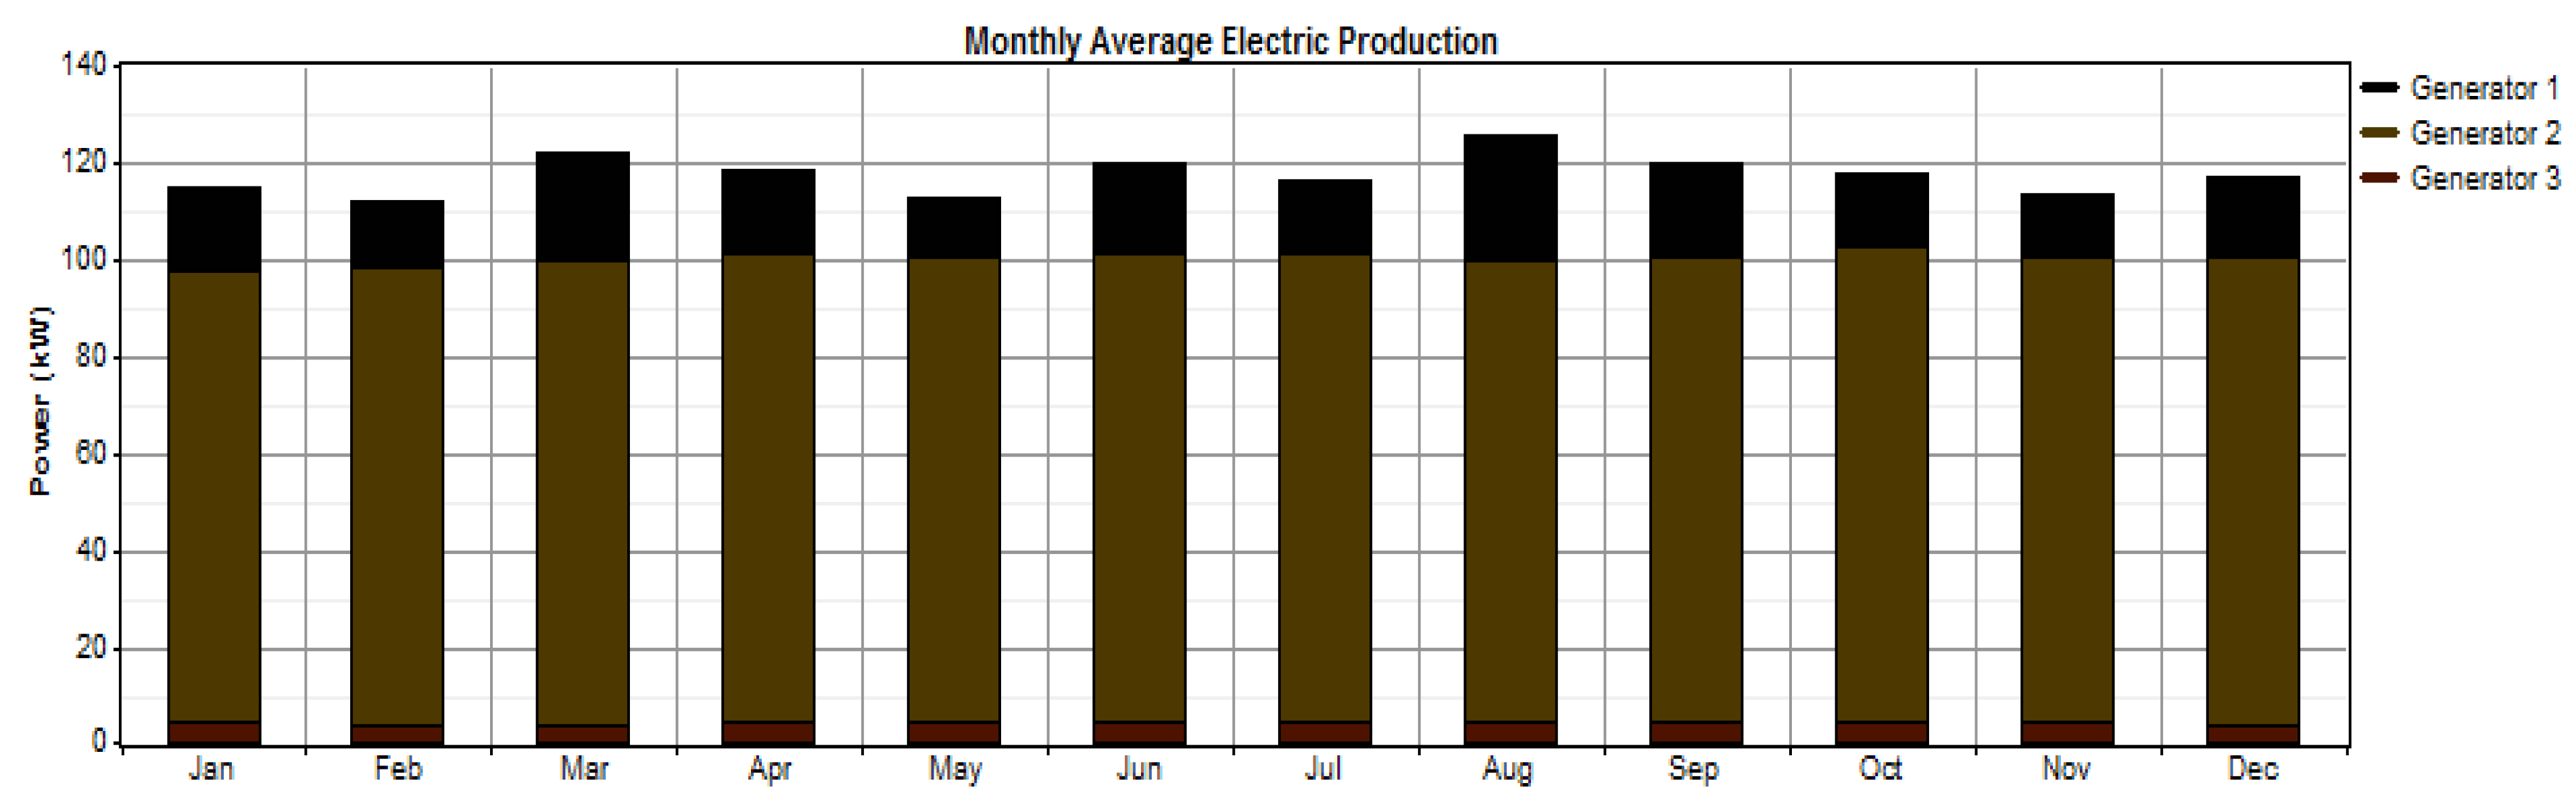
The electricity production by the generators per month for the existing diesel-alone system is indicated in
Figure 11. It clearly shows the dominance of Generator 2 in supplying electricity to the plant.
4.1.2. Case 02: PV-Wind-Battery-Diesel-based Hybrid Microgrid System
A PV-Wind-Battery-Diesel-based hybrid microgrid system was found to be the best way to address the ongoing electricity issues in St. Martin’s Island, Bangladesh. In this case, two renewable energy resources (solar and wind) with a battery bank were considered to reduce the burden from the diesel generators and thus decrease the electricity price to a reasonable level.
Table 5 summarises the optimization results.
Out of all eight possible systems, this hybrid system is best, mainly due to the reduction of cost of energy and NPC. The levelized COE reduced from $0.340 to $0.246, almost 28%, which is outstanding. The amount of NPC also came down by almost 28% compared to the base case. The 36% decrease of operation costs played a huge role in that. The operation cost was lower because the electricity contribution by the generators was lower (only 43%) when compared to the base case.
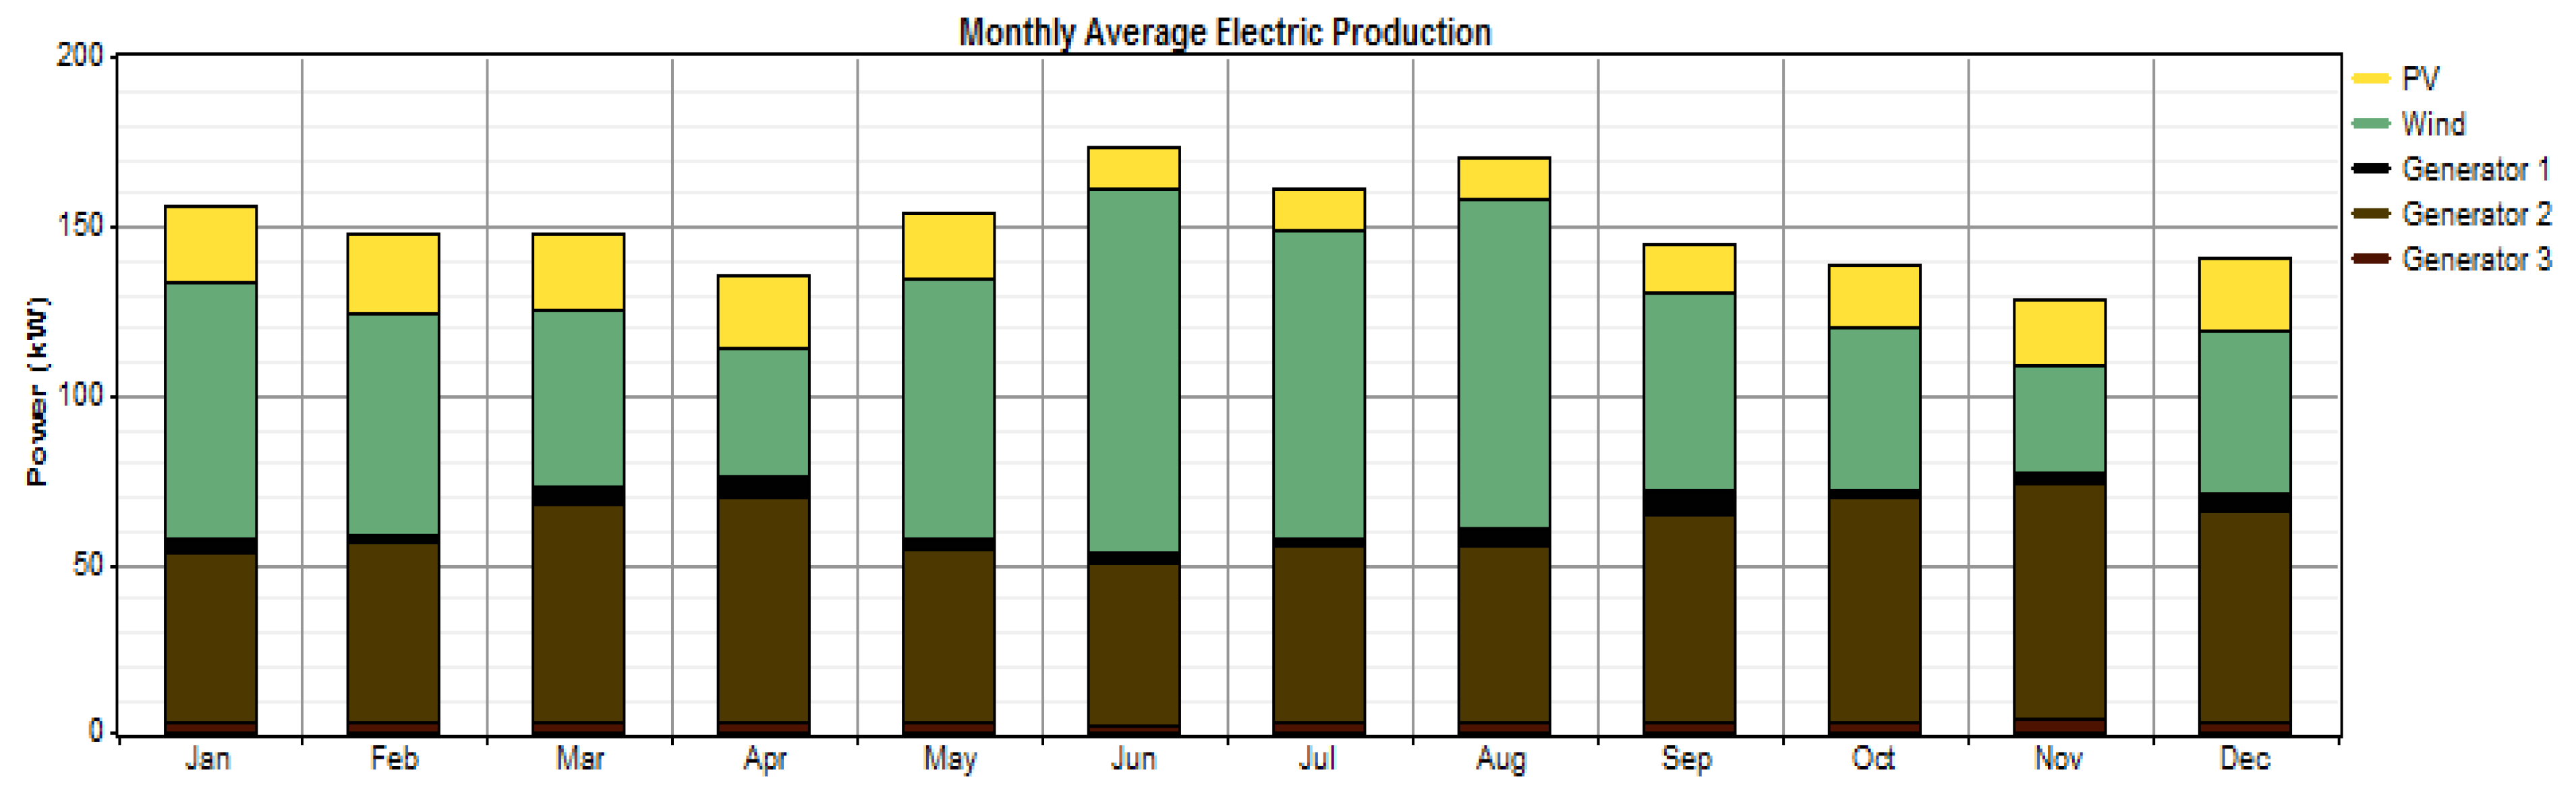
Table 5 demonstrates that wind technology contributes more than solar energy, leading by almost 27% of total electricity generation.
Figure 12 also shows the supremacy of wind over solar power in terms of energy production. This is because of the high capital cost of PV panels, which makes them unsuitable to add a greater share of renewable energy despite the massive accessibility of solar radiation throughout the year. On the contrary, wind energy seems to be the best renewable energy resource, backing 44% of total energy production in this microgrid system. This is due to the decent wind speed during the summer season of Bangladesh, which stays from May to August, producing more than 100 kW electricity in June and August, which can be seen in
Figure 12. Note that wind power generation is lowest in November, followed by April and October. It can also be noted that wind energy has the lowest particular levelized COE compared to PV and Battery.
From
Table 5 and
Table 6, it is evident that the generators show almost the same nature as the base case. The second generator has the most share (39% out of 44% diesel-based generation) among the three. It is worth mentioning that despite having the same marginal generation cost, the small and medium generators had a lower fixed generation cost. There is no unmet electricity in both cases, but in this system, excess electricity was produced almost 18% more. Taking a sample week of January,
Figure 12 depicts that it is mostly due to wind energy penetration.
In
Figure 13, the same month of January is simulated to see the operational activities of a 200 kW generator, like the one done in the base case in
Figure 10. It seems that Generator 2 has a lesser number (46) of starts per year compared to the diesel-alone system. It was possible mainly due to the high availability of wind power.
4.2. Sensitivity Analysis
It is highly recommended in a RE-based microgrid system to run a sensitivity analysis to observe the impact of several significant variables on the system’s overall cost and feasibility. Generally, sensitivity analysis is done by changing the input variable to observe the behavioral change of the output closely. Normally, the impact on NPC gets priority in such kinds of analysis. In HOMER, there are several kinds of technical and economic input, and can be varied. There are a lot of variations in the focus area for doing the sensitivity analysis. Mainly, the sensitivity analysis is performed by seeing the effect of the following parameters on the already optimized results, which are acquired with the standard/current value of inputs: daily load demand; deferrable load; wind speed; solar energy (radiation); diesel price; several cost (capital, operating, replacement and O&M) inputs and cost multiplier; grid extension cost; annual interest rate; and maximum capacity shortage.
For the best optimal system, that is, a PV–Wind–battery-Diesel system, several variables are uncertain, considering the situation in St. Martin’s. RE data taken from the satellite are not accurate enough. Instead, local ground data of the weather, measured for an extended period, is much appreciated, and an essential requirement for designing and analyzing any RE-based power system. To this intention, four of the most significant parameters, that is, diesel price, wind speed, solar radiation, and a primary load of the HOMER model were selected and varied 20% to 50% to see the change in outcome in relation to NPC and the levelized cost.
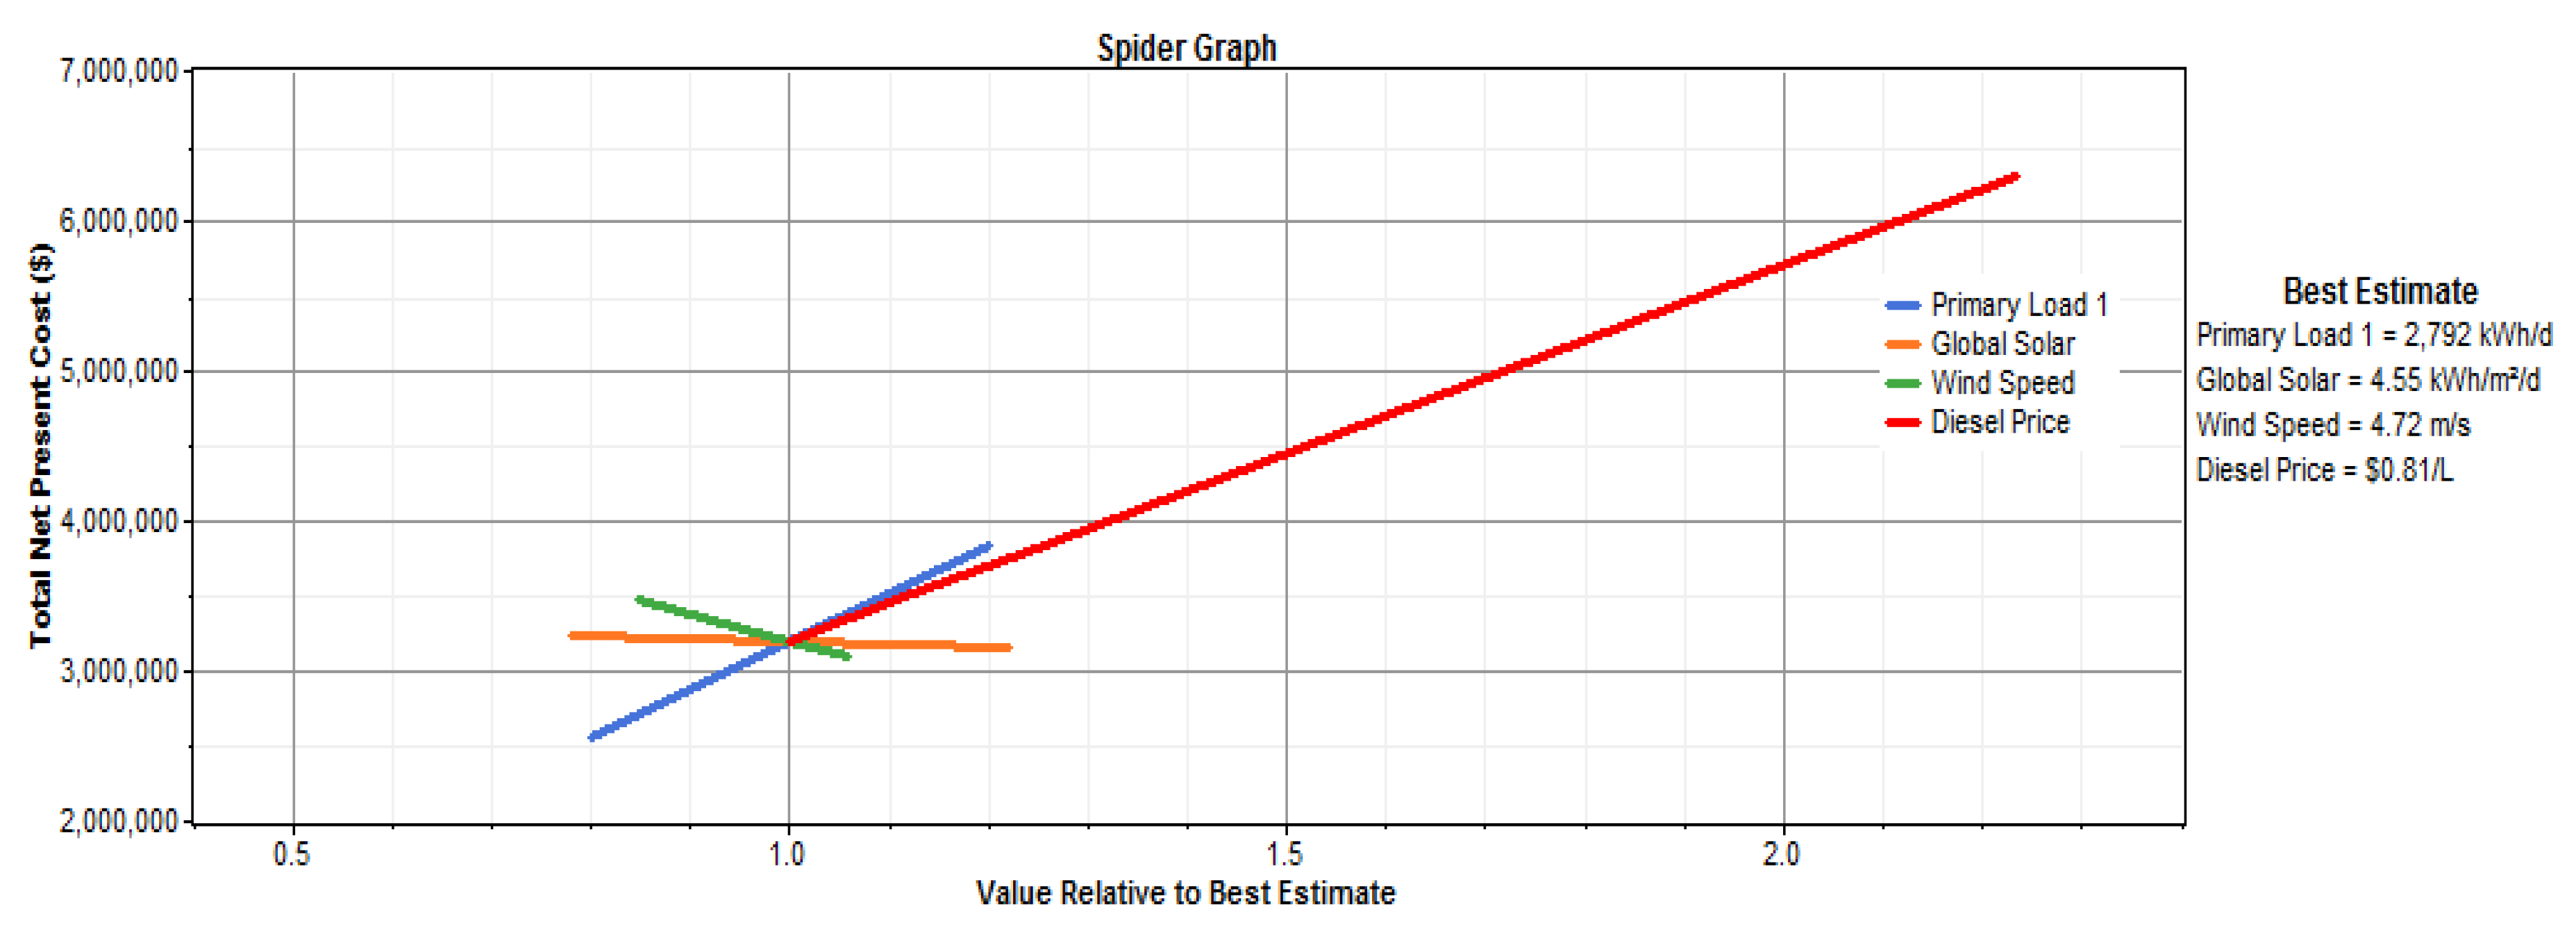
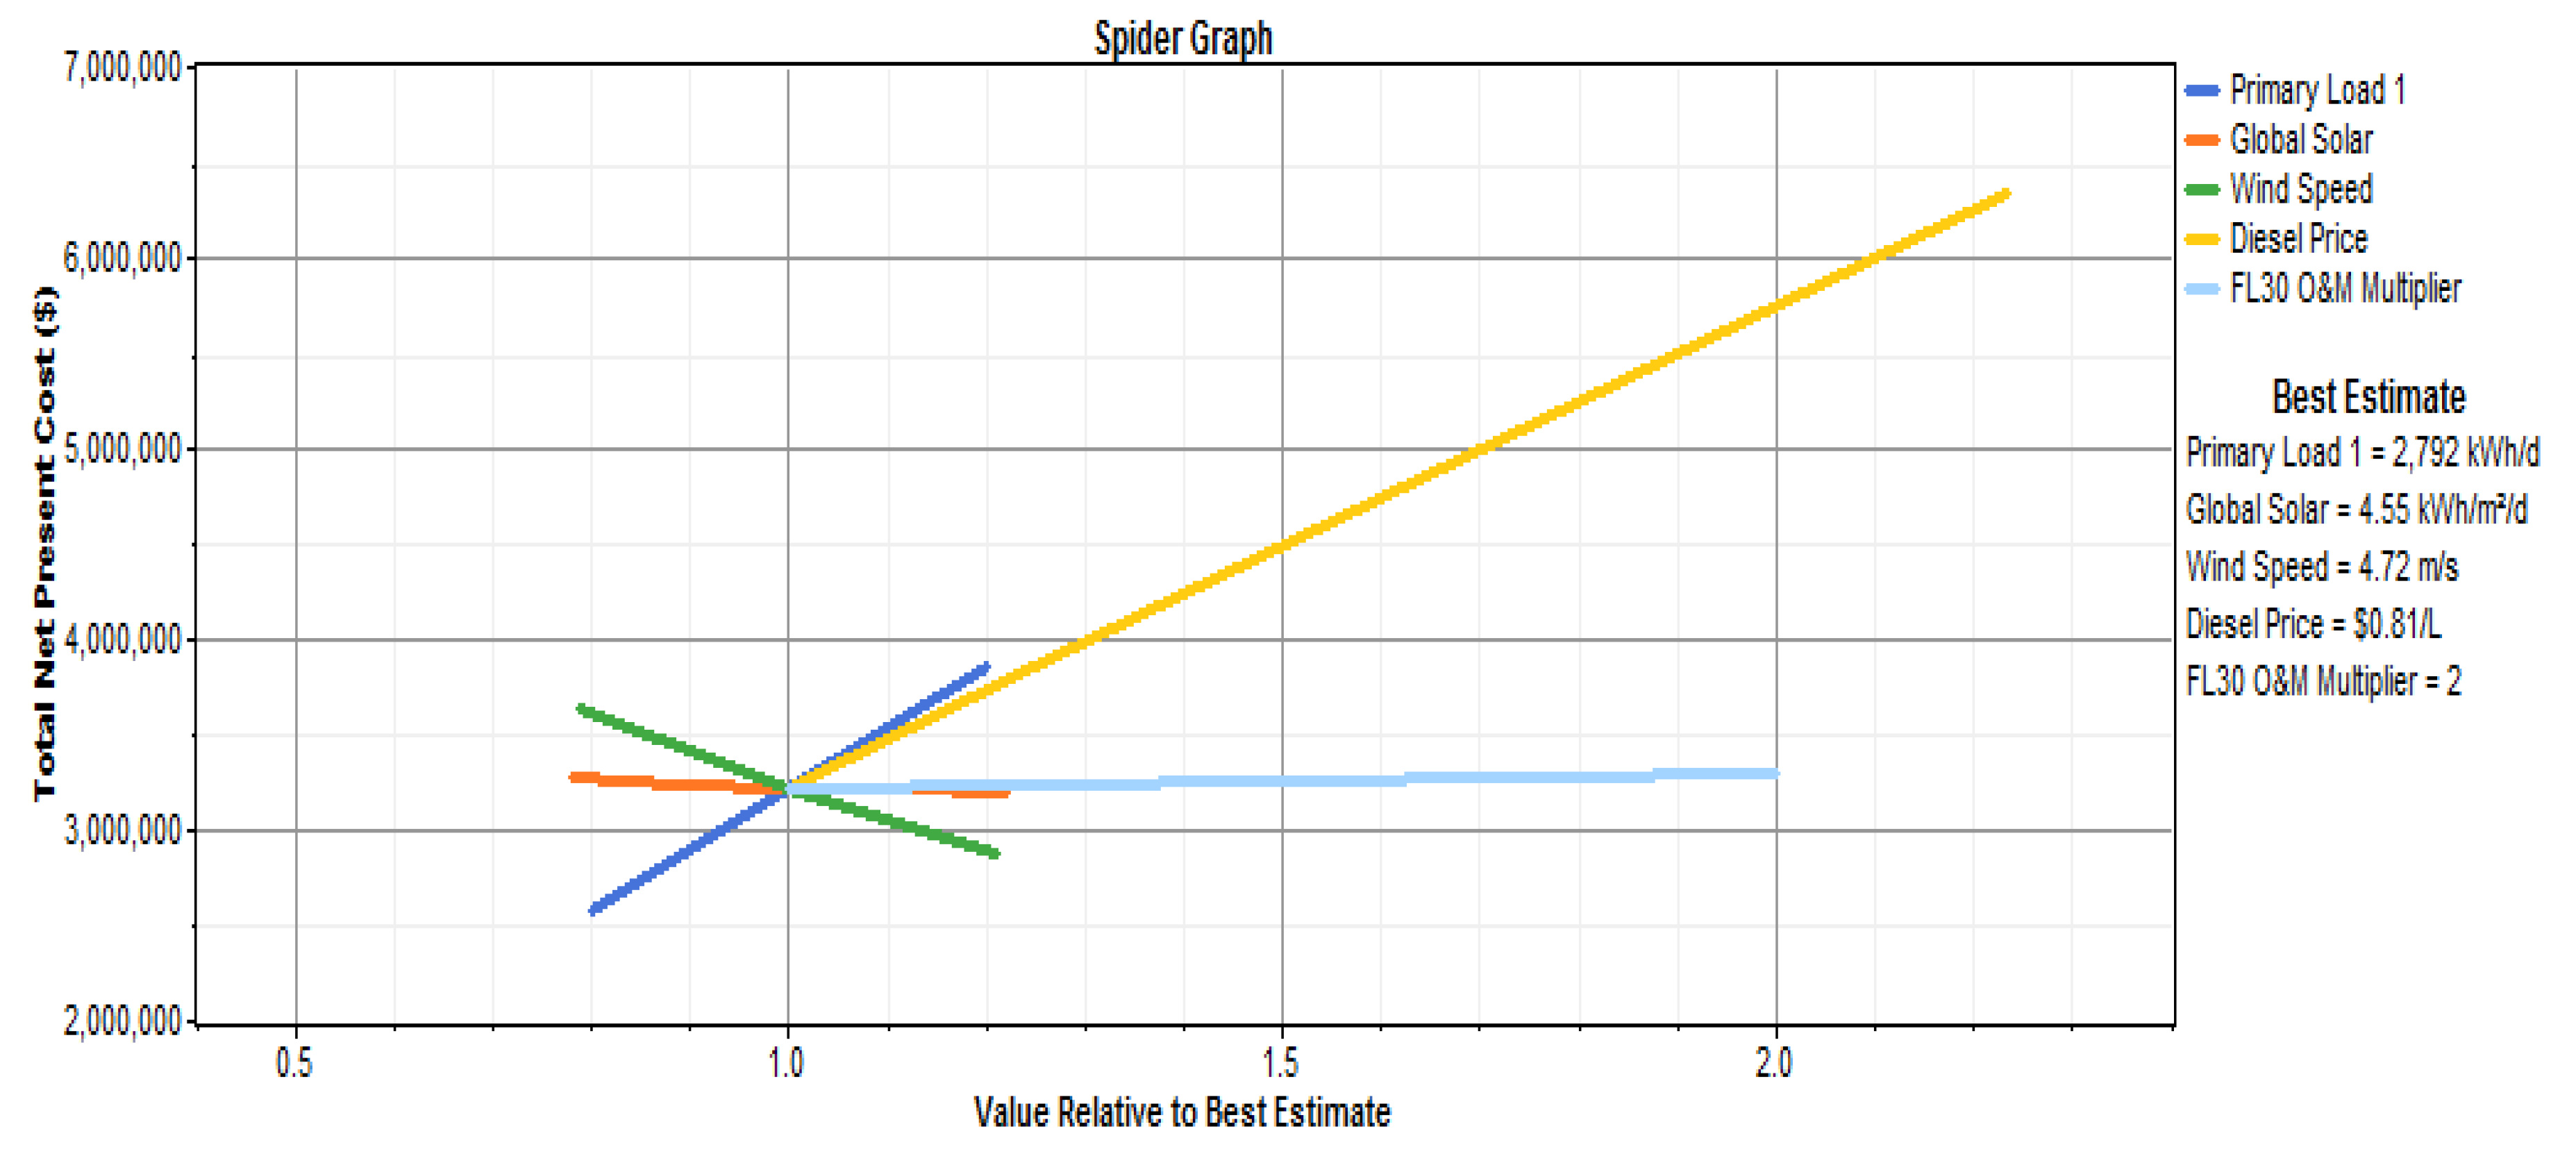
Before going to parameter-wise analysis, an overall sensitivity analysis was done to see how sensitive each variable was compared to others in terms of NPC (
Figure 14). It clearly shows that diesel price has the most significant impact on NPC, followed by the total load demand change. Solar radiation has a very negligible influence on NPC of the hybrid renewable energy-based system. It also states that wind speed has a more significant effect on the system than solar radiation change; in other words, wind power contributes more than solar power.
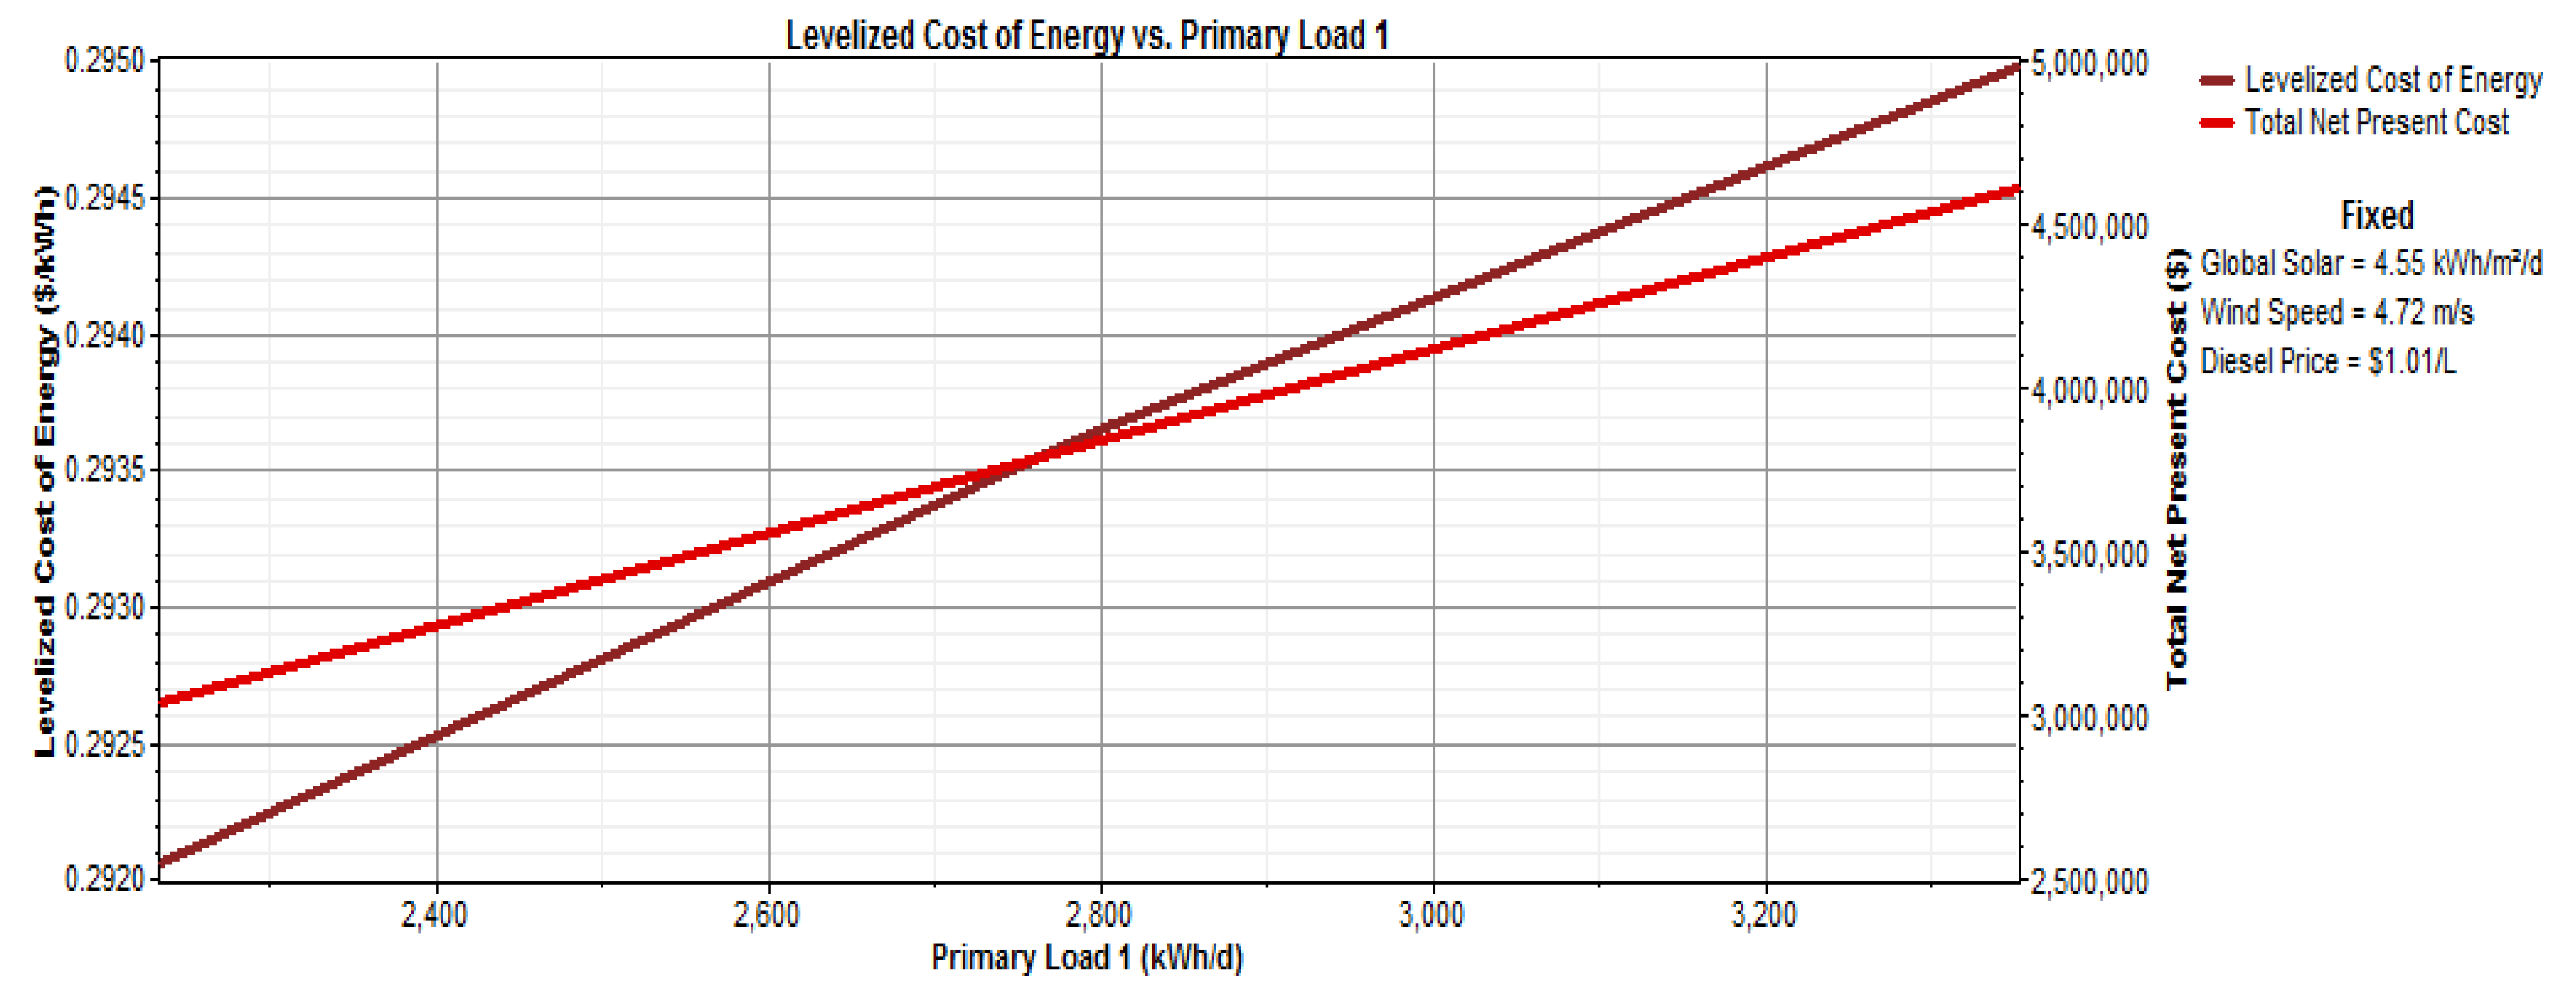
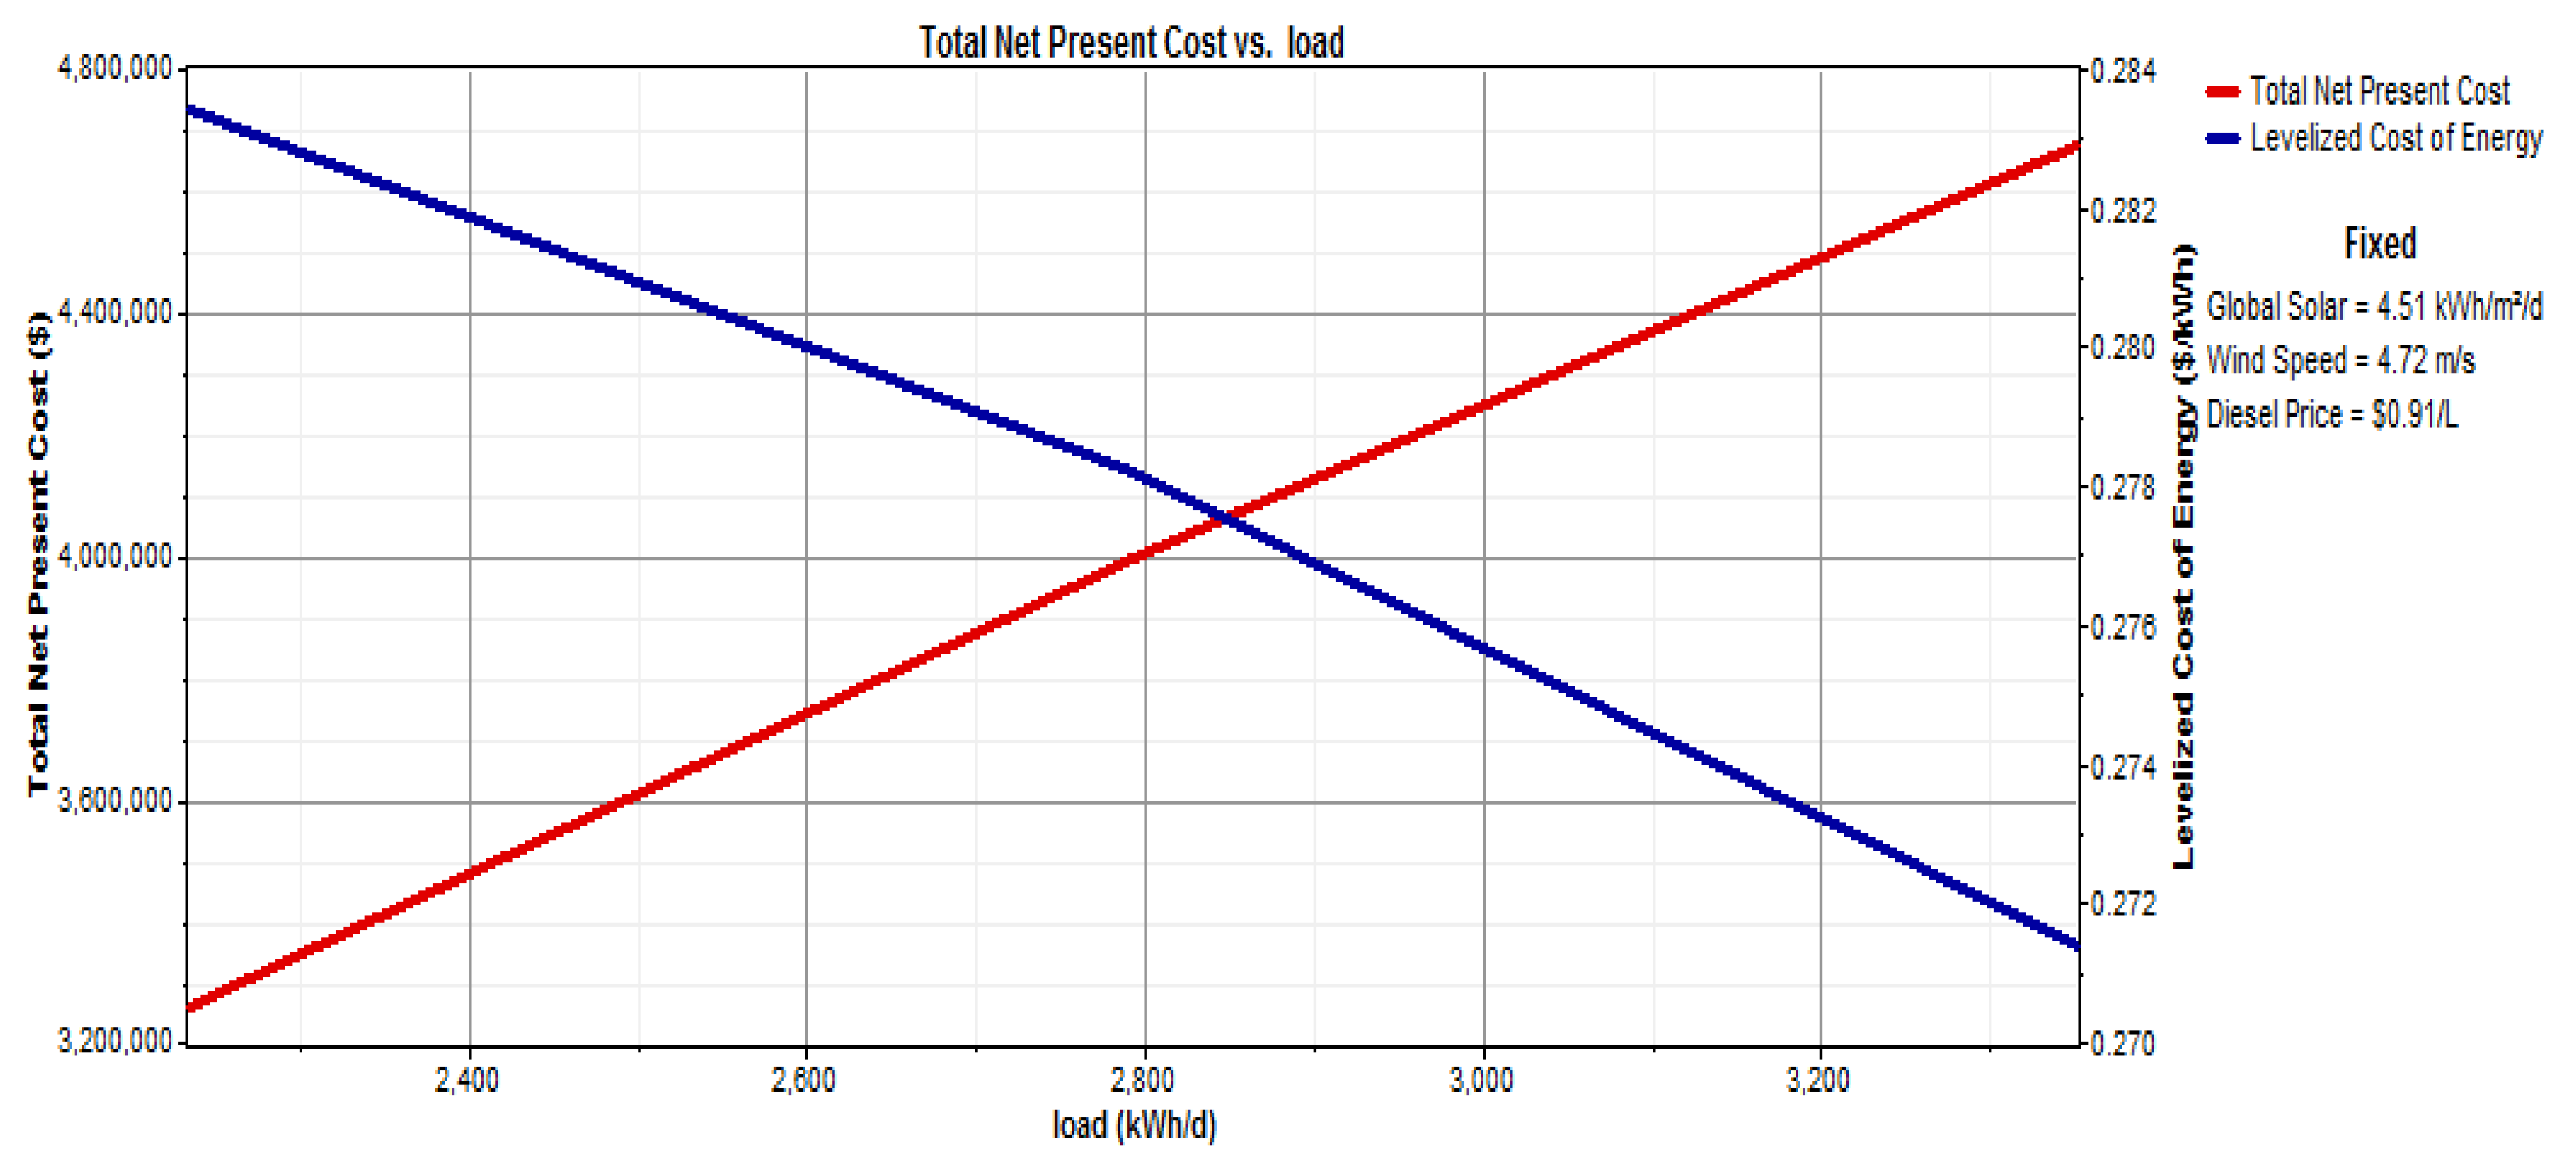
4.2.1. Impact of Increase in Diesel Price
In the present situation in Bangladesh, there is no sign of a decrease in diesel prices. Hence, here, the diesel price was increased from $0.81 to $1.01 in steps of $0.1.
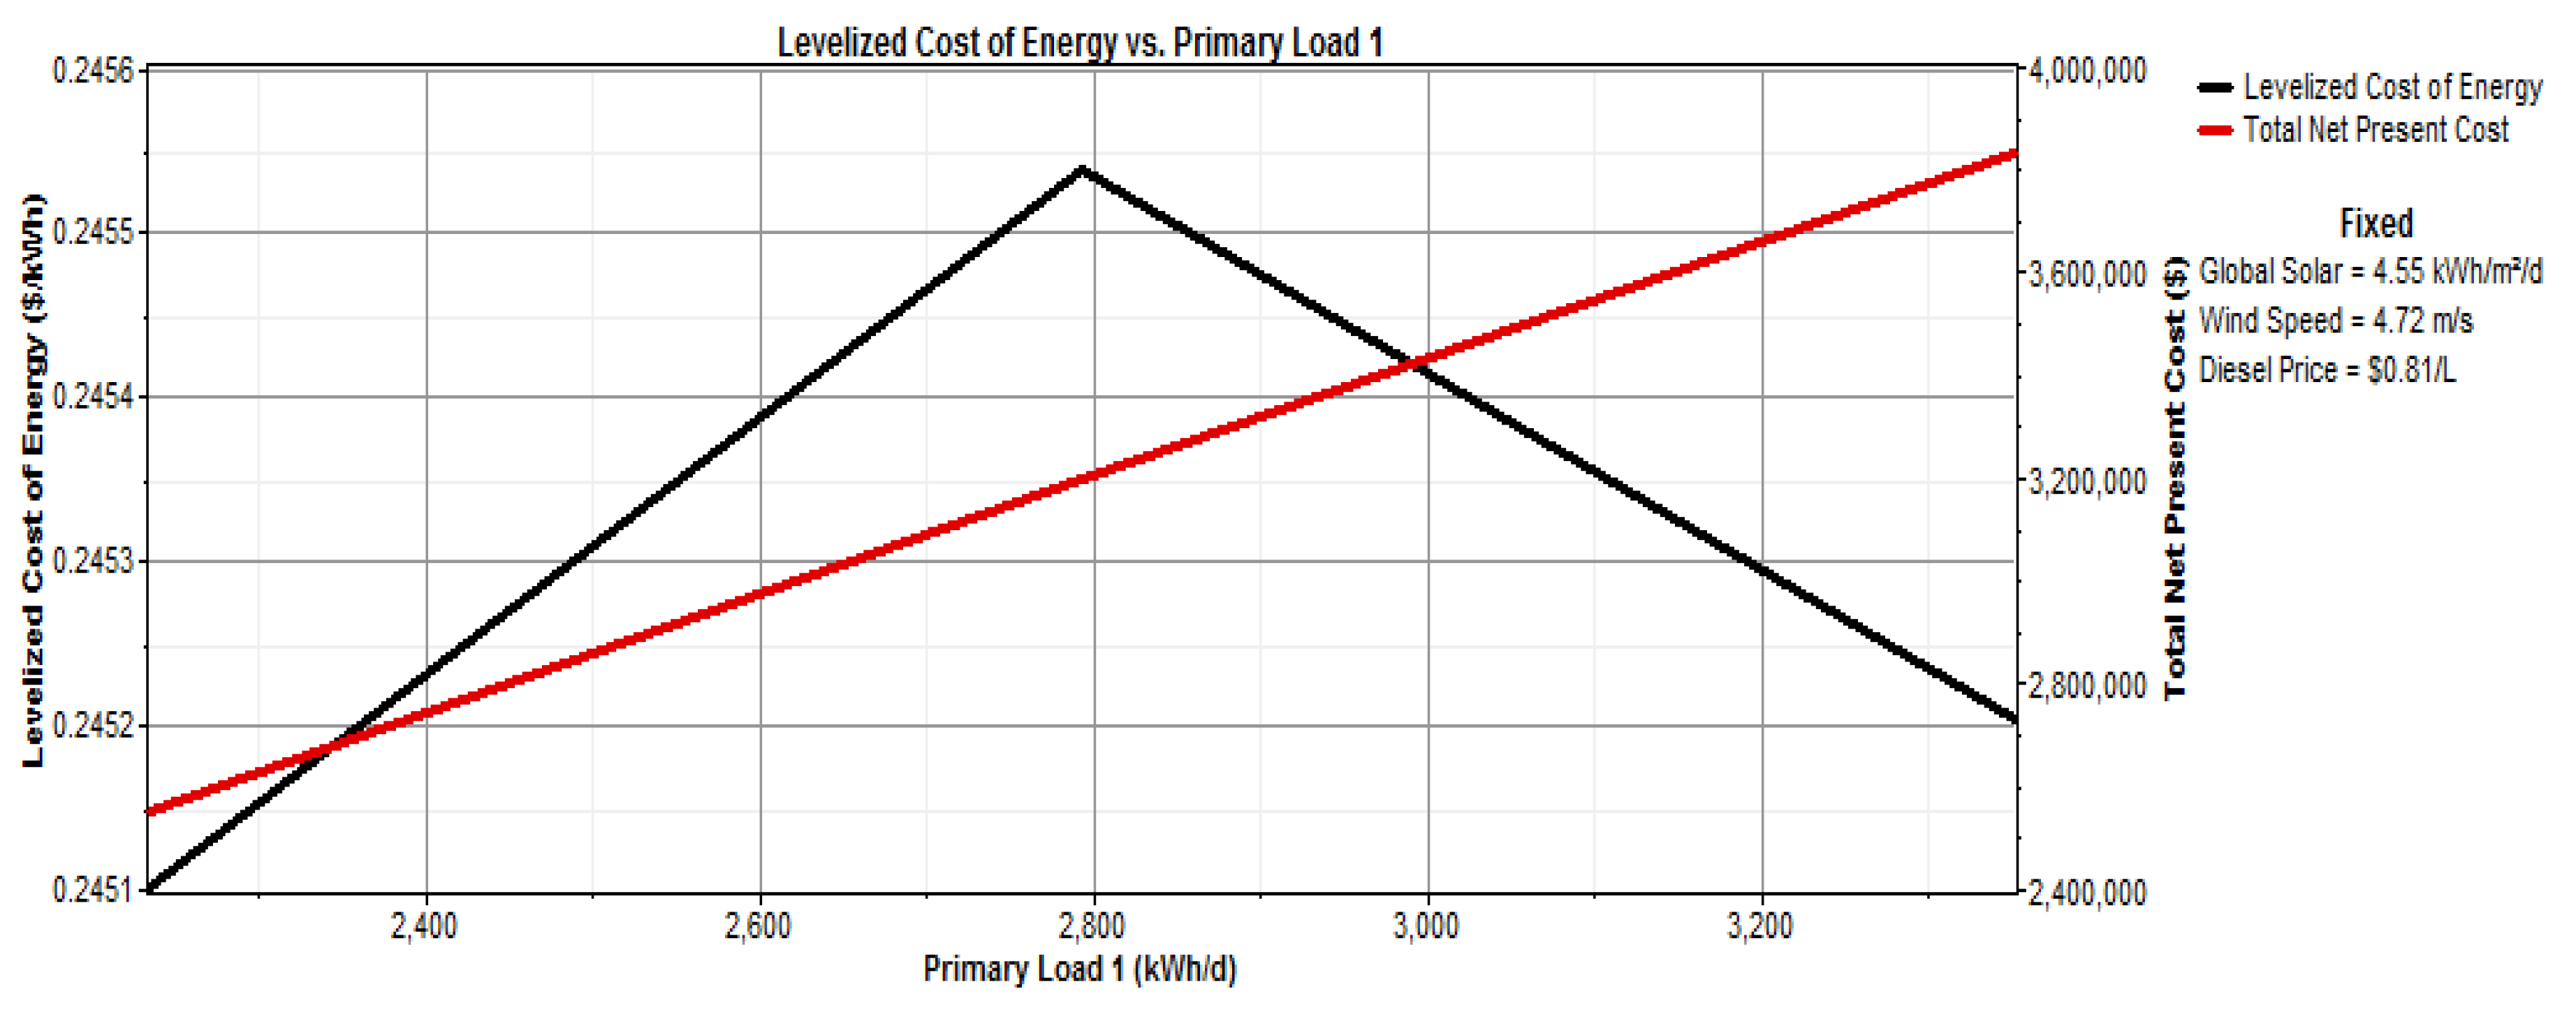
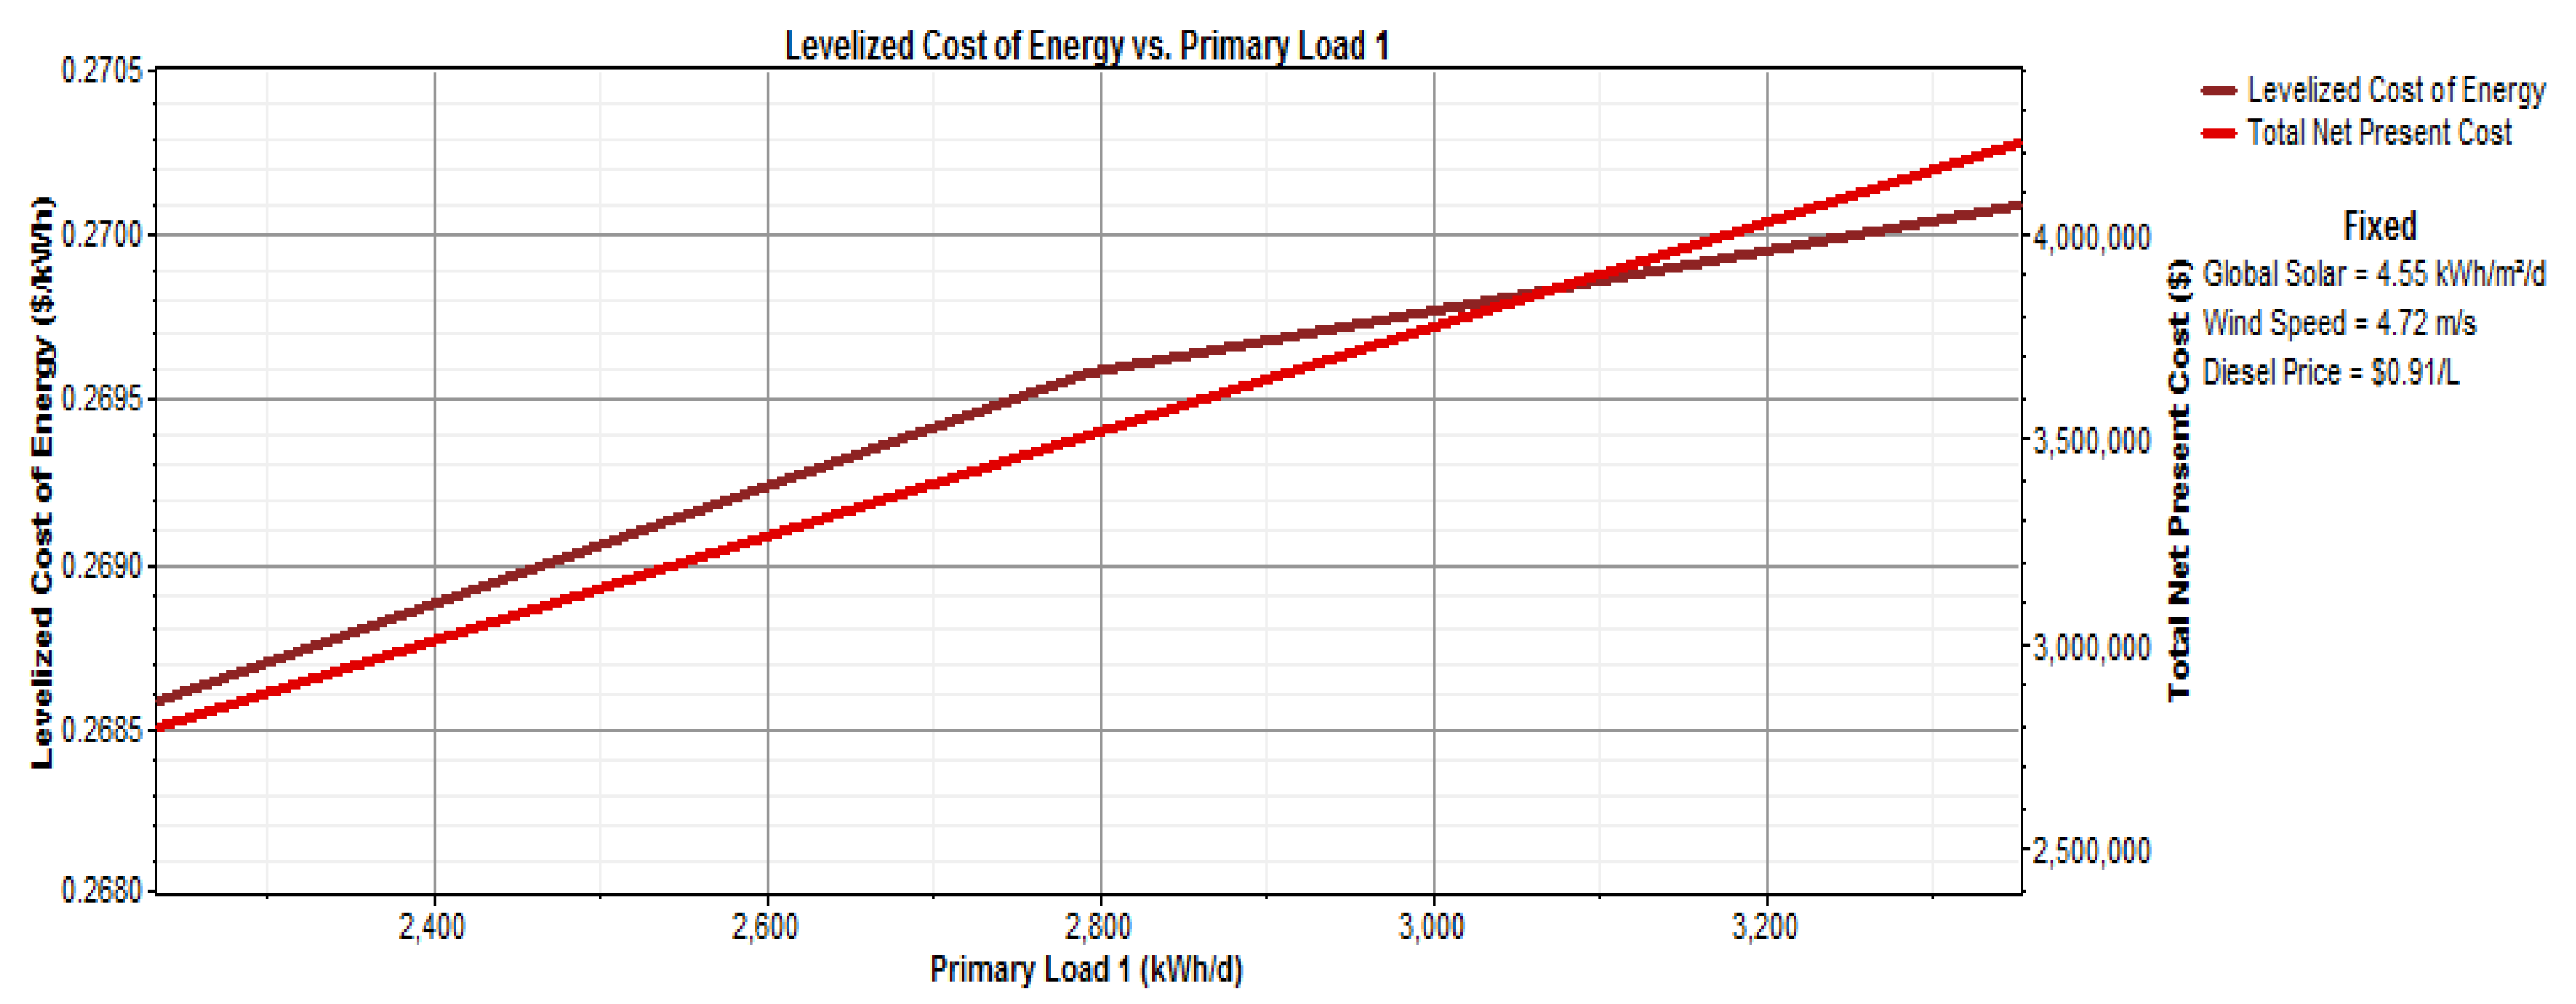
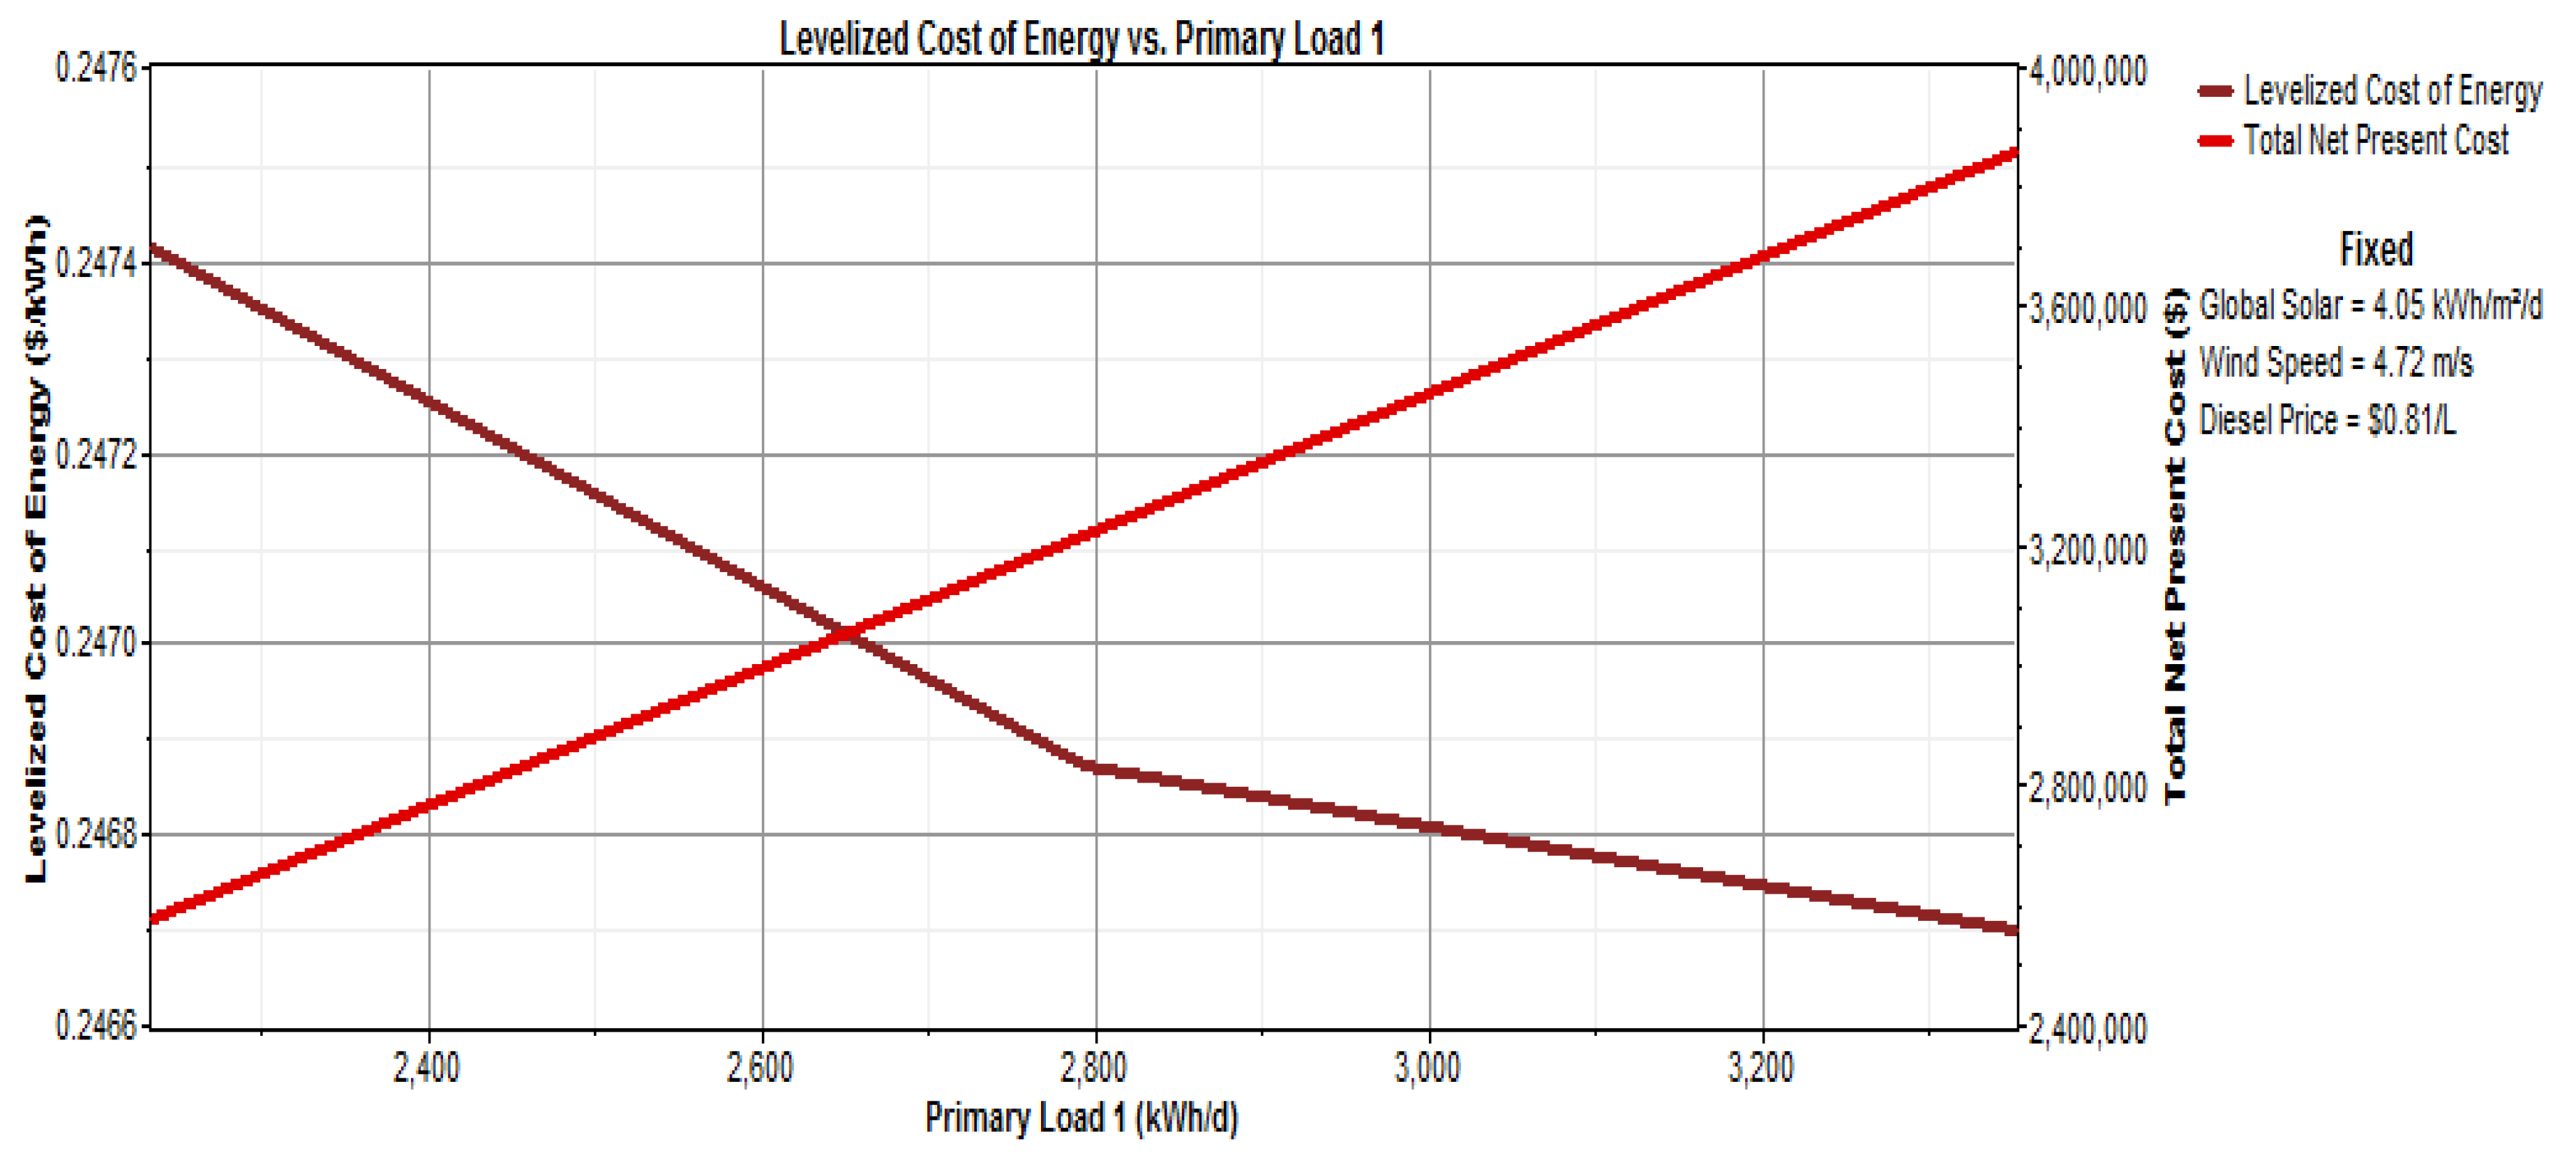
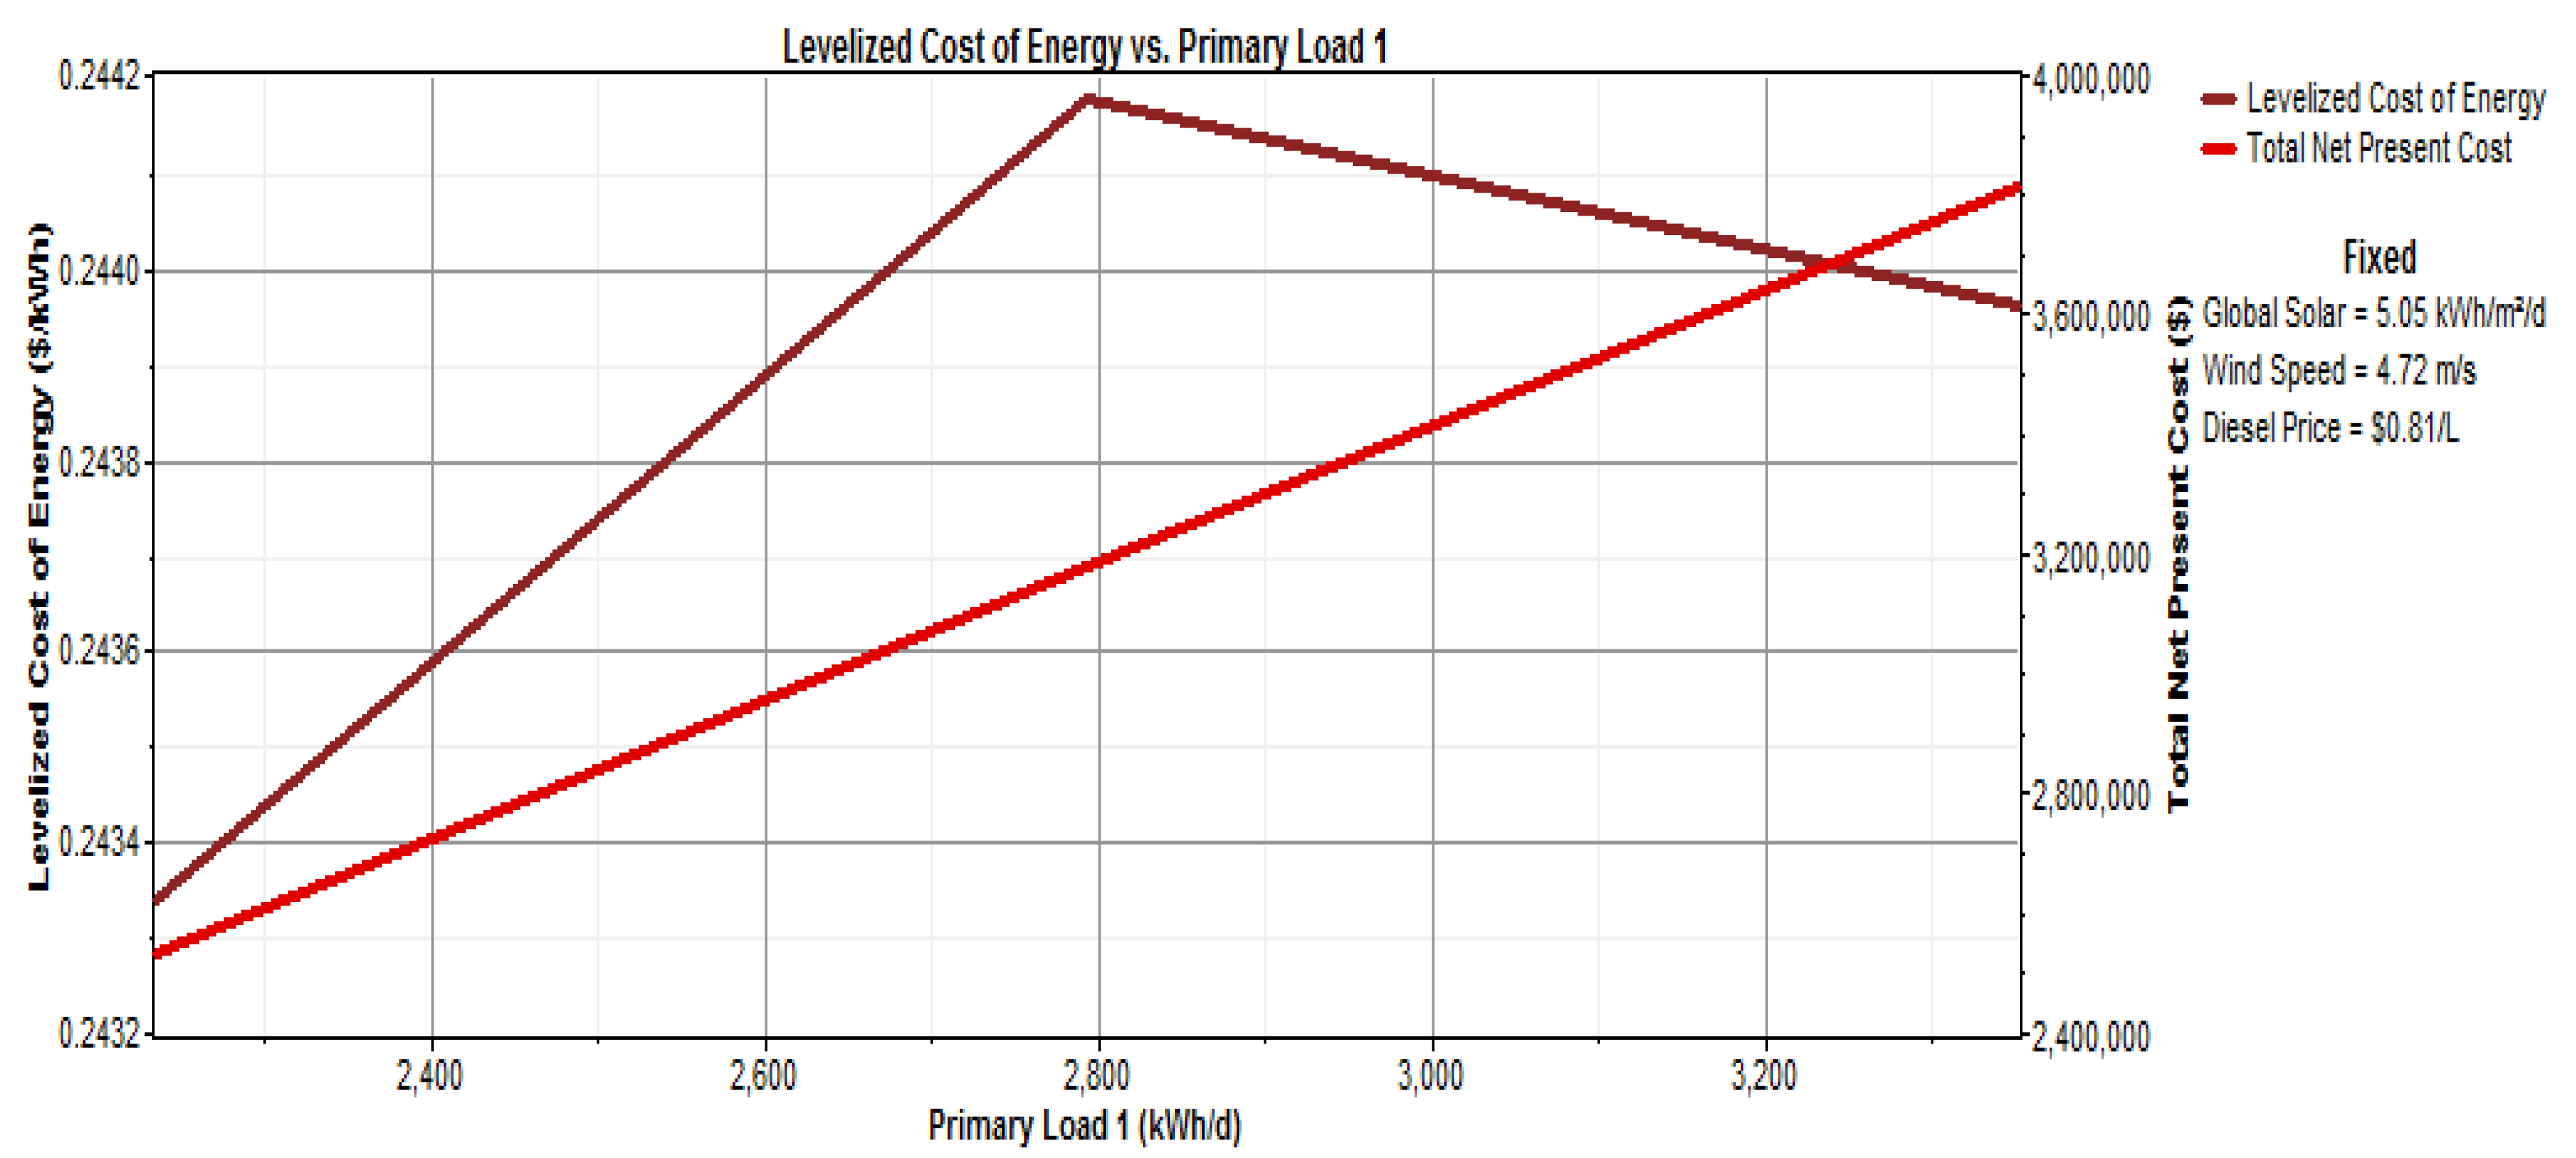
The line graph of
Figure 15 shows the behavior of NPC and COE when the value of variables is in the current state. It shows that COE increases at first, but starts to reduce when the load is increased by more than 2792 kWh per day. However, a further increase in diesel prices also increases the COE (
Figure 16 and
Figure 17). it also shows that for only a
$0.001 increase in COE, there is an almost
$8000 increase in NPC. The diesel price has the most significant effect on COE. If it is increased from
$0.81 to
$1.01, the COE will increase from
$0.246 to
$0.294, resulting in an almost 19.5% escalation for every
$0.2 increase in the diesel price.
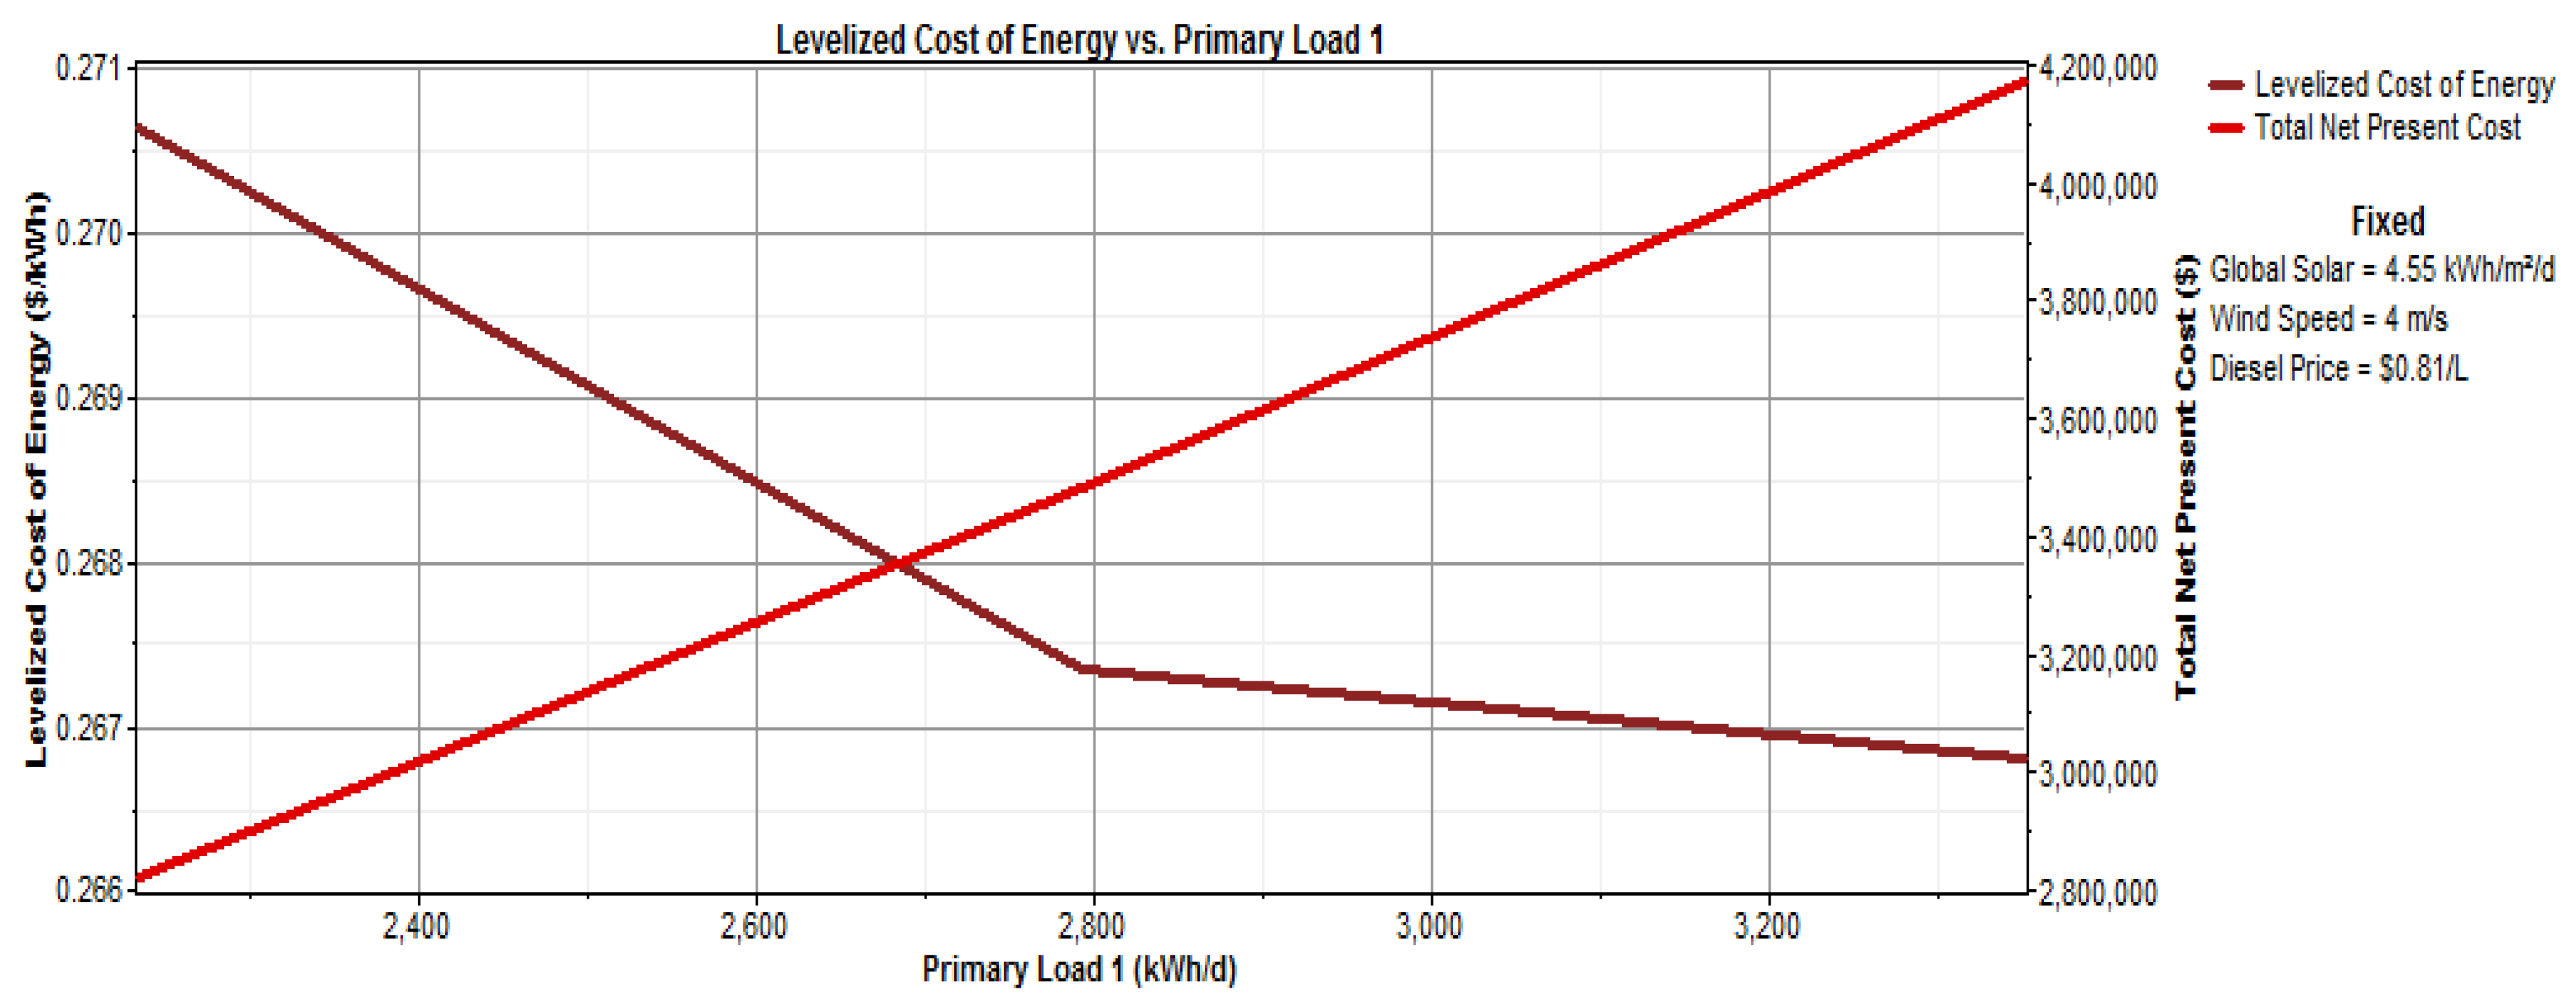
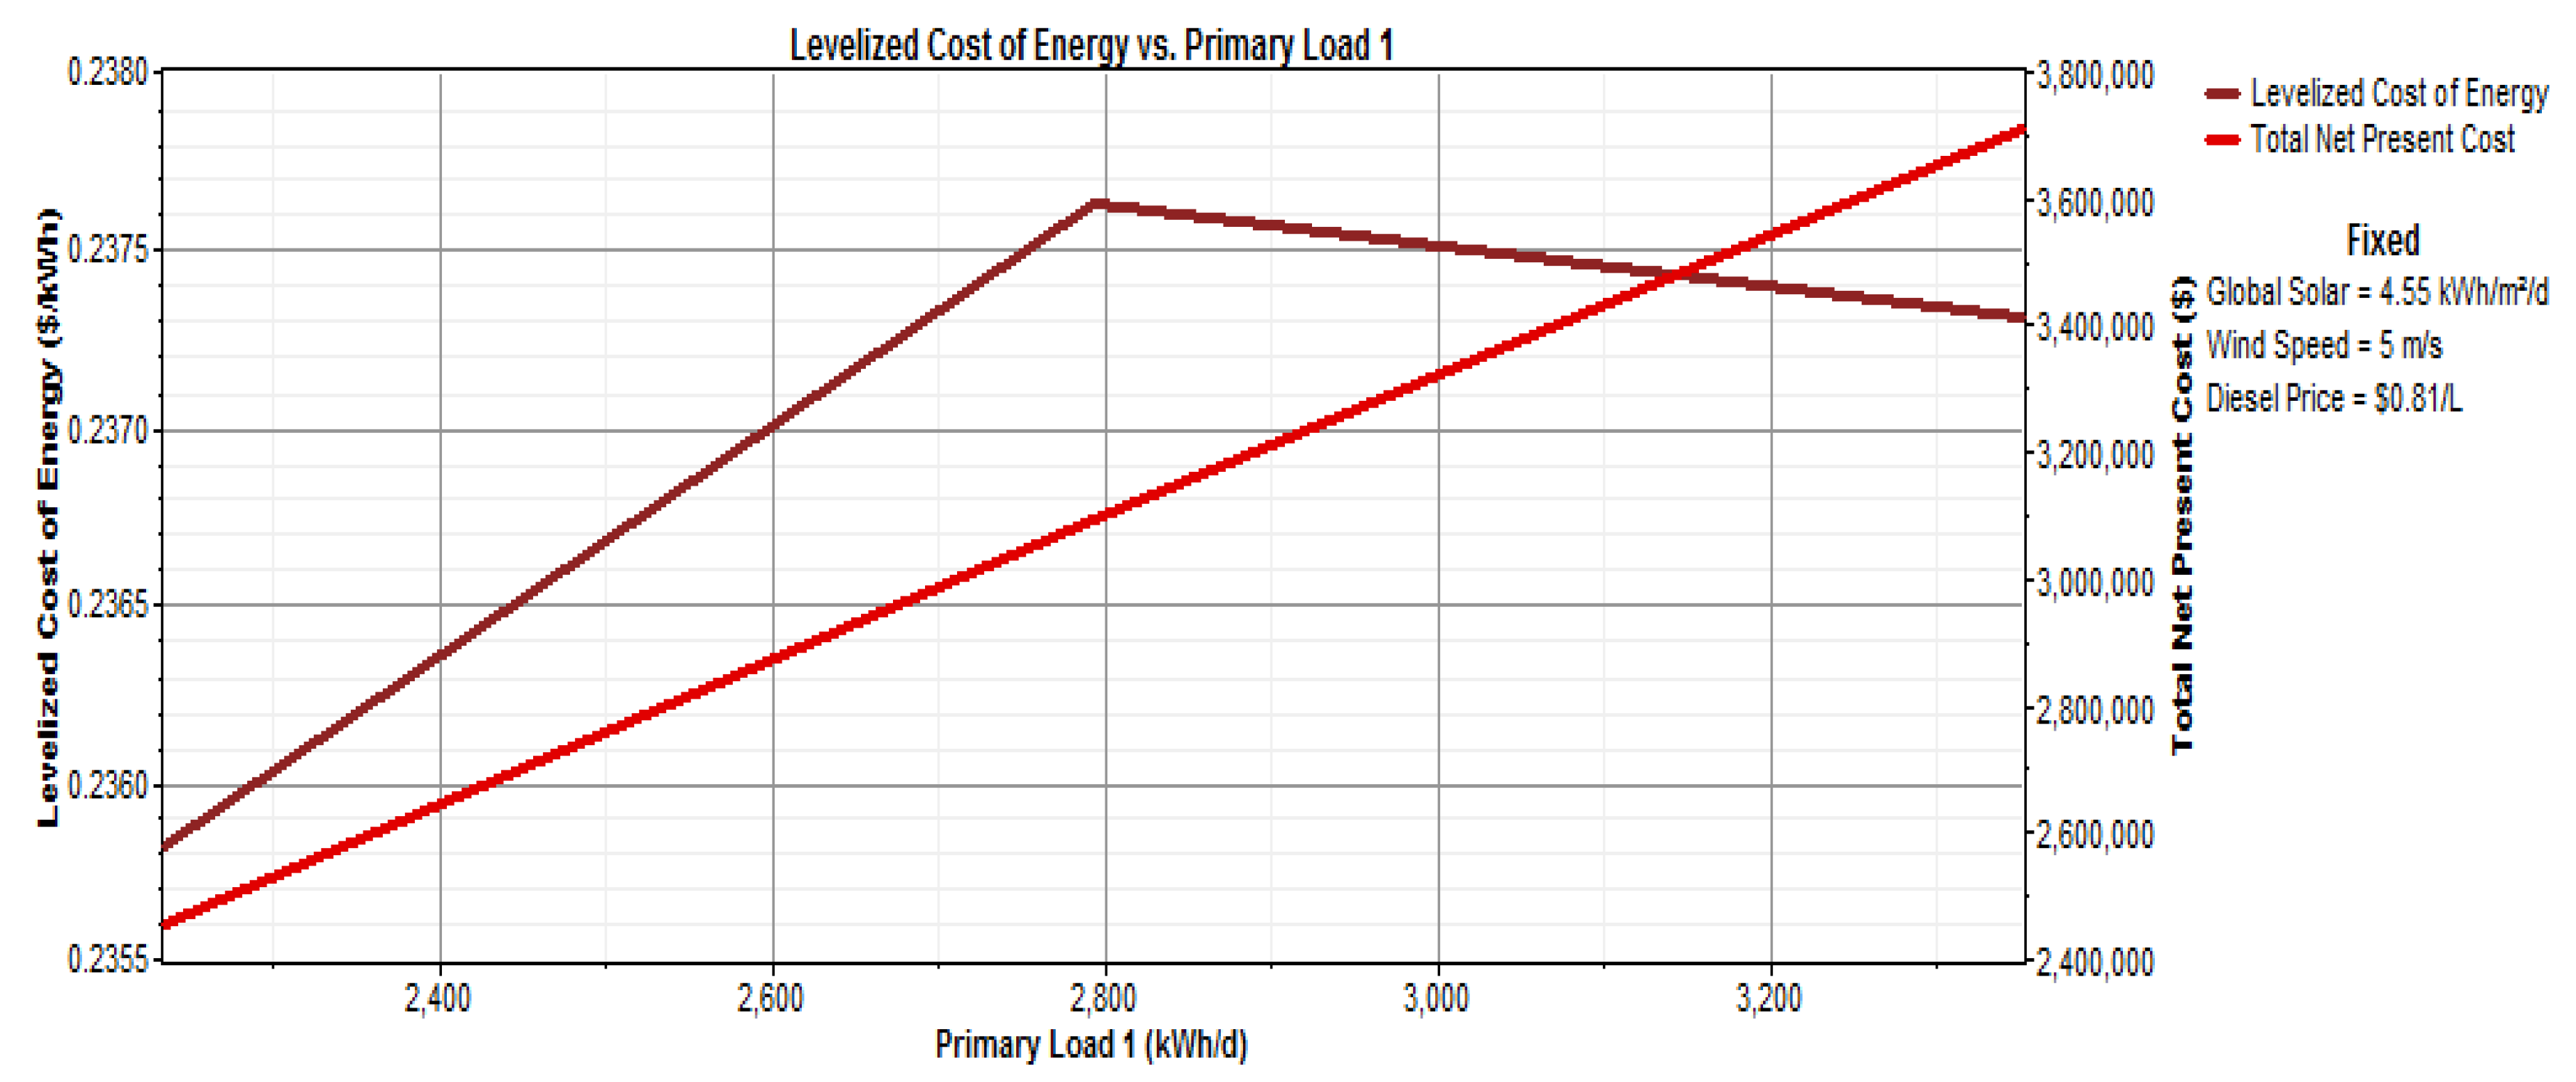
4.2.2. Impact of Change in Wind Speed
The wind speed also played a vital role in determining the COE and NPC. By comparing
Figure 18 and
Figure 19, it can be seen that an almost 20% increase of wind speed brings down almost 8% of COE, while NPC becomes lower by
$103,036. Wind turbine technology is not very familiar in Bangladesh compared to the PV panel. There is also a lack of skilled technicians and engineers. Also keeping in mind that those wind turbines and technologies are not the home product, Bangladesh will most likely have to hire experts from abroad to solve the issues related to wind turbines. Being an island, St. Martin’s is far from the mainland, which would also cause issues. All these factors will undoubtedly increase operation and maintenance costs. That is why the O&M cost increased up to two to four times in the sensitivity analysis (
Figure 20). Results show that there is an almost
$30,680 and
$92,040 increase per year in TNPC if the O&M cost is raised by two and four times, respectively. COE also gets increased correspondingly.
Figure 20 also reveals that the diesel price has the highest sensitivity, followed by the load and wind speed.
4.2.3. Impact of Change in Solar Radiation
In the case of a variation in solar radiation, it proves the optimization result that it has an almost negligible effect in the change of LCOE and NPC. Even with the 50% decrease and increase of solar radiation in
Figure 21 and
Figure 22, respectively, the COE changes to 1% and 2%. Thus, it is negligible for a 20% change concerning wind speed variation. The NPC also has an insignificant impact due to the change in solar radiation.
4.2.4. Impact of Load Demand Increase
It is assumed that the load profile keeps being consistent over the system’s lifetime [
42]. That is why it wants to simulate only one year of system action. However, there is extreme load demand in the hotels and resorts of St. Martin’s due to a large number of tourists throughout the year. Thus, a larger load demand plus lower power demand per day were analyzed by HOMER to see the deviation from the proposed system, especially regarding the change in NPC and COE.
If the load increases by 20%, the total NPC will also escalate by 30%. This is because the levelized COE falls by just 1.5% (indicated in
Figure 23). An increase of around 24% in diesel fuel consumption is mainly responsible for this, which tips to a 22% rise in operational costs. It proves that diesel generators serve as the systems’ major spinning reserve producer. Thus, the authorities should consider this effect when designing this type of power system.
The LCOE also reduces due to the decrease in excess electricity by about 5%, from 21.7% to 16.1% when the largest load is considered. However, this is a small reduction compared to the effect of a diesel price change. This indicates that wind turbines also serve the systems’ spinning reserve, except their involvement is comparatively lower.
4.3. Risk Analysis
There are no “risk-free” projects that exist in the world. Any new project or introduction of a new product needs a risk assessment to decide on capital investment since the profitability valuations form the project depends on the cash flow estimations, which are tentative. The cash flow depends on a few factors, like tax rate, life of the project, and the cost of all technology, including labor and O&M costs, which are uncertain. That is why the project analyst determines the risk considering a range of possible values of those factors.
Risk analysis can be done through the three most basic methods, namely, (a) sensitivity analysis, (b) break-even analysis, and (c) scenario analysis [
43]. In this study, “scenario analysis” was adopted to assess the risk of St. Martin’s Hybrid microgrid project.
The scenario analysis includes the “base case scenario” analysis in comparison with the “best case scenario” and “worst case scenario” analysis. It detects the extreme and most likely project result. This study considered five important variables to analyze those cases.
According to a local study done several years back, it varies from 4.7 m/s to 5 m/s [
44,
45]. Solar radiation and wind speed varies ±100%, while load demand changes by ±20%. Diesel price and wind turbine O&M costs increase to 100% and four times, respectively, as there is no indication of a lower value in the near future. In HOMER, the variables mentioned in
Table 7 are given as the input. It performed 2560 simulations and 600 sensitivity cases for those five sensitivity parameters. The selected optimization results are summarized below in
Table 8.
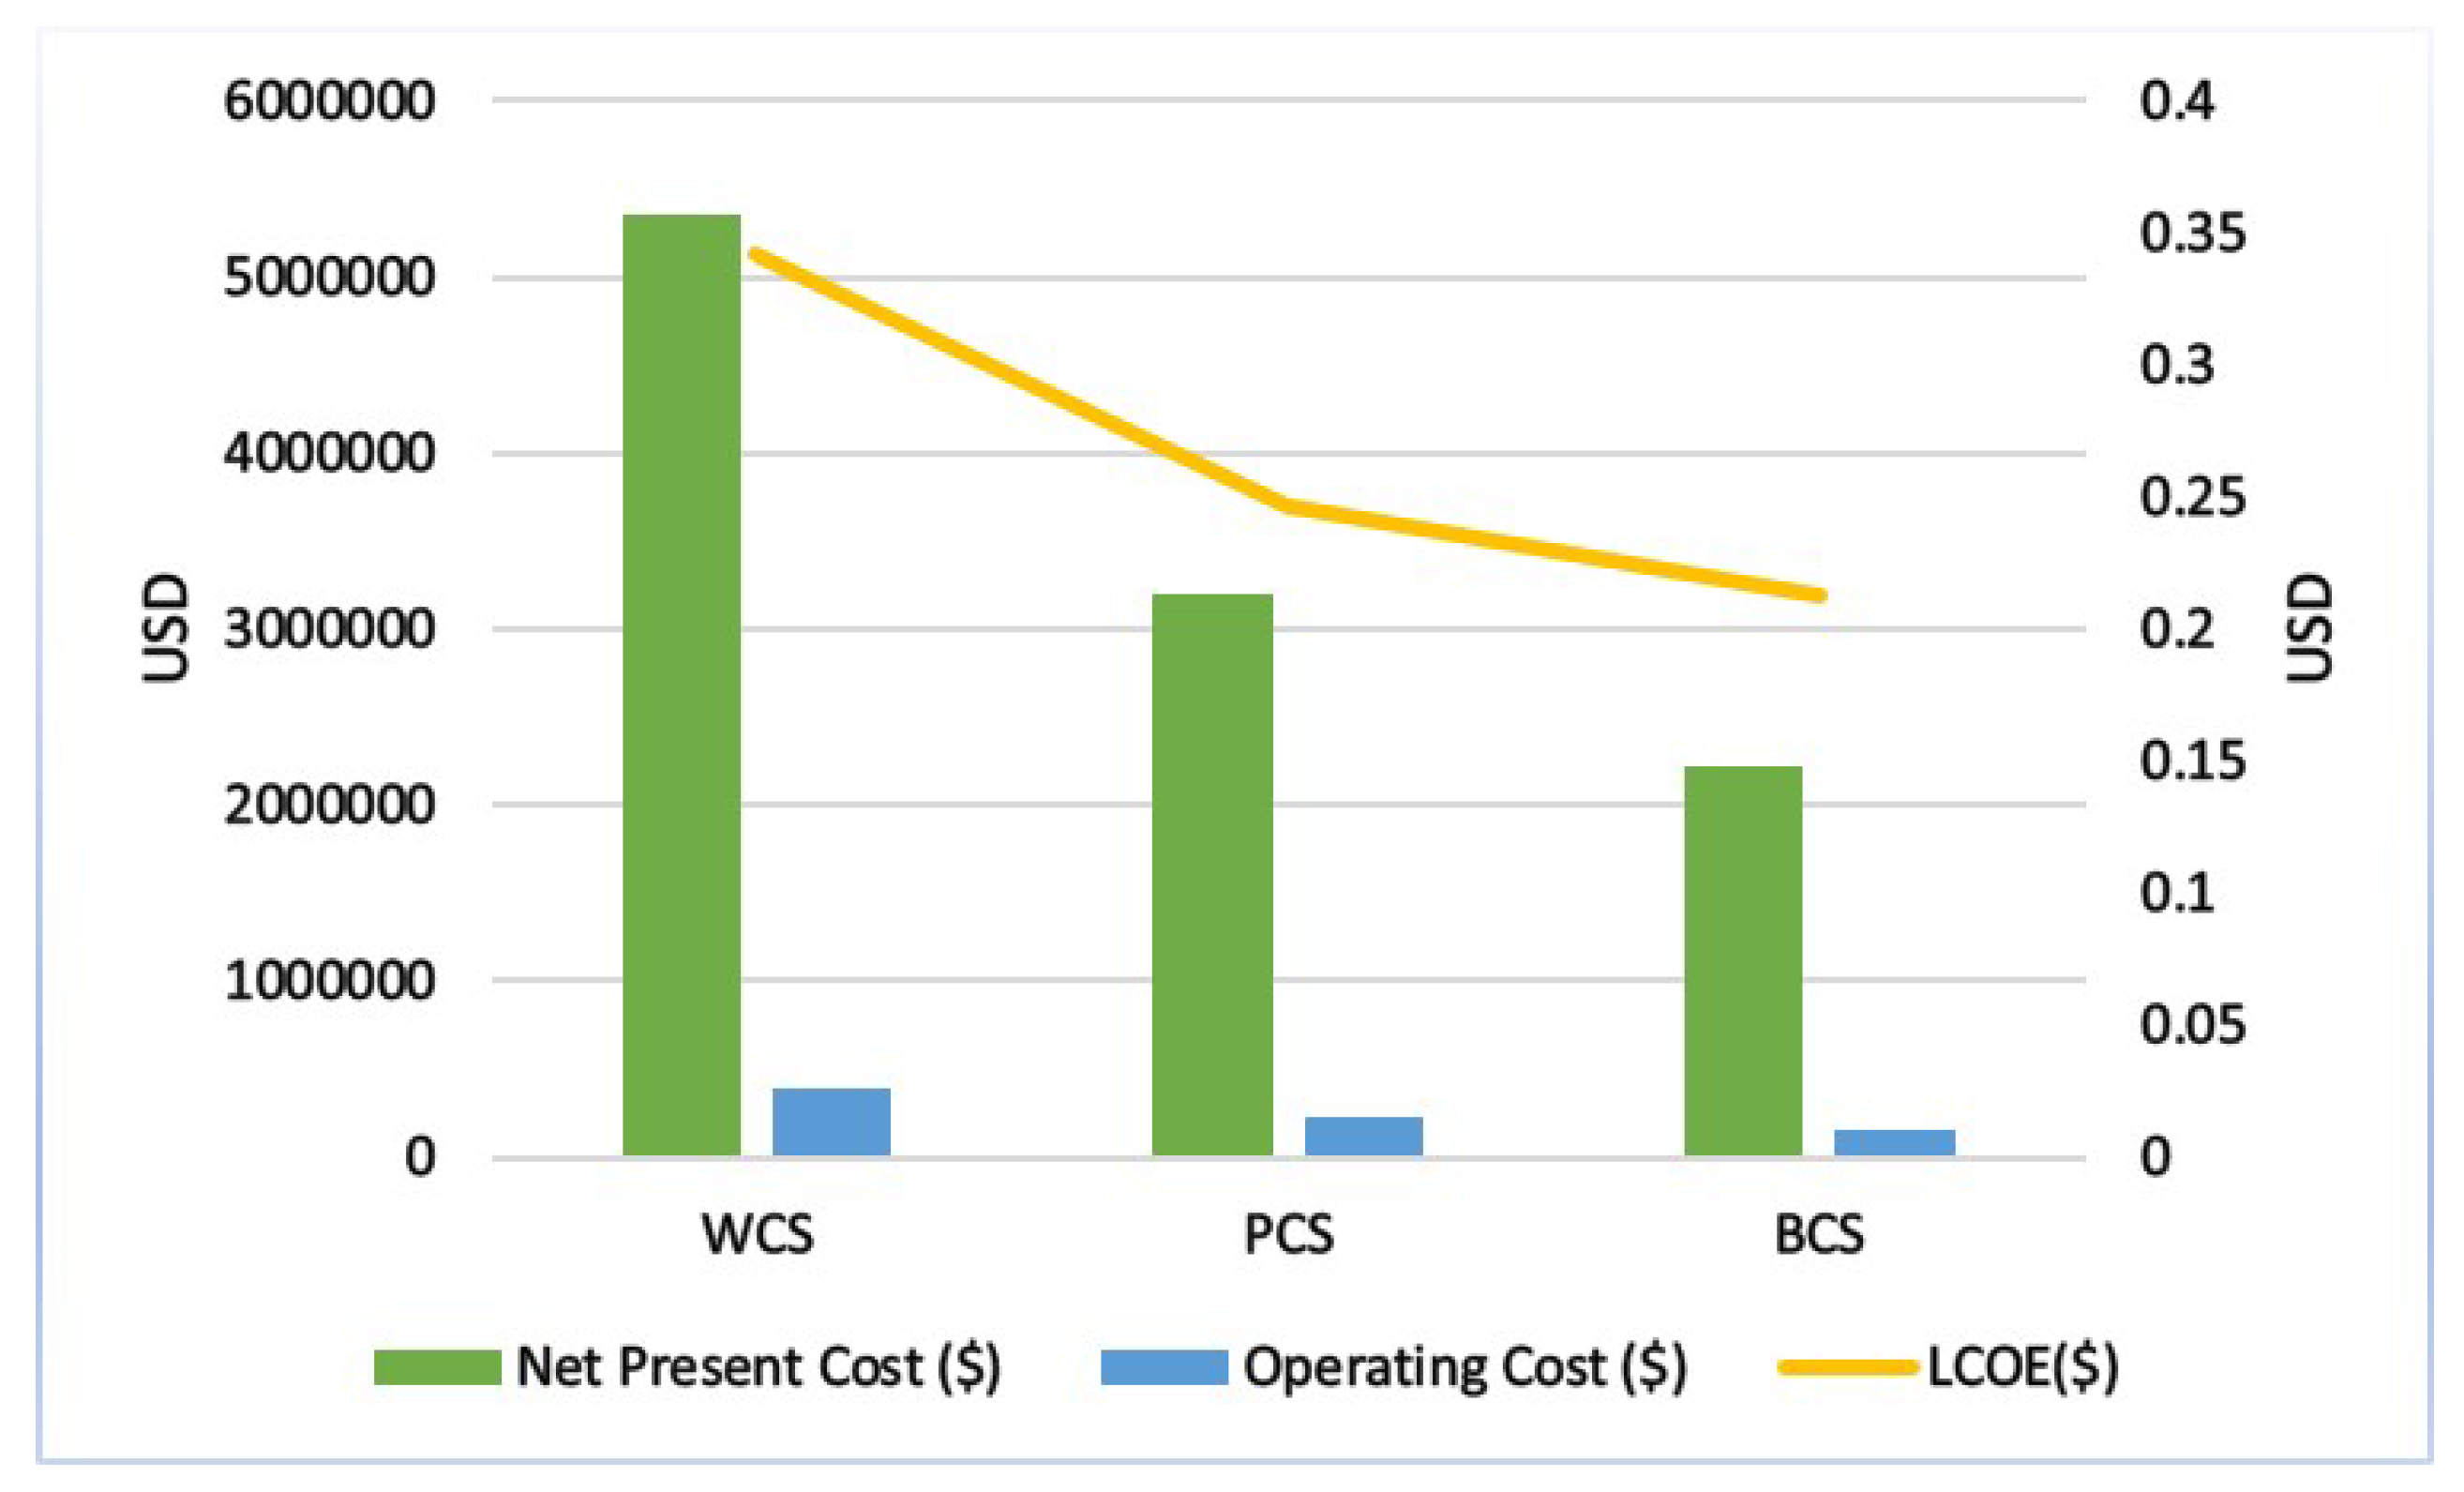
The comparative analysis of BCS and WCS corresponding to PCS was done in order to establish the viability of the proposed Hybrid PV/wind/battery/diesel system, which is represented in the remarks column. Clearly, there are significant changes, especially in terms of NPC, LCOE, operating cost, and CO
emission. Another noteworthy change in BCS is not considering the large 500 kW generator, while in WCS, 20 kW more PV capacity is added.
Table 8 also indicates the percentage change in net present cost, operating cost, and levelized cost of energy of BCS is smaller than the WCS. This is because the diesel price and wind turbine cost are considered to be increased only.
Figure 24 shows the graphical variation in a different set of costs for different scenarios.
Looking closely at the risky and advantageous situation after comparing both WCS and BCS to PCS, it is evident that NPC, LCOE, and operating cost WCS has more of an impact than BCS, which becomes risky. In contrast, for the initial capital cost, renewable energy penetration and reducing CO emission BCS wins.
According to PDB, the tariff rate for the residential load of Bangladesh is about BDT 6.00. The load demand of the island’s people is around 2792 kWh/day. If the government wants to electrify the whole area only by diesel generators, it would cost them about (2792 kWh/day × 27.2 BDT /kWh) = BDT 75,942 per day. However, for the proposed hybrid system, it would cost about (2792 kWh/day × BDT 19.68 /kWh) = BDT 54,946 per day. Thus, the government would lose around (75,942 – 54,946) = BDT 200,996 every day and around BDT 7.7 million annually, which can be saved by implementing the proposed power system.
4.4. Emission Analysis
According to the World Bank, Bangladesh is one of the most climate-prone areas. The emission of GHG is mainly responsible for this crisis. In 2012, USAID reported that Bangladesh had emitted 190 million metric tons (MtCOe), with an energy sector contributing 33 percent to total emissions. The government of Bangladesh has undertaken several plans and actions, including 10 percent renewable energy delivery by 2020 and 15 percent GHG mitigation from the power, transportation, and energy-related industry sectors by 2030. In response to that, a hybrid renewable energy-based electricity system would certainly be a great achievement, which will ultimately play a vital role in easing the global warming condition. The annual emissions are determined from pollutant materials and gas, based on fuel consumption and fuel properties.
Table 9 displays the annual gas and other pollutant emissions from the optimized hybrid and the surviving conventional diesel-only power generation system in St. Martin’s Island. These emitted gases or particles are the following: carbon dioxide (CO
), carbon monoxide (CO), unburned hydrocarbon (UHC), particulate matter (PM), sulfur dioxide (SO
, and finally, nitrogen oxide (NO
). The conventional diesel-based power system produces 1,034,123 kg/year of CO
, whereas the optimal hybrid renewable system configurations produce 801,470 kg/year CO
. From this table, we observed that a total of 23% of CO
emission could be prevented, resulting in around 232,653 kg/year less CO
emission by installing a hybrid renewable energy system arrangement on this island. However, in reality, due to the enormous usage of kerosene by ordinary people, the emission from the present case would be higher.
5. Conclusions
In this study, a techno-economic study of all possible hybrid microgrid systems and the existing base case has been executed with certain assumptions. The area considered in this study was St. Martin’s Island. Using the HOMER simulation tool, the projections of accumulating a considerable segment of RE penetration were analyzed. To fill the research gap for a remote and sub-tropical island power system, optimization modeling supported by the comprehensive sensitivity and risk analyses were conducted to evaluate the technical, financial, as well as environmental benefits of the hybrid microgrid compared with the stand-alone, diesel-based configuration.
Results illustrate that:
(a) The diesel-alone existing power system is about 1.412 times more costly than a hybrid energy system in terms of the net present cost. This is mostly due to the present increasing diesel fuel rate.
(b) A 56% renewable energy penetration with a cost of energy of just $0.246, that is, BDT 19.68 per unit (kWh) is possible through the proposed power system. In this way, COE lessens by almost by 28%, associated with the base case. Also, risk analysis shows that GoB can save around BDT 7.7 million annually, matched with the existing system.
(c) The economic superiority wind turbines over solar PV in St. Martin’s was established in this study.
(d) There is a chance of almost 23% reduction of CO2. Other pollutants like UHC and CO also emits less in the optimal system.
This study is anticipated to contribute to the “100% electrification plan” of “Vision 2021” of the government of Bangladesh, counting St. Martin’s island. It would also help “Bangladesh’s Intended Nationally Determined Contribution (INDC)” plan to reduce greenhouse gas emissions by 2030, delivering “green” technologies all over the country.
Furthermore, this study will inspire and motivate the government and other investors to invest here, knowing the situation of the people, and the technical and economic prospects of a RE-based hybrid microgrid system. It demonstrates the critical drivers for proposing and implementing such an electricity system in any remote area where the grid is not available. The researchers, industry authorities, and other concerned parties are expected to get insights from this local-oriented analysis, though further studies should consider other renewable energy sources, like biomass, to increase the cleaner energy penetration. Finally, it validates the cost-efficacy of the projected system and keeps the increasing rate of diesel prices in mind; it also exhibits the probability of the dipping diesel fuel dependence in Bangladesh’s electricity market.

 ,
, 


