Article

An Examination of Last Mile Delivery Practices of Freight Carriers Servicing Business Receivers in Inner-City Areas

by
Khalid Aljohani
1,* and
Russell G. Thompson
2
1
Department of Industrial Engineering, University of Jeddah, Jeddah 23890, Saudi Arabia
2
Department of Infrastructure Engineering, University of Melbourne, Parkville, VIC 3010, Australia
*
Author to whom correspondence should be addressed.
Sustainability 2020, 12(7), 2837; https://doi.org/10.3390/su12072837
Submission received: 29 February 2020 / Revised: 30 March 2020 / Accepted: 1 April 2020 / Published: 2 April 2020
(This article belongs to the Special Issue Sustainable Last Mile Logistics)

Abstract

:
Freight carriers experience major challenges while operating in highly dense inner-city areas. Timely deliveries are crucial for the success of businesses and for the long-term economic growth of metropolitan areas. Previous freight studies have paid little attention to the characteristics of freight movements in a highly dense urban context. Accordingly, this study sought to quantify the operational practices for freight carriers that deliver light parcels to inner-city business receivers. Direct insights were collected using semistructured interviews and an online survey with freight carriers in Melbourne, Australia. The intent was to describe the delivery trips and vehicle types involved in this unique segment. An assessment of operational challenges to the efficiency of freight carriers is presented in the study. In general, freight deliveries to inner-city receivers are characterised by underutilised transport capacity along with a large number of delivery stops. The findings shed light on the challenges that couriers encounter in congested inner-city areas.

1. Introduction

Several metropolitan areas in Europe, Australasia and Asia have embarked on different residential gentrification initiatives and commercial projects to revitalise and economically regenerate the inner-city area, which attracted more people to live and work there [1]. City centres are a highly attractive place for visitors, residents, shoppers and workers in these regions [2]. Several local authorities are implementing more pedestrianisation policies to improve the amenities of the city centre and promote active transport (walking and cycling). Although these policies enhance the walkability and attractiveness of the city centre, they adversely affect the accessibility and efficiency of freight vehicles to retailers [3]. Ensuring efficient freight deliveries to these retailers is important for the functioning of businesses and amenities of citizens in the inner-city area.
Inner-city areas, and especially the city centre, include various retailers and businesses that require a varied mix of light parcel deliveries. For instance, it was estimated that about 56% of retailers and businesses in Melbourne’s central business district (CBD) receive on average about 2–7 daily deliveries per week from different shippers and freight carriers [4]. Additionally, freight vehicles need to travel over a long transport distance from suburban distribution centres to service the different delivery requirements of inner-city businesses [5]. Although business-to-consumer (B2C) and consumer-to-consumer (C2C) deliveries account for a larger share of parcel deliveries in urban areas, business-to-business (B2B) deliveries still account for a noticeable share in the urban freight industry. For example, B2B deliveries accounted for almost 40% of the total parcel market in the UK, while B2C and C2C accounted for 56% and 4%, respectively [6]. The share of B2B deliveries in the inner city might be higher due to the clustering of retailers and businesses in the area.
Recent trends and operational challenges have driven a great deal of research, especially with a higher focus on B2C and C2C deliveries, due to the emergence of online shopping, crowdshipping and omnichannel retailing. It is the case of the work presented in [7] or [8]. Juhász and Bányai argue that issues associated with B2C and C2C delivery practices, such as higher costs and empty routes, contribute to making home deliveries very costly and complex [9]. In contrast, B2B deliveries to retailers and businesses in inner-city areas have not received similar academic interest from transport scholars. There are some studies that focus on deliveries to retailers and businesses in other parts of urban areas, including shopping centres or suburban parts, such as the ones presented in [10] or [11].
However, most previous studies on last mile delivery failed to capture the complexity of parcel deliveries to retailers and businesses in the highly congested inner city. There are not sufficient contributions clarifying the characteristics of the delivery trips of the last leg of the delivery. The literature on the utility of locating businesses in the city centre is well established from the perspectives of commercial attractiveness and accessibility to consumers [12]. However, the literature on last mile freight does not differentiate between the operational activities and challenges of freight carriers across the whole metropolitan area and inside the inner-city area. Butrina et al. suggest that there is limited knowledge of the delivery practices of freight carriers in the last hundreds of metres [13]. Businesses require deliveries directly to their stores. Hence, transport researchers need to understand how deliveries are currently performed and what are the issues that impact the efficiency and cost of these delivery operations. Moreover, Buldeo Rai et al. imply that there might be a great deal of uncertainty about the vehicle fill rate (load utilisation) in last mile delivery activities [8]. Additionally, the systematic review of the literature on last mile delivery presented in [14] highlights that collecting direct insights using surveys from the freight industry was considerably overlooked compared to applying modelling and simulation approaches.
Another observation of the literature is that many studies focused on leading freight carriers with hundreds of vehicles that might be more efficient and well utilised, rather than on small and medium-sized operators with inefficient and unsustainable delivery fleets and practices. These small and medium operators might individually operate a smaller number of vehicles in the inner city. However, they collectively represent a larger proportion of the overall number of freight vehicles on local roads in inner-city areas than leading freight carriers. Furthermore, the author of [15] calls for further research to examine the competition and spatial structure between the various freight carriers to understand whether they focus on the same zones in the inner-city area or service distinct territories.
In that light, this study investigates the freight delivery activities to retailers and businesses located in dense, inner-city areas. The objective was to characterise the attributes of the delivery trips across the full range of carriers and types of parcels for the last leg of delivery. The direct insights were obtained from responses collected using semistructured interviews with leading express couriers and an online survey with freight carriers that service retailers and businesses in the inner-city area of Melbourne, Australia. The main contributions of this study are twofold. First, the acquired knowledge from freight carriers provides useful insights on the operational practices and delivery fleet used for freight deliveries to business receivers specifically inside the inner-city area. Second, the study assesses the effect of selected variables on the operational efficiency of the freight carriers. Hence, policymakers and transport researchers can build on the derived knowledge to propose freight solutions and formulate regulations to produce city designs that optimise last mile freight deliveries in the inner city. This supports policymakers’ initiatives for balancing the competing needs for space and access dedicated to freight vehicles versus the quality of life and liveability within inner-city areas. This article is organised as follows: Section 2 presents a review of the literature on last mile deliveries within urban areas, while Section 3 describes the applied methodology of the study. Section 4 provides the results and analysis of the collected responses of the semistructured interviews and online survey. Section 5 discusses the implications of the results. Section 6 offers a concluding summary.

2. Literature Review

2.1. Overview of Last Mile Delivery Activities to Retailers and Businesses

The various commercial sectors and delivery requirements of goods receivers in city centres result in different and often conflicting categories of light parcel deliveries [16]. Based on the type of shipments, these receivers include retailers, food and hospitality, business, government offices, health and education establishments, as well as individual consumers such as residents, workers and visitors. Parcel deliveries to each category employ a different distribution channel. These often require different freight vehicle types. Operations by channel differ as well. All of this contributes to making last mile delivery a complex and challenging area [17].
Couriers, express and parcel (CEP) service providers presently constitute a significant volume of freight movements in the inner-city area. This is especially true for deliveries to residents and office buildings [18]. The CEP network is composed of three distinctive distribution channels [7]. Courier and express services perform the door-to-door, fast transport of documents, mail, home deliveries and light parcel shipments with value-added services. In contrast, parcel services focus on heavier, standardised shipments up to 30 kg [19]. The delivery lead-time and time-window for CEP channels are significantly different. Courier service has typically the shortest transport time, with direct delivery occurring from the sender to the receiver during the same day. Express service is time-sensitive, with a guaranteed delivery-window (typically next-day, or next two-days). Finally, parcel service usually has no fixed delivery time-window, given that delivery vehicles make multistops and multijourneys. Delivery vehicles of CEP service providers perform a large number of delivery stops. For instance, it was estimated that a delivery van typically delivers 118 shipments to 72 customers in 37 delivery stops in central London [20]. Scherr et al. suggest that utilising vehicle platooning technologies with a mix of autonomous vehicles and conventional vehicles could enable CEP service providers to deal with the high cost and inefficiencies of parcel deliveries [21].
Deliveries to retailers represent a considerable component of last mile delivery activities. The basic breakdown of categories by organisational structure is as follows: a) chain retailing, and b) independent retailing [19]. Deliveries to most retailers are performed using light commercial vehicles (LCVs) and light trucks [22]. These deliveries usually happen during the morning hours. The driver carries multiple shipments into each store. Alternatively, the hotels, restaurants and catering (HoReCa) distribution channel cover a wide range of food deliveries and supplies. These include dining establishments, cafes, hotels, bars, canteens and food preparers [23]. Because food is perishable, these deliveries require refrigerated transportation, which is a specialised service. Demand is time-sensitive and often unpredictable. Deliveries usually take place during the early morning, when there is less chance of traffic congestion [24]. A considerable share of these deliveries is by wholesalers and own-account transport in highly unoptimised vehicles, causing frequent delivery trips. Kijewska et al. estimated that retailers and HoReCa establishments in Szczecin, Poland, typically received 7 deliveries per week [25]. In another study, shops and retailers in the city centre of Parma, Italy, typically received an estimated 2–7 deliveries per week [26]. Similarly, retailers and HoReCa establishments in Oslo’s city centre typically received about 4.7–5.3 shipments per week [24].
As a complicating factor, there are many high-rise commercial towers in city centres of large urban areas, with each tower containing a diverse mix of business establishments, retailers and food outlets. Although most towers do not cover a large footprint, the various businesses in these towers collectively generate more freight movements as compared to on-street retailers and the businesses located within a single city block [27]. For instance, freight deliveries to businesses located within 56 neighbouring buildings in Manhattan, New York, accounted for about 4% of the total truck movements in all of Manhattan, which encompasses thousands of other buildings and business establishments [28]. In addition, businesses in commercial towers receive a large volume of express mail deliveries. For example, Thompson and Flores estimated that 34% of deliveries to a 57-storey mixed-use tower in Melbourne’s CBD consisted of express parcels [27]. They reported that more than 130 freight vehicles performed daily deliveries to about 52 businesses and 10 retail stores in the building.
In general, the inner-city area experiences a significantly large presence of freight vehicle movements. As an example, more than 10,000 and 12,000 freight vehicles perform daily deliveries in Melbourne’s CBD and London’s CBD, respectively [29,30]. Likewise, more than 35,000 commercial vehicle trips are generated for deliveries and services in Sydney’s CBD each weekday [31], while 100,000 trips happen daily by freight vehicles for deliveries in Manhattan, New York, to wholesale, retail and food establishments [32]. Figure 1 displays the different classes of freight vehicles typically used in urban areas. Freight carriers are increasingly using large commercial vehicles (LCVs), especially one-tonne vans, to perform delivery activities in inner urban areas. LCVs are more flexible and possess enhanced operational capabilities as compared to freight trucks [33]. It was estimated that freight carriers operated about three vehicles for freight deliveries to receivers in Turin’s city centre [34].

2.2. Operational Challenges and Issues of Last Mile Delivery in the Inner City

Freight carriers and receivers in inner-city areas suffer from various issues impacting last mile delivery. These problems are many and include (1) limited and inefficient parking and loading infrastructure, (2) restricted traffic movement, which is congested with a high mix of passenger vehicles, cyclists and pedestrians, (3) high inaccessibility of local streets in the city centre, with large concentrations of pedestrianised zones, and (4) lack of off-street loading facilities [36,37]. Although many deliveries occur in city centres, these areas offer a limited supply of available and affordable commercial and industrial land for logistics facilities [38]. In this regard, Broaddus et al. reported that between 1998 and 2008 warehousing floor space decreased by 82% in the congestion charge zone inside the City of London [39]. However, warehousing floor space increased by more than 20% in the outer suburbs in Greater London in the same span of years.
A fundamental constraint for inner-city deliveries is the lack of availability of parking and loading infrastructure. Although freight deliveries to commercial receivers have increased dramatically during the last three decades, the supply of on-street loading zones (OLZs) has not kept up with demand [40]. As a complicating challenge, the average traffic speed has been declining in the inner-city area. This adversely impacts the travel time and the reliability of deliveries. For example, Allen et al. reported that vehicle delays have increased by 31% in central London [20]. Further, Bates et al. forecasted that congestion would increase in central London by 60% in 2030 [41]. These issues collectively make it difficult for freight carriers to comply with the time-sensitive delivery requirements of business receivers.
Thompson and Zhang emphasised that searching for available OLZs causes significant time loss for freight carriers [42]. Couriers experienced frequent difficulties finding available parking spaces and accessing off-street loading docks in buildings. They are often forced to depend on the kerbside for deliveries, especially near high-rise towers. A study performed in Seattle, USA, revealed that couriers had used the kerbside to park their vehicles during deliveries to about 87% of all buildings in the downtown area [43]. Similarly, Allen et al. reported that couriers had to use the kerbside for about 95% of deliveries in central London [6]. Couriers need to park their vehicles very close to the retailers and businesses. Their productivity decreases with longer walking distances, as they become less able to carry multiple parcels in each walking trip [40]. For example, the parking time of freight vehicles at OLZs in central London accounted for 62% of their daily operations, as couriers had to walk a longer distance to perform the deliveries to receivers [20]. The same study also indicated that the couriers had to walk on average for more than 105 metres to perform each delivery stop. The long walking distance is a significant issue, especially for drivers that perform multiple deliveries. Because of the ineffective parking infrastructure, freight vehicles often overstay the allowable parking time or park illegally, which results in significant parking fines for these freight vehicles.

3. Methodology

In order to implement a comprehensive and robust data collection framework, it is important to systematically consider and determine the necessary data requirements to achieve a full and reliable understanding and assessment of last mile delivery [44]. Allen et al. reported that freight carrier-based surveys enabled the acquisition of a wide range of useful data and parameters to characterise the delivery operations and challenges, based on their extensive evaluation of 162 studies that collected urban freight data, [45]. This study aimed to examine the delivery and pickup activities of freight carriers operating inside the congested inner city. Another goal involved producing a detailed and updated description of the last mile delivery network. Accordingly, two data collection techniques were utilised to quantify these characteristics. Acquiring reliable operational data and insights from freight carriers required using a systematic approach that involves quality checks and due diligence for the data collection process. Hence, the transportation survey process, which was developed by Richardson et al. [46], was slightly modified and applied in this study as depicted in Figure 2. This holistic approach ensures the robustness and integrity of the data collection techniques in acquiring reliable and valid primary data from the respondents in the data collection process.
Accordingly, the following section details the two data collection techniques used for the study:

3.1. Semistructured Interviews

Interviews with transport managers of large CEP service providers in Melbourne, Australia, served as the method to acquire practical insights. This included a description of the last mile delivery road network, both inter- and intra-metropolitan. The selection of potential interviewees was based on an expert sampling technique. An issue of this approach is that it might not allow a complete coverage of the sample population. Bias is possible, as the researcher might overweight subgroups in the population that are more readily accessible. However, the aim of the interviews was to involve highly knowledgeable transport managers to obtain insights on the last mile delivery network in the inner city. The expert sampling strategy allowed for rapid and inexpensive access to potential participants that are knowledgeable. This subgroup was more convenient to reach as compared to other random sampling strategies [47]. Accordingly, ten transport managers participated in the interviews. The interview questions sought open-ended descriptions about when and how parcels were unloaded and sorted from inter-state and intra-state transport and received in facilities. Additional insights were obtained on the structure and network of their deliveries to the inner-city area.

3.2. Online Survey

An online survey was carried out with depot managers of freight carriers in Melbourne. The survey focused on operational parameters of the delivery practices and trips of the last leg of delivery to receivers in the inner city. These parameters included:
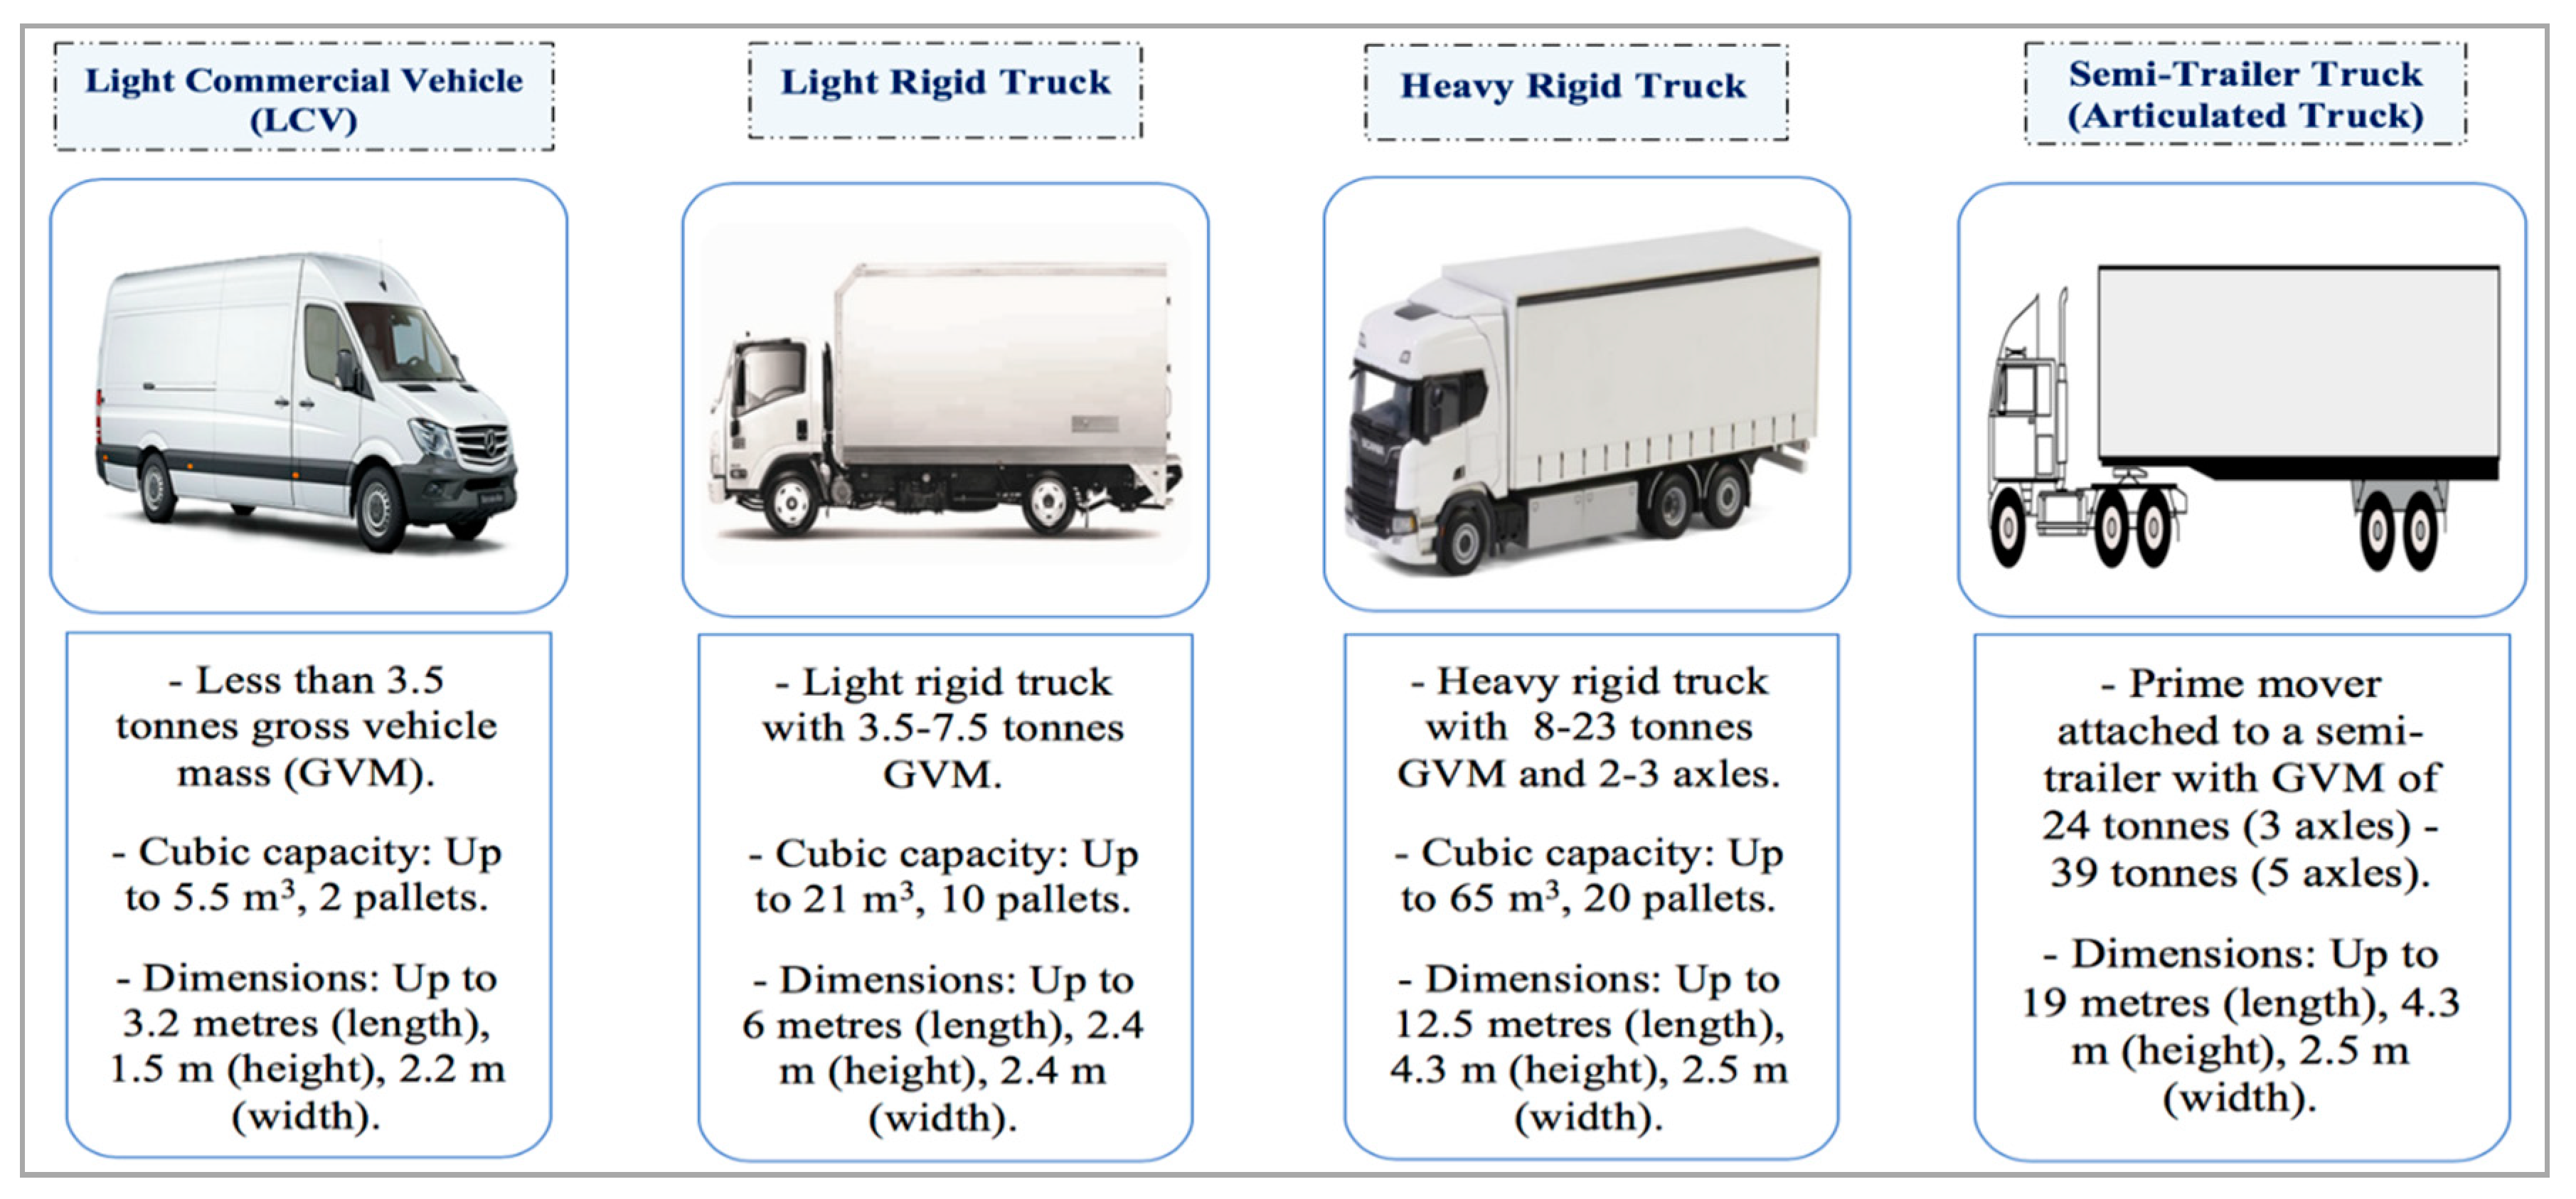
  • the class and number of freight vehicles and the average vehicle fill rate
  • decision-maker for the order of the stops
  • number of daily delivery rounds
  • number of daily delivery stops per vehicle
  • average number of parcels delivered per stop
The depot managers also ranked (100-point allocation) the effect of selected issues on the efficiencies of their delivery operations. These included:
  • finding available parking
  • traffic congestion
  • regulations of on-street loading zones
  • receiver’s availability
  • access to high-rise buildings
  • finding the correct entry point to the receiver
  • street design
A systematic online search using several electronic directories and databases yielded a comprehensive list of all the freight carriers in Melbourne. A crosscheck of databases confirmed the accuracy of the freight carriers’ details. The crosscheck facilitated the removal of incorrect entries from the list. Thus, the targeted population focused on all freight carriers and express couriers that conducted delivery and pickup services to receivers in the inner-city area of Melbourne. According to the Australian and New Zealand Standard Industrial Classification (ANZSIC), these businesses operated under the standard classification of Transport, Postal and Warehousing (TPW) and belonged to four ANZSIC subclassifications (4610 Road Freight Transport, 5101 Postal Services, 5102 Courier Pick-up and Delivery Services, 5309 Other Warehousing and Storage Services). The search generated a total of 287 companies within these four subclassifications. The warehouses and depots of these companies are disbursed across the following geographical subregions (clusters) in Greater Melbourne: Inner Melbourne (Port Melbourne and West Melbourne), East (Knoxfield, Rowville), Southeast (Moorabbin and Dandenong South), North (Tullamarine and Campbellfield) and West (Altona/Laverton and Truganina). Some of the clusters had specialisations in certain products or industries.
The following outlines the selection criteria using multistage clustering sampling to establish the potential participant pool of freight carriers:
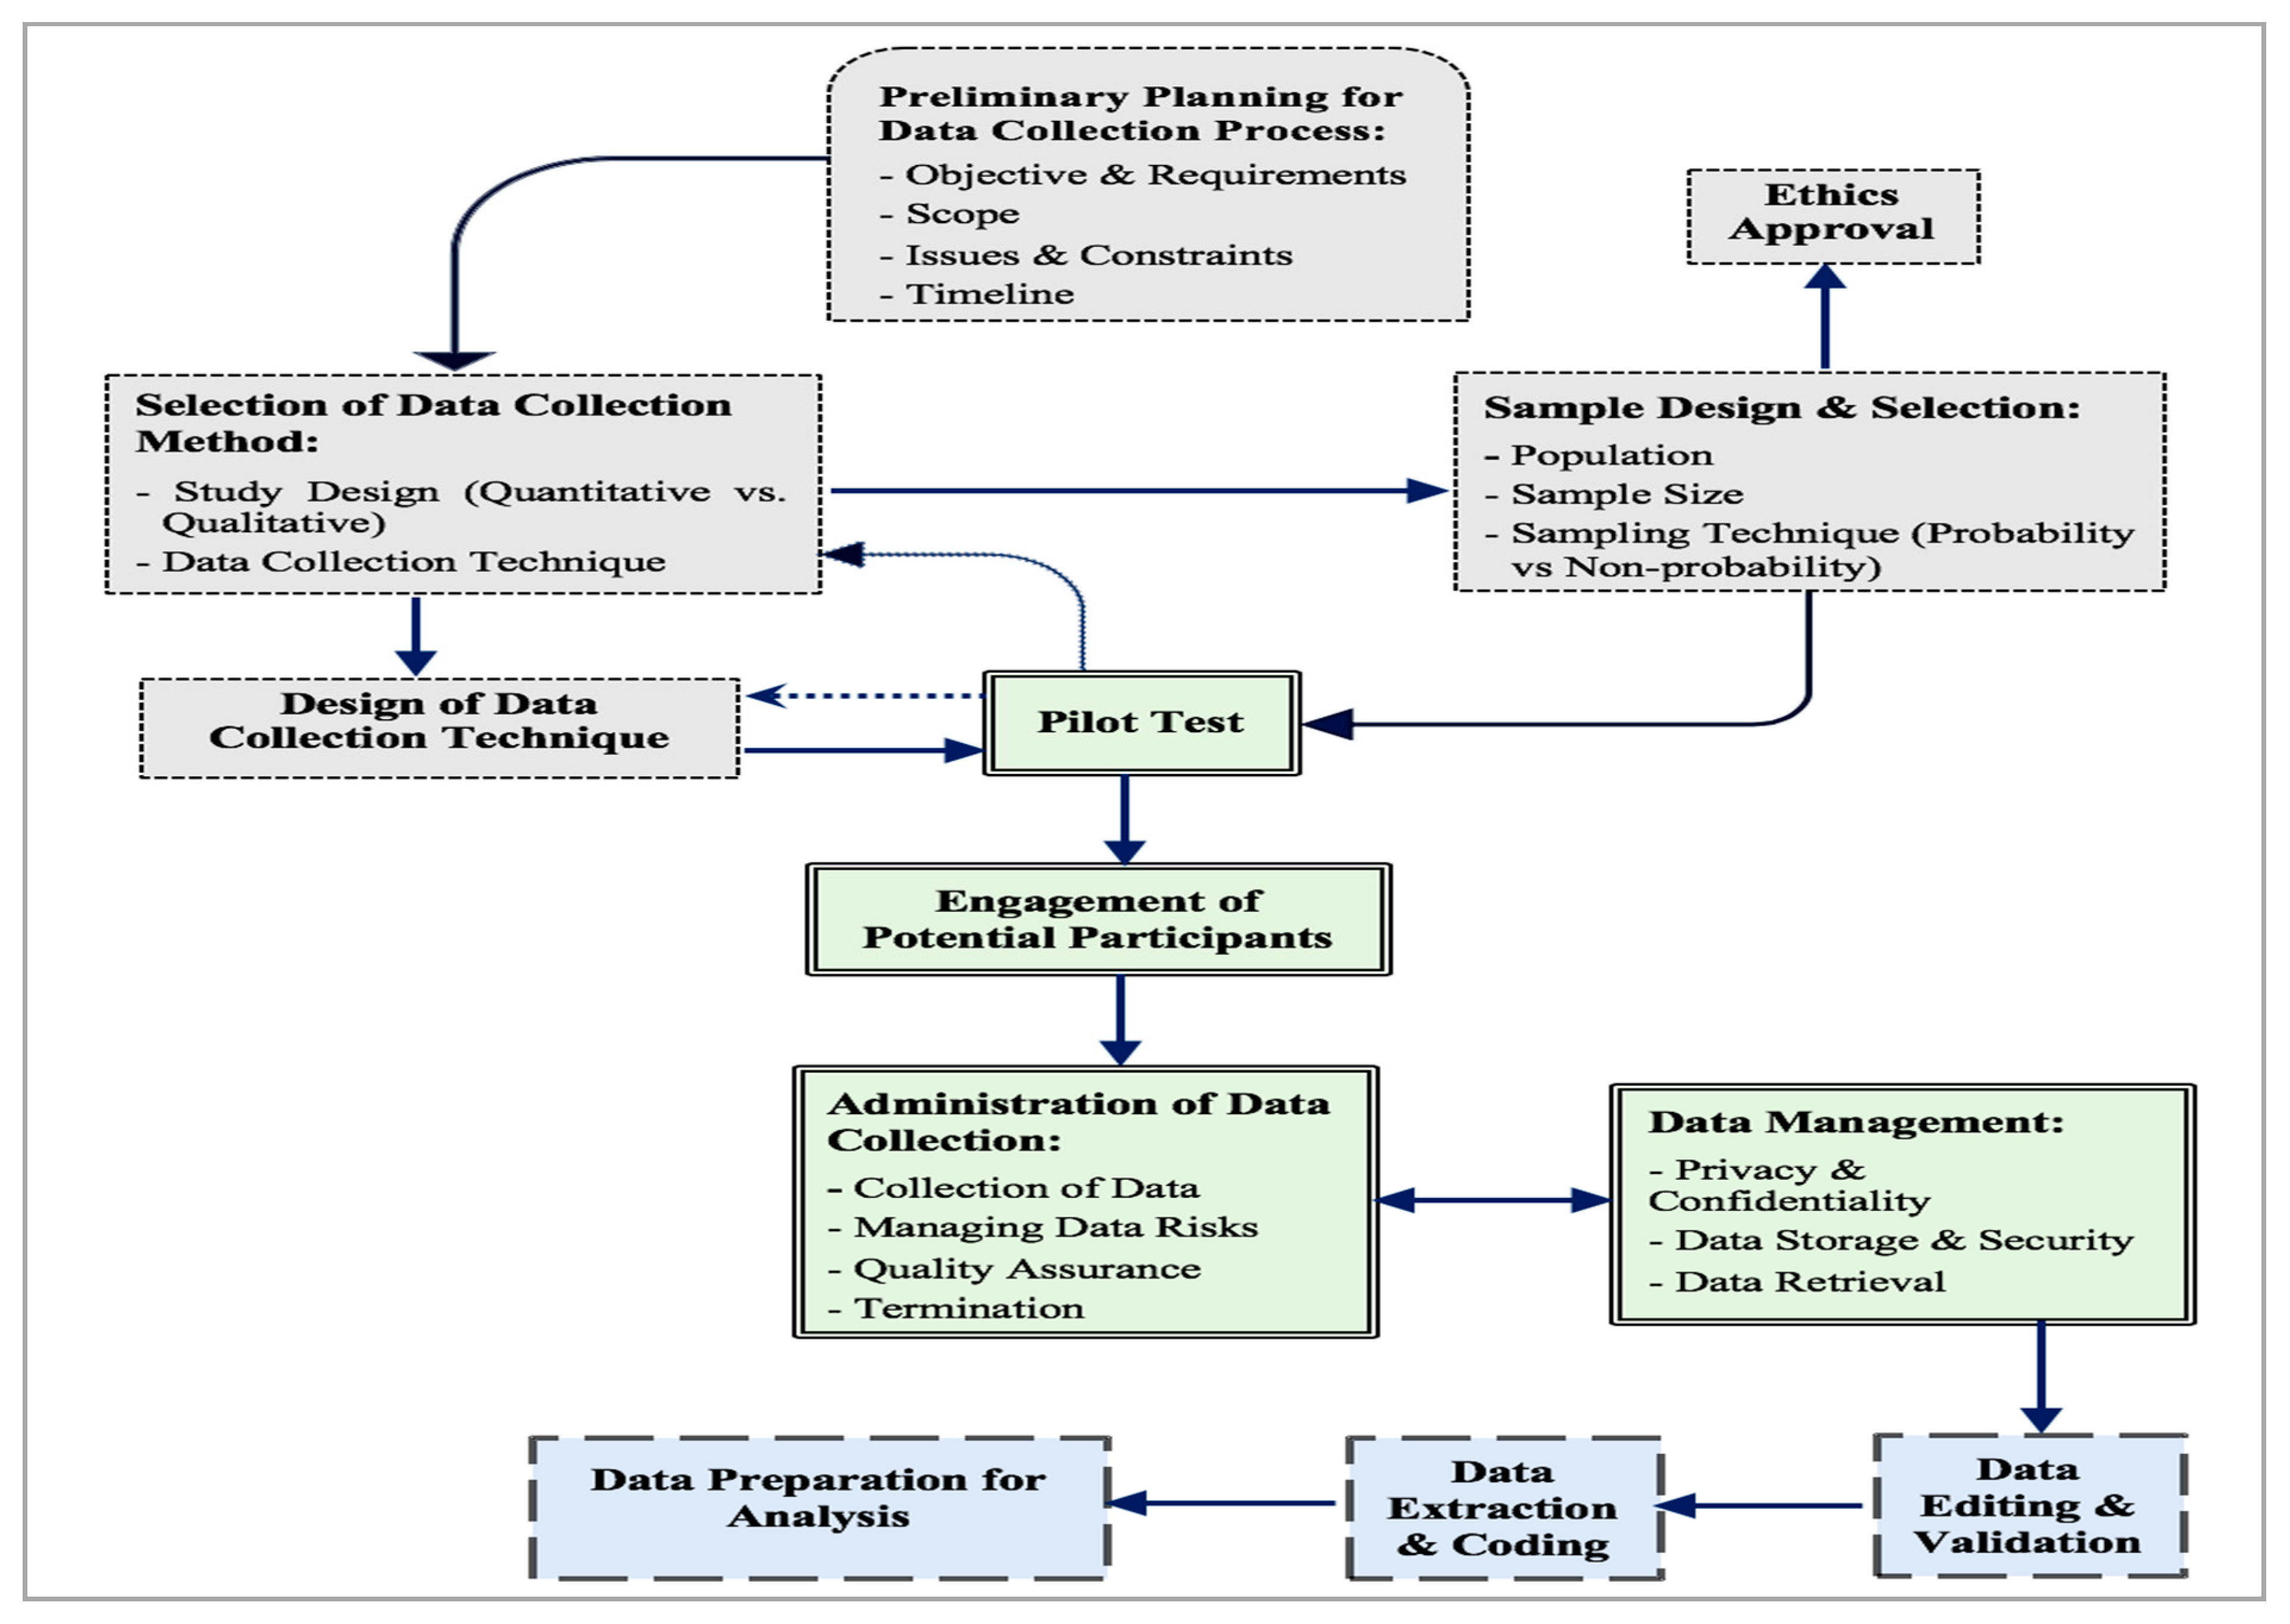
  • 1st Stage: out of the possible 5 clusters in Greater Melbourne, all 5 clusters were selected. Number of selected clusters: 5
  • 2nd Stage: out of the possible 4 TPW sub-industries in each cluster, all 4 TPW sub-industries were selected. Number of subclusters: 20
  • 3rd Stage: 10 businesses from the 4 TPW sub-industries were selected by simple random sampling in each cluster. Total sample: 200 delivery companies.
Because of their busy daily routine, the survey and interviews for the target transportation managers had to be quick and precise to ensure full participation from the sample population. Leedy and Ormrod underlined the importance of checks for content validity in advance, along with the reliability of the data collection instrument [47]. Hence, the researchers consulted some freight carriers in the early stage of survey formulation to confirm that the proposed method adequately covered all of the critical issues. The logical progression of the questions received special care. Three freight carriers participated in the pilot testing of the survey to identify any problems that might affect its quality, as well as eliminate any words or phrases that might create confusion or misunderstanding of the questions. After the pilot, some questions underwent revision to eliminate any misinterpretation by the potential participants.
Potential participants from the sample received an advanced email to inform them about the study and to have them confirm that they provided delivery services to receivers in the inner city. Accordingly, transport managers working at 200 businesses formally received an email that invited them to participate in the survey. Strenuous efforts took place to get an even distribution of responses from all types and sizes of freight carriers, including small and medium establishments. This was especially important to avoid a response bias towards large and international delivery companies. There was also a concern to get survey coverage from all regional subgroups in Melbourne, to ensure equal representation of the various freight carriers and the products that they deliver. In total, the researchers collected responses from 55 freight carriers, which represented a 28% active response rate. The responses included freight carriers serving receivers in inner Melbourne across different subindustries, including clothing and footwear, consumer electronics, express mail, food and beverages, homeware and kitchenware, office supplies, toiletries and cleaning products and whitegoods and appliances. The 55 respondents accounted for 20% of all the freight carriers that operate in Melbourne.

4. Results and Analysis

4.1. Analysis of the Last Mile Delivery Network of CEP Service Providers (Responses of the Semistructured Interviews)

The transport managers from ten CEP service providers offered a detailed description of the last mile delivery network. They also provided specific descriptions about operational practices to handle, sort and deliver the parcels. For large CEP service providers, the majority of inter- and intra-state consignments used heavy rigid trucks for transport, along with the frequent use of tautliner (curtain-sider) semiarticulated trucks.
For rigid trucks, the parcels are loaded and stored into the truck using roller containers. In contrast, the tautliner trailer has curtains on both sides that can be pulled up and down to load the parcels. Steel cages, loaded by forklifts through the sides or rear of the truck and strapped into place, contain the parcels. Depending on the size of the truck, it can transport up to 25 cages with each cage carrying hundreds of parcels. The tautliner trucks provide CEP companies with a higher payload capacity, secured and weather-protected storage and easy access for the efficient loading and unloading of the parcels. These trucks usually arrive at the depot or distribution centre in the suburban parts of the city between midnight and before dawn.
At the depot, large CEP service providers use fully-automated systems that scan, weigh and transfer the parcels from the incoming trucks to the sorting and handling area. The parcels then move on loading chutes designated for each major delivery zone and are loaded, in turn, into the outgoing delivery vehicles. However, there are some CEP service providers that still use forklifts to offload the parcels from the trucks and transfer them in mesh containers to the sorting area. In some facilities, manual pickers sort the parcels into the containers. All storage and movements of parcels utilise bar codes for sorting the parcels into mesh containers designated for each block or zone in the inner-city area. These containers include parcels addressed to receivers in that particular block or zone. Consequently, the containers move to the loading bays for placement in the delivery vans or trucks.
Each major block of buildings in the inner-city area receives shipments by an assigned delivery vehicle. This vehicle usually conducts all deliveries and pickups from customers within that particular zone. Delivery vans are mainly used for delivery and pickup jobs in the city centre and residential areas, while trucks are used sometimes in suburban areas and for deliveries to large commercial receivers. For example, the logistics manager of the largest CEP service provider indicated that they divide Melbourne’s CBD into 8 different delivery zones with each zone covering up to 4 blocks. On a typical day, more than 40 delivery vans and 20 trucks perform the delivery and pickup services for that particular CEP service provider in Melbourne’s CBD. However, 8–12 delivery vans usually service inner Melbourne for the majority of the other CEP service providers.
The driver loads the parcels into the vehicles to decide the number of delivery stops depending on the loading capacity, the number of daily delivery rounds, the number of receivers and the parcel size. The majority of the interviewed transport managers indicated that the CEP service providers usually apply advanced routing and scheduling software to determine the daily delivery routes for each delivery van. The sequencing decision for the deliveries (drops) is either provided by the advanced routing software or selected based on the personal experience of the driver. The CEP service providers typically schedule between 2–3 daily delivery rounds for each delivery van. The first delivery round begins around 7 AM. For the second delivery round, the delivery vans leave the depot at 12 PM, around 40–50% loaded. Large CEP companies schedule the third delivery round to leave the depot around 3 PM. As the courier makes a high number of stops every day, it is operationally necessary for drivers to leave space in the cargo area to quickly unload/load parcels at each delivery stop. A fully-loaded vehicle makes it difficult to offload the various parcels going to the large number of receivers, as the courier would spend unproductive time placing and readjusting the parcels in the cargo area due to changes in the sequence of the receivers. There is a high uncertainty as to the availability of on-street loading spaces upon vehicle arrival. Further, the traffic conditions, the vacancy of parking spaces and the availability of receivers all combine to adversely affect the efficiency of the couriers. Any changes to these conditions result in an altered sequence of delivery stops. This makes optimising the delivery round very complex, as it is a dynamic process. Hence, it is operationally difficult for delivery vehicles to leave their depot more than 60% loaded.
CEP companies usually apply different approaches for scheduling parcel pickup jobs. Large CEP companies schedule pickup jobs in busy zones during the afternoon hours. Earlier in the day, the delivery van completes all delivery jobs in the morning hours. However, there are some CEP companies that schedule delivery and pickup jobs during both the morning and afternoon delivery rounds. A delivery van performs about 100–120 stops (drops) daily in the inner-city area for a large CEP service area. A medium-sized CEP courier attempts to complete around 75–85 stops. Most drivers prefer to load express mail parcels (envelopes and satchels) into a tote box for easy delivery to neighbouring receivers. A single drop to a receiver typically contains between 1–3 packages, while a single delivery to a large receiver sometimes includes more than 5 packages. Conversely, a light truck performs between 40–60 stops per day in the inner-city area. Moreover, couriers usually deliver 5–8 parcels/stop when using trucks. Drivers return undelivered parcels to the depot and attempt a redelivery to the receiver in the following business day either for free or an additional cost depending on the agreed service with the shipper.
CEP service providers apply different vehicle ownership structures for their fleet. A large number of respondents revealed that their companies do not own the delivery vehicles. They depend on driver-owner couriers to perform delivery and pickup jobs. Some companies that still own a proportion of the delivery fleet usually rent these vehicles to couriers to perform the delivery and pickup services for a contracted fee per parcel, especially in the busy city centre. Many CEP service providers establish franchising agreements with the driver-owner of the vehicle in non-premium parts of the inner-city area. The franchisee operates their own vehicle within an exclusive territory to deliver and collect parcels for the CEP service providers.

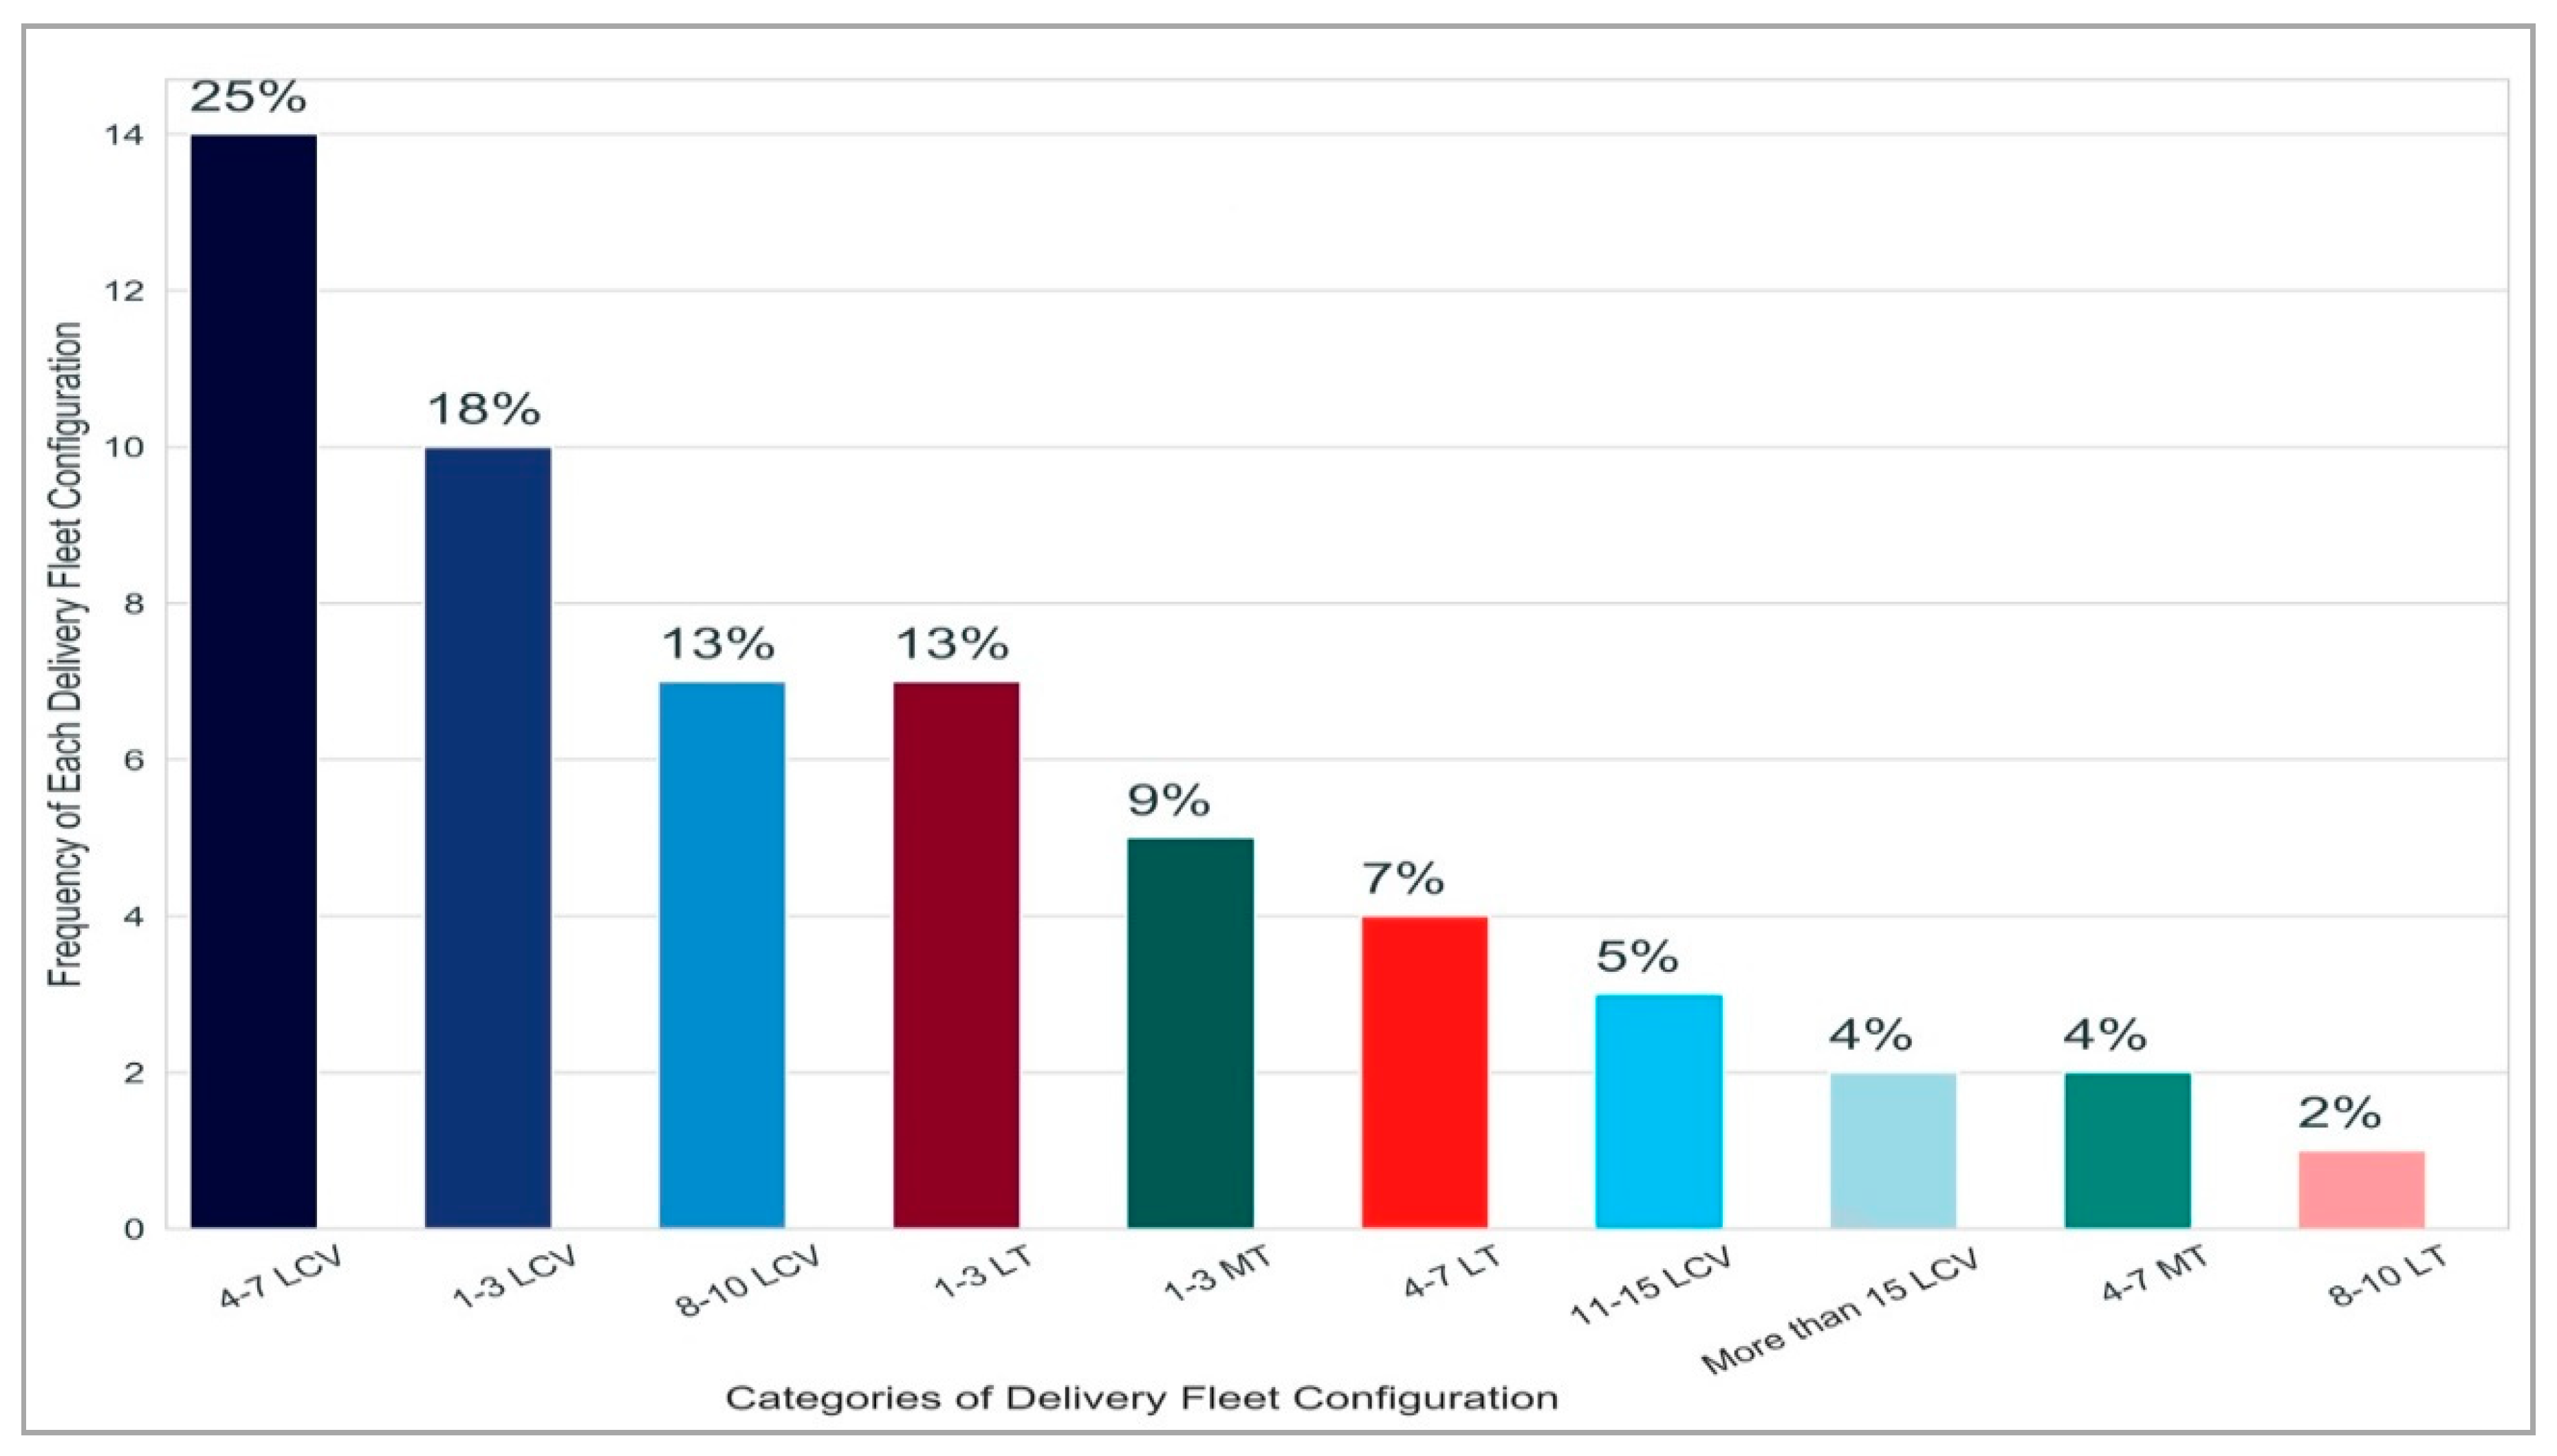
4.2. Delivery Practices for Freight Carriers in the Inner-City Area (Survey Responses)

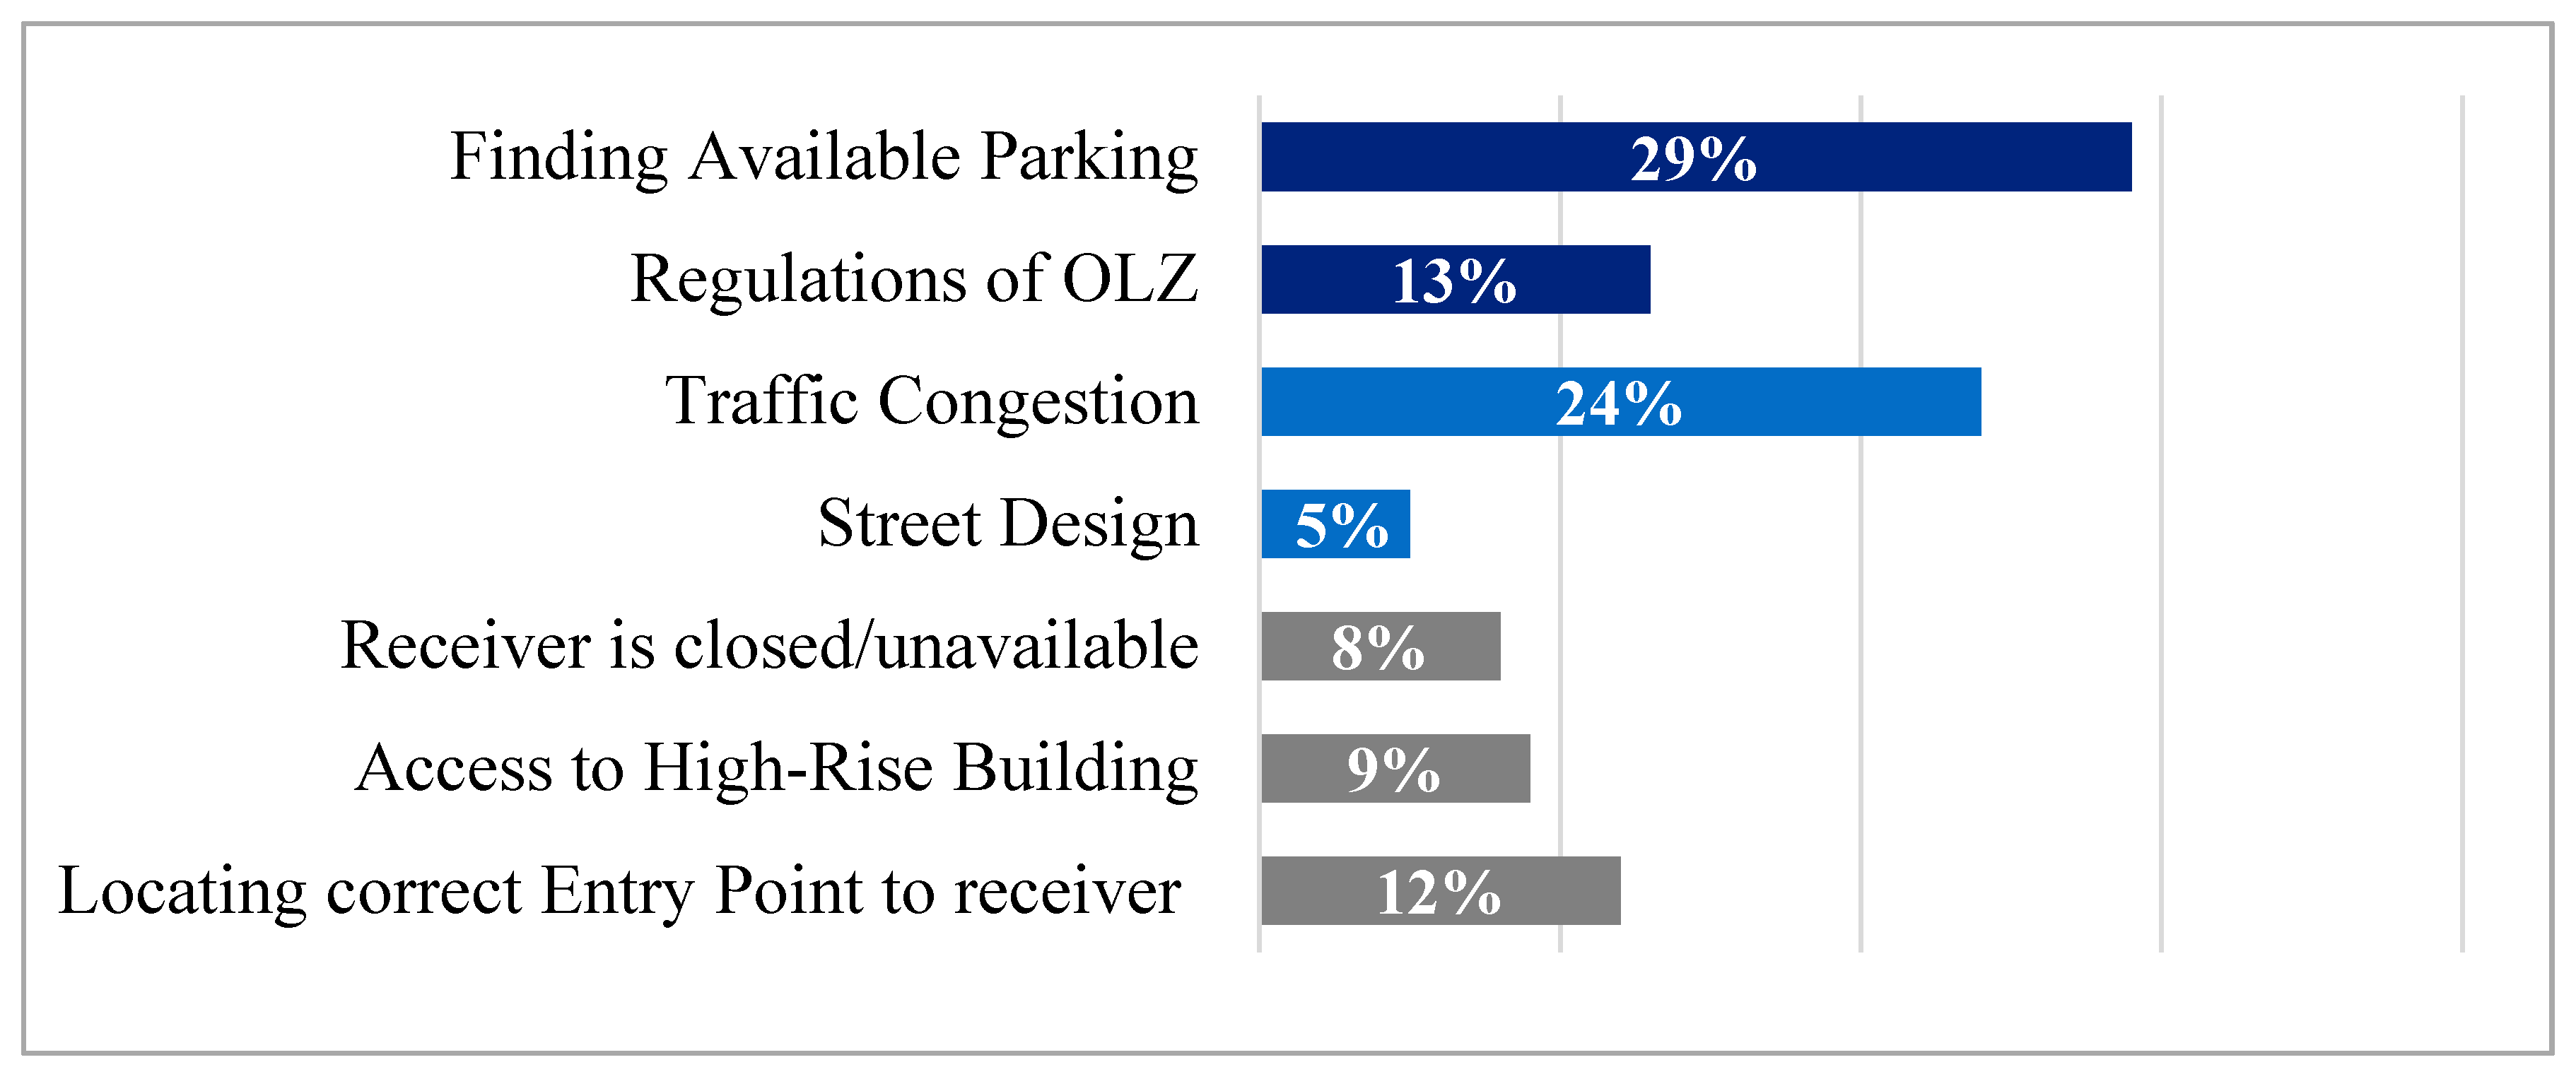
4.2.1. Descriptive Analysis of the Delivery Trips and Operational Issues for the Freight Carriers

This section provides an analysis of the 55 responses received from the freight carriers. The general categories of these responses include delivery practices, the fleet and the challenges affecting their inner-city operations.
The responses highlight that freight carriers utilise LCVs to perform the majority of delivery and pickup activities to retailers and businesses in the inner-city area of Melbourne. The survey showed that 65% of freight deliveries were from LCVs whereas light trucks (less than 4.5 tonnes gross weight) and medium trucks (more than 4.5 tonnes gross weight) comprised 22% and 13% of the delivery activities, respectively. However, the survey respondents expressed that the share of LCVs in freight deliveries in Melbourne’s CBD exceeded 80%.
Figure 3 displays the fleet configurations used by the respondents to cover the daily delivery operations to business receivers in inner Melbourne with the number of freight carriers shown in the vertical axis. About 43% of the respondents (24 freight carriers) typically operated up to 7 LCVs, whereas 22% (12 freight carriers) of the respondents indicated that they operated more than 8 LCVs to perform freight deliveries in the area. It is worth noting that the participants with a large fleet of LCVs are express couriers that typically divide inner Melbourne into distinct delivery zones, to service the various retailers and businesses in each zone. With respect to freight trucks, it was reported that 13% (7 freight carriers) and 9% (5 freight carriers) of the respondents utilise up to 3 light trucks and 3 medium trucks, respectively. However, 9% (5 freight carriers) indicated that they operate more than 4 light trucks in the study area.
The freight carriers were asked to elaborate on their decision-making with respect to the order of stops and sequence of parcels for neighbouring customers at the stop before leaving the depot. About 53% of the participants (23 freight carriers) indicated that the driver usually sorts and sequences the parcels for the customers based on their experience and knowledge of the delivery area and customers’ locations. Only 16% (9 freight carriers) reported that the depot manager decides the order. Further, only 31% (17 freight carriers) responded that the order of customers is assigned by routing and scheduling software and automatically uploaded to the driver’s handheld device.
With respect to the average vehicle fill rate, freight carriers reported a range of values. The delivery vehicles for 19 freight carriers (35% of respondents) leave the depot around 40–50% loaded. In contrast, 9 freight carriers (16% of respondents) indicated that their vehicles were more optimised as the vehicle load exceeds 70% of capacity. Alternatively, 15 freight carriers reported average capacity at 50–60% and 12 freight carriers reported that their vehicles were usually 60–70% loaded. An interesting corollary is that capacity utilisation varied by vehicle class. The average for LCVs was between 50–70% whereas the average capacity of light trucks was less than 60%. The least utilised, medium trucks, left the depot at less than 50% capacity.
Figure 4 illustrates the attributes of the delivery trips for each vehicle class to perform the last leg of delivery to business receivers. With respect to the number of delivery rounds, 32 freight carriers (58% of respondents) indicated that their vehicles typically perform a single delivery round per day in inner Melbourne while 33% (18 participants) stated that their vehicles usually conduct a morning and afternoon delivery round. However, 9% (5 express couriers) highlighted that their delivery vans carried out three rounds per day: two delivery rounds (early morning and midday) and a single pickup round around 3 PM. Most freight carriers that utilise trucks often perform a single delivery round. In contrast, the 36 freight carriers that operate delivery vans expressed some variances, as 17 respondents performed a single delivery whereas 14 respondents performed two delivery rounds per day.
Figure 4 shows that the number of delivery stops performed by LCVs considerably differed between the various fleet configurations. Freight carriers that operate a smaller fleet of delivery vans (less than 7 LCVs) performed 40–60 delivery stops to business receivers in inner Melbourne. However, freight carriers that operate a larger fleet of delivery vans (more than 8 LCVs) often performed more than 80 delivery stops. This could be because of a wider customer base for large freight carriers that typically operate in inner-city areas. Moreover, delivery vans carry out around 65 delivery stops, and 50 delivery stops to food outlets and retailers such as clothing and consumer electronics, respectively. Delivery vans make around 75 stops for express parcel deliveries to businesses. However, vans of large express couriers carry out around 100 stops for express parcel deliveries.
In contrast, carriers indicated that freight trucks perform a considerably lower number of delivery stops compared to delivery vans. Most light trucks performed less than 60 delivery stops, whereas most medium trucks performed less than 40 stops. Medium trucks performed around 20–40 delivery stops for food and office supplies, whereas bulky items such as appliances and homeware comprised less than 20 deliveries. Express couriers using freight trucks carried out around 40–50 stops for express parcel deliveries to businesses. It is summarised that a delivery van typically performs around 55–60 stops to business receivers in the study area whereas light trucks and medium trucks perform 40–45 stops and 25–30 stops, respectively. Additionally, the number of delivered parcels per stop differed between the vehicle classes as illustrated in Figure 4. LCVs deliver around 3 parcels per delivery stop whereas light trucks and medium trucks deliver 4–7 parcels/stop and 8–10 parcels/stop, respectively.
Figure 5 illustrates the 100-point allocation assigned by the survey participants to the influence of the operational issues on the efficiencies of the carrier operations in the inner-city area. Issues related to parking and loading infrastructure, which appear in dark blue colour, received the top rating by participants. Finding available parking received the highest rating (29%) while regulations of OLZ ranked as the 3rd most negative issue (13%). This high rating highlights the negative effects of the improper planning and unavailability of on-street loading infrastructure. Issues related to traffic congestion and physical design of the city centre, which are shown in blue colour, were viewed as the second most negative aspects, as traffic congestion received a rating of 24%, whereas street design received a modest rating of 5%. Issues arising from street design were almost irrelevant for most freight carriers except for medium trucks (only 5%). A striking observation was that express couriers did not report traffic congestion to be a significant negative impact as compared to other types of freight carriers. The reason for this could be that couriers make drop-offs to designated delivery zones, which increases their awareness of the area and allows them to avoid heavy traffic. However, freight carriers using medium trucks stated that these two issues have more influence on their efficiencies because traffic congestion and physical constraints such as narrow lanes and street closure exerted significant pressure on their drivers to perform their operations.
Issues related to receivers’ accessibility and availability, which appear in grey colour, received a ranking of fourth by the survey participants. As many retailers and businesses in the city centre are located in commercial towers and congested roads, many freight carriers encountered difficulties accessing these receivers and locating the quickest and proper entry point to deliver their orders. Some survey participants complained that many deliveries to these receivers require access through main entrances where couriers must navigate through loading docks and elevators to reach the different receivers inside these buildings. Some freight carriers warned that this problem was made worse by high driver turnover, i.e. rate of couriers leaving the job, which negatively affected the freight carriers as they continually needed to inform their couriers on the best approaches to reach the receivers in these constrained buildings. Some express couriers allocated almost 40 points to the category “access to high-rise towers,” highlighting the difficulties that their drivers encountered to meet the strict delivery policies imposed by the building managers of these high-rise towers. They expressed considerable displeasure about the excessive lost time between parking the vehicle and completing the delivery or pickup.

4.2.2. Inferential Analysis of the Relationships between the Characteristics of Delivery Trips and Operational Issues

A series of inferential analyses were conducted to explore potentially significant associations between the property of freight carriers (vehicle and product type), the characteristics of the delivery trip (fill rate, number of drops and number of parcels delivered per drop) and the operational issues faced by freight carriers. The operational issues were assessed on a scale of 0% to 100%, with higher percentages indicating a higher impact of the operational challenge.
Two non-parametric test methods, Kruskal–Wallis H and Spearman’s rho correlation, were applied for all analyses due to the ordinal measurement level of variables and/or small group sizes [48]. Only statistically significant results are presented in this section, to enhance the readability of the report. Three Kruskal–Wallis H tests were performed to assess relationships between vehicle type vs. characteristics of the delivery trip, vehicle type vs. operational challenges and product type vs. operational challenges. These tests compare the mean rank of the categories in the independent variable and determine whether differences in the mean rank are statistically significant. The Kruskal–Wallis H test rejects the null hypothesis (Ho: all the mean ranks of the variables are equal) if the Hscore is greater than the critical value of χ2 for the degree of freedom (df) used. Spearman’s rho correlation analysis was performed to examine the strength and direction of the relationship between the operational challenges and the number of drops variable. Spearman’s rank correlation ranks the variables being evaluated for correlation and finds the correlation between the variables’ ranks (from −1 to 1). A positive correlation coefficient (ρ) indicates a positive relationship between the two variables, while a negative correlation coefficient indicates a negative relationship.
The results of the first Kruskal–Wallis H test indicated statistically significant differences in all attributes of the delivery trip under examination between vehicle types. Table 1 summarises the results of the KW-H tests. We can reject the null hypothesis that vehicle types all have the same characteristics of delivery trips, as the Hscore was greater than χ2. Therefore, it could be extrapolated that the characteristics of the delivery trips differ significantly between types of vehicle.
Particularly, it was shown that:
  • LCVs have a significantly higher fill rate than LTs (p = 0.068, r = 0.5) and MTs (p < 0.001, r = 0.59). LCV drivers reported a fill rate between 60% to 70%, whereas LT and MT drivers stated a fill rate of 50–60% and less than 40%, respectively.
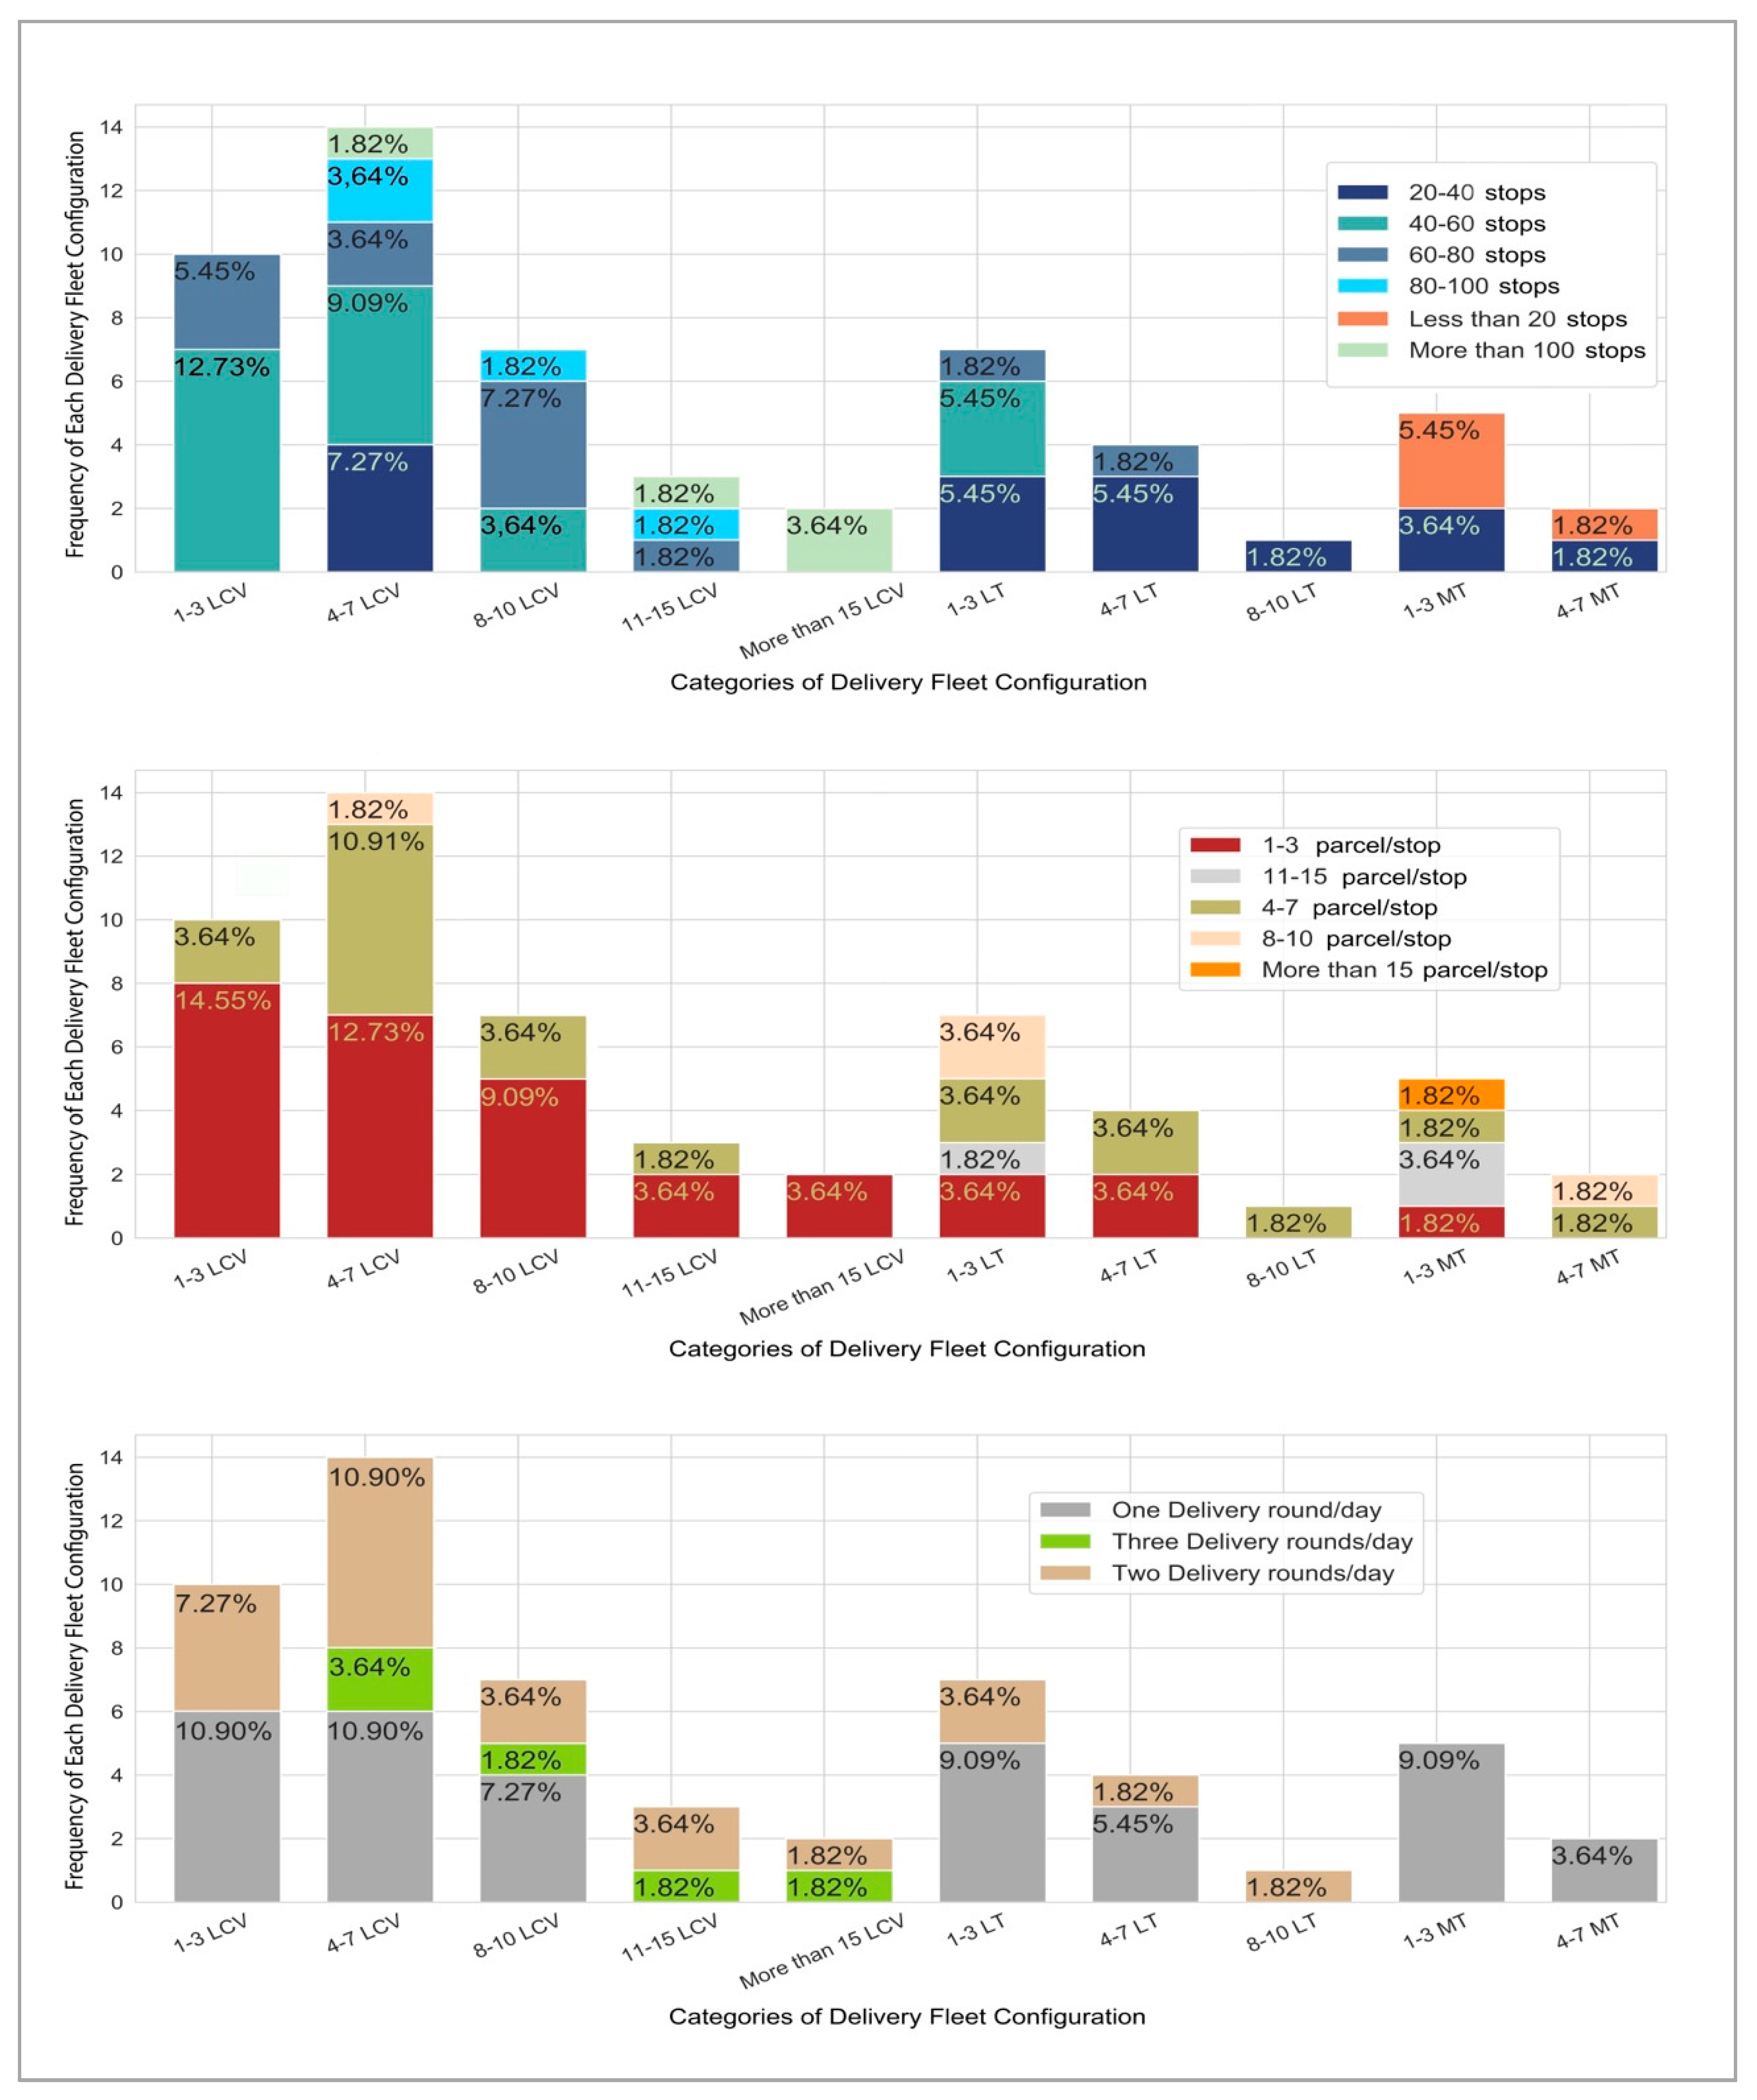
  • LCVs perform a significantly higher number of drops than MTs (p < 0.001, r = 0.66). LCV drivers made 40 to 60 drops, while MT drivers made 20 to 40 drops.
  • MTs deliver a significantly higher number of parcels per drop than LCVs (p = 0.026, r = −0.40). MT drivers deliver 8–10 parcels per drop, whereas LCV drivers deliver between 1 to 3 parcels per drop.
Subsequently, the second Kruskal–Wallis H test was conducted to evaluate if there was a statistically significant difference in operational challenges faced by freight carriers between types of vehicle. The independent variable included three categories of vehicle types, LCV, LT and MT. The dependent variables were “finding available parking”, “access to high-rise building”, and “street design”. With p-value ≪ 0.05 and an Hscore greater than χ2, we have sufficient statistical evidence that the impact of these operational issues is different for different vehicle types. Table 2 displays the results of the Kruskal–Wallis H tests for this analysis.
It can be inferred that:
  • MT drivers reported significantly higher difficulty in finding available parking than LCV drivers and somewhat higher than LT drivers (MT vs. LCV: p = 0.006, r = 0.47; MT vs. LT: p = 0.030, r = 0.56). MT drivers had a rating higher than 30% for the influence of this issue, whereas LCV/LT drivers stated a rating of 25%.
  • LCV drivers have significantly higher difficulty in accessing high-rise buildings than MT drivers (p = 0.033, r = 0.39). LCV drivers reported a rating of 12.5%, whereas MT drivers stated a rating of 0%.
  • LT and MT drivers have significantly higher difficulty than LCV drivers as to street design (LT vs. LCV: p = 0.001, r = −0.54; MT vs. LCV: p < 0.001, r = −0.90). LCV drivers reported a rating of 0%, while LT and MT drivers stated a rating of 10% and 20%, respectively.
Afterwards, a Kruskal–Wallis H test was first conducted to examine if there is a statistically significant difference in operational challenges faced by freight carriers between the delivery of different product types. The independent variable included three categories of product types: food and beverages, express post and clothing and footwear, while the dependent variable was “access to high-rise building”. Results indicated a statistically significant difference in the operational challenge access to high-rise buildings between product types, H (2) = 12.33, p = 0.002, where the delivery of express post was more challenged than the delivery of clothing and footwear (p = 0.001, r = 0.81). Specifically, a rating of 0% was observed for clothing and a rating of 6% for food, while a rating of 16% was indicated for express post. Clothing and footwear retailers often operate in shopping centres and on-street stores, which could explain the 0% rating for the influence of “access to high-rise building” for these products. Consequently, it could be inferred that the impact of access to high-rise buildings is significantly differentiated between the deliveries of different product types.
Finally, a series of Spearman’s rho correlation analyses were employed to explore if there was a statistically significant relationship between the operational challenges and the number of drops. Results indicated that, independently of vehicle type, there is a statistically significant strong and negative relationship between street design and the number of drops, rs (53) = −0.54, p < 0.001, suggesting that freight carriers who were more affected by street design reported a lower number of drops. Concerning LCVs, a statistically significant strong and negative relationship between finding available parking and number of drops was identified, rs (32) = −0.56, p = 0.001, indicating that LCV drivers who were more affected by finding available parking mentioned a lower number of drops. Regarding MTs, there was a negative relationship of medium strength between traffic congestion and number of drops, rs (10) = −0.38, p = 0.32, suggesting that MT carriers who were more affected by traffic congestion reported a lower number of drops. However, it should be noted that no significance was obtained for this relationship, despite its strength. No significant relationships for LTs were observed.

5. Discussion

5.1. The Delivery Practices and Operational Challenges of Freight Deliveries to Business Receivers in the Inner City

Freight carriers are increasingly using delivery vans for inner-city freight deliveries rather than freight trucks, as trucks are more cost-competitive per parcel due to their larger cargo area. The changing and often conflicting delivery requirements for the various receivers in the inner-city in terms of parcel size, product type, delivery frequency and preferred time-window, even among businesses in the same commercial sector, further complicate the efficiency and delivery practices of freight carriers. Complicating matters even further, the ineffective on-street loading spaces, whether in the lack of availability or outdated regulations, adversely affect the parking practices and operational efficiency of freight vehicles. This is apparent by the high rating assigned to issues related to parking infrastructure. Consequently, couriers have to move their vehicles around between different parking spaces to avoid parking penalties and issues, or get the vehicles closer, to comply with the time-sensitive delivery requirements of the next receiver.
The perspectives acquired in the interviews with the CEP service providers highlighted that although their delivery operations were optimised, it is operationally difficult to achieve a highly loaded delivery vehicle. This could be linked to the dynamic nature of their delivery trips and the significant number of stops. Furthermore, it is important to incorporate the different types of contractual agreements between the freight carrier and the courier when attempting to address last mile delivery issues, as sometimes there might be a conflict of interest between the delivery company and the franchisee or driver-owner. Some previous freight solutions incorrectly approached these express deliveries from the freight traffic perspective by attempting to optimise the delivery routes for the vans before leaving the facilities. However, they overlooked the freight demand aspect in terms of delivery requirements and availability of receivers, as well as the unpredictable nature of parking infrastructure. For instance, some vehicle routing problem (VRP) studies attempt to optimise the routing and scheduling of the deliveries without paying attention to the vehicle ownership structure and the human decision-making and preferences of the drivers, which might lead to unfavourable results. The disruptive characteristic of deliveries could be statistically modelled and optimised. However, a more effective approach would focus on improving the design of parking spaces, reduction of traffic congestion and sensing when a parking space is available.
The survey responses confirmed that freight carriers perform a large number of stops using unoptimised delivery vans to inner-city retailers and businesses. Many freight carriers complained that these multiple stops were near to neighbouring receivers. The majority of the distribution centres and warehouses of freight carriers and shippers were clustered in freight-intensive industrial precincts in suburban parts of the city as a result of logistics sprawl trends. Hence, delivery vehicles of different freight carriers often travel over longer transport distances to distribute similar products from these suburban facilities to neighbouring businesses in the inner city. The high number of delivery stops not only affects the operations and cost of the freight carriers, but also takes a physical toll on the well-being of couriers. The last leg of delivery to inner-city business receivers is different from the more optimised delivery trips to business receivers in other parts of the metropolitan area, which are commonly performed using trucks and fewer number of delivery stops.
Concerning the characteristics of the delivery trips in the inner city, the survey responses indicated somewhat different figures compared with similar studies performed in Europe and the USA. For instance, the drivers decided the delivery route and sequence of stops more frequently in this study (53% of responses) as compared to the Turin-based study, which indicated that 36% of deliveries were planned by drivers [34]. The high dependence on the driver to decide the order of the stops and customers in the delivery route could be problematic. Human factors and personal experiences of the drivers could adversely impact the efficiency of the route and sequence selection. It does not take advantage of real-time traffic status and updates, which might result in additional travelled distance and bias in order of customers. However, it could be argued that some carriers might be reluctant to apply automated routing systems and may view them as more of real-time traffic updates since they do not solve the parking issue. Hence, the routing and scheduling software could be more useful and employed if parking availability is incorporated in its decision-making capabilities. Moreover, the routing software could enhance the efficiency of the couriers if it could provide knowledge of the location for the receiver in a building and use this information in the route scheduling. The considerable rating assigned to receivers’ availability and accessibility further suggests the importance of considering accessibility to receivers in freight solutions and measures.
Further, given the high number of stops for express parcel deliveries, the inference is that most couriers perform single delivery service to receivers in high-rise towers. This is also the case for a Seattle-based study, which found that 72% of couriers performed a single delivery to a high-rise building in the downtown area [49]. Likewise, the average number of stops for a delivery van in the London-based study (37 stops) [20] was much lower than the average number reported in this study (about 55–65). While the number of delivery stops is highly dependent on the operational practices of freight carriers and delivery requirements of receivers, as indicated earlier, other urban factors such as the clustering of receivers, the layout of the city centre and freight land-use regulations could also affect delivery practices. One possibility is that couriers perform a larger number of delivery stops in Melbourne’s CBD than in the London-based study because of the lower drop density. This is also suggested by the shorter walking distances for couriers in Melbourne’s CBD (less than 60 metres), as reported by [38], when compared to the reported distance of 105 metres per customer stop in the London-based study. However, both studies estimated that a van can deliver about 100 parcels on average to inner-city receivers. Additionally, the estimated number of parcels per delivery stop (4–7) reported in this study is similar to the average delivery size to shops and retailers (5 parcels) in Parma [26], whereas it is much higher than the average delivery size (about two parcels per stop) in the London-based study [20].

5.2. Policy Implications for Local Authorities and the Urban Freight Industry

The findings of this study could be valuable to urban planners for improving the loading infrastructure to perform freight deliveries to business receivers in the inner city. The derived knowledge for the last leg of delivery presented in this study offers direct insights for policymakers and transport researchers about the actual delivery practices and activities of freight carriers to retailers and businesses in the inner city. The study findings could be more suitable and transferrable for large metropolitan areas with thriving city centres that include a large mix of pedestrian areas and on-street shopping precincts of retailers and businesses. With increasing in-fill redevelopments for residential and commercial projects in inner-city areas, demand for express parcel deliveries is expected to considerably increase as more business and residential receivers locate in these new properties. The increases in delivery activities will result in additional pressure on local roads and parking infrastructure.
Hence, urban planners should take a proactive approach to incorporate the knowledge on the characteristics of delivery trips and operational challenges in the local transport planning of the inner-city area for an improved integration of last mile delivery and land-use planning. For example, local authorities might argue that there are enough on-street loading spaces for freight vehicles in the city centre. A key criticism expressed by the transport managers was that local authorities mistakenly assumed that couriers could easily access and use off-street loading docks of commercial towers and shopping centres, and thus on-street loading spaces were not highly necessary for their loading activities. This incorrect assumption could lead to some local councils even pushing further to convert these spaces into paid parking spaces for private vehicles. As some express couriers assign designated freight vehicles for each delivery zone or block in the city centre, it is reasonable to expect that the number of stops for these couriers would be lower as they have fixed receivers in a smaller geographical area. However, the findings highlight that the high number of delivery stops for these couriers might also be highly influenced by the inefficient loading infrastructure in the city centre. Additionally, the findings and insights presented in this study substantiate the concerns and complaints that are usually expressed by the freight industry about the ineffectiveness of loading and parking infrastructure in inner-city areas. The insights might help local authorities to better deal with these concerns and become more proactive to alleviate these challenges rather than attempting to ignore or deny them.
Thus, an argument exists that the on-street loading infrastructure is undermanaged regardless of the allocated number of spaces. Local authorities should consider required measures and supporting regulations that contribute to optimising the use of loading spaces in areas where business receivers cluster to minimise the walking distance for couriers. Local authorities could assess the benefits of converting on-street loading spaces in busy delivery zones to serve as temporary loading and staging zones for couriers to perform multiple deliveries with an extended parking time. Additionally, a recommendation for local authorities is to utilise recent advancements in Internet of Things (IoT) technologies, license plate recognition, adaptive displays and mobile applications to enable booking of on-street loading spaces for freight vehicles. Local authorities need to realise that the offering of this solution is more than just putting into place new technologies on local roads. Thus, local authorities should work closely with providers of these technologies, freight carriers and transport researchers to design necessary regulations and best practices to efficiently deploy and manage these advanced solutions for an improved and effective on-street loading infrastructure for freight vehicles. Moreover, Bányai highlights that the advancement in Industry 4.0 technologies offers real-time and hyperconnected delivery modes that facilitate a more energy-efficient and integrated last mile delivery [50]. Policymakers could further encourage and help couriers lower the number of delivery stops by ensuring available parking space via the booking scheme for the freight vehicle ahead of arriving in the city centre, and even allowing for longer parking time for couriers that will deliver to a large number of neighbouring business receivers. Further, local authorities could incorporate incentives in the booking scheme for freight carriers that utilise eco-friendly vehicles with verification through vehicle registration.
Due to the increasing level of parcel deliveries to commercial and residential receivers in high-rise towers in the city centre, policymakers should put into place suitable solutions and regulations to optimise the access and use of the off-street loading docks by freight vehicles. Couriers experience difficulty accessing and using off-street loading docks. Property developers could argue that they have done their role and include these docks in their building, while local authorities could view this from a distance and suggest that couriers could easily access and use these facilities with no problems. However, the findings suggest that one of the key operational issues for carriers is finding available parking, and this problem is further exacerbated when getting access to high-rise towers. It is time for city planners to take the initiative to reduce the potential underutilisation of these off-street loading docks in future commercial buildings and turn them into more accessible and efficient loading and parking spaces for couriers to deliver to the various business receivers in the city centre. Just as city planners might introduce certain requirements in the architectural design of commercial towers, by building codes to promote community spaces and amenities, freight land-use should also be considered to increase parking spaces for freight vehicles. Additionally, urban planners could integrate freight generation estimates and sustainable freight land-use regulations in the planning and building permit process of future building approvals. Consequently, a centralised off-street loading dock that is operationally effective and accessible could be established to service couriers delivering to adjacent high-rise commercial towers, rather than an individual loading dock for each building, which might be inaccessible.

6. Conclusions

Ensuring efficient deliveries to business receivers in the inner city has never been more critical and challenging, due to time-sensitive delivery expectations, higher distribution costs and ineffective parking infrastructure. Hence, the efficiency and transport costs of freight carriers in the dense inner-city area remain a challenge as compared to other, less dense areas. Accordingly, the analysis of operational parameters acquired in this study from the freight carriers underlines that the delivery trips to perform the last leg of delivery inside the inner city are characterised by a higher use of delivery vans (65% of the delivery fleet), a higher number of delivery stops per vehicle (more than 50 daily stops) and a lower vehicle fill rate (about 50% fully loaded).
Increasing operational and parking limitations will further restrict the utilisation of freight trucks in congested inner-city areas and force carriers to depend on unoptimised delivery vans. The increasing demand for express deliveries to business receivers, due to just-in-time fulfillment strategies and omnichannel retailing, will place additional pressure on freight carriers to comply with the time-sensitive delivery requirements. Additionally, the longer transport distance that freight vehicles have to travel due to logistics sprawl, coupled with the limited availability of parking spaces in the inner city, further contributes to increasing the number of delivery stops to ensure an efficient and quick delivery turnaround between the distribution centres and the stores. Local authorities need to understand that the ineffective regulations and lack of availability of on-street loading infrastructure adversely impact the efficiency of the last leg of delivery in inner-city areas. Unlike home deliveries, which can be delivered to alternative locations such as parcel lockers, businesses require deliveries directly to their premises, and on-street loading spaces represent the only accessible parking options for freight vehicles.
Acquiring and applying relevant operational characteristics from the freight industry could play an important role in the efficacy and likely acceptance of freight solutions. Local authorities in conjunction with carriers could propose appropriate solutions and supporting regulations to alleviate last mile delivery issues within the inner-city area. Freight carriers could utilise the knowledge presented on delivery trips to hold stakeholder meetings with policymakers to discuss the negative implications and challenges to the efficiency of their operations. Private companies must survive; therefore, business viability will always dominate operational practices. Thinking beyond survival and considering societal criteria can reduce costs and facilitate business operations, public relations and government interactions. However, it is not practical to expect profit-oriented freight carriers to always optimise their delivery operations and utilise eco-friendly vehicles without offering them the necessary parking infrastructure. It is essential for local authorities to understand that on-street loading spaces are integral for daily operations of freight carriers in the city centre. Although logistics operations bring neighbourhood challenges, commerce stops without efficient and cost-effective distribution activities.
There are certain limitations with the freight carriers survey. One of these is the low number of total responses, as the relatively low response rate indicates there might be other groups of freight carriers excluded from the analysis. However, the difficulty of reaching a larger number of transport managers of freight carriers that specifically service inner-city goods receivers could be expected due to the extremely busy and challenging business environment for the freight industry. Another issue of the freight carrier survey is that the focus was on the delivery trips for the entire fleet, which did not allow us to collect a detailed, individualised vehicle trip log for each route inside the inner-city involving a particular freight carrier.
Hence, there are a few future research directions that could be recommended with respect to the last leg of delivery. A potential study could apply the GPS survey technique using smart sensors to complement this study and to collect actual vehicle trip diaries, including vehicle routes and dwell times from selected freight carriers in the city centre. With recent technological advancements in autonomous delivery vehicles, the internet of things, blockchain and warehousing robotics, a future study could attempt to set up a physical internet-enabled freight consolidation facility inside a suitable loading dock to perform express parcel deliveries to business receivers in high-rise towers. The majority of parcel deliveries to these receivers are express and light mail documents. Consequently, similar types of parcels could facilitate an automated, seamless and cost-effective transfer, handling and distribution of standardised parcels in consolidated shipment from freight carriers to the business receivers in these towers. However, it is necessary to examine the required regulations and suitability of the autonomous freight delivery robots to deliver the consolidated shipment, especially in congested parts of the inner city.

Author Contributions

Conceptualization, K.A.; Methodology, K.A.; Data Curation, K.A.; Project Administration, R.G.T.; Investigation, K.A.; Formal Analysis, K.A.; Writing—original draft, K.A.; Writing—review and editing, K.A. and R.G.T.; Supervision, R.G.T. All authors have read and agreed to the published version of the manuscript.

Funding

This research received no external funding.

Acknowledgments

The primary author (K.A.) would like to extend his gratitude to the University of Jeddah, Saudi Arabia, for the financial support of his PhD research scholarship, part of which was dedicated to the research presented herein. The authors express their gratitude to the Volvo REF Center of Excellence for Sustainable Urban Freight Systems (CoE-SUFS), at the University of Melbourne, for their financial support to cover the article processing charge to publish this article.

Conflicts of Interest

The authors declare no conflict of interest.

References

  1. Lehrer, U.; Keil, R.; Kipfer, S. Reurbanization in Toronto: Condominium boom and social housing revitalization. disP Plan. Rev. 2010, 46, 81–90. [Google Scholar] [CrossRef]
  2. Williams, P. Class constitution through spatial reconstruction? A re-evaluation of gentrification in Australia, Britain, and the United States. In Gentrification of the City; Smith, N., Williams, P., Eds.; Routledge: Oxfordshire, UK, 2013; pp. 72–93. [Google Scholar]
  3. Verlinde, S.; Kin, B.; Strale, M.; Macharis, C. Sustainable freight deliveries in the pedestrian zone: Facilitating the necessity. Portfolio 2016, 1, 97–109. [Google Scholar]
  4. Aljohani, K.; Thompson, R. Receivers-led delivery consolidation policy: Estimating the characteristics of the most interested businesses to participate. Res. Transp. Econ. 2019, 100808. [Google Scholar] [CrossRef]
  5. Aljohani, K.; Thompson, R. Impacts of logistics sprawl on the urban environment and logistics: Taxonomy and review of literature. J. Transp. Geogr. 2016, 57, 255–263. [Google Scholar] [CrossRef]
  6. Allen, J.; Bektaş, T.; Cherrett, T.; Bates, O.; Friday, A.; McLeod, F.; Piecyk, M.; Piotrowska, M.; Nguyen, T.; Wise, S. The Scope for Pavement Porters: Addressing the Challenges of Last-Mile Parcel Delivery in London. Transp. Res. Rec. J. Transp. Res. Board 2018, 2672, 184–193. [Google Scholar] [CrossRef] [Green Version]
  7. Ducret, R. Parcel deliveries and urban logistics: Changes and challenges in the courier express and parcel sector in Europe—The French case. Res. Transp. Bus. Manag. 2014, 11, 15–22. [Google Scholar] [CrossRef]
  8. Rai, H.B.; Verlinde, S.; Macharis, C. The “next day, free delivery” myth unravelled Possibilities for sustainable last mile transport in an omnichannel environment. Int. J. Retail Distrib. Manag. 2019, 47, 39–54. [Google Scholar]
  9. Juhász, J.; Bányai, T. Last mile logistics: An integrated view. IOP Conf. Ser. Mater. Sci. Eng. 2018, 448, 012026. [Google Scholar] [CrossRef]
  10. Kin, B.; Ambra, T.; Verlinde, S.; Macharis, C. Tackling Fragmented Last Mile Deliveries to Nanostores by Utilizing Spare Transportation Capacity—A Simulation Study. Sustainability 2018, 10, 653. [Google Scholar] [CrossRef] [Green Version]
  11. Fransoo, J.C.; Zhao, L.; Martinelli, J.L. Omnichannel and Traditional Retail: Platforms to Seamlessly Connect Retail, Service, and Delivery. In Operations in an Omnichannel World; Gallino, S., Moreno-Garcia, A., Eds.; Springer International Publishing: Cham, Switzerland, 2019; pp. 341–353. [Google Scholar]
  12. Hounwanou, S.; Gonzalez-Feliu, J.; Comi, A.; Gondran, N. Inner city versus urban-periphery retailing: Retail-store movement and shopping trip behaviours. Indications from Saint-Etienne. 2018 EURO Mini Conference on Advances in Freight Transportation and Logistics, Padoue, Italy, 2018. Elsevier Transp. Res. Procedia 2018, 30, 363–372. [Google Scholar] [CrossRef]
  13. Butrina, P.; Giron-Valderrama, G.D.C.; MachadoLeón, J.L.; Goodchild, A.; Ayyalasomayajula, P.C. From the Last Mile to the Last 800 Feet: Key Factors in Urban Pick-up and Delivery of Goods. Transp. Res. Rec. J. Transp. Res. Board 2017, 2609, 85–92. [Google Scholar] [CrossRef]
  14. Olsson, J.; Hellström, D.; Pålsson, H. Framework of Last Mile Logistics Research: A Systematic Review of the Literature. Sustainability 2019, 11, 7131. [Google Scholar] [CrossRef] [Green Version]
  15. Combes, F. A theoretical analysis of the cost structure of urban logistics. In Proceedings of the 6th International Conference in Informations Systems, Logistics and Supply Chain, Bordeaux, France, 1–4 June 2016. [Google Scholar]
  16. Aljohani, K.; Thompson, R. A Stakeholder-Based Evaluation of the Most Suitable and Sustainable Delivery Fleet for Freight Consolidation Policies in the Inner-City Area. Sustainability 2018, 11, 124. [Google Scholar] [CrossRef] [Green Version]
  17. Dablanc, L.; Rodrigue, J.P. City logistics: Towards a global typology. In Proceedings of the Transport Research Arena, Paris, France, 14–17 April 2014. [Google Scholar]
  18. Park, H.; Park, D.; Jeong, I.-J. An effects analysis of logistics collaboration in last-mile networks for CEP delivery services. Transp. Policy 2016, 50, 115–125. [Google Scholar] [CrossRef]
  19. Behrends, S. Recent developments in urban logistics research—A review of the proceedings of the international conference on city logistics 2009–2013. Transp. Res. Procedia 2016, 12, 278–287. [Google Scholar] [CrossRef] [Green Version]
  20. Allen, J.; Piecyk, M.; Piotrowska, M.; McLeod, F.; Cherrett, T.; Ghali, K.; Nguyen, T.; Bektaş, T.; Bates, O.; Friday, A.; et al. Understanding the impact of e-commerce on last-mile light goods vehicle activity in urban areas: The case of London. Transp. Res. Part D Transp. Environ. 2018, 61, 325–338. [Google Scholar] [CrossRef] [Green Version]
  21. Scherr, Y.; Saavedra, B.A.N.; Hewitt, M.; Mattfeld, D. Service network design with mixed autonomous fleets. Transp. Res. Part E Logist. Transp. Rev. 2019, 124, 40–55. [Google Scholar] [CrossRef]
  22. Suksri, J.; Raicu, R. Developing a Conceptual Framework for the Evaluation of Urban Freight Distribution Initiatives. Procedia Soc. Behav. Sci. 2012, 39, 321–332. [Google Scholar] [CrossRef] [Green Version]
  23. Danielis, R.; Rotaris, L.; Marcucci, E. Urban freight policies and distribution channels. Eur. Transp. 2010, 46, 114–146. [Google Scholar]
  24. Eidhammer, O.; Johansen, B.G.; Andersen, J. Comparing Deliveries to On-street Consignees and Consignees Located at Shopping Centers. Transp. Res. Procedia 2016, 14, 1221–1229. [Google Scholar] [CrossRef] [Green Version]
  25. Kijewska, K.; Iwan, S.; Konicki, W.; Kijewski, D. Assessment of freight transport flows in the city centre based on the Szczecin example—Methodological approach and results. Res. Transp. Bus. Manag. 2017, 24, 59–72. [Google Scholar] [CrossRef]
  26. Tozzi, M.; Corazza, M.V.; Musso, A. Recurring Patterns of Commercial Vehicles Movements in Urban Areas: The Parma Case Study. Procedia Soc. Behav. Sci. 2013, 87, 306–320. [Google Scholar] [CrossRef] [Green Version]
  27. Thompson, R.; Flores, G. Understanding Deliveries to Towers in Melbourne. Transp. Res. Procedia 2016, 16, 510–516. [Google Scholar] [CrossRef] [Green Version]
  28. Jaller, M.; Wang, X.; Holguín-Veras, J. Large urban freight traffic generators: Opportunities for city logistics initiatives. J. Transp. Land Use 2015, 8, 51. [Google Scholar] [CrossRef] [Green Version]
  29. Casey, N.; Rao, D.; Thompson, R.G. Understanding Last Mile Freight Delivery in Melbourne’s Central Business District. Procedia-Soc. Behav. Sci. 2014, 125, 326–333. [Google Scholar] [CrossRef] [Green Version]
  30. Litman, T. London Congestion Pricing: Implications for Other Cities; Victoria Transport Policy Institute: Victroia, BC, Canada, 2012. [Google Scholar]
  31. Stokoe, M. Space for Freight–Managing capacity for freight in Sydney–a CBD undergoing transformation. Transp. Res. Procedia 2019, 39, 488–501. [Google Scholar] [CrossRef]
  32. Zou, W.; Wang, X.; Conway, A.; Chen, Q. Empirical Analysis of Delivery Vehicle On-Street Parking Pattern in Manhattan Area. J. Urban Plan. Dev. 2016, 142, 04015017. [Google Scholar] [CrossRef]
  33. Holguín-Veras, J.; Lawson, C.; Wang, C.; Jaller, M.; González-Calderón, C.; Campbell, S.; Kalahashti, L.; Wojtowicz, J.; Ramirez, D.; National Cooperative Freight Research Program; et al. Using Commodity Flow Survey Microdata and Other Establishment Data to Estimate the Generation of Freight, Freight Trips, and Service Trips: Guidebook; Transport Research Board: Washington, DC, USA, 2016. [Google Scholar]
  34. Pronello, C.; Camusso, C.; Valentina, R. Last mile freight distribution and transport operators’ needs: Which targets and challenges? Transp. Res. Procedia 2017, 25, 888–899. [Google Scholar] [CrossRef] [Green Version]
  35. VicRoads. Truck Gen Mass and Dimension Limits; Department of Transport, State Government of Victoria: Melbourne, Australia, 2016. [Google Scholar]
  36. Muñuzuri, J.; Cortés, P.; Grosso, R.; Guadix, J. Selecting the location of minihubs for freight delivery in congested downtown areas. J. Comput. Sci. 2012, 3, 228–237. [Google Scholar] [CrossRef]
  37. Verlinde, S.; Macharis, C.; Milan, L.; Kin, B. Does a Mobile Depot Make Urban Deliveries Faster, More Sustainable and More Economically Viable: Results of a Pilot Test in Brussels. Transp. Res. Procedia 2014, 4, 361–373. [Google Scholar] [CrossRef] [Green Version]
  38. Aljohani, K.; Thompson, R.G. Optimizing the Establishment of a Central City Transshipment Facility to Ameliorate Last-Mile Delivery: A Case Study in Melbourne CBD. In City Logistics 3; Wiley: Hoboken, NJ, USA, 2018; pp. 23–46. ISBN 9781119425472. [Google Scholar]
  39. Broaddus, A.; Browne, M.; Allen, J. Sustainable Freight: Impacts of the London Congestion Charge and Low Emissions Zones. Transp. Res. Rec. J. Transp. Res. Board 2015, 2478, 1–11. [Google Scholar] [CrossRef]
  40. Holguín-Veras, J.; Amaya-Leal, J.; Wojtowicz, J.; Jaller, M.; González-Calderón, C.; Sanchez-Díaz, I.; Wang, X.; Haake, D.G.; Rhodes, S.S.; Frazier, R.J.; et al. Improving Freight System Performance in Metropolitan Areas: A Planning Guide; Transport Research Board: Washington, DC, USA, 2015. [Google Scholar]
  41. Bates, O.; Wise, S.; Davies, N.; Friday, A.; Allen, J.; Cherrett, T.; McLeod, F.; Bektaş, T.; Nguyen, T.; Piecyk, M.; et al. Transforming Last-mile Logistics. In Proceedings of the 2018 CHI Conference on Human Factors in Computing Systems—CHI ’18, Montreal, QC, Canada, 21–26 April 2018; Association for Computing Machinery (ACM): New York, NY, USA, 2018; p. 526. [Google Scholar]
  42. Thompson, R.G.; Zhang, L. Optimising courier routes in inner-city areas. Transp. Res. Part C Emerg. Technol. 2018, 93, 1–12. [Google Scholar] [CrossRef]
  43. UW Supply Chain Transportation & Logistics Center. The Final 50 Feet Urban Goods Delivery System—Research Scan and Data Collection Project, Report Submitted to Seattle Department of Transportation. 2018. Available online: https://depts.washington.edu/sctlctr/sites/default/files/SCTL_Final_50_full_report.pdf (accessed on 15 May 2018).
  44. Holguín-Veras, J.; Jaller, M. Comprehensive Freight Demand Data Collection Framework for Large Urban Areas. In Biotechnology Business—Concept to Delivery; Saxena, A., Ed.; Springer: Cham, Switzerland, 2013; pp. 91–112. [Google Scholar]
  45. Allen, J.; Browne, M.; Cherrett, T. Survey Techniques in Urban Freight Transport Studies. Transp. Rev. 2012, 32, 287–311. [Google Scholar] [CrossRef]
  46. Richardson, A.J.; Ampt, E.S.; Meyburg, A.H. Survey Methods for Transport Planning; Eucalyptus Press: Parkville, Australia, 1995. [Google Scholar]
  47. Leedy, P.D.; Ormrod, J.E. Practical Research: Planning and Design, 8th ed.; Pearson Prentice-Hall: Upper Saddle River, NJ, USA, 2005. [Google Scholar]
  48. Washington, S.P.; Karlaftis, M.G.; Mannering, F. Statistical and Econometric Methods for Transportation Data Analysis; CRC Press: Boca Raton, FL, USA, 2010. [Google Scholar]
  49. Kim, H.; Boyle, L.N.; Goodchild, A. Delivery Process for an Office Building in the Seattle Central Business District. Transp. Res. Rec. J. Transp. Res. Board 2018, 2672, 173–183. [Google Scholar] [CrossRef] [Green Version]
  50. Bányai, T. Real-Time Decision Making in First Mile and Last Mile Logistics: How Smart Scheduling Affects Energy Efficiency of Hyperconnected Supply Chain Solutions. Energies 2018, 11, 1833. [Google Scholar] [CrossRef] [Green Version]
Figure 1. Illustration of the Main Classes of Freight Vehicles Used in Last Mile Delivery (Data acquired from the freight industry via Own research; VicRoads [35]).
Sustainability 12 02837 g001
Figure 2. Planning and Collection Process for Primary Data Collection Techniques.
Sustainability 12 02837 g002
Figure 3. Distribution of the Operated Delivery Fleet Configurations to Perform Freight Deliveries in inner Melbourne (LCV: Light commercial vehicle; LT: Light truck; MT: Heavy truck).
Sustainability 12 02837 g003
Figure 4. The Attributes of the Delivery Trips for Each Vehicle Class to Perform the Last Leg of Delivery to Business Receivers.
Sustainability 12 02837 g004
Figure 5. Rating of the Operational Challenges and Issues Based on Their Influence on The Efficiency of Freight Carriers in the Inner-city Area.
Sustainability 12 02837 g005
Table 1. Results of Kruskal–Wallis H tests for Vehicle Type vs. Delivery Trip.
VariablesVehicle Type vs. Fill RateVehicle Type vs. Number of DropsVehicle Type vs. Number of Parcels/Stop
Hscore15.2819.639.13
df222
P<0.01<0.010.017
χ210.59710.5977.824
Table 2. Results of Kruskal–Wallis H tests for Vehicle Type vs. Operational Issues.
VariablesVehicle Type vs. Finding ParkingVehicle Type vs. Access to High-Rise BuildingVehicle Type vs. Street Design
Hscore11.0313.5940.25
df222
P0.0070.037<0.001
χ29.2105.99113.816

