Article

Intelligent Predictive Analytics for Sustainable Business Investment in Renewable Energy Sources

by
Theodoros Anagnostopoulos
1,2,*,
Grigorios L. Kyriakopoulos
3,
Stamatios Ntanos
1,*,
Eleni Gkika
1 and
Sofia Asonitou
1
1
Department of Business Administration, University of West Attica, 12241 Athens, Greece
2
Department of Infocommunication Technologies, ITMO University, St. Petersburg 197101, Russia
3
Electric Power Division, Photometry Laboratory, School of Electrical and Computer Engineering, National Technical University of Athens, 15780 Athens, Greece
*
Authors to whom correspondence should be addressed.
Sustainability 2020, 12(7), 2817; https://doi.org/10.3390/su12072817
Submission received: 8 March 2020 / Revised: 26 March 2020 / Accepted: 31 March 2020 / Published: 2 April 2020

Abstract

:
Willingness to invest in renewable energy sources (RES) is predictable under data mining classification methods. Data was collected from the area of Evia in Greece via a questionnaire survey by using a sample of 360 respondents. The questions focused on the respondents’ perceptions and offered benefits for wind energy, solar photovoltaics (PVs), small hydro parks and biomass investments. The classification algorithms of Bayesian Network classifier, Logistic Regression, Support Vector Machine (SVM), C4.5, k-Nearest Neighbors (k-NN) and Long Short Term Memory (LSTM) were used. The Bayesian Network classifier was the best method, with a prediction accuracy of 0.7942. The most important variables for the prediction of willingness to invest were the level of information, the level of acceptance and the contribution to sustainable development. Future studies should include data on state incentives and their impact on willingness to invest.

1. Introduction

1.1. Willingness to Invest in Renewable Energy Sources (RES) Infrastructure

A remarkable turn to renewable energy infrastructure is taking place, motivated by widespread public access to environmental information [1,2]. Ecological sensitivity has been the focus of environmental research in recent years. Green entrepreneurship has a crucial part in modern economic activity as it contributes to the added value of products while meeting the standards of environmentally conscious customers [3]. Moreover, environmental responsibility is gradually being integrated into the economic policy of both states and businesses [3].
The scientific focus on willingness to invest in large-scale infrastructure, such as in renewable energy sources (RES) works, aims at better understanding the underlying stakeholders’ attitudes and motives. Therefore, it is significant to investigate stakeholder behaviour and to explain their reasoning, regional decisions, perceptions on the importance of peripheral locations and their willingness to invest. It is proven that such analyses support central governments and the private sectors by assisting them to build up and to benefit from the operation of such large-scale infrastructure works [4]. In this respect, governmental policies should focus on environmental regulations and legislate towards the promotion of environmental activities and investments, such as large-scale RES infrastructure works, especially among emerging economies [5].
In this study, Contingent Valuation Method (CVM) was applied to estimate the price of an indirect commodity, such as the willingness to pay or the willingness to invest in RES. According to this approach, respondents were asked to express their opinion on specific closed-type questions [6].
The willingness of businesses to invest in RES is determined by a plethora of socio-environmental criteria, such as level of environmental information, degree of public acceptance and income [7,8]. Furthermore, there is an increased scientific interest in the association between energy production, carbon emissions and potential economic development [9]. A statistical analysis on economic growth, energy consumption and CO2 unveiled a significant positive connection between GDP and energy consumption, as well as between GDP and carbon emissions for the sectors of electricity production and transportation [10].
An important criterion involved in willingness to invest is associated with the economic dimension of such investments. By understanding the logic behind selecting an investment portfolio, it was signified that investment interest rises whenever individuals perceive a positive relationship between price and quality [11]. However, according to Oyewole et al., this argumentation could not be verified for emerging economies for Nigeria [5]. These authors examined the degree of willingness of property developers to invest in sustainable infrastructures in Nigeria and determined the level of property developers’ preparedness for green building development. The results denoted that less capital-intensive features, such as those associated with occupants’ comfort, were certainly attracting a higher level of willingness to invest than more capital-intensive solutions, such as environmental-improvements features [5].
In the relevant literature, other determinants of willingness to invest in private businesses are the a manufacturer’s reputation and the trust in a manufacturer’s credibility, whereas supplier dependence and trust in a manufacturer’s benevolence are not reported as significant, especially in the retail marketplace of the Asian economy [12,13].
Similarly, the main problems that impede cooperative investments are that of capital-based residual rights, mechanisms for transferability and for the appreciation of firm value. Therefore, incentives for stakeholders must enable them to participate in financing cooperative growth, being oriented to the critical aspects [14]. The most pronounced driver of financing cooperative growth remains the traditional cooperative capital, while the most noteworthy barrier of valuing investment alternatives is that investors could not yet be receptive to new transferable cooperative shares. Therefore, investors’ commitment erodes when a firm faces financial difficulties, as less member capital is available to save the firm from a cash crisis, compared to cases of investments’ improving competitiveness [15].
In the relevant literature, the environmental valuation of willingness to invest in alternative RES works is referred to as “sustainable finance” [16]. This entity has attracted the attention of investors in green companies worldwide. In this respect, consumers’ concern for environmental protection and the perceived consumer effectiveness are the main drivers to investors’ willingness to invest in the shares of environmentally friendly firms [16]. A better understanding of investors’ willingness to invest in environmentally friendly RES-based works can support central governments and NGOs in drawing those policies to encourage investment in sensitive businesses towards the needs of the environment [16].
Next to the environmental and socio-economic criteria, another crucial criterion that determines the willingness to invest in RES is the spatial allocation of renewables. In a joint valuation of willingness to invest in RES, existing limitations were noted, such as the remoteness of renewable sources, for investments in small hydro parks (SHP) [17]. In another RES, that of solar energy, photovoltaics (PV) systems are expected to play a determining role in the energy system, especially among private households [18,19].
Finally, the positive role of environmental information and education is critical in promoting the positive attitude towards RES investments. Evidently, the business and accounting students of today will be either the future decision-making executives on RES investments in the private or the public sector, or they will be among the future entrepreneurs and stakeholders regarding related investments [20]. Educating them on a range of knowledge and skills can motivate them towards valuing environmental protection. Students should be aware of their social and ethical responsibilities. The integration of multidisciplinary knowledge to solve problems will possibly lead them to better decision-making in favor of more RES investments [21,22]. Two typical cases in which willingness to invest in RES-based works is executively adapted to specific sectoral and spatial conditions are that of RES utility for biomass production [19,23] and electricity production [24,25], accordingly.

1.2. Inference Modeling Intelligence Analytics and Machine Learning

The applicability of learning machines and relevant types of algorithms has been developed to forecast and to comprise data preprocessing components for commercial services and applications [26]. The accuracy of forecasting systems, according to de O. Santos Junior et al. [27], can be challenging in real data because there are hidden interconnections between the variables [27]. The authors developed a data mining model that showed superior performance compared to literature-referred single and hybrid models [27]. In another study, it was shown that the training and reliability learning of several classical intelligent models gave more accurate results compared to more classic approaches [28]. Data mining can assist in the analysis of large databases by the use of intelligent methods to discover correlations and connections among the available variables. In data mining there are two methods: supervised and unsupervised learning. In the supervised methodology, the classes’ attributes are previously determined in the training data set. In the unsupervised methodology, class attributes are not used [29]. Classification in data mining includes algorithms like Bayesian Network classifier, Logistic Regression, Support Vector Machine (SVM), C4.5, k-Nearest Neighbors (k-NN) and Long Short Term Memory (LSTM) [29]. We used all the previous classifications algorithms for our analysis in order to predict the willingness to invest in RES.

2. Materials and Methods

2.1. Area of Study

The research area was the island of Evia in central Greece. Evia is the second biggest island in Greece, after Crete, and has a significant renewable-energy potential, especially wind and solar. According to the statistics of the Hellenic Wind Energy Association (HWEA), the installed wind capacity in Greece was 3576 MW at the end of 2019. Around 37% (1311 MW) of the installed wind capacity was found in central Greece while around one-third of the capacity of central Greece was installed in the area of our study [30].

2.2. Intelligent Predictive Analytics Inference Model

Machine learning classification algorithms were used as the core objects of an intelligent predictive inference model to perform data analytics. Such algorithms were divided into two major categories according to the predicted values of the examined model. The first category contained cases where the predicted value was numerical. In such cases, the machine learning process was called regression. In the opposite case, we had the category in which the predicted value was categorical. Then the machine learning process was called classification. In the classification category, there were two subcategories according to the categorical values. If the categorical variable takes only two class values, then we had the case of binary classification. In the opposite case, when we had more than two classes, it was called multiclass classification.
In this paper, we experimented with binary classification classifiers [31], where we assessed their efficiency to rank them and to propose which is best for the studied sustainable business investment problem towards renewable energy sources (RES).

2.3. Evaluation Method and Metrics

2.3.1. 10-Fold Cross Validation

We evaluated the examined models with the 10-fold cross validation evaluation method, which divided the initial dataset into 10 equally sized parts and then, in a certain loop, incorporated the first 9 parts to train the classifier and the remaining 1 to test the classifier. This process was repeated until all the parts were used for training and testing.

2.3.2. Prediction Accuracy

We assessed the effectiveness of the adopted classifiers by incorporating the prediction accuracy evaluation metric a [ 0 , 1 ] , which is defined in Equation (1):
a = t p + t n t p + f p + t n + f n ,
where tp are the instances that are classified correct as positives, and tn are the instances that are classified correct as negatives. In addition, fp, are the instances that are classified false are positives, and fn are the instances that are classified false as negatives. A low value of a means a weak classifier, while a high value of a indicates an efficient classifier.

2.3.3. Confusion Matrix

We also evaluated the adopted classification models with the confusion matrix evaluation metric. Confusion matrix is a special form of matrix, which in the case of binary classification has the following form, as described in Table 1:
Table 1. Confusion matrix.
Class 0Class 1 Classified as
ABclass 0 (invest in renewable energy sources (RES))
CDclass 1 (not invest in renewable energy sources (RES))
where the “A” quantity depicts the number of class 0 instances that were classified correct as instances of class 0; the “B” quantity depicts the number of class 0 instances that were falsely classified as instances of class 1; the “C” quantity depicts the number of class 1 instances that were classified falsely as class 0 instances; while the “D” quantity depicts the number of class 1 instances that were correctly classified as instances of class 1. A given classification model is considered effective if it maximizes “A” and “D” quantities, while concretely minimizing “B” and “C” quantities.

3. Results

3.1. Experimental Setup

We evaluated a given dataset, which was previously deployed by Ntanos et al. [32]. According to the methodology of Ntanos et al. [32], the appropriate sample size for the creation of this dataset was calculated to be 376 respondents selected by stratified random sampling with a 95% level of confidence. The stratification was done at the municipal level by using the list of registered voters per municipality for all 27 municipalities of the area of Evia. This method ensured that the sampling unit is a resident of the Prefecture of Evia and is over 18 years old. The Prefecture of Evia had 204,938 registered voters according to the parliamentary elections of 2015. The electoral lists were retrieved from the Ministry of Interior Affairs [33]. A questionnaire was used for data collection.
When the dataset was created, we used an open-source software known as HWEA [30] to examine which classifier to adopt for the prediction purpose in our case.

3.1.1. Experimental Setup Dataset Structure

We created the dataset by collecting variables concerning respondents’ perceptions on RES benefits. Our class attribute (dependent variable) was a binary variable (yes/no) concerning respondents’ willingness to invest in RES in the near future.
Specifically, in the research questionnaire there was a section that contained 14 questions for the the respondents to offer their opinion on separately for each of the examined RES, which were wind, solar photovoltaics (PV), hydroelectricity projects (SHP) and biomass. The facets of this section were based on relevant research concerning respondents’ perceptions on RES [34,35]. The set of attributes contained the respondent’s acceptance of the various RES (separately for solar, wind, PV and SHP), their level of information, their opinion towards the future development of RES and their opinion on various benefits that RES offer, such as environmental protection, contribution to sustainable development and life-quality upgrade. Each question was anchored at 1 = totally disagree and 7 = totally agree.
We applied an initial dataset of attributes to a feature extraction process for dimensionality reduction to treat the provided experimental data more efficiently. We concluded with the final dataset structure, which is presented in Table 2.
Out of the 360 respondents, the final dataset had 243 instances, where each instance depicted all the available information of a unique participant taking part in the survey. So we performed intelligent predictive analytics for the willingness to invest in RES with the data produced by 243 persons participating in the incorporated survey. In addition, each instance of the final dataset had 13 attributes, 12 of them were predictive attributes, while the last one was the class attribute. Since the class attribute (willingness to invest) took only two values (yes/no), we were using binary classification algorithms. The initial value was 179 out of 243 respondents that were willing to invest in RES soon. The 12 predictive attributes took categorical values in the range of {0,1,2,3,4,5,6,7}, each attribute was anchored at 1 = totally disagree and 7 = totally agree. The class attribute took the value of either 0 or 1, where 0 = the respondent was ready to invest in RES soon, and 1 = the respondent was not ready to invest in RES.

3.1.2. Adopted Classifiers

To define which classifiers to adopt in our study, we experimented with certain classification algorithms available in Weka [31]. Such classifiers are: (1) Logistic Regression, (2) SVM, (3) C4.5, (4) k-Nearest Neighbors (k-NN), (5) LSTM Deep Learning Recurrent Neural Network (LSTM), and (6) Bayesian Network classifier. We assessed the prediction accuracy of each selected classifier to rank them and to define the optimum one for our problem.

3.1.3. Experimental Setup Parameters

The experimented parameters of the final dataset included the adopted classifiers, the evaluation method, as well as the evaluation metrics incorporated to assess the proposed classification models. See Table 3.

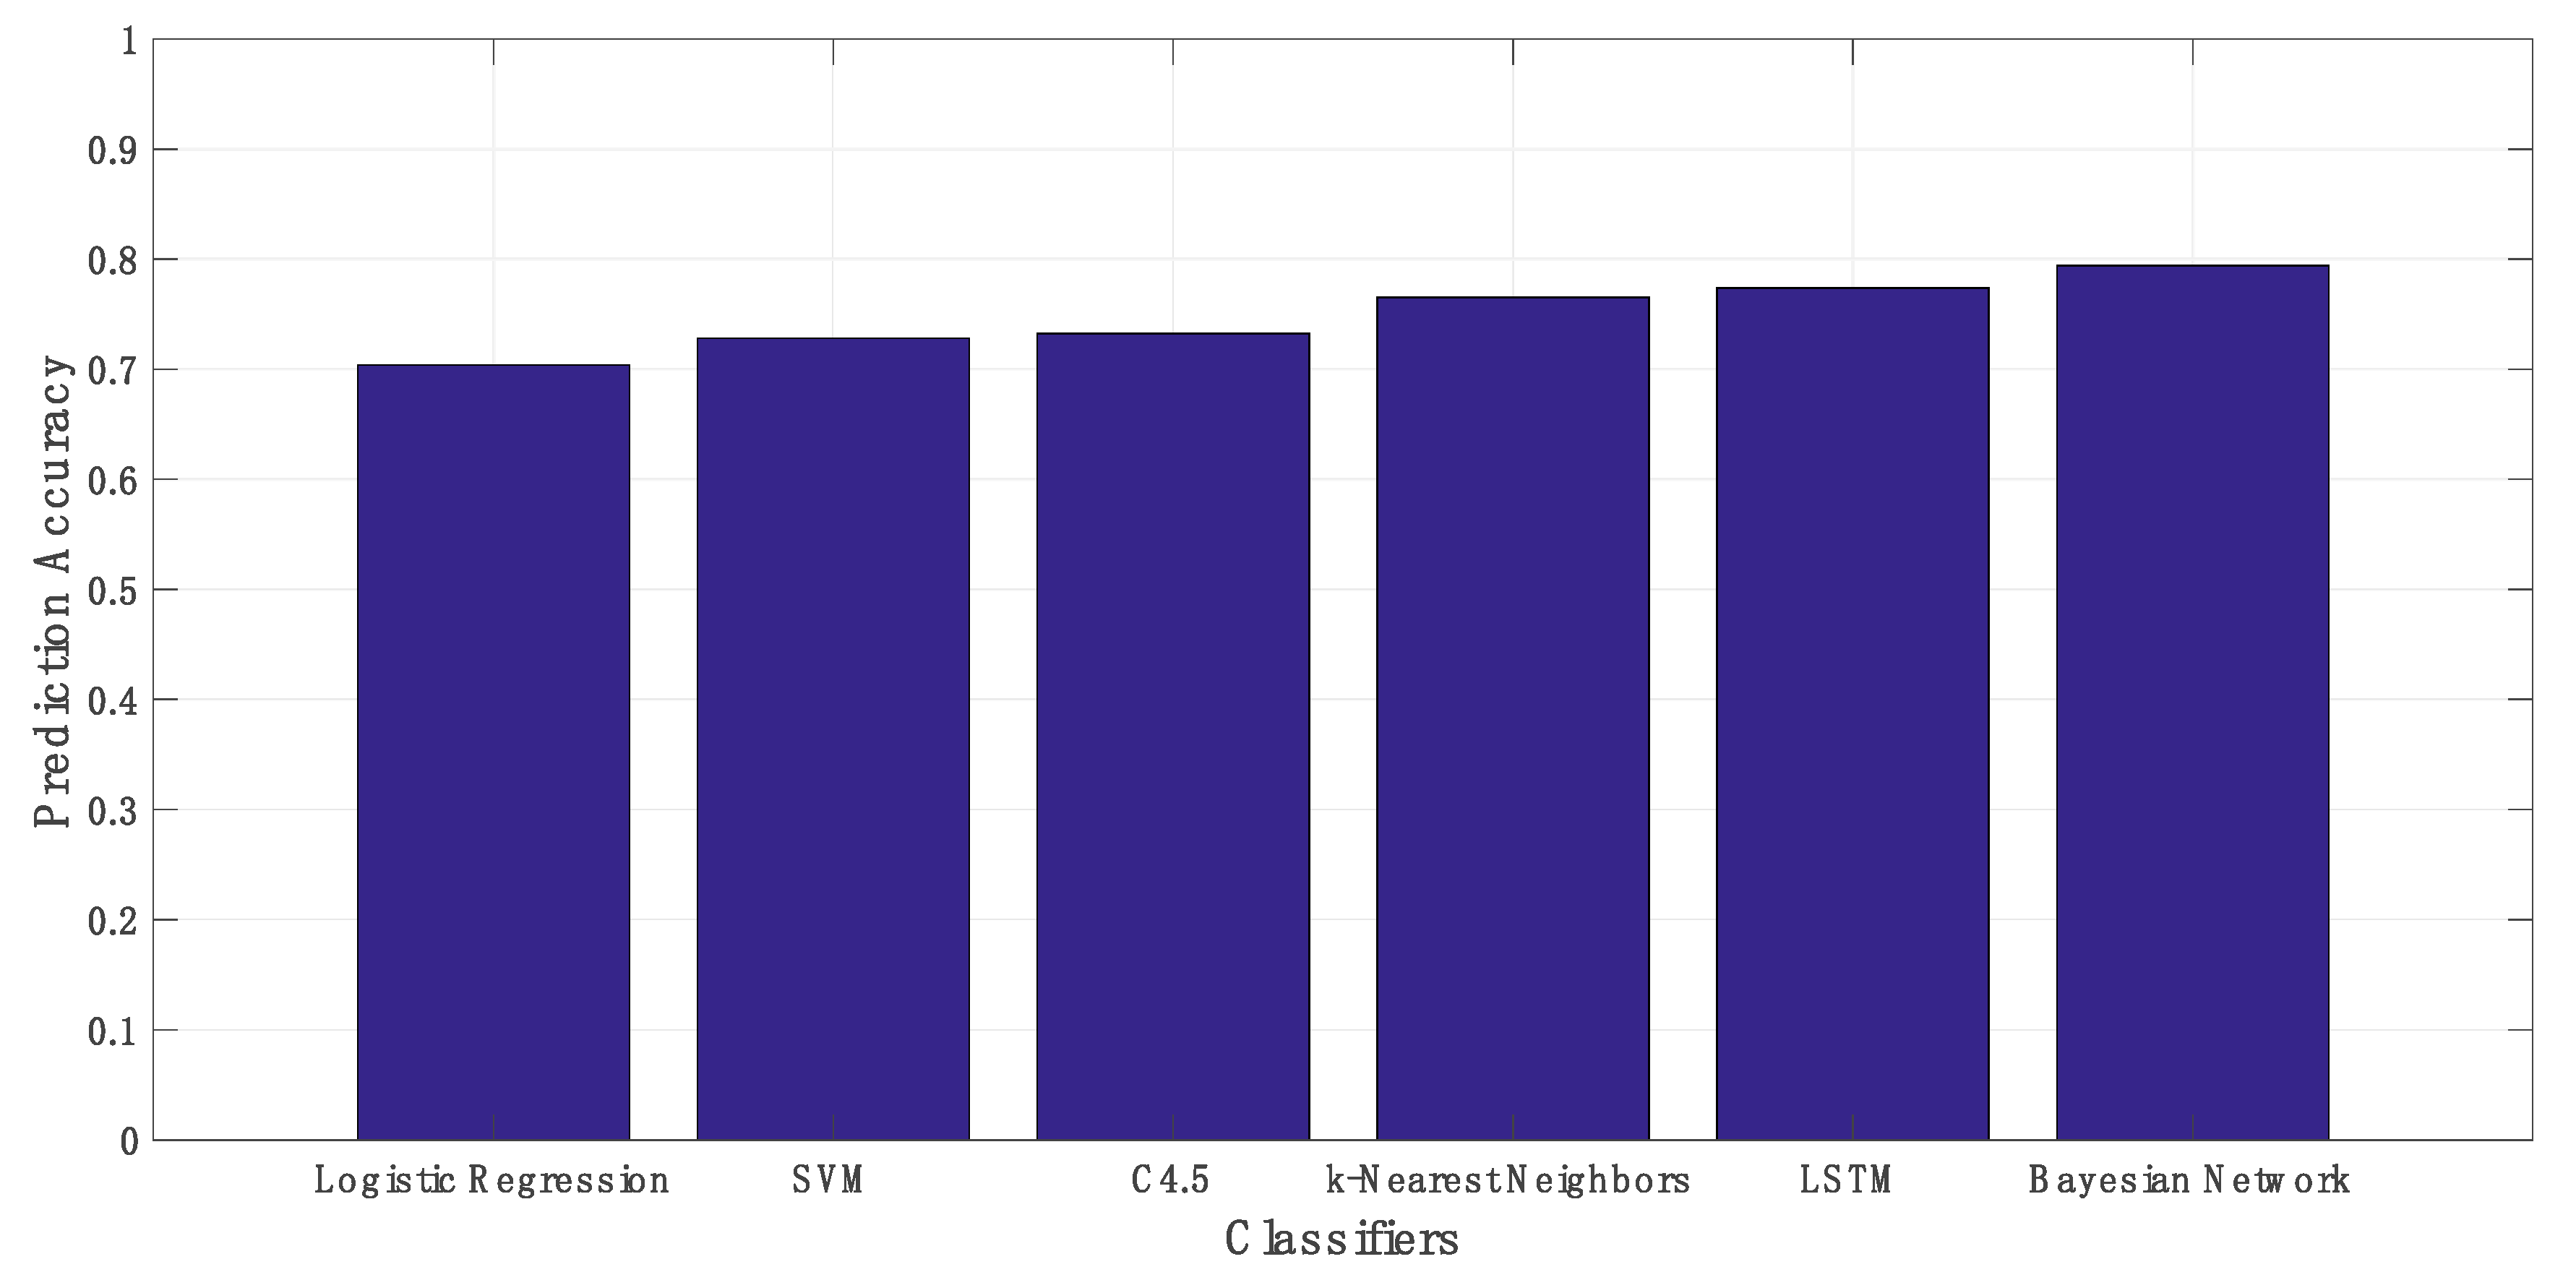
3.2. Experimented Classifiers Prediction Accuracy

In this section, we compared the accuracy of the classification algorithms that estimated the willingness to invest. We used 10-fold cross validation applied to the dataset. For the selected classifiers, we observed the following values of prediction accuracy: Logistic Regression classifier achieved a = 0.7037, SVM classifier achieved a = 0.7283, C4.5 classifier achieved a = 0.7325, k-NN achieved a = 0.7654, LSTM classifier achieved a = 0.7736, and Bayesian Network classifier achieved a = 0.7942. See Figure 1. We can observe that Bayesian Network classifier achieved the higher prediction. To adopt this classifier as the proposed classification model for our problem, we applied McNemar’s statistical significance test on the classification results of all the selected classifiers. McNemar’s test proved that all the selected classifiers had statistically significant prediction accuracy results. So, we adopted Bayesian Network classifier as our best prediction model.

3.3. Experimented Classifiers Confusion Matrix

To further assess the efficiency of the adopted Bayesian Network classification model, we exploited the confusion matrices of all the classifiers. As we can observe from Table 4, confusion matrix for the Bayesian Network classifier outperforms the prediction results of the other classifiers.

4. Discussion and Conclusions

In this work, we accessed the willingness to invest using several data-mining algorithms. The effectiveness of modeling accuracy was further reported in classification algorithm papers concerning the internet transfer reliability [36,37,38,39,40]. In another study, the valuation of business models of intelligent manufacturing with Internet of Things and machine learning was based on algorithmic performance and was tested by the criteria of minimal error, fitting accuracy, training time and internal memory usage [41].
Conclusively, the intelligent predictive analytics for sustainable business investments in RES cannot undermine the necessity of improving the social welfare of the energy production from renewable-oriented sources. Social welfare pursuing is driving the willingness to invest in initiatives that work towards urban environmental sustainability, especially in terms of upgrading life quality and contributing to energy indicators on environmental criteria [42,43,44].
In this study, we analyzed the binary variable RES investment intention by applying the classification algorithms of (1) Logistic Regression, (2) SVM, (3) C4.5, (4) k-Nearest Neighbors (k-NN), (5) LSTM Deep Learning Recurrent Neural Network (LSTM), and (6) Bayesian Network. Most of the respondents had a positive attitude towards green investments, since 179 out of the 243 gave a positive answer to their RES investment intention. Out of the initial set of 60 variables, we initially used Weka’s CfsSubsetEval process for dimensionality reduction. CfsSubsetEval is a feature extraction process, which evaluates the worth of a subset of attributes by considering the individual predictive ability of each feature along with the degree of redundancy between them [31]. By applying such a process to the initial set, we discovered that, according to our dataset, the significant variables for RES investment prediction are the level of information, especially for PVs, the future development potentials of PVs and SHPs, the life quality benefits offered by wind turbines and biomass and the contribution to sustainable development for PVs and SHP. Also, the social acceptance and the environmental contributions of all RES were found to be associated with a willingness to invest in RES soon. These results are compatible to the work of Ntanos et al. [24] where a model was developed to explore the desire for additional payment for renewable energy [24]. In previous work, it was found that information attainment, the degree of eco-consciousness and the perceived benefits of green investments are positively associated with accepting additional financial burden for the expansion of RES [24]. In the case of Greece, feasible national energy management from diversified renewables of local abundance is taking place [23,32,45].
As signified in our analysis, the motives behind RES investment include significant advantages such as environmental enhancement and protection, energy independence, improvement of life quality and contribution to the economic development. Those advantages seem to be associated with willingness to invest. Furthermore, the level of information was strongly associated with the intention to invest in RES. Willingness to invest (our class attribute) was initially recorded under a contingent valuation method (stated preference) [6]. In this paper, we conclude that the most accurate method to predict willingness to invest is the Bayesian Network classification, which gave us a classification accuracy of 0.7942. This method significantly improves upon the logistic regression methodology that gave as an accuracy of 0.7037. Since the logistic regression [20] and the ordinary least squares regression [17,46] approaches are still widely used in studies for estimation of willingness to pay or willingness to invest, we proposed the use of the Bayesian Network classification for improving prediction accuracy [47,48,49,50], though this finding has to be further validated.
It must be noted that the acceptance and deployment of various renewable energy systems are often hampered by the high cost of initial installation and the operating costs. Furthermore, regional stakeholders sometimes are against RES developments due to their perceived negative impacts. Such critical aspects are landscape intervention and noise, occupation of land and effects on the soil and ecosystem of the area. For this reason, many countries adopted incentive policies [51,52,53]. A limitation is that in our research work we did not measure the effect of such policies and their association with willingness to invest, since Greece is still under an economic crisis and incentive policies on renewables such as tax-free loans or tax discounts are currently halted.

Author Contributions

Conceptualization, S.N. and T.A.; methodology, T.A.; software, T.A.; validation, G.L.K. and S.A.; formal analysis, G.L.K. and S.N.; investigation, G.L.K. and S.N.; resources, S.N.; data curation, T.A.; writing—original draft preparation, E.G. and G.L.K.; writing—review and editing, E.G. and S.A.; supervision, S.A. All authors have read and agreed to the published version of the manuscript.

Funding

This research received no external funding.

Conflicts of Interest

The authors declare no conflicts of interest.

References

  1. Coburn, T.C.; Farhar, B. Public Reaction to Renewable Energy Sources and Systems. In Encyclopedia of Energy; Cleveland, C.J., Ed.; Elsevier: New York, NY, USA, 2004; pp. 207–222. [Google Scholar]
  2. Vasseur, V.; Kemp, R. The adoption of PV in the Netherlands: A statistical analysis of adoption factors. Renew. Sustain. Energy Rev. 2015, 41, 483–494. [Google Scholar] [CrossRef]
  3. Tsekouropoulos, G. Green Marketing and Entrepreneurship: The Strong Environmental Value for Sustainable Development. Book Econ. Gov. Sustain. Tour. New Media 2016, 378, 37–45. [Google Scholar]
  4. Wiradanti, B.; Pettit, S.; Potter, A.; Abouarghoub, W. Willingness to invest in peripheral ports: Perceptions of Indonesian port and maritime industry stakeholders. Marit. Econ. Logist. 2020, 1–16. [Google Scholar] [CrossRef]
  5. Oyewole, M.O.; Ojutalayo, A.A.; Araloyin, F.M. Developers’ willingness to invest in green features in Abuja, Nigeria. Smart Sustain. Built Environ. 2019, 8, 206–219. [Google Scholar] [CrossRef] [Green Version]
  6. Breffle, W.S.; Morey, E.R.; Lodder, T.S. Using Contingent Valuation to Estimate a Neighborhood’s Willingness to Pay to Preserve Undeveloped Urban Land. Urban Stud. 1998, 35, 715–727. [Google Scholar] [CrossRef]
  7. Ntanos, S.; Ntanos, A.; Salmon, I.; Ziatas, T. Public Awareness on Renewable Energy Sources: A Case Study for the Piraeus University of Applied Sciences. In Proceedings of the 5th International Symposium and 27th National Conference on Operational Research (EEEE2016), Athens, Greece, 9–11 June 2016; pp. 18–23, ISBN 978-618-80361-6-1. [Google Scholar]
  8. Kyriakopoulos, G.L.; Arabatzis, G. Electrical energy storage systems in electricity generation: Energy policies, innovative technologies, and regulatory regimes. Renew. Sustain. Energy Rev. 2016, 56, 1044–1067. [Google Scholar] [CrossRef]
  9. Chalikias, M.; Ntanos, S. Countries Clustering with Respect to Carbon Dioxide Emissions by Using the IEA Database. In Proceedings of the 7th International Conference on Information and Communication Technologies in Agriculture, Food and Environment, CEUR Workshop Proceedings, Kavala, Greece, 17–20 September 2015; Volume 1498, pp. 347–351. [Google Scholar]
  10. Ntanos, S.; Arabatzis, G.; Milioris, K.; Chalikias, M.; Lalou, P. Energy Consumption and CO2 Emissions on a Global Level. In Proceedings of the 4th International Conference in Quantitative and Qualitative Methodologies in the Economic and Administrative Sciences (I.C.Q.M.E.A.S. 2015), Technological Educational Institute (TEI) of Athens, Athens, Greece, 21–22 May 2015; pp. 251–260, ISBN 978-960-98739-6-3. [Google Scholar]
  11. Lavin, J.F.; Valle, M.A.; Magner, N.S. Heuristics in Mutual Fund Consumers’ Willingness-to-Invest: An Experimental Approach. J. Consum. Aff. 2019, 53, 1970–2002. [Google Scholar] [CrossRef]
  12. Moon, J.; Tikoo, S. Determinants of supplier willingness to invest in supporting a manufacturer’s line. J. Mark. Channels 2003, 11, 53–64. [Google Scholar] [CrossRef]
  13. Mulatu, D.W.; van Oel, P.R.; van der Veen, A. Firms’ willingness to invest in a water fund to improve water-related ecosystem services in the Lake Naivasha basin, Kenya. Water Int. 2015, 40, 463–482. [Google Scholar] [CrossRef] [Green Version]
  14. Alho, E. Farmers’ willingness to invest in new cooperative instruments: A choice experiment. Ann. Public Coop. Econ. 2019, 90, 161–186. [Google Scholar] [CrossRef]
  15. Alho, E. Survey evidence of members’ willingness to invest in agricultural hybrid cooperatives. J. Chain Netw. Sci. 2016, 16, 41–58. [Google Scholar] [CrossRef]
  16. Ming, B.H.; Gan, G.G.G.; Ramasamy, S. The role of concern for the environment and perceived consumer effectiveness on investors’ willingness to invest in environmentally-friendly firms. Kaji. Malays. 2015, 33, 173–190. [Google Scholar]
  17. Memon, J.A.; Alizai, M.Q.; Hussain, A. Who will think outside the sink? Farmers’ willingness to invest in technologies for groundwater sustainability in Pakistan. Environ. Dev. Sustain. 2019. [Google Scholar] [CrossRef]
  18. Gahrs, S.; Mehler, K.; Bost, M.; Hirschl, B. Acceptance of ancillary services and willingness to invest in PV-storage-systems. Energy Procedia 2015, 73, 29–36. [Google Scholar] [CrossRef] [Green Version]
  19. Kyriakopoulos, G.L.; Arabatzis, G.; Tsialis, P.; Ioannou, K. Electricity consumption and RES plants in Greece: Typologies of regional units. Renew. Energy 2018, 127, 134–144. [Google Scholar] [CrossRef]
  20. Karasmanaki, E.; Galatsidas, S.; Tsantopoulos, G. An investigation of factors affecting the willingness to invest in renewables among environmental students: A logistic regression approach. Sustainability 2019, 11, 5012. [Google Scholar] [CrossRef] [Green Version]
  21. Asonitou, S.; Tromaridis, H. Bologna Tools to promote skills and competences in Higher Education: The Greek Context. In Business and Economics, Strategic Innovative Marketing; Springer: Cham, Switzerland, 2015; pp. 35–43. [Google Scholar]
  22. Asonitou, S.; Hassall, T. Which skills and competences to develop in accountants in a country in crisis? Int. J. Manag. Educ. 2019, 17, 100308. [Google Scholar] [CrossRef]
  23. Arabatzis, G.; Kyriakopoulos, G.; Tsialis, P. Typology of regional units based on RES plants: The case of Greece. Renew. Sustain. Energy Rev. 2017, 78, 1424–1434. [Google Scholar] [CrossRef]
  24. Ntanos, S.; Kyriakopoulos, G.; Chalikias, M.; Arabatzis, G.; Skordoulis, M. Public perceptions and willingness to pay for renewable energy: A case study from Greece. Sustainability 2018, 10, 687. [Google Scholar] [CrossRef] [Green Version]
  25. Ntanos, S.; Kyriakopoulos, G.; Chalikias, M.; Arabatzis, G.; Skordoulis, M.; Galatsidas, S.; Drosos, D. A social assessment of the usage of Renewable Energy Sources and its contribution to life quality: The case of an Attica Urban area in Greece. Sustainability 2018, 10, 1414. [Google Scholar] [CrossRef] [Green Version]
  26. Wong, W.K.; Guo, Z.X. A hybrid intelligent model for medium-term sales forecasting in fashion retail supply chains using extreme learning machine and harmony search algorithm. Int. J. Prod. Econ. 2010, 128, 614–624. [Google Scholar] [CrossRef]
  27. Domingos, S.D.O.; de Oliveira, J.F.; de Mattos Neto, P.S. An intelligent hybridization of ARIMA with machine learning models for time series forecasting. Knowl.-Based Syst. 2019, 175, 72–86. [Google Scholar] [CrossRef]
  28. Deng, Z.; Chen, J.; Zhang, T.; Cao, L.; Wang, S. Generalized Hidden-Mapping Minimax Probability Machine for the training and reliability learning of several classical intelligent models. Inf. Sci. 2018, 436–437, 302–319. [Google Scholar] [CrossRef]
  29. Khan, S.A.; Jabbar, M.A. Prediction of by-diseases in diabetic patients using associative classification with improved classifier accuracy for decision support system. Int. J. Eng. Adv. Technol. 2019, 8, 2625–2628. [Google Scholar] [CrossRef]
  30. HWEA. Hellenic Wind Energy Association Statistics. Available online: http://eletaen.gr/wp-content/uploads/2020/01/2020-1-30-hwea-statistics-greece.pdf (accessed on 28 February 2020).
  31. Frank, E.; Hall, M.A.; Witten, I.H. The Weka Workbench. In Online Appendix for “Data Mining: Practical Machine Learning Tools and Techniques”, 4th ed.; Morgan Kaufmann, 2016; Available online: https://www.cs.waikato.ac.nz/ml/weka/Witten_et_al_2016_appendix.pdf (accessed on 1 April 2020).
  32. Ntanos, S.; Kyriakopoulos, G.; Skordoulis, M.; Chalikias, M.; Arabatzis, G. An Application of the New Environmental Paradigm (NEP) Scale in a Greek Context. Energies 2019, 12, 239. [Google Scholar] [CrossRef] [Green Version]
  33. Ministry of Interior. Election Departments of the Prefecture of Evia, Parliamentary Elections January 2015, Ministry of Interior and Administrative Reconstruction. Available online: http://www.ypes.gr/UserFiles/f0ff9297-f516-40ff-a70e-eca84e2ec9b9/16.xls (accessed on 28 February 2020). (In Greek)
  34. Kaldellis, J.; Kapsali, M.; Katsanou, E. Renewable energy applications in Greece—What is the public attitude? Energy Policy 2012, 42, 37–48. [Google Scholar] [CrossRef]
  35. Zografakis, N.; Sifaki, E.; Pagalou, M.; Nikitaki, G.; Psarakis, V.; Tsagarakis, K. Assessment of public acceptance and willingness to pay for renewable energy sources in Crete. Renew. Sustain. Energy Rev. 2010, 14, 1088–1095. [Google Scholar] [CrossRef]
  36. Hagos, D.H.; Engelstad, P.E.; Yazidi, A.; Kure, O. General TCP State Inference Model from Passive Measurements Using Machine Learning Techniques. IEEE Access 2018, 6, 28372–28387. [Google Scholar] [CrossRef]
  37. Aziz, A.A.; Indahwati, I.; Sartono, B. Improving prediction accuracy of classification model using cascading ensemble classifiers. IOP Conf. Ser. Earth Environ. Sci. 2019, 299, 012025. [Google Scholar] [CrossRef]
  38. Dang, V.-H.; Dieu, T.B.; Tran, X.-L.; Hoang, N.-D. Enhancing the accuracy of rainfall-induced landslide prediction along mountain roads with a GIS-based random forest classifier. Bull. Eng. Geol. Environ. 2019, 78, 2835–2849. [Google Scholar] [CrossRef]
  39. Lopez, C.-P.; Tenemaza, M.; Loza-Aguirre, E. Alternative Ensemble Classifier Based on Penalty Strategy for Improving Prediction Accuracy. Adv. Intell. Syst. Comput. 2019, 876, 1070–1076. [Google Scholar] [CrossRef]
  40. Geetha Ramani, R.; Lakshmi, B.; Jacob, S.G. Data Mining Method of Evaluating Classifier Prediction Accuracy in Retinal Data. In Proceedings of the IEEE International Conference on Computational Intelligence and Computing Research, ICCIC 2012, Coimbatore, India, 18–20 December 2012. Article number 6510290. [Google Scholar] [CrossRef]
  41. Geng, T.; Du, Y. The business model of intelligent manufacturing with Internet of Things and machine learning. Enterp. Inf. Syst. 2020. [Google Scholar] [CrossRef]
  42. Ardavani, O.; Zerefos, S.; Doulos, L.T. Redesigning the exterior lighting as part of the urban landscape: The role of transgenic bioluminescent plants in mediterranean urban and suburban lighting environments. J. Clean. Prod. 2020, 242, 118477. [Google Scholar] [CrossRef]
  43. Grigoropoulos, C.J.; Doulos, L.T.; Zerefos, S.C.; Tsangrassoulis, A.; Bhusal, P. Estimating the benefits of increasing the recycling rate of lamps from the domestic sector: Methodology, opportunities and case study. Waste Manag. 2020, 101, 188–199. [Google Scholar] [CrossRef] [PubMed]
  44. Doulos, L.T.; Sioutis, I.; Kontaxis, P.; Zissis, G.; Faidas, K. A decision support system for assessment of street lighting tenders based on energy performance indicators and environmental criteria: Overview, methodology and case study. Sustain. Cities Soc. 2019, 51, 101759. [Google Scholar] [CrossRef]
  45. Kolovos, K.G.; Kyriakopoulos, G.; Chalikias, M.S. Co-evaluation of basic woodfuel types used as alternative heating sources to existing energy network. J. Environ. Prot. Ecol. 2011, 12, 733–742. [Google Scholar]
  46. Lindstrom, T. A fuzzy design of the willingness to invest in Sweden. J. Econ. Behav. Organ. 1998, 36, 1–17. [Google Scholar] [CrossRef]
  47. Yang, T.; Qian, K.; Lo, D.C.-T.; Xie, Y.; Shi, Y.; Tao, L. Improve the Prediction Accuracy of Naïve Bayes Classifier with Association Rule Mining. In Proceedings of the 2nd IEEE International Conference on Big Data Security on Cloud, IEEE BigDataSecurity 2016, IEEE IDS 2016, New York, NY, USA, 9–10 April 2016; Article number 7502277. pp. 129–133. [Google Scholar] [CrossRef]
  48. Hasan, A.N.; Twala, B. Improving Single Classifiers Prediction Accuracy for Underground Water Pump Station in a Gold Mine Using Ensemble Techniques. In Proceedings of the IEEE EUROCON 2015—International Conference on Computer as a Tool (EUROCON), Salamanca, Spain, 8–11 September 2015. Article number 7313694. [Google Scholar] [CrossRef]
  49. Augusty, S.M.; Izudheen, S. Improving the Accuracy of Ensemble Classifier Prediction Model Based on FLAME Clustering with Random Forest Algorithm. In Proceedings of the 3rd International Conference on Advances in Computing and Communications, ICACC 2013, Cochin, India, 29–31 August 2013; Article number 6686386. pp. 269–273. [Google Scholar] [CrossRef]
  50. Ekbal, A. Improvement of prediction accuracy using discretization and voting classifier. Proc.-Int. Conf. Pattern Recognit. 2006, 2, 695–698. [Google Scholar] [CrossRef]
  51. Zhai, P.; Williams, E. Analyzing consumer acceptance of photovoltaics (PV) using fuzzy logic model. Renew. Energy 2012, 41, 350–357. [Google Scholar] [CrossRef]
  52. Swift, K.D. A comparison of the cost and financial returns for solar photovoltaic systems installed by businesses in different locations across the United States. Renew. Energy 2013, 57, 137–143. [Google Scholar] [CrossRef]
  53. Li, H.; Yi, H. Multilevel governance and deployment of solar PV panels in U.S. cities. Energy Policy 2014, 69, 19–27. [Google Scholar] [CrossRef]
Figure 1. Classifiers prediction accuracy.
Sustainability 12 02817 g001
Table 2. Final dataset structure.
AttributeTypeValue
PV Degree of InformationPredictive{0,1,2,3,4,5,6,7}
PV Future Development PotentialPredictive{0,1,2,3,4,5,6,7}
SHP Future Development PotentialPredictive{0,1,2,3,4,5,6,7}
RES Environmental Enhancement Predictive{0,1,2,3,4,5,6,7}
RES Social AcceptancePredictive{0,1,2,3,4,5,6,7}
PV Environmental Protection ContributionPredictive{0,1,2,3,4,5,6,7}
PV Sustainable Development ContributionPredictive{0,1,2,3,4,5,6,7}
PV Landscape Upgrade ContributionPredictive{0,1,2,3,4,5,6,7}
Wind Turbines Life Quality UpgradePredictive{0,1,2,3,4,5,6,7}
Wind Turbines Energy ProductionPredictive{0,1,2,3,4,5,6,7}
SHP Sustainable Development ContributionPredictive{0,1,2,3,4,5,6,7}
Biomass Life Quality UpgradePredictive{0,1,2,3,4,5,6,7}
Willingness to Invest in RESClass{0,1}
Table 3. Experimental setup parameters and values.
ParameterValue
1st Experimented ClassifierLogistic Regression
2nd Experimented ClassifierSVM
3rd Experimented ClassifierC4.5
4th Experimented Classifier k-Nearest Neighbors
5th Experimented ClassifierLSTM
6th Experimented ClassifierBayesian Network
Evaluation Method10-Fold Cross Validation
Evaluation Metricsa, Confusion Matrix
Table 4. Confusion Matrix of all the experimented classifiers.
ClassifiersClass 0Class 1 Classified as
Logistic Regression15821Class 0
5113Class 1
C4.51772Class 0
631Class 1
LSTM16118Class 0
3727Class 1
SVM15128Class 0
3826Class 1
k-Nearest Neighbors16415Class 0
4222Class 1
Bayesian Network16415Class 0
4222Class 1

