Article

Evaluation of Drought Monitoring Effect of Winter Wheat in Henan Province of China Based on Multi-Source Data

1
College of Land Science and Technology, China Agricultural University, Beijing 100083, China
2
Key Laboratory of Remote Sensing for Agri-Hazards, Ministry of Agriculture and Rural Affairs, Beijing 100083, China
3
College of Information and Electrical Engineering, China Agricultural University, Beijing 100083, China
*
Author to whom correspondence should be addressed.
Sustainability 2020, 12(7), 2801; https://doi.org/10.3390/su12072801
Submission received: 15 February 2020 / Revised: 26 March 2020 / Accepted: 27 March 2020 / Published: 2 April 2020

Abstract

:
Monitoring agricultural drought is important to food security and the sustainable development of human society. In order to improve the accuracy of soil moisture and winter wheat yield estimation, drought monitoring effects of optical drought index data, meteorological drought data, and passive microwave soil moisture data were explored during individual and whole growth periods of winter wheat in 2003–2011, taking Henan Province of China as the research area. The model of drought indices and relative meteorological yield of winter wheat in individual and whole growth periods was constructed based on multiple linear regression. Results showed a higher correlation between Moderate-Resolution Imaging Spectroradiometer (MODIS) drought indices and 10 cm relative soil moisture (RSM10) than 20 cm (RSM20) and 50 cm (RSM50). In the whole growth period, the correlation coefficient (R) between vegetation supply water index (VSWI) and RSM10 had the highest correlation (R = −0.206), while in individual growth periods, the vegetation temperature condition index (VTCI) was superior to the vegetation health index (VHI) and VSWI. Among the meteorological drought indices, the 10-day, 20-day, and 30-day standard precipitation evapotranspiration indices (SPEI1, SPEI2, and SPEI3) were all most relevant to RSM10 during individual and whole growth periods. RSM50 and SPEI3 had a higher correlation, indicating that deep soil moisture was more related to drought on a long time scale. The relationship between Advanced Microwave Scanning Radiometer for EOS soil moisture (AMSR-E SM) and VTCI was stable and significantly positive in individual and whole growth periods, which was better compared to VHI and VSWI. Compared with the drought indices and the relative meteorological yield in the city, VHI had the best monitoring effect during individual and whole growth periods. Results also showed that drought occurring at the jointing–heading stage can reduce winter wheat yield, while a certain degree of drought occurring at the heading–milk ripening stage can increase the yield. In the whole growth period, the combination of SPEI1, SPEI2, and VHI had the best performance, with a coefficient of determination (R2) of 0.282 with the combination of drought indices as the independent variables and relative meteorological yield as the dependent variable. In the individual growth period, the model in the later growth period of winter wheat performed well, especially in the returning green–jointing stage (R2 = 0.212). Results show that the combination of multiple linear drought indices in the whole growth period and the model in the returning green–jointing period could improve the accuracy of winter wheat yield estimation. This study is helpful for effective agricultural drought monitoring of winter wheat in Henan Province.

1. Introduction

Drought is a ubiquitous climate phenomenon that has brought serious challenges to ecosystems and human society from ancient to modern times [1]. Drought can lead to large-scale crop yield reduction or even crop failure, posing a serious threat to national food security and sustainable agricultural development [2,3]. There is increasing drought globally because of global warming [4,5]. Due to the decrease in precipitation, there is an arid trend in many areas of China [6]. Drought not only destroys people’s living environment, but also disrupts agricultural production [7]. Therefore, it is important to study the characteristics and causes of drought, especially agricultural drought.
Drought can be divided into meteorological, agricultural, hydrological, and socioeconomic drought in terms of object and impact form [5]. The different types of drought are closely linked. A lack of precipitation and high evapotranspiration cause meteorological drought. The reduction of soil moisture results in agricultural drought. Low discharge and groundwater lead to hydrological drought in the long term. Finally society, economy, and the environment are affected, leading to socioeconomic drought [8]. Due to the complexity of the causes of agricultural drought, many factors need to be considered, such as vegetation types, soil properties, crop growth, weather conditions, and so on. According to the National Agricultural Drought Standard of China Meteorological Administration, the crop water deficit anomaly index, relative soil moisture, and indicators of farmland and crop drought morphology are used to classify the grade of agricultural drought [9]. Traditional drought monitoring is site-based, which is time-consuming and expensive. With the development of remote sensing technology, large-scale and long-time series of drought monitoring have been realized.
In recent years, remote sensing has played a more important role in drought research. With the development of different types of optical and microwave products, the accuracy of drought monitoring has improved. Many scholars at home and abroad have proposed a variety of agricultural drought remote sensing monitoring indices by combining different spectral bands, which can provide more information than a single spectral band [10]. Optical drought indices were widely used, but the image of the optical band was susceptible to atmospheric influence, resulting in poor quality and discontinuity of products in time and space. Microwave has strong penetration and can monitor the land surface all day [11]. It is highly sensitive to soil moisture, resulting in a wide range of applications in soil moisture estimation. Passive microwave data have the characteristics of high temporal resolution and low spatial resolution. It is more appropriate to use passive microwave data to retrieve soil moisture than active microwave data, because of the more direct relationship between soil dielectric constant and soil moisture. Moreover, passive microwave data can estimate soil moisture over a wide range [12]. At present, the main passive microwave remote sensing data are the Scanning Multichannel Microwave Radiometer (SMMR), Special Sensor Microwave (SSM), and Advanced Microwave Scanning Radiometer for EOS (AMSR-E). The first two sensors have low spatial resolution and focus on oceans and atmosphere, and are not ideal for land monitoring, while AMSR-E can provide soil moisture change data at the global scale with developing resolution [13]. Some studies have shown the diverse performance of the AMSR-E products in different regions, and the most encouraging results were found in semi-arid regions [14].
The development of agricultural drought monitoring indices is from meteorological to remote sensing indices in the 20th century, and the integrated indices received attention in the past 10 years [5]. Combining different types of data, such as soil, meteorology, phenology, optical remote sensing, microwave remote sensing, etc., to build a multi-source monitoring index has become a hot spot in drought monitoring research. By doing that, we can monitor various types of drought and obtain more comprehensive and accurate monitoring information [15]. Many studies have compared the differences and effects of drought monitoring based on different indices and explored the correlation between the different indices. For example, Chen et al. [16] compared the temporal and spatial changes of drought in Henan Province based on the standard precipitation evapotranspiration index (SPEI) and temperature vegetation dryness index (TVDI). Chen [17] combined the drought monitoring effects of the standard precipitation index (SPI) and vegetation temperature condition index (VTCI), and the results proved that the dynamic consistency between VTCI and 1-month SPI (SPI1) was improved. Wang et al. [18] used SPEI and normalized difference vegetation index (NDVI) to study the effects of meteorological drought on vegetation at the catchment scale in China, and explored the correlation between SPEI and NDVI.
Besides comparing various types of drought, studying the combinations of different drought indices to obtain a comprehensive index is popular. The multivariate joint distribution, principal component analysis (PCA), information mining, and linear combination methods are used to obtain comprehensive drought indices. The multivariate joint distribution method generally uses the copula function to construct a joint distribution function of drought-related factors such as precipitation, soil moisture, and runoff or corresponding drought indices [19]. PCA is used to transform sets of possible correlation variables into independent variables through orthogonal transformation, to reduce the dimension and make a few independent principal components reflect the information of most variables [20,21]. In the context of big data, the information mining method is used to mine the relationship between drought factors and drought, which include vegetation index, precipitation data, elevation, slope, and aspect, relying on a large number of samples through machine learning methods such as classification regression tree [22], artificial neural network [23,24], and random forest [25]. Although the above methods provide new ideas for multivariable monitoring, the multi-source drought index based on the linear combination method has been widely used because of its simple operation. This method usually assigns different weights to different sources of data, and a comprehensive drought index is then obtained by linear combination. Rhee proposed the scaled drought condition index (SDCI), which combines land surface temperature (LST) data, NDVI data from the Moderate-Resolution Imaging Spectroradiometer (MODIS), and precipitation data from the Tropical Rainfall Measuring Mission (TRMM) by the empirical weights method [26]. Zuo et al. obtained the combined deficit index (CDI) by giving different weights to precipitation anomalies and NDVI anomalies, and evaluated the CDI of farmland and dry land using SPI and SPEI to obtain the optimal weight [27]. Sun et al. [28] and Zhang et al. [29] conducted a multivariate linear analysis between remote sensing and meteorological drought indices, and the results showed that the composite index was more stable and adaptable to different topography than a single index. The constrained optimization method is superior to PCA in optimizing the parameters of the variables when combining them by maximizing the correlations with the in situ indices, which is essentially linear regression [30].
Henan Province is located in Central China, which is not only the country’s major agricultural province but also the main winter wheat producing area. According to the Henan Statistical Yearbook, the wheat planting area in China in 2017 was 24.508 million hectares, and 5.715 million hectares (23.3%) were in Henan Province. The output of wheat in China in 2017 was 134.334 million tons, and 37.052 million tons (27.6%) came from Henan Province. Henan is located in the transition zone from subtropical to warm temperate zone, with complex terrain. Drought occurs frequently in the province, especially in spring and early summer, which poses a serious threat to the yield of winter wheat [31]. Therefore, it is important to monitor the drought in a timely and effective manner and estimate the winter wheat yield accurately in Henan Province [7].
Many studies have analyzed the effects of drought on yield in different growth periods of winter wheat. Wang et al. analyzed the relationship between soil moisture at 0–50 cm and the yield of winter wheat during the growth period in different months, and showed a better relationship in October and November of the year before harvest than other months [2]. Huang et al. compared the relationship between vegetation health index (VHI), drought severity index (DSI), temperature vegetation dryness index (TVDI), and yield in different growth periods of winter wheat, showing that drought that occurred in the jointing and grain-filling stages had a great influence on yield [32]. The above studies were based on comparisons between a single drought index or soil moisture and yield in different growth stages of crops, and there has been less research on the comprehensive drought index related to the growth period of crops. Therefore, in this study, multi-source data (meteorological, optical remote sensing, and passive microwave data) were used to retrieve the drought indices of winter wheat in Henan Province. The monitoring results of drought indices of different sources in individual and whole growth periods were analyzed. A multi-source linear regression relationship was then established to estimate the yield by using the drought indices as the independent variables. This study aimed to explore the performance of different types of drought indices, conduct multiple regression of the indices in individual and whole growth periods, and provide a reference for regional winter wheat drought monitoring.

2. Study Area and Data

2.1. Study Area

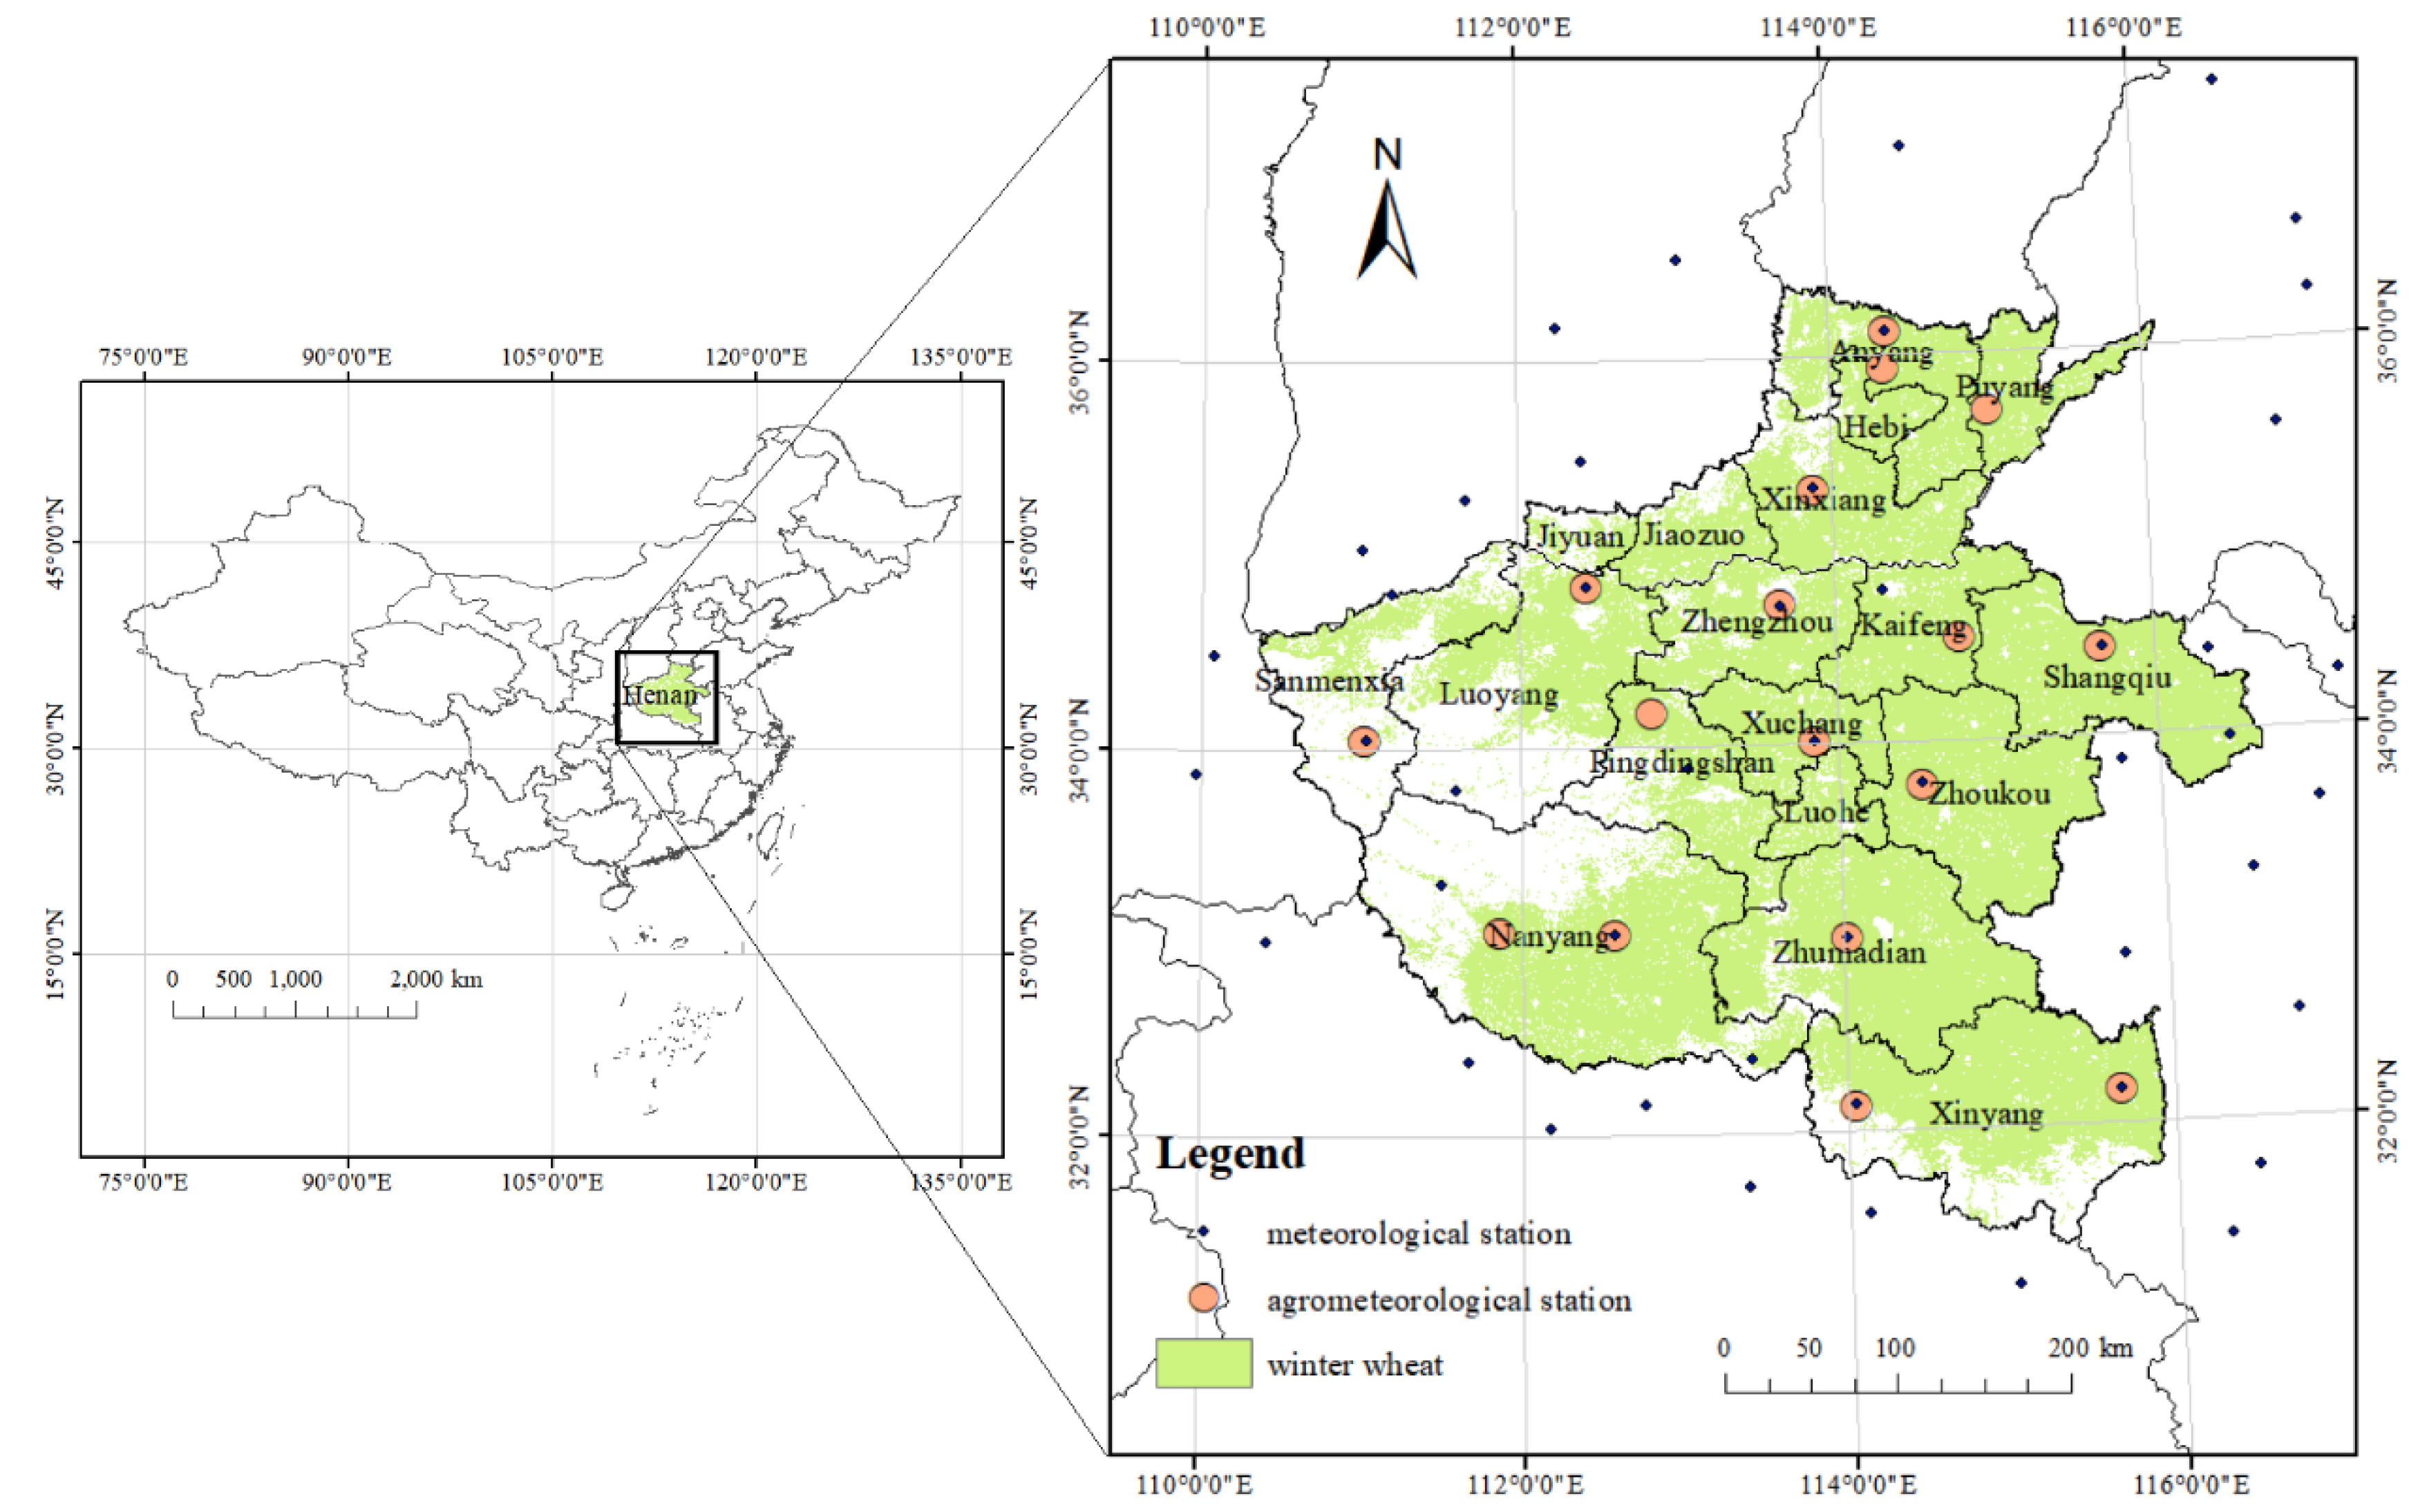
The study area is Henan Province, which is located in the central plains of China (31°23′ N to 36°22′ N, 110°21′ E to 116°39′ E; Figure 1). Henan Province is an important winter wheat-producing area. The climate is warm to subtropical, humid to semi-humid monsoon, with an average mean temperature of 15.7 °C and an average annual total precipitation of 500–900 mm, of which 50% falls in summer. The temperature of the whole province is generally high in the southeast and low in the northwest. The differences between the mountains and the plains are obvious, with relatively large annual and daily temperature ranges. Regarding the topographical location, Henan Province is located in the transition zone from the second steppe to the third steppe in China, which generally shows high terrain in the west and south and low terrain in the east and north. Generally, the interannual change of temperature is smaller than that of precipitation. The seasonal change of temperature is continuous and simple; however, the variation of precipitation with time is uneven, especially the absence of rain in the critical period of summer, which affects the normal growth of winter wheat. Therefore, Henan Province is prone to drought, and summer and spring droughts occur most frequently among seasonal droughts [33]. Wide-ranging droughts occurred in the province in 1966–1968, 1998–2000, and 2011–2013 [34].

2.2. Data Description and Preprocessing

In this study, we used meteorological, winter wheat yield, optical remote sensing, and passive microwave remote sensing data. The research time was nine growing periods of winter wheat from October 2002 to June 2011, so we downloaded the data for this time. The meteorological data used in this paper were downloaded from the China Meteorological Data Service Center [35]. The daily China surface climate dataset (V3.0) from 1965 to 2017 was used, which includes 19 meteorological stations in and 28 meteorological stations around the province (Figure 1). Data for daily temperature, precipitation, relative humidity, wind speed, and sunshine hours were downloaded. A few missing pieces of data were filled in by interpolation or by using multi-year average values. The 10-day relative soil moisture and winter wheat growth period data were downloaded, including 17 agrometeorological stations from China’s farmland crop growth and soil moisture dataset. Winter wheat yield data at the city level from 2003 to 2011 came from the statistical yearbook of the Henan Statistical Bureau [36]. The yield was divided into trend and meteorological yield, with trend yield fitted by linear regression. The relative meteorological yield was then obtained based on a study by Zhu et al. [37].
MODIS data were used as the optical remote sensing data in this study, and were downloaded from the National Aeronautics and Space Administration (NASA) website [38]. The daily surface reflectance product MOD09GA, daily land surface temperature product MOD11A1, and yearly land cover type product MCD12Q1 with image tile of h27v05 were downloaded. The MODIS Reproject Tool (MRT) was used to project MODIS images from sinusoidal projection to Universal Transverse Mercator 49° zone projection (UTM49) in the World Geodetic System 1984 (WGS84), and the nearest neighbor method was used to resample images to a spatial resolution of 926 m. Red (b1) and near-infrared (b2) bands were extracted from MOD09GA images to calculate the vegetation index. The classification of International Geosphere Biosphere Programme (IGBP) was employed to extract the winter wheat planting area. Pixels with attribute values of 12 (farm) and 14 (combined crops and natural vegetation) were chosen from the nine images during 2003–2011. The intersection of those nine images was then used as the winter wheat planting area.
AMSR-E data were used as the passive microwave data, and were downloaded from the National Snow and Ice Data Center (NSIDC) website [39]. The AMSR-E daily L3 surface soil moisture product was chosen, and the images were then converted from EASE-Grid to UTM49 projection in the WGS84 geographic coordinate system using the HOF-EOS to GeoTIFF Conversion Tool (HEG). The descent soil moisture layers of the AMSR-E products were extracted, and the nearest neighbor method was then used to resample the image resolution to 25,068 m. Finally, the 10-day soil moisture data were synthesized through the maximum value composite (MVC) method.

3. Methodology

3.1. Calculation of Drought Index

3.1.1. MODIS Drought Index

Land surface temperature (LST) and the vegetation index are two variables that are closely related to the physiological growth of vegetation in regional drought monitoring. Surface temperature can reflect the change of surface soil water content. The vegetation index can also indirectly reflect soil drought conditions through changes in vegetation growth. However, there are some drawbacks when only using data of one variable, in that the drought will not be fully and timely revealed. Moreover, the two variables have a significant negative correlation in regions where water is the limiting factor [40,41]. Some studies show that combining the two variables can effectively improve the accuracy and practicability of drought monitoring [42]. In this study, three drought indices that combine vegetation index and surface temperature were selected to investigate the drought monitoring effect of winter wheat in the growth period: vegetation health index (VHI), vegetation supply water index (VSWI), and vegetation temperature condition index (VTCI). The enhanced vegetation index (EVI) was adopted instead of the normalized difference vegetation index (NDVI), since the EVI can better reflect vegetation growth when the vegetation coverage is high by reducing the error caused by soil background and aerosol. The two-band EVI calculation formula Equation (1) [43] is used to reduce the instability of pixel values on bright targets (such as clouds, ice, and snow) using the three-band EVI formula:
E V I = 2.5 N I R R E D N I R = 2.4 R E D + 1
where NIR is the reflectance of the near-infrared band, and RED is the reflectance of the red band. After calculating the daily EVI, the 10-day EVI is obtained by the maximum value composite method (MVC). The 10-day LST is obtained by the MVC method, and VHI, VSWI, and VTCI are then computed by using the 10-day EVI and LST.
The vegetation health index (VHI) was proposed based on the vegetation condition index (VCI) and temperature condition index (TCI) [44]. VCI and TCI consider the effects of drought on vegetation and land surface temperature, respectively, and are calculated by Equations (2) and (3); VHI is calculated by Equation (4):
V C I = E V I E V I min E V I max E V I min
T C I = L S T max L S T L S T max L S T min
V H I = a × V C I + ( 1 a ) × T C I
where a is the weight of the VCI; a is a constant, which equals 0.5 in this study, because of the lack of more accurate information, assuming an equal contribution of VCI and TCI [45]; EVImax and EVImin are the multi-year maximum and minimum values of the EVI in the same period; LSTmax and LSTmin are the multi-year maximum and minimum values of the LST in the same period. The unit of the LST is Kelvin (K).
Vegetation supply water index (VSWI) was proposed by Carlson [46] by synthesizing the response of crop surface in red, near-infrared, and thermal infrared bands, which can reflect the drought degree of the vegetation-covered surface.
V S W I = 1000 E V I L S T
When the VSWI is large, surface vegetation grows well and the drought degree is light. When the VSWI is small, surface vegetation grows poorly and the drought degree is heavy. Since the directly calculated VSWI is small, it is expanded by 1000, resulting in a VSWI mostly between 0 and 3.5.
The vegetation temperature condition index (VTCI) was defined based on the triangular or trapezoidal feature space using the vegetation index and land surface temperature [47]:
L S T E V I i . min = a + b × E V I i
L S T E V I i . max = c + d × E V I i
V T C I = L S T E V I i . max L S T E V I i L S T E V I i . max L S T E V I i . min
where LSTEVIi.min and LSTEVIi.max are minimum and maximum LSTs of pixels that have the same EVIi value in a study region, respectively; LSTEVIi is the LST of one pixel whose EVI value is EVIi; LSTEVIi.min is the cold edge of the EVI-LST feature space where there is no water stress for plant growth, and LSTEVIi.max is the warm edge of the EVI-LST feature space where there is less available soil moisture and plants are under dry conditions. Coefficients a, b and c, d are the intercept and slope of the fitted cold and warm edges, respectively. The values of VTCI range from 0 to 1. The smaller the VTCI value, the more severe the drought. The premise of using the feature space drought index is to satisfy the large range of soil surface water content in the study area from the wilting point to the field holding capacity at the pixel level, and vegetation coverage varies widely. Henan Province basically meets the conditions. In this study, multi-year maximum composite EVI and LST images are used to determine the warm edge of VTCI. Multi-year maximum composite EVI and multi-year maximum–minimum composite LST images are used to determine the cold boundary of VTCI [48].

3.1.2. Standard Precipitation Evapotranspiration Index

At present, common meteorological drought indices include the standardized precipitation index (SPI), Palmer drought severity index (PDSI), and standardized precipitation evapotranspiration index (SPEI). Among them, PDSI is an important index and is widely used in the United States. Although PDSI takes temperature into account, it lacks the multi-time-scale characteristics necessary to assess different types of drought. SPI has multi-time-scale characteristics with low data requirement and high performance, but it does not consider temperature. Vicente-Serrano et al. [49] proposed SPEI, which includes precipitation and evapotranspiration. The calculation of evapotranspiration further includes temperature, wind speed, sunshine, etc. In addition, SPEI can monitor multi-scale drought. Wang et al. [50] compared the relationship between SPI, SPEI, PDSI, and soil moisture, and results showed that SPEI could better reflect soil moisture at different soil depths, indicating its superiority over other indices. Comparing SPI, SPEI, and PDSI, the results of Liu et al. [51] showed that SPEI was more clear and robust because it combines principles of both SPI and PDSI. Therefore, SPEI is used as a meteorological drought index in this study. Most SPIE values at different time scales in previous studies were calculated based on monthly data, such as SPIE1, SPEI3, SPEI6, and SPEI12, representing 1, 3, 6, and 12 months, respectively. However, monthly SPEI cannot accurately monitor the time of occurrence of drought. Therefore, some scholars have proposed daily SPEI, and suggested that it could monitor drought at any time scale [52]. The variables, e.g., soil moisture and biomass, are usually measured every 10 days by agrometeorological stations. Therefore, the 10-day SPEI is used in this study to match the time scale of soil moisture measurement.
The calculation of 10-day SPEI is as follows. The daily meteorological data from 1965 to 2017 were first extracted from 47 meteorological stations in and around Henan Province. Daily potential evapotranspiration was calculated by the Penman–Monteith equation as specified by the United Nations Food and Agriculture Organization (FAO)’s Irrigation and Drainage Paper No. 56 [53]. The ETo Calculator developed by FAO was used for the calculation. The 10-day ETo and precipitation values were then obtained by accumulating daily potential evapotranspiration and precipitation. The 10-day, 20-day, and 30-day standard precipitation evapotranspiration index (SPEI1, SPEI2, and SPEI3) values of the 47 meteorological stations (Figure 1) were calculated using the SPEI R package [54].
In order to study meteorological drought in the region, the SPEI values of the meteorological stations were interpolated to obtain SPEI images of Henan Province. Ordinary kriging interpolation was used because it is an optimal and unbiased linear interpolation method in a finite region based on the correlation and variability of variables. Moreover, the variables of SPEI are continuous, meeting the premise of kriging interpolation, that is, the spatial correlation of regional variables. SPEI1, SPEI2, and SPEI3 of the 47 meteorological stations in and around Henan Province (Figure 1) were interpolated by using ArcGIS 10.2 software. SPEI1, SPEI2, and SPEI3 images of the Province were obtained. Resolution of the SPEI at different time scales was the same as that of other images mentioned above.

3.2. Processes

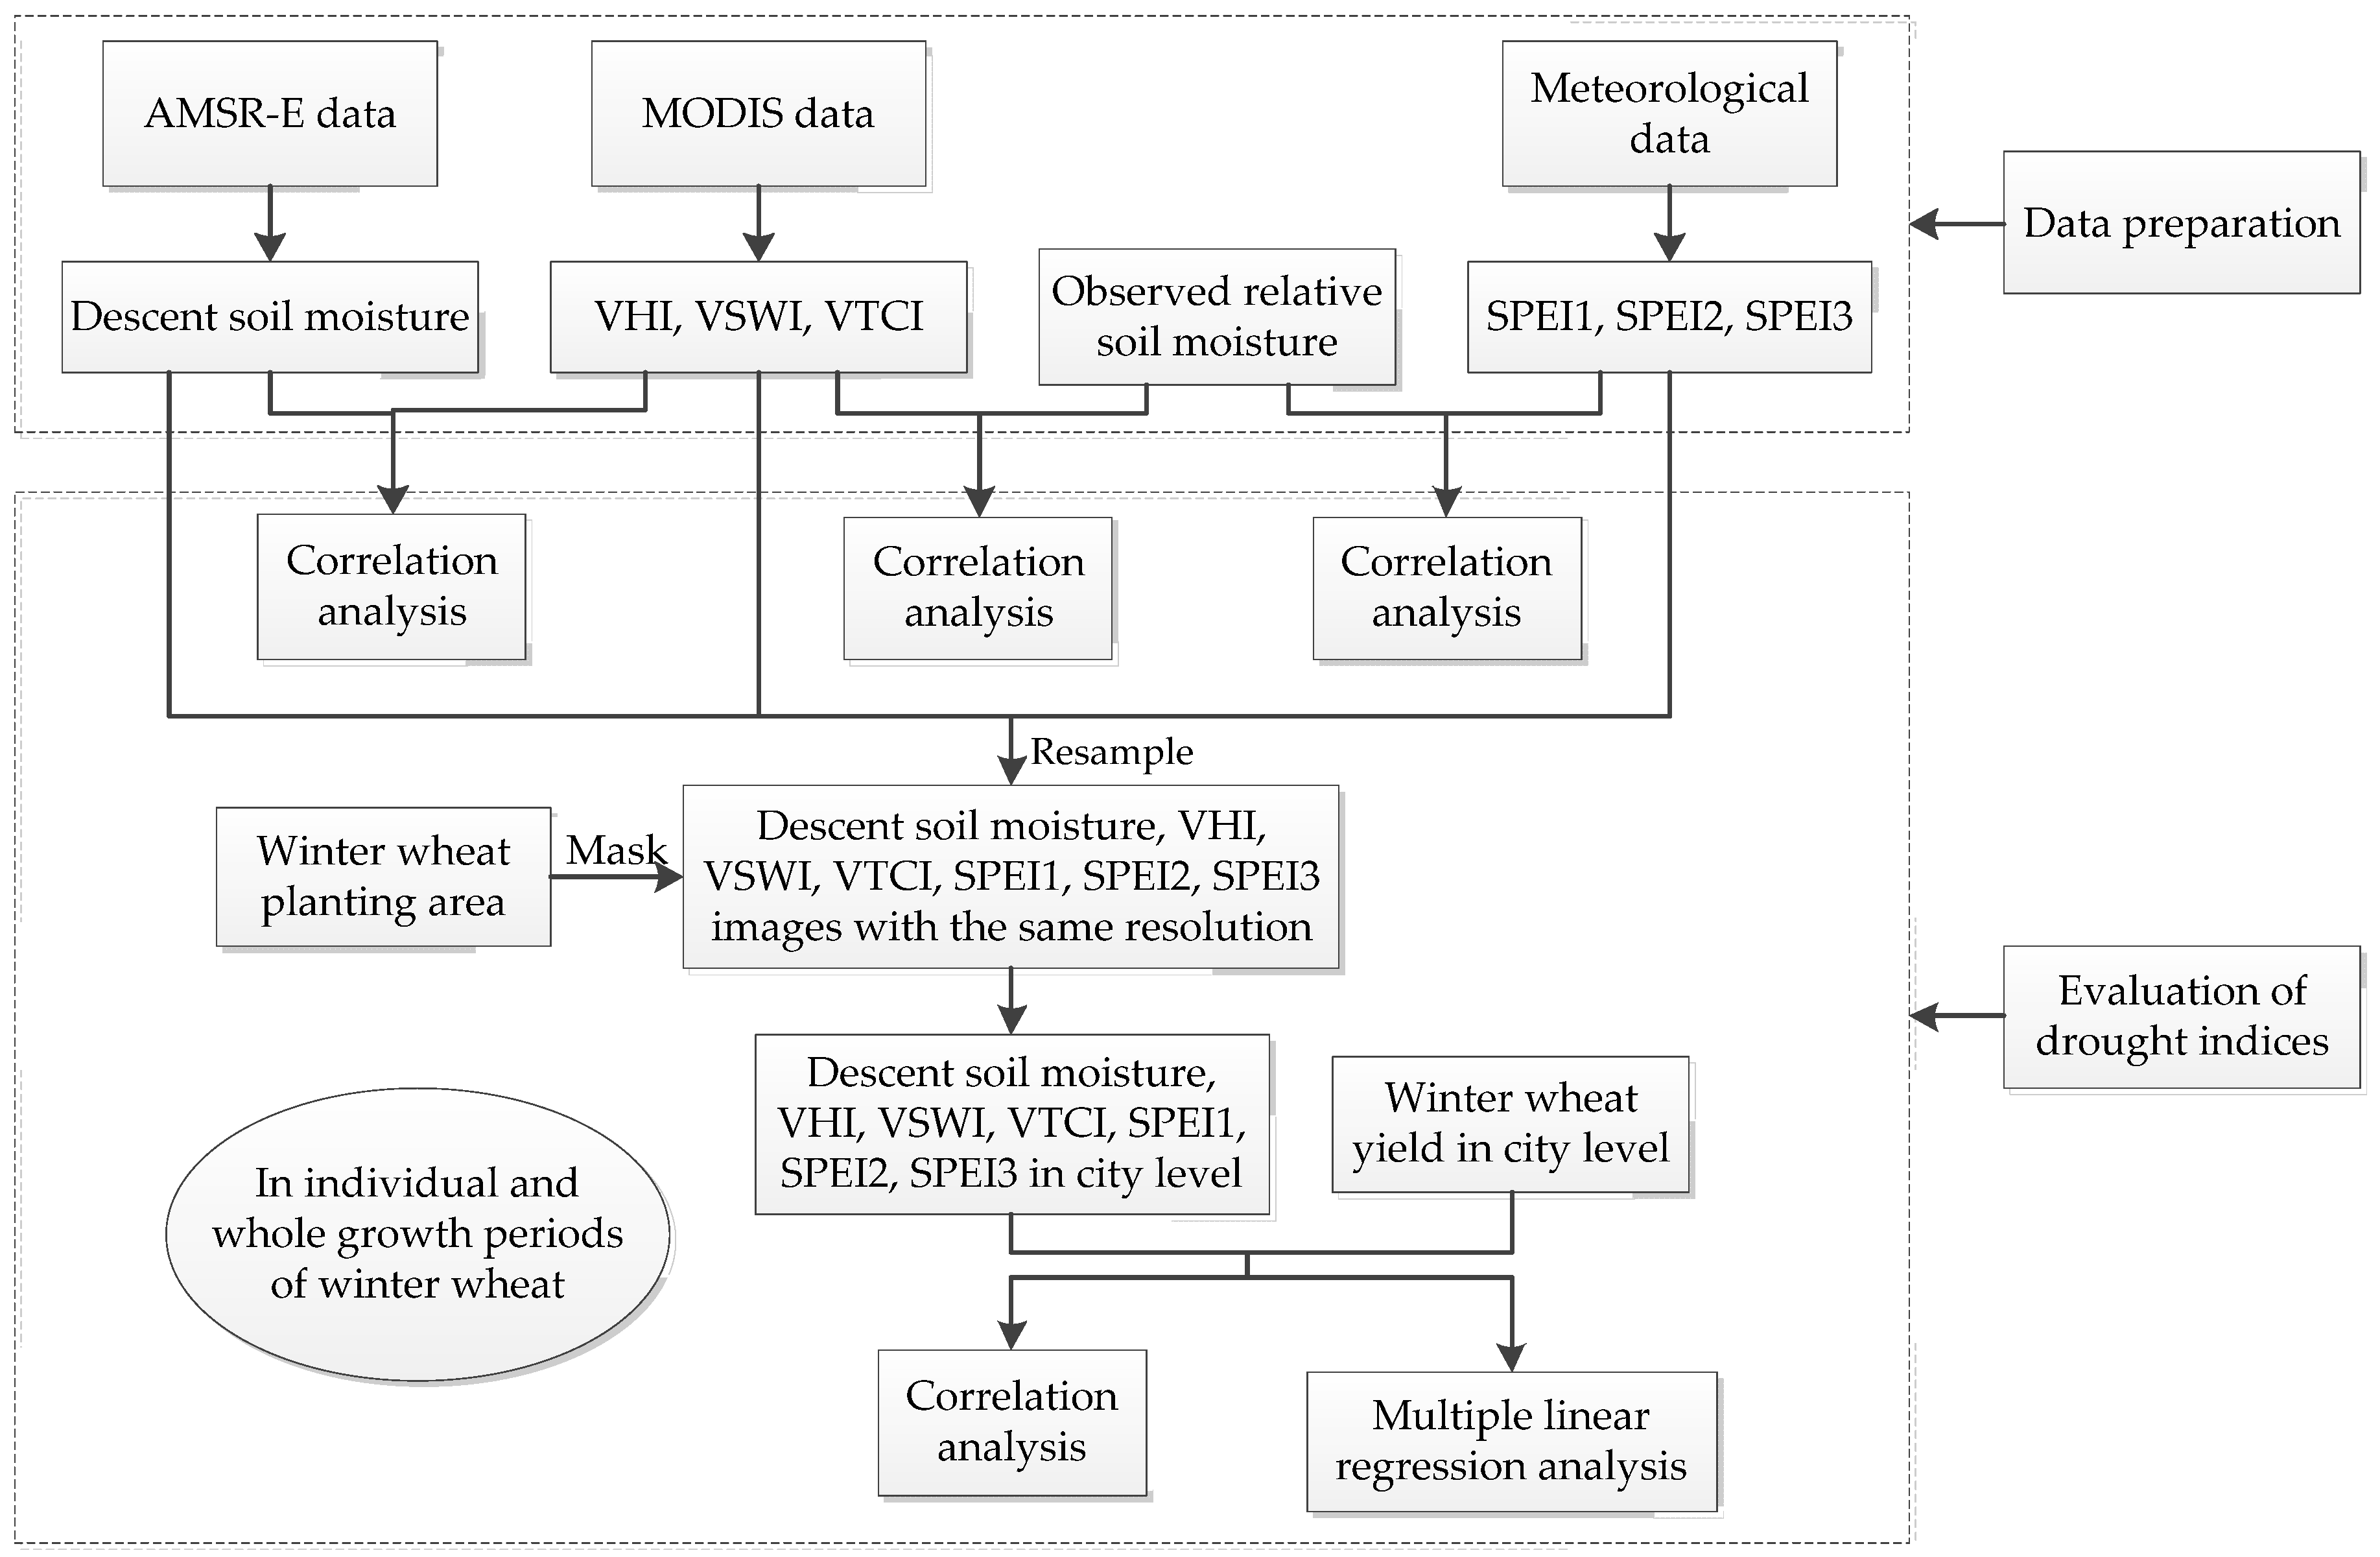
This study was conducted as shown in the flowchart in Figure 2. First, the AMSR-E, MODIS, and meteorological data were prepared, and the 10-day descent soil moisture, MODIS drought indices, and SPEI values were calculated. The drought indices were then estimated using correlation analysis. Last, multiple linear regression was used on the drought indices and winter wheat yield. Every step was conducted based on individual and whole growth periods of winter wheat.
To quantify the effects of the drought indices, statistical metrics were adopted for the evaluation. The Pearson correlation coefficient was used to test the correlation between drought indices, and between the drought indices and the yield of winter wheat. Equation (9) is the calculation formula of the Pearson correlation coefficient (R):
R = Cov ( X , Y ) V a r ( X ) V a r ( Y )
where X and Y are two variables of the correlation; Cov(X, Y) is the covariance of X and Y; and Var(X) and Var(Y) are the variance of X and Y.

4. Results

4.1. Analysis of Meteorological Drought Based on SPEI3

To test the effect of kriging interpolation of the SPEIs, the relationship between SPEI and relative soil moisture was compared at 12 interpolating stations and 5 interpolated stations (Table 1), which are agrometeorological stations with and without daily meteorological data, respectively (Figure 1). The results show that the correlation coefficient between interpolating and interpolated stations is similar, with the value of the former slightly higher than that of the latter. The correlation coefficient between SPEI1 and 50 cm relative soil moisture (RSM50) at interpolating and interpolated stations is the largest, with a difference of around 0.05. Therefore, the comparison shows a satisfactory interpolation effect of ordinary kriging for the SPEIs.
Based on the 10-day farmland crop growth and soil moisture dataset from the China Meteorological Data Service Center, the winter wheat growth period data from 17 agrometeorological stations in Henan Province are summarized in Table 2.
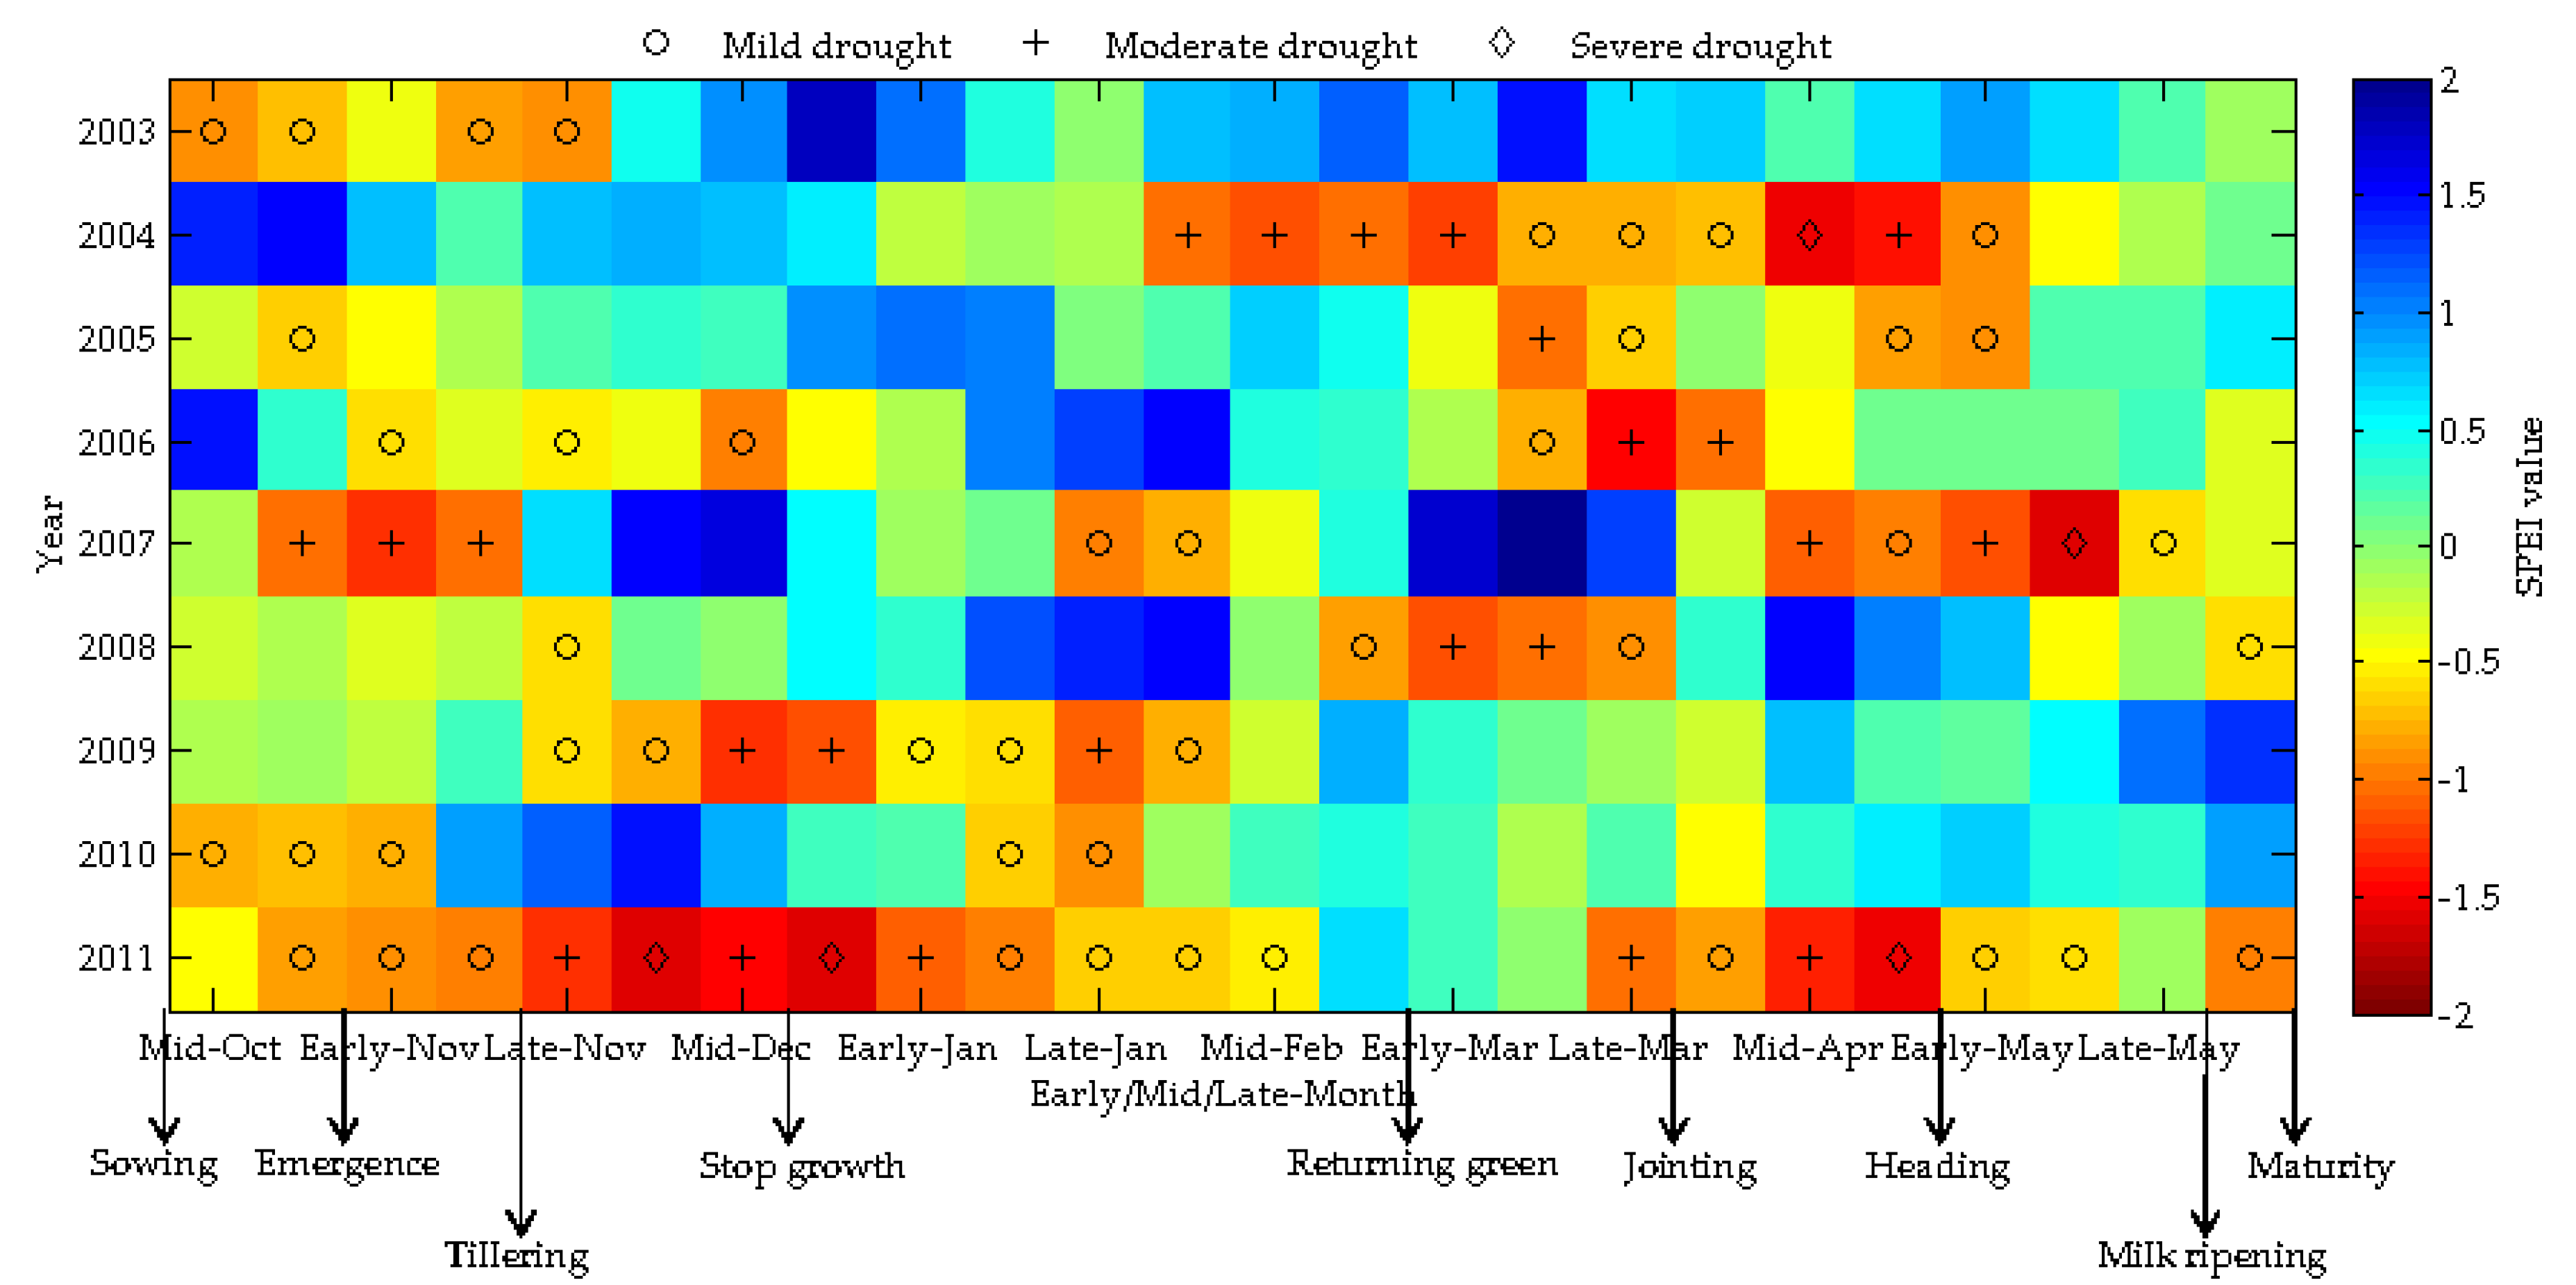
As shown in Table 1, SPEI3 has the highest correlation relationship with soil moisture in different depths at interpolating and interpolated stations. Therefore, SPEI3 was used to analyze meteorological drought in Henan Province. SPEI3 values are graded according to the SPEI classification standard (Table 3) specified by the China Meteorological Administration [55]. The meteorological drought distribution in Henan Province was obtained by averaging SPEI3 values of 19 meteorological stations in 10 days of the winter wheat growth period (Figure 3). Drought frequency Equation (10) was used to evaluate the occurrence frequency of different degrees of drought in growth periods of Henan Province [16].
P = n N × 100 %
where n is the number of drought occurrences in the data series, and N is the total number of drought occurrences in the series.
Among the nine growth periods of winter wheat in Henan Province, mild drought occurred most frequently, a total of 45 times. Severe drought was the least frequent (5 times), and moderate drought occurred 23 times. The frequency of drought decreased as the severity increased. During the nine growth periods, mild drought occurred at all stages, with the highest frequency of 33.3% at the sowing–emergence stage and the lowest frequency of 14.8% at the joint–heading stage (Table 4). Except for the milk ripening–maturity stage, moderate drought occurred in other stages. Moderate drought occurred at the highest frequency of 22.2% in the returning green–jointing phase. Severe drought happened during the tillering–stop growth, stop growth–returning green, jointing–heading, and heading–milk ripening stages, with a maximum frequency of 7.4% in the jointing–heading stage. On an interannual time scale, 2010–2011 was the driest year in terms of winter wheat growth, with 3 severe, 5 moderate, and 11 mild droughts. The most severe droughts happened before and after the stop growth stage and at the jointing–heading stage. There was less severe drought in 2003–2004 and 2008–2009, with continuous drought occurring before returning–green to heading and before and after heading, respectively. Droughts that occurred in 2006–2007 were also serious. Droughts during 2002–2003 and 2009–2010 were lighter, with 4 and 5 mild droughts, respectively.

4.2. Drought Monitoring Effects of Different Drought Indices

This study investigated drought during the winter wheat growth period in Henan Province in 2003–2011, so relative soil moisture (RSM), MODIS drought index images, AMSR-E soil moisture (AMSR-E SM) images, and interpolated SPEI images were used at this stage.

4.2.1. Correlation between the MODIS Drought Indices and Relative Soil Moisture

According to the geographic coordinates of the agrometeorological stations, we extracted pixels that were uniformly distributed and representative. In detail, we chose pixels with a variance of LST less than 2 Kelvin and a variance of EVI less than 0.005 in the 3 × 3 window. The MODIS drought indices of stations were replaced by the mean value in the windows [17]. Correlation analysis between MODIS drought indices and relative soil moisture in individual and whole growth periods was carried out, and the Pearson correlation coefficient was obtained (Table 5). The results showed that VHI, VSWI, and VTCI had a better relationship with RSM10 in individual and whole growth periods than with RSM20 and RSM50. The results indicate that the MODIS drought indices could better reflect soil water content at the surface. During the whole growth period, the performance of VSWI was better than that of VHI and VTCI. The correlation coefficients between VSWI and soil moisture in all layers were highly significant but negative. The correlation coefficient between VSWI and RSM10 was most significant (R = −0.206). However, in each growth period, the drought monitoring effect of VTCI was better than that of VHI and VSWI. The correlation between VTCI and RSM10 was the highest. Except for the milk ripening–maturity stage, the correlations between VTCI and RSM10 were significant in other growth periods. In the tillering–stop growth stage, the correlation coefficients between VTCI and RSM10 and RSM20 were 0.444 and 0.341, respectively. The correlation coefficients between VHI and RSM10 and RSM20 were better at the tillering–stop growth and heading–milk ripening stages. The performance of VSWI in the individual growth period was lower than that of VHI and VTCI. The correlation coefficient was unstable and insignificant in a few stages, which was contrary to the high correlation in the whole growth period. The correlation coefficient between the MODIS drought index and relative soil moisture is not very high (Table 5).

4.2.2. Correlation between SPEI and Relative Soil Moisture

The SPEI images were obtained by interpolation, and the distribution difference between adjacent pixels was small. Therefore, the pixel values of the SPEI interpolated images at the agrometeorological stations were directly compared with the corresponding relative soil moisture (Table 6). The results show that the SPEI interpolated images at different time scales were more highly correlated with relative soil moisture of different layers than the MODIS drought indices.
SPEI1, SPEI2, and SPEI3 had the highest relationship with RSM10. The correlation coefficient of SPEI3, SPEI2, and SPEI1 with RSM10 was 0.621, 0.584, and 0.513 in the emergence–tillering stage, respectively. The correlation of SPEI2 and SPEI3 with RSM10 was better than that of SPEI1, indicating that RSM10 can better represent 20-day or 30-day water change. RSM50 had the highest correlation with SPEI3, indicating that the 30-day influence of water change on RSM50 is greater compared to 20-day and 10-day. The correlation between SPEI1 and RSM50 was insignificant in a few growth stages. In addition, the correlation between SPEI1 and relative soil moisture in different layers was also low in the sowing–emergence and milk ripening–maturity stages.

4.2.3. Correlation between AMSR-E Soil Moisture and MODIS Drought Indices

Since the resolution of AMSR-E images is coarse, the grid values of AMSR-E soil moisture (AMSR-E SM) images at the agrometeorological stations were compared with the average values of the grid in the 27 × 27 windows of the MODIS image (Table 7). VHI, VSWI, and VTCI showed high correlation with AMSR-E SM during the whole growth period, with VTCI showing the best performance (R = 0.217). There was no positive or negative relationship between VHI and AMSR-E soil moisture in each growth period. There was a significant negative correlation between VSWI and AMSR-E SM before the returning green stage, with high correlation in the tillering–stopping growth stage (R = −0.457). The correlation coefficients between VTCI and AMSR-E SM in individual and whole growth periods were positive. Among the eight growth periods, the correlation between VTCI and AMSR-E SM was extremely significant in five periods.

4.3. Relationship between Drought Indices and Winter Wheat Yield

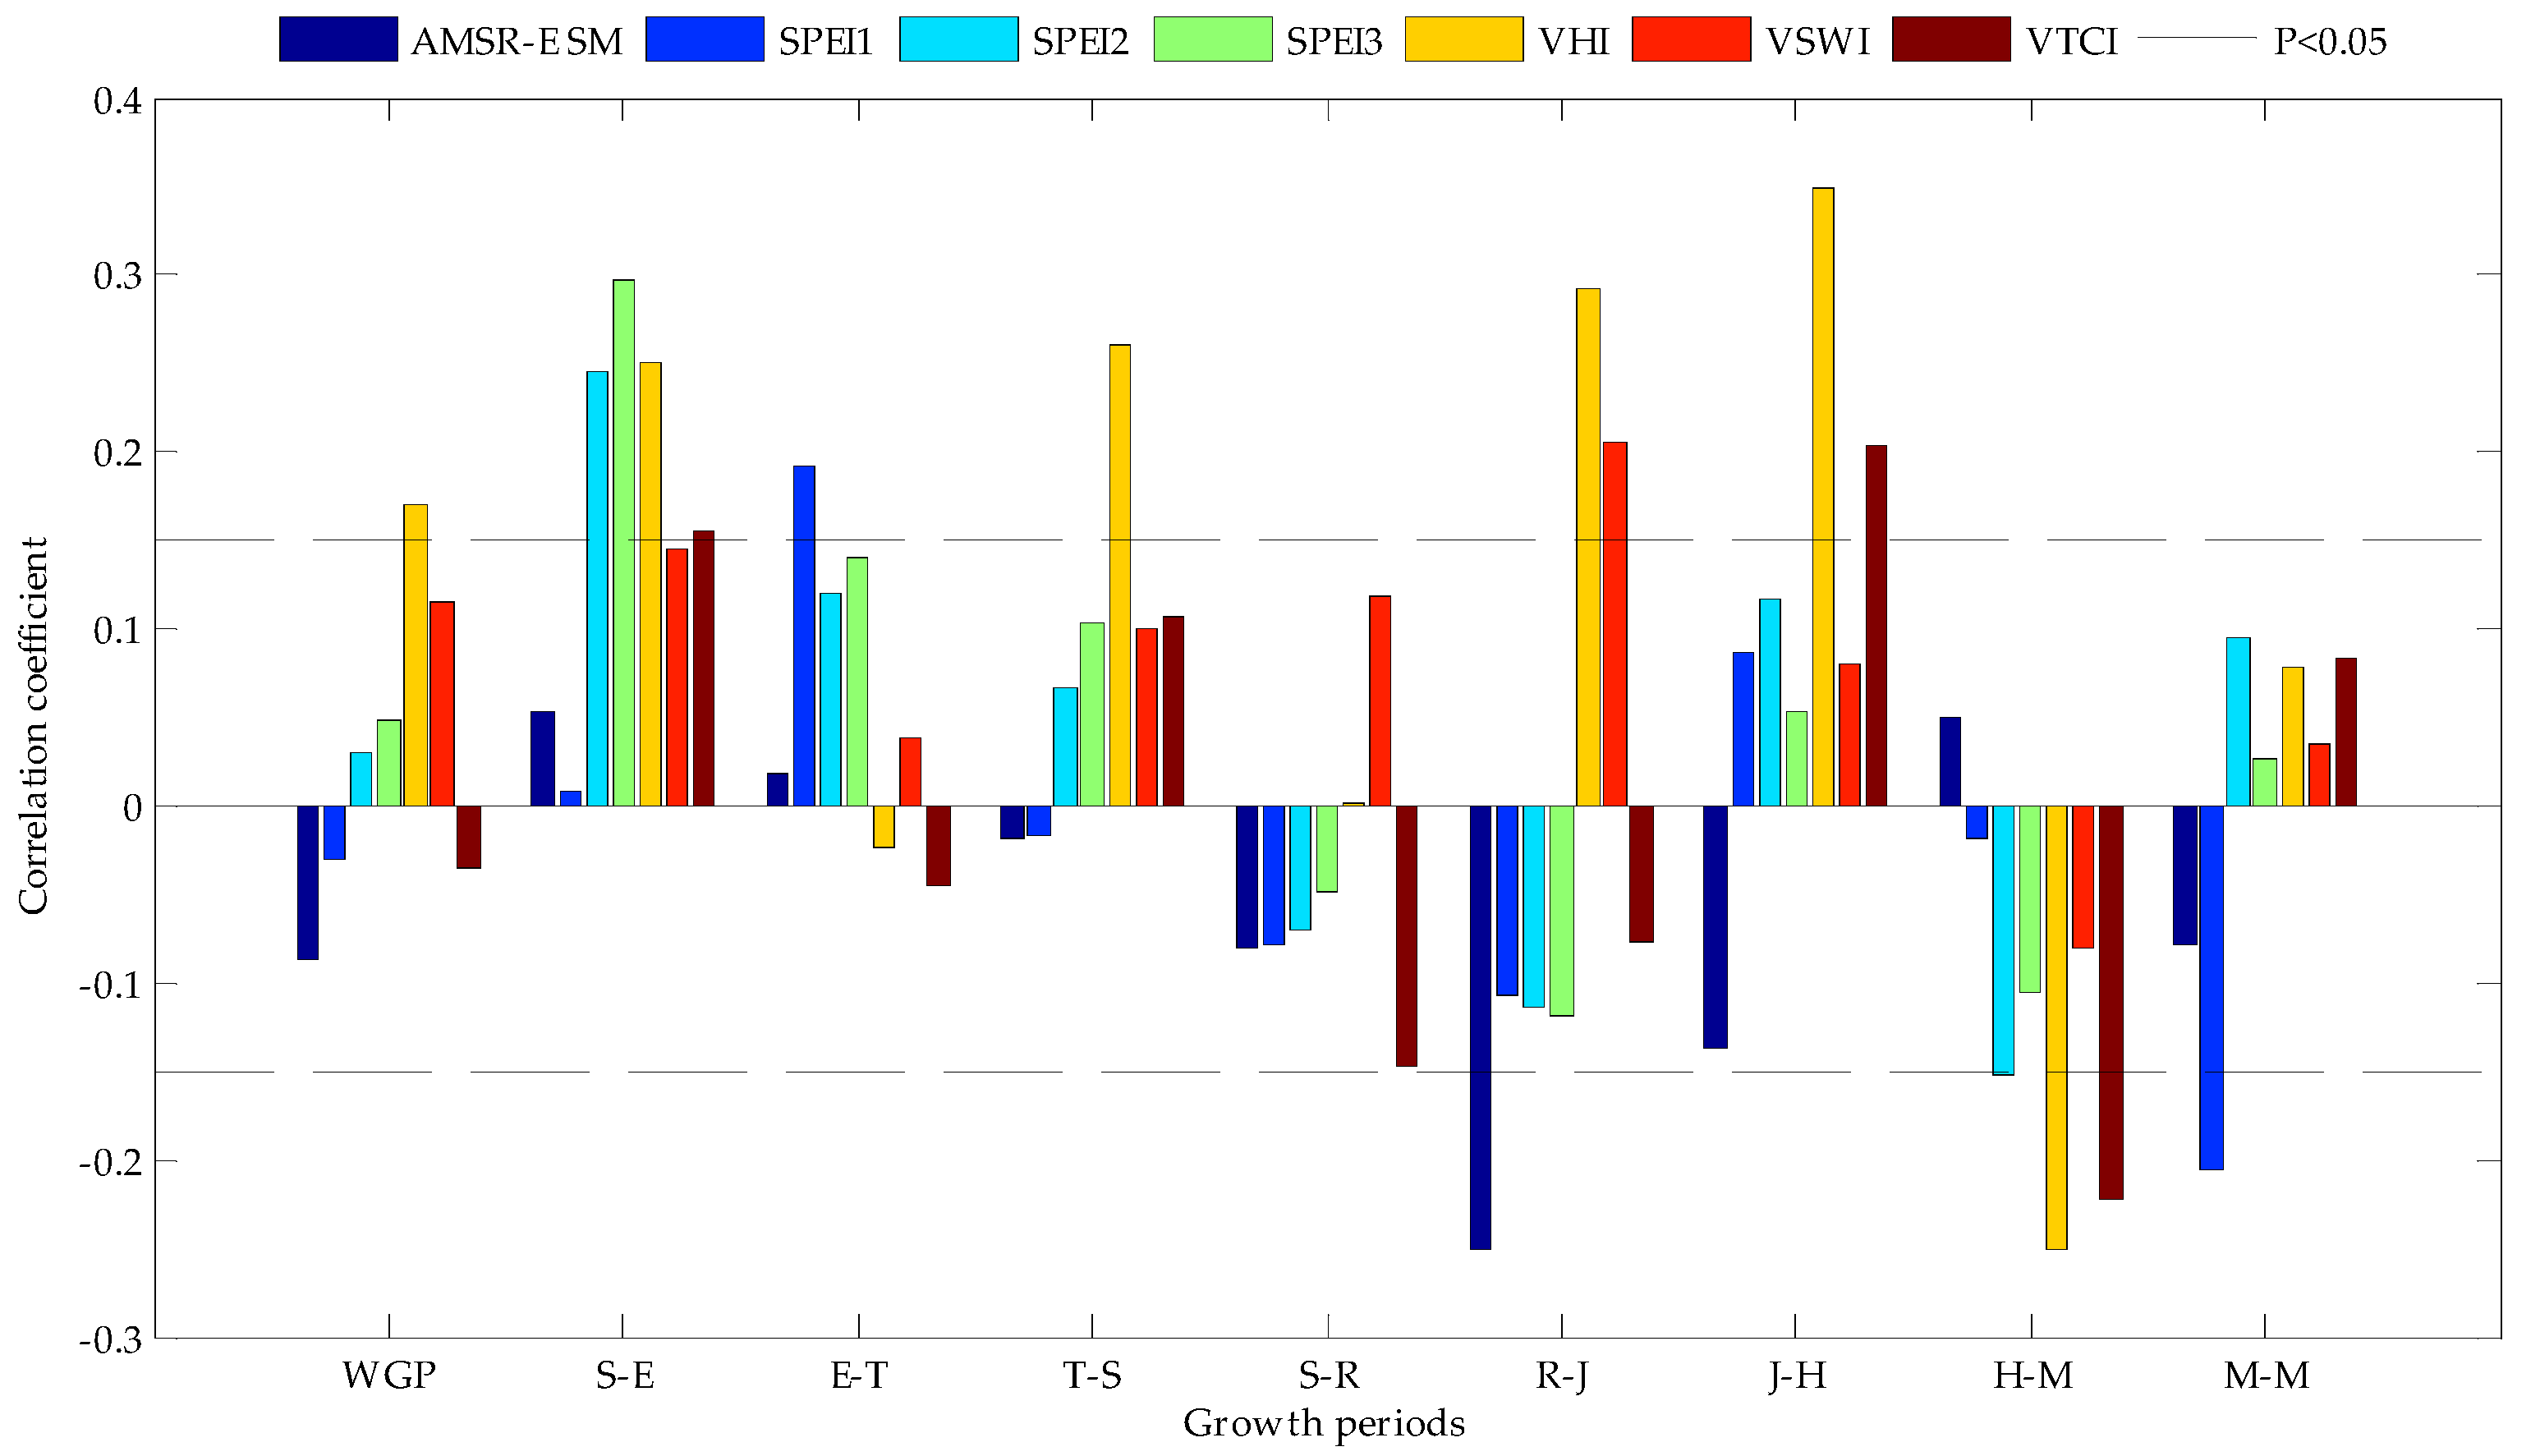
To make the sawtooth effect of the city boundary smaller, AMSR-E soil moisture images were resampled to 926 m resolution based on the bilinear interpolation method using ArcGIS to keep the resolution of all images consistent. The average drought index images were computed during individual and whole growth periods. The images were then masked by the winter wheat planting area image to extract the average drought indices of the planting areas of 18 cities in Henan Province. The correlation between city drought indices and relative meteorological yield of winter wheat in individual and whole growth periods was obtained (Figure 4). The results showed positive correlations between the drought indices and relative meteorological yield in sowing–emergence, tillering–stopping growth, and jointing–heading stages, and a negative correlation in the heading–milk ripening stage. It means that drought occurring at the jointing-heading stage can reduce winter wheat yield, while a certain degree of drought occurring at the heading-milk ripening stage can increase the yield.
An analysis of the indices showed that VHI performed best. VHI showed a high correlation with relative meteorological yield in the whole growth period (R = 0.170). In individual growth periods, VHI was highly correlated with relative meteorological yield except for the emergence–tillering, stop growth–return green, and milk ripening–maturity stages. The highest correlation was at the jointing–heading stage (R = 0.349). AMSR-E SM was insignificantly related to relative meteorological yield in all periods except for regreening–jointing. The relationship between SPEI and relative meteorological yield at different time scales was similar at each growth stage, showing an overall low performance. VSWI had a significant relationship with relative meteorological yield during the returning green–jointing period (R = 0.205), but an insignificant relationship in other periods. The relationship between VTCI and relative meteorological yield was significant in jointing–heading and heading–milk ripening stages, with correlation coefficients of 0.203 and –0.223, respectively.

4.4. Multiple Linear Regression Analysis of Drought Index and Yield

The drought index image was averaged for individual and whole growth periods. The winter wheat coverage image was then used as a mask to extract the average drought indices of each city in Henan Province during individual and whole growth periods. Multiple linear regression was used, with average drought indices in the city as the independent variables and with winter wheat yield in the corresponding city as the dependent variable. The optimal combination of independent variables was obtained (Table 8). The regression effect of the whole growth period was better than that of individual growth periods. The SPEI1, SPEI2, and VHI were selected as the combination of optimal variables, with a coefficient of determination (R2) of 0.282. In the individual growth periods, the regression effect of the late growth stage of winter wheat was better than that of the early growth stage. In the late growth stage, the regression effect of the returning green–jointing stage was the best (R2 = 0.212), followed by the heading–milk ripening stage (R2 = 0.197), jointing–heading stage (R2 = 0.186), and milk ripening–maturity stage (R2 = 0.180). In the early growth stage, the regression effect of the tillering–stopping growth stage was the best (R2 = 0.161). The combination of two SPEIs at different scales with the MODIS drought index or three SPEIs at different scales had a better effect in the growth period. It can be seen that the meteorological drought index plays an important role in indicating yield. Moreover, the results in Table 8 are similar to those of Zhu [37]. The yield evaluation of winter wheat should consider the drought conditions in the whole growth period and the jointing period.

5. Discussion

The correlations between LST and EVI (Table 9) and between LST, EVI, and 10 cm soil moisture (Table 10) were analyzed. In the whole growth period, the correlation between EVI and LST is significantly positive (R = 0.248). In individual growth periods, the correlation between EVI and LST is significantly positive from emergence to jointing stages. There should be a significant negative correlation between EVI and LST. However, for long-term research, the negative relationship may change. It has a strong negative correlation in the warm season, but a positive correlation in the winter [41]. The early growth period of winter wheat is winter, resulting in positive correlation coefficients in these periods, and the negative correlation between EVI and RSM10 (Table 10). Compared with Table 5, correlations between EVI, LST, and RSM10 are higher than VHI and VTCI in the whole growth period. However, in individual growth periods, the performance of LST and EVI is not as good as VTCI. Therefore, the combination of LST and EVI is effective in drought monitoring, especially in individual growth periods.
The SPEI image plays an important role, because of the small difference in precision between interpolating and interpolated stations, and as one of the optimal variables in multiple linear regression of yield estimation. The drawback of SPEI images is that they were interpolated from sparse sites, so the accuracy cannot be guaranteed at a large scale. It would be beneficial to focus on obtaining regional meteorological index images with high precision for effective agricultural drought monitoring.
It can be concluded from Table 8 that the effect of estimating winter wheat yield in a city using multivariate linear regression was obviously better compared to a single index. In the whole growth period, the coefficient of determination (R2) can reach 0.282 using multiple linear regression of SPEI1, SPEI2, and VHI. However, VHI has the highest correlation with yield (R = 0.170) with R2 = 0.029 in single index. Moreover, in individual growth periods, R2 increased more significantly using multiple linear regression than single data. The combination is usually made up of the SPEI and MODIS drought indices. The indices in this study are all 10 days, which can monitor drought conditions on a small scale and monitor the drought more accurately than monthly data. Multiple linear regression was conducted using yield as the dependent variable directly, making the agricultural drought monitoring more meaningful.
The overall accuracy needs to be improved in this study. When the study area is large, applying different models based on different regions would improve the accuracy. In addition, the accuracy would also improve with the model based on relative drought years and normal years [27,56]. Many factors should be taken into account in the estimation of yield, such as soil types, crop varieties, and pests, but we only considered drought conditions, reducing the accuracy of yield evaluation. The drought impact would be more significant in rain-fed areas than in irrigated areas [32]. There are many irrigation districts in Northern Henan, leading to the low accuracy. Although the result of the AMSR-E data showed low accuracy in this study, there are many applications in multi-source drought monitoring using such data [56].
Adding meteorological index products to multi-source index drought monitoring and crop assessment would be highly beneficial. Dividing the model more precisely based on different regions or phenological periods would improve the precision. In future studies, using different models in different regions on a large scale and combining crop models to divide the growth period more accurately will make agricultural drought monitoring and yield estimation more accurate. Moreover, incorporating remote sensing data into the process-oriented and machine-based crop models is an effective method to improve agricultural drought monitoring and yield estimation [57,58].

6. Conclusions

In this study, the drought monitoring effects of different indices from meteorological, optical remote sensing, and passive microwave data were compared. Multiple linear regression was used in the estimation of winter wheat yield based on different indices. The study was conducted in Henan Province in individual and whole growth periods with 10-day data.
When the drought indices were compared, MODIS and SPEI had a higher relationship with 10 cm soil moisture. In the MODIS drought indices, VSWI had the highest absolute correlation with 10 cm relative soil moisture (R = −0.206) in the whole growth period, while VTCI performed better in individual growth periods. For SPEIs, 10 cm relative soil moisture can be reflected by SPEI2 (20-day) and SPEI3 (30-day), but soil moisture of deeper layers needs an SPEI with a longer time scale to reflect changes, which indicates a lag between meteorological and agricultural drought. The correlation between AMSR-E SM and VTCI was the highest and stable during individual and whole growth periods.
When estimating winter wheat yield, using multiple linear regression of drought indices is better than single drought indices. In single drought indices, VHI shows a higher correlation than others in individual and whole growth periods. There was a positive correlation in the sowing–emergence, tillering–stopping growth, and jointing–heading stages, but a negative correlation in the heading–milk stage. VHI performed best, showing the highest correlation coefficient in the jointing–heading stage (R = 0.349, p < 0.01). In multiple linear regression of the drought indices, the combinations of SPEIs at two scales and one MODIS drought index or SPEIs at three scales were effective. The regression effect of the whole growth period is the best (R2 = 0.282). In individual growth periods, correlations in the late growth period were higher, especially in the returning green–jointing stage (R2 = 0.212). When using multiple regression drought indices to evaluate yield, drought in the whole growth period should be the main consideration, and drought in the jointing period should be supplementary.
In the future, studies based on precise modeling in different areas and on combinations of crop models to precisely divide the crop growth period will make drought monitoring and yield evaluation more accurate.
Author Contributions

Conceptualization: Y.L. and H.W.; methodology: Y.L.; resources: J.H.; data curation: Y.L.; investigation: Y.L.; writing—original draft preparation: Y.L.; writing—review and editing: Y.D., H.W., D.L., P.W., D.Y., and Z.L.; funding acquisition: H.W. All authors have read and agreed to the published version of the manuscript.

Funding

This research was funded by the National Natural Science Foundation of China, grant number 41701507.

Acknowledgments

The authors would like to thank Tailai Yan, Xiaodong Zhang, Weizhong Yang, Shaomin Li, and Yuanyuan Zhao.

Conflicts of Interest

The authors declare that there is no conflict of interest.

References

  1. Hao, Z.; Singh, V.P. Drought characterization from a multivariate perspective: A review. J. Hydrol. 2015, 527, 668–678. [Google Scholar] [CrossRef]
  2. Wang, H.; Vicente-serrano, S.M.; Tao, F.; Zhang, X.; Wang, P.; Zhang, C.; Chen, Y.; Zhu, D.; Kenawy, A.E. Monitoring winter wheat drought threat in Northern China using multiple climate-based drought indices and soil moisture during 2000–2013. Agric. For. Meteorol. 2016, 228–229, 1–12. [Google Scholar] [CrossRef]
  3. Zhang, J.; Mu, Q.; Huang, J. Assessing the remotely sensed Drought Severity Index for agricultural drought monitoring and impact analysis in North China. Ecol. Indic. 2016, 63, 296–309. [Google Scholar] [CrossRef]
  4. Dai, A. Increasing drought under global warming in observations and models. Nat. Clim. Chang. 2013, 3, 52–58. [Google Scholar] [CrossRef]
  5. West, H.; Quinn, N.; Horswell, M. Remote sensing for drought monitoring & impact assessment: Progress, past challenges and future opportunities. Remote Sens. Environ. 2019, 232, 111291. [Google Scholar]
  6. Xu, K.; Yang, D.; Yang, H.; Li, Z.; Qin, Y.; Shen, Y. Spatio-temporal variation of drought in China during 1961–2012: A climatic perspective. J. Hydrol. 2015, 526, 253–264. [Google Scholar] [CrossRef]
  7. Huang, J.; Tian, L.; Liang, S.; Ma, H.; Becker-Reshef, I.; Huang, Y.; Su, W.; Zhang, X.; Zhu, D.; Wu, W. Improving winter wheat yield estimation by assimilation of the leaf area index from Landsat TM and MODIS data into the WOFOST model. Agric. For. Meteorol. 2015, 204, 106–121. [Google Scholar] [CrossRef] [Green Version]
  8. Van Loon, A.F.; Laaha, G. Hydrological drought severity explained by climate and catchment characteristics. J. Hydrol. 2015, 526, 3–14. [Google Scholar] [CrossRef] [Green Version]
  9. Lyu, H.; Zhang, S.; Li, M.; Wang, J.; Zhang, S.; Lou, X.; Zhang, Y.; Wu, M. Grade of Agircultural Drought (GB/T 32136-2015); Standards Press of China: Beijing, China, 2015. (In Chinese) [Google Scholar]
  10. Huang, R.; Huang, J.; Zhang, C.; Ma, H.; Zhuo, W.; Chen, Y.; Zhu, D.; Wu, Q.; Mansaray, L.R. Soil temperature estimation at different depths, using remotely-sensed data. J. Integr. Agric. 2020, 19, 277–290. [Google Scholar] [CrossRef]
  11. Liu, L.; Liao, J.; Chen, X.; Zhou, G.; Su, Y.; Xiang, Z.; Wang, Z.; Liu, X.; Li, Y.; Wu, J.; et al. The Microwave Temperature Vegetation Drought Index (MTVDI) based on AMSR—E brightness temperatures for long-term drought assessment across China (2003–2010). Remote Sens. Environ. 2017, 199, 302–320. [Google Scholar] [CrossRef]
  12. Guo, N.; Wang, X. Advances and developing opportunities in remote sensing of drought. J. Arid Meteorol. 2015, 35, 1–18, (In Chinese with English abstract). [Google Scholar]
  13. Mao, K. Research on Retrieval Algorithms and Application of Key Parameters in Agrometeorological Remote Sensing; China Agricultural Science and Technology Press: Beijing, China, 2017; pp. 46–47. (In Chinese) [Google Scholar]
  14. Chen, Y.; Yang, K.; Qin, J.; Zhao, L.; Tang, W.; Han, M. Evaluation of AMSR-E retrievals and GLDAS simulations against observations of a soil moisture network on the central Tibetan Plateau. J. Geophys. Res. Atmos. 2013, 118, 4466–4475. [Google Scholar] [CrossRef]
  15. Jiang, X.; Bai, J.; Liu, X. Research progress and prospect of integrated drought monitoring based on multi-source information. Adv. Earth Sci. 2019, 34, 275–287, (In Chinese with English abstract). [Google Scholar]
  16. Chen, S.; Zhang, L.; Tang, R.; Yang, K.; Huang, Y. Analysis on temporal and spatial variation of drought in Henan Province based on SPEI and TVDI. Trans. Chin. Soc. Agric. Eng. 2017, 33, 126–132, (In Chinese with English abstract). [Google Scholar]
  17. Chen, P. Applicability of Drought Monitoring Based on Vegetation Index and Land Surface Temperature in Winter-Wheat-Growing Area in Hebei Province. Master’s Thesis, Nanjing University of Information Science and Technology, Nanjing, China, 2011. (In Chinese). [Google Scholar]
  18. Wang, Z.; Huang, Z.; Li, J.; Zhong, R.; Huang, W. Assessing impacts of meteorological drought on vegetation at catchment scale in China based on SPEI and NDVI. Trans. Chin. Soc. Eng. (Trans. CSAE) 2016, 32, 177–186, (In Chinese with English abstract). [Google Scholar]
  19. Yang, J.; Chang, J.; Wang, Y.; Li, Y.; Hu, H.; Chen, Y.; Huang, Q.; Yao, J. Comprehensive drought characteristics analysis based on a nonlinear multivariate drought index. J. Hydrol. 2018, 557, 651–667. [Google Scholar] [CrossRef]
  20. Jiao, W.; Wang, L.; Novick, K.A.; Chang, Q. A new station-enabled multi-sensor integrated index for drought monitoring. J. Hydrol. 2019, 574, 169–180. [Google Scholar] [CrossRef]
  21. Du, L.; Tian, Q.; Yu, T.; Meng, Q.; Jancso, T.; Udvardy, P.; Huang, Y. A comprehensive drought monitoring method integrating MODIS and TRMM data. Int. J. Appl. Earth Obs. 2013, 23, 245–253. [Google Scholar] [CrossRef]
  22. Du, L.; Tian, Q.; Wang, L.; Huang, Y.; Nan, L.; Aadil, M. A synthesized drought monitoring model based on multi-source remote sensing data. Trans. Chin. Soc. Agric. Eng. (Trans. CSAE) 2014, 30, 126–132, (In Chinese with English abstract). [Google Scholar]
  23. Zhang, J.; Shen, R.; Guo, J. A study of applicaiton of different data mining methods in integrated drought monitoring. Acta Agric. Univ. Jiangxiensis 2017, 39, 1045–1056, (In Chinese with English abstract). [Google Scholar]
  24. Liu, X.; Zhu, X.; Zhang, Q.; Yang, T.; Pan, Y.; Sun, P. A remote sensing and artificial neural network-based integrated agricultural drought index: Index development and applications. Catena 2020, 186, 104394. [Google Scholar] [CrossRef]
  25. Shen, R.; Guo, J.; Zhang, J.; Li, L. Construction of a drought monitoring model using the random forest based remote sensing. J. Geo-Inf. Sci. 2016, 19, 125–133, (In Chinese with English abstract). [Google Scholar]
  26. Rhee, J.; Im, J.; Carbone, G.J. Monitoring agricultural drought for arid and humid regions using multi-sensor remote sensing data. Remote Sens. Environ. 2010, 114, 2875–2887. [Google Scholar] [CrossRef]
  27. Zuo, D.; Cai, S.; Xu, Z.; Peng, D.; Kan, G.; Sun, W.; Pang, B.; Yang, H. Assessment of meteorological and agricultural droughts using in-situ observations and remote sensing data. Agric. Water Manag. 2019, 222, 125–138. [Google Scholar] [CrossRef]
  28. Sun, L.; Wang, F.; Li, B.; Chen, X. Study on Drought Monitoring of Wuling Mountain Area Based on Multi-source Data. Trans. Chin. Soc. Agric. Mach. 2014, 45, 246–252, (In Chinese with English abstract). [Google Scholar]
  29. Zhang, J.; Liu, Z.; Wang, J.; He, Y.; Luo, H. Construction and validation of comprehensive drought monitoring model in Southwest China. Trans. Chin. Soc. Agric. Eng. (Trans. CSAE) 2017, 33, 102–107, (In Chinese with English abstract). [Google Scholar]
  30. Hao, C.; Zhang, J.; Yao, F. Combination of multi-sensor remote sensing data for drought monitoring over Southwest China. Int. J. Appl. Earth Obs. 2015, 35, 270–283. [Google Scholar] [CrossRef]
  31. Liu, R.; Wang, Y.; Zhu, Z.; Fang, W.; Ma, Z. Risk assessment of climatic drought for winter wheat in Henan. Agric. Res. Arid Areas 2007, 25, 1–4, (In Chinese with English abstract). [Google Scholar]
  32. Huang, J.; Zhuo, W.; Li, Y.; Huang, R.; Sedano, F.; Su, W.; Dong, J.; Tian, L.; Huang, Y.; Zhu, D.; et al. Comparison of three remotely sensed drought indices for assessing the impact of drought on winter wheat yield. Int. J. Digit. Earth 2020, 13, 504–526. [Google Scholar] [CrossRef]
  33. Li, Y.; Xu, X.; Li, Y. Henan Geography; Beijing Normal University Press: Beijing, China, 2010. (In Chinese) [Google Scholar]
  34. Shi, B.; Zhu, X.; Hu, Y.; Yang, Y. Drought characteristics of Henan province in 1961-2013 based on Standardized Precipitation Evapotranspiration Index. J. Geogr. Sci. 2017, 27, 311–325. [Google Scholar] [CrossRef]
  35. China Meteorological Data Service Center. Available online: http://data.cma.cn/ (accessed on 26 March 2020).
  36. Henan Province Bureau of Statistics. Available online: http://www.ha.stats.gov.cn (accessed on 26 March 2020).
  37. Zhu, Z.; Liu, R.; Fang, W.; Wang, Y. Evaluation indices of drought of winter wheat in North China. J. Nat. Disaters 2003, 12, 145–150, (In Chinese with English abstract). [Google Scholar]
  38. National Aeronautics and Space Administration. Available online: https://ladsweb.modaps.eosdis.nasa.gov/search/ (accessed on 26 March 2020).
  39. National Snow and Ice Data Center. Available online: https://nsidc.org/data/search/ (accessed on 26 March 2020).
  40. Karnieli, A.; Agam, N.; Pinker, R.T.; Anderson, M.; Imhoff, M.L.; Gutman, G.G.; Panov, N.; Goldberg, A. Use of NDVI and Land Surface Temperature for Drought Assessment: Merits and Limitations. J. Clim. 2010, 23, 618–633. [Google Scholar] [CrossRef]
  41. Peng, Q.; Wang, R.; Jiang, Y.; Wu, X. Adaptability of drought situation monitor in Xinjiang with the NDVI-LST index. Acta Ecol. Sin. 2018, 38, 4694–4703, (In Chinese with English abstract). [Google Scholar]
  42. Zhao, G.; Li, X.; Li, B. An Overview on Agricultural Drought Monitoring Methods Based on Land Surface Temperature and Vegetation Index Feature Space. Res. Soil Water Conserv. 2010, 17, 245–250, (In Chinese with English abstract). [Google Scholar]
  43. MODIS Vegetation Index (MOD13) C5 User’s Guide. Available online: https://www.ctahr.hawaii.edu/grem/mod13ug/index.html (accessed on 26 March 2020).
  44. Kogan, F.N. Application of vegetation index and brightness temperature for drought detection. Adv. Space Res. 1995, 15, 91–100. [Google Scholar] [CrossRef]
  45. Kogan, F.N. Satellite-Observed Sensitivity of World Land Ecosystems to El Niño/La Niña. Remote Sens. Environ. 2000, 74, 445–462. [Google Scholar] [CrossRef]
  46. Carlson, T.N.; Gillies, R.R.; Perrye, E.M. A method to make use of thermal infrared temperature and NDVI measurements to infer surface soil water content and fractional vegetation cover. Remote Sens. Rev. 1994, 9, 161–173. [Google Scholar] [CrossRef]
  47. Wang, P.; Gong, J.; Li, X. Vegetation temperature condition index and its application for drought monitoring. Geometics Inf. Sci. Wuhan Univ. 2001, 26, 412–418, (In Chinese with English abstract). [Google Scholar]
  48. Lin, Q.; Wang, P.; Zhang, S.; Liu, J.; Li, L. Drought Monitoring and Category of Vegetation Temperature Condition Index Using Aqua-MODIS Data. Remote Sens. Inf. 2014, 29, 67–72, (In Chinese with English abstract). [Google Scholar]
  49. Vicente-Serrano, S.M.; Beguería, S.; López-Moreno, J.I. A Multiscalar Drought Index Sensitive to Global Warming: The Standardized Precipitation Evapotranspiration Index. J. Clim. 2010, 23, 1696–1718. [Google Scholar] [CrossRef] [Green Version]
  50. Wang, H.; Rogers, J.C.; Munroe, D.K. Commonly Used Drought Indices as Indicators of Soil Moisture in China. J. Hydrometeorol. 2015, 16, 1397–1408. [Google Scholar] [CrossRef]
  51. Liu, X.; Zhu, X.; Pan, Y.; Bai, J.; Li, S. Performance of different drought indices for agriculture drought in the North China Plain. J. Arid Land 2018, 10, 507–516. [Google Scholar] [CrossRef] [Green Version]
  52. Wang, Q.; Shi, P.; Lei, T.; Geng, G.; Liu, J.; Mo, X.; Li, X.; Zhou, H.; Wu, J. The alleviating trend of drought in the Huang-Huai-Hai Plain of China based on the daily SPEI. Int. J. Climatol. 2015, 35, 3760–3769. [Google Scholar] [CrossRef]
  53. Allen, R.G.; Pereira, L.S.; Raes, D.; Smith, M. Crop Evapotranspiration—Guidelines for Computing Crop Water Requirements-FAO Irrigation and drainage paper 56; Food and Agriculture Organization of the United Nations: Rome, Italy, 1998. [Google Scholar]
  54. The R Project for Statistical Computing. Available online: https://cran.r-project.org/web/packages/SPEI/ (accessed on 26 March 2020).
  55. Zhang, C.; Liu, H.; Song, Y.; Liao, Y.; Duan, J.; Cai, W.; Wang, S. Grade of Meteorological Drought (GB/T 20481-2017); Standards Press of China: Beijing, China, 2017. (In Chinese) [Google Scholar]
  56. Jiao, W.; Tian, C.; Chang, Q.; Novick, K.A.; Wang, L. A new multi-sensor integrated index for drought monitoring. Agric. For. Meteorol. 2019, 268, 74–85. [Google Scholar] [CrossRef] [Green Version]
  57. Huang, J.; Gómez-Dans, J.L.; Huang, H.; Ma, H.; Wu, Q.; Lewis, P.E.; Liang, S.; Chen, Z.; Xue, J.; Wu, Y.; et al. Assimilation of remote sensing into crop growth models: Current status and perspectives. Agric. For. Meteorol. 2019, 276–277, 107609. [Google Scholar] [CrossRef]
  58. Zhuo, W.; Huang, J.; Li, L.; Zhang, X.; Ma, H.; Gao, X.; Huang, H.; Xu, B.; Xiao, X. Assimilating Soil Moisture Retrieved from Sentinel-1 and Sentinel-2 Data into WOFOST Model to Improve Winter Wheat Yield Estimation. Remote Sens. (Basel) 2019, 11, 1618. [Google Scholar] [CrossRef] [Green Version]
Figure 1. Distribution of meteorological and agrometeorological stations and winter wheat planting areas in Henan Province of China.
Sustainability 12 02801 g001
Figure 2. Flowchart of drought evaluation of winter wheat based on multi-source data. AMSR-E: Advanced Microwave Scanning Radiometer for EOS; MODIS: Moderate-Resolution Imaging Spectroradiometer; VHI: vegetation health index; VSWI: vegetation supply water index; VTCI: vegetation temperature condition index; SPEI1, SPEI2, and SPEI3: 10-day, 20-day, and 30-day standard precipitation evapotranspiration index, respectively.
Sustainability 12 02801 g002
Figure 3. SPEI3 distribution and drought events during winter wheat growth periods in 2003–2011 in Henan Province. Note: Years on vertical axis represent growth periods from one year to the next year; e.g., 2003 indicates winter wheat growth period from winter 2002 to summer 2003. Horizontal axis represents 10-day time interval, indicating early, middle, and late 10-day periods in each month. Colored squares represent SPEI values. Circle, plus, and diamond in colored squares represent mild, moderate, and severe drought, respectively.
Sustainability 12 02801 g003
Figure 4. Correlation between drought indices and relative meteorological yield of winter wheat of Henan Province in individual and whole growth periods.
Sustainability 12 02801 g004
Table 1. Correlation between SPEIs and relative soil moisture of interpolating and interpolated stations.
StationsSoil MoistureSPEI1SPEI2SPEI3
RpRpRp
12 interpolating stationsRSM10 (n = 2878)0.426<0.0010.506<0.0010.501<0.001
RSM20 (n = 2872)0.316<0.0010.419<0.0010.439<0.001
RSM50 (n = 2872)0.103<0.0010.185<0.0010.221<0.001
5 interpolated stationsRSM10 (n = 1340)0.413<0.0010.490<0.0010.491<0.001
RSM20 (n = 1333)0.300<0.0010.384<0.0010.393<0.001
RSM50 (n = 1333)0.155<0.0010.206<0.0010.222<0.001
Note: RSM10: 10 cm relative soil moisture; RSM20: 20 cm relative soil moisture; RSM50: 50 cm relative soil moisture; n: sample number; R: correlation coefficient; p: p-value.
Table 2. Division of winter wheat growth period in Henan Province.
Growth PeriodAbbreviationTime Range
Sowing–emergenceS-EMid to late October
Emergence–tilleringE-TLate October to mid November
Tillering–stop growthT-SMid November to mid December
Stop growth–returning greenS-RMid December to late February
Returning green–jointingR-JLate February to late March
Jointing–headingJ-HLate March to late April
Heading–milk ripeningH-MLate April to late May
Milk ripening–maturityM-MLate May to early June
Table 3. Drought classification based on SPEI.
Drought LevelSPEI Value
No drought−0.5 < SPEI
Mild drought−1.0 < SPEI ≤ −0.5
Moderate drought−1.5 < SPEI ≤ 1.0
Severe drought−2.0 < SPEI ≤ −1.5
Extreme droughtSPEI ≤ −2.0
Table 4. Frequency of drought occurrence in growth periods of winter wheat during 2003–2011.
Growth PeriodS-EE-TT-SS-RR-JJ-HH-MM-M
Mild drought incidence (%)33.327.822.21918.514.818.522.2
Moderate drought incidence (%)5.611.111.19.522.214.83.70
Severe drought incidence (%)003.71.607.43.70
Note: WGP: whole growth period; S-E: sowing–emergence stage; E-T: emergence–tillering stage; T-S: tillering–stop growth stage; S-R: stop growth–returning green stage; R-J: returning green–jointing stage; J-H: jointing–heading stage; H-M: heading–milk ripening stage; M-M: milk ripening–maturity stage. The phenophase of later tables and figures are abbreviated as above.
Table 5. Correlation coefficients between relative soil moisture and MODIS drought index during individual and whole growth periods.
Growth PeriodSample NumberVHIVSWIVTCI
RSM10RSM20 RSM50RSM10RSM20RSM50RSM10RSM20RSM50
WGP25620.110 **0.053 **0.033−0.206 **−0.155 **−0.126 **0.079 **0.000−0.105 **
S-E2040.285 **0.1310.0350.0920.033−0.0190.295 **0.068−0.004
E-T239−0.048−0.0240.035−0.196 **−0.104−0.0090.363 **0.302 **0.064
T-S3580.320 **0.207 **0.079−0.0700.0850.0790.444 **0.341 **0.038
S-R724−0.044−0.106 **0.037−0.151 **−0.0090.0480.161 **0.075 *−0.042
R-J3780.0680.0350.077−0.0220.0620.0420.183 **0.156 **0.115 *
J-H3150.126 *0.0690.008−0.0270.0800.0580.212 **0.237 **0.114 *
H-M3060.324 **0.290 **0.146 *0.0620.178 **0.217 **0.305 **0.294 **0.168 **
M-M380.2850.332 *0.2510.1660.1930.2250.2960.2540.080
Note: ** p-value of correlation coefficient < 0.01; * p-value of correlation coefficient < 0.05.
Table 6. Correlation coefficient between relative soil moisture and SPEI during individual and whole growth periods.
Growth PeriodSample NumberSPEI1SPEI2SPEI3
RSM10RSM20RSM50RSM10RSM20RSM50RSM10RSM20RSM50
WGP28830.366 **0.240 **0.041 *0.433 **0.326 **0.093 **0.422 **0.335 **0.116 **
S-E2120.207 **0.1040.0280.307 **0.159 *0.1130.270 **0.184 **0.162 *
E-T2540.513 **0.333 **0.1200.584 **0.460 **0.208 **0.621 **0.476 **0.204 **
T-S3970.488 **0.335 **0.0110.560 **0.415 **0.0740.556 **0.448 **0.148 *
S-R8300.235 **0.094 **−0.0420.346 **0.166 **−0.0350.379 **0.197 **−0.032
R-J4010.446 **0.372 **0.168 **0.541 **0.486 **0.222 **0.515 **0.496 **0.218 **
J-H3750.340 **0.277 **0.0840.374 **0.387 **0.163 **0.323 **0.359 **0.174 **
H-M3740.506 **0.376 **0.116 *0.558 **0.487 **0.208 **0.481 **0.455 **0.228 **
M-M400.3070.1760.1050.566 **0.507 **0.323 *0.512 **0.473 **0.343 *
Note: ** p-value of correlation coefficient < 0.01; * p-value of correlation coefficient < 0.05.
Table 7. Correlation coefficient between AMSR-E soil moisture and MODIS drought index during individual and whole growth periods.
Growth PeriodSample NumberVHIVSWIVTCI
WGP3645−0.042 *0.051 **0.217 **
S-E3060.147 *−0.151 **0.205 **
E-T306−0.342 **−0.438 **0.168 **
T-S453−0.029−0.457 **0.312 **
S-R1050−0.046−0.135 **0.022
R-J4590.136 **−0.0490.148 **
J-H459−0.0390.0220.014
H-M459−0.093 *0.0910.132 **
M-M153−0.372 **−0.0490.034
Note: ** p-value of correlation coefficient < 0.01; * p-value of correlation coefficient < 0.05.
Table 8. Variable selection and goodness-of-fit analysis of trivariate linear regression for individual and whole growth periods.
Growth PeriodVariablesR2Radj2Standard DeviationF-value p-value
WGPSPEI1, SPEI2, VHI0.2820.2642.99420.683<0.001
S-ESPEI3, VHI, VTCI0.0990.0763.3535.7960.001
E-TAMSR-E SM, SPEI1, VTCI0.0930.0703.3655.3740.002
T-SSPEI1, SPEI2, SPEI30.1610.1403.23510.140<0.001
S-RSPEI3, VSWI, VTCI0.0440.0193.4552.3980.070
R-JSPEI2, SPEI3, VHI0.2120.1923.13714.137<0.001
J-HSPEI2, SPEI3, VHI0.1860.1663.18712.057<0.001
H-MSPEI1, SPEI2, SPEI30.1970.1773.16612.927<0.001
M-MSPEI1, SPEI3, VTCI0.1800.1593.20011.534<0.001
Table 9. Correlation coefficient between MODIS LST and EVI during individual and whole growth periods.
Growth PeriodSample NumberR
WGP25620.248 **
S-E2040.092
E-T2390.244 **
T-S3580.265 **
S-R7240.142 **
R-J3780.118 *
J-H315−0.092
H-M306−0.032
M-M380.077
Note: ** p-value of correlation coefficient < 0.01; * p-value of correlation coefficient < 0.05.
Table 10. Correlation coefficient between MODIS LST, EVI, and relative soil moisture during individual and whole growth periods.
Growth PeriodSample NumberLSTEVI
WGP2562−0.193 **−0.223 **
S-E204−0.0980.09
E-T239−0.209 **−0.205 **
T-S358−0.208 **−0.089
S-R724−0.053−0.155 **
R-J378−0.184 **−0.034
J-H315−0.046−0.035
H-M306−0.0910.049
M-M38−0.1830.146
Note: ** p-value of correlation coefficient < 0.01.