Article

The Drivers of Sustainable Apparel and Sportswear Consumption: A Segmented Kano Perspective

1
Department of Marketing and Services, University of Bayreuth, Universitätsstraße 30, 95447 Bayreuth, Germany
2
Adidas AG, Adi-Dassler-Straße 1, 91074 Herzogenaurach, Germany
*
Author to whom correspondence should be addressed.
Sustainability 2020, 12(7), 2788; https://doi.org/10.3390/su12072788
Submission received: 30 January 2020 / Revised: 25 March 2020 / Accepted: 31 March 2020 / Published: 1 April 2020
(This article belongs to the Special Issue Sustainable Clothing Consumption: Circular Use of Apparel)

Abstract

:
The steady increase of sustainable consumer behavior leads companies to strengthen their efforts to become socially and ecologically more sustainable. Particularly in the clothing and footwear industry, more and more companies are aware of their need to fundamentally adapt the way they create value. Sustainability offerings are developed, e.g., usage of upcycled materials (e.g., ocean plastic), circular business models (e.g., decomposition of returned products into components for new ones), as well as adapted product ranges (e.g., smaller or with fewer fashion cycles). However, it is frequently unclear in advance, which offerings will increase (or decrease) satisfaction and, consequently, drive (or not drive) sustainable consumption. The application of a segmented Kano perspective in an apparel and sportswear context that helps to answer these questions is presented: 17 potential offerings were assessed by a sample of 490 consumers. Our analysis demonstrates the usefulness of this methodology and that returning used products (to recycle them), discounts for buying sustainable products, sustainability level indicators, and biobased materials are highly attractive. However, the responsiveness varies across the derived consumer segments, from being decisive or attractive to indifferent or reverse. As assumed, gender and attitude towards sustainability are good predictors for segment membership.

1. Introduction

Conventional business models are frequently linked to sales and profit maximization by satisfying consumers’ needs and considering resources as ever inexhaustible [1,2]. Thereby, technological advances have allowed consumption levels to increase steadily. This phenomenon is particularly apparent in the clothing and footwear industry: the manufacturing of these products—made using the same materials and equipment—have shifted to lower-cost countries. The quality and price have declined, and thus, the lifespans of products shortened [2,3]. Such so-called fast fashion, i.e., clothing and footwear in contemporary styles produced within reduced lead times to get products faster from concepts to consumers [4], implies consequent obsolescence, impulse purchasing, and subsequently, an excessive usage of valuable natural resources [5]. Extremely fast fashion cycles cause an environmental burden by negatively impacting, e.g., (ground-)water, soil, and air negatively [2]: the clothing and footwear industry has a significant environmental footprint, polluting approximately 200 tons of water per ton of fabric [6], causing tons of CO 2 emissions [2,7], and producing a growing amount of clothing and footwear waste [2].
The environmental consequences of the current “throwaway” society and further, the increasing consciousness of its negative environmental impacts and its subsequent ethical issues have led the literature to investigate sustainable consumer behavior. For example, research focused on how to shift consumer behaviors to enhance sustainable consumption [8], how to encourage consumers to recycle [9,10,11,12], motives and antecedents of consumers’ sustainable purchase behavior [13], or a proposed holistic customer-centric approach of mindful consumption [14]. Interestingly, a significant part of that research body has particularly focused on the consumption of garments since the clothing and footwear industry has a large-scale impact on the environment. In this context, consumers can reduce their negative environmental impact in every consumption phase from acquisition, use, and care, to disposal [15]. Consumption levels can be decreased by prolonging lifespans by repairing or repurposing clothing, by using collaborative consumption concepts, or by establishing design strategies to extend fashion life cycles [7,16,17,18,19].
Thus, antecedents and consequences of eco-conscious (the terms eco-conscious, eco-friendly, environmentally friendly, pro-environmental, and sustainable will be used interchangeably in this paper) consumer behavior, in general, are well understood, and several concepts for sustainable clothing and footwear consumption have been proposed by existing literature. However, most consumers still exhibit an attitude–behavior gap regarding eco-conscious consumption, i.e., albeit they pretend to have pro-environmental attitudes and consciousness [20], they frequently struggle to translate this into green actions and, hence, do not behave sustainably [21,22,23]. Apparently, besides some drivers, there are significant barriers inhibiting consumers from combining their clothing and footwear consumption habits with pro-environmental behavior; remedial offerings are needed. Thus, research still lacks a comprehensive understanding of how consumers assess sustainability in a clothing and footwear context and—more specifically—how different sustainability offerings are accepted by consumers.
In order to fill this research gap, we investigated these drivers, barriers, and remedies. Then, we concretized them in an apparel and sportswear context with respect to aspects like product range, labeling (i.e., “traffic light” models as well as quality seals), processes (return and discount policies), and materials, and applied the Kano model [24] to a sample of typical apparel and sportswear consumers (n = 490). They were asked to evaluate 17 concretized offerings as attractive, indifferent, one-dimensional, must-be, or reverse. Moreover, a segmented Kano perspective [25,26,27] was developed to show that segment-specific differences in these evaluations exist and that segment membership can be related to background variables. Based on these analyses, recommendations regarding the prioritization of these offerings are given. The resulting insights might help to overcome the attitude–behavior gap by assessing the segment-specific impact of surveyed offerings on sustainable apparel and sportswear consumption.
The remaining paper is structured as follows: In Section 2, we review preceding literature on drivers, barriers, and remedies for sustainable clothing and footwear consumption. Then, in Section 3, the methodology to categorize sustainability offerings, the use case selection in the apparel and sportswear industry, and the conceptualization of the Kano questionnaire, as well as the descriptive statistics of the customer sample, are presented. Section 4 displays the derived results, including the segment-specific findings regarding 17 sustainability offerings. Then, in Section 5, the theoretical contribution, as well as limitations and directions for future research, are provided. The paper closes with conclusions in Section 6.

2. Theoretical Background: Sustainable Clothing and Footwear Consumption

2.1. Drivers of Sustainable Clothing and Footwear Consumption

Sustainability in an organizational context is mostly referred to as the triple bottom line concept. It accounts for social, environmental, and economic aspects [28]: The social facet pertains to fair business practices implying the well-being of corporate, labor, community, and region in which the organization operates. The environmental bottom line refers to environmental practices that benefit (or do not harm, respectively) the planet and minimize the organization’s environmental impact, including, e.g., life cycle assessment of products. Further, the economic bottom line can be defined as the economic value created by the organization after the costs of all inputs are deducted. Today, a growing number of companies, also in the clothing and footwear industry, adopts and applies this concept as an accounting tool, which allows us to evaluate the company’s performance in a broader perspective, not only with respect to the traditional return on investment by manufacturing and selling goods, but further with respect to the impact on its customers’ sustainable consumption.
However, due to a lack of industry standards, sustainable clothing and footwear consumption is especially not uniformly termed and defined [29,30]. Within literature, terms like eco-conscious or eco-friendly [15,31,32,33], ethical [3,29,34,35], green [36,37], organic [38], and slow [39] are used frequently and interchangeably. Moreover, although mostly associated with eco-conscious logistics and manufacturing aspects, sustainable consumption extends well beyond the pre-purchase and purchase phase by additionally comprising, e.g., cleansing or recycling of produced clothing and footwear [3,40]. At its core, it is assumed that sustainable clothing and footwear consumption implies pro-environmental actions at every phase from pre-purchase, purchase, to post-purchase [30,41,42], comprising—inter alia—acquisition, storage, usage and care (e.g., laundering and cleaning, respectively), maintenance (e.g., repairing), and discard (e.g., recycling, re-usage, or disposal) [16,32].

2.1.1. Drivers in the Pre-Purchase and Purchase Phase

Regarding the environmental impact of these individual phases, opinions within the literature are diverging. The steadily growing volume of clothing and footwear consumption, low employee wages, poor working conditions, and excessive pesticide use are some of the key issues during the early phases of the clothing life cycle [29,43,44]. Thus, sustainable behavior during this pre-purchase and purchase phases implies either purchasing products made of environmentally preferable, recycled, upcycled, or biobased fibers produced under fair conditions, purchasing from second-hand stores or collaborative platforms, or reducing the overall consumption level [3,45,46].
Further, design strategies have been proposed for manufacturers to prolong the clothing and footwear lifespan: Niinimäki and Hassi [2] developed different design and manufacturing strategies to decrease the environmental impact of the clothing and footwear industry by focusing on the customers’ values and needs. Hirscher et al. [47] considered do-it-yourself, do-it-together, and participatory design strategies for value co-creation during the manufacturing process. Niinimäki [33] stressed that manufacturers are hardly aware of their consumers’ needs and wants with regard to the aesthetics of eco-fashion, and, thus, such clothing and footwear often only appeal to a limited range of potential customers.
Kim and Kang [48] found social capital, i.e., an intangible force that unites society by transforming individuals into members of a community with shared assumptions and a sense of the common good, to have a strong impact on the purchase intention of sustainable fashion.

2.1.2. Drivers in the Post-Purchase Phase

Nevertheless, research has focused mainly on environmental issues occurring in the post-purchase phase of the clothing and footwear life cycle. More specifically, the usage and care phase is assumed to cause a significant overall negative impact on the environment: particularly in the washable clothing case, optimizations regarding the laundering process are suggested to decrease energy, water, and wax consumption [40,45,49]. For example, Goworek et al. [3] found that consumers were not willing to wash their clothes at a lower temperature in case this implies compromised cleanliness.
Another major strand of literature considers the discard phase to harm the environment the most and, thus, aims at prevention of disposal since, e.g., prolonging lifespans as well as reusing (including cleaning or repairing), reuse through organizations, and material recycling yield the highest energy and CO 2 savings: Laitala [17] found the most common reasons for disposal to be wear and tear, poor fit, boredom, and a lack of storage space but suggested to deliver the apparel for reuse (e.g., donating it). Similar results were yielded by Lang et al. [50], who found that fashion trend sensitivity, shopping frequency, higher incomes, younger age, and being female are positively correlated to clothing disposal, and, hence, a behavioral shift is needed. Goworek et al. [7] investigated life cycle assessment to generate clothing longevity via design, maintenance, and reuse to prevent early disposal. Morgan and Birtwistle [42] revealed that young female consumers are unaware of the need to recycle their clothing, and, thus, demand more information and clarification by, e.g., media. This finding was replicated by Birtwistle and Moore [44], indicating that clothing loses intrinsic value and, hence, this encourages consumers to replace or dispose their apparel at an early phase during the clothing life cycle. Goworek et al. [3] found a lack of consciousness among consumers regarding the facilities available to enable them to adopt more sustainable habits in terms of disposal, and, therefore, consumer clarification is needed. Diddi et al. [51] even demanded the inclusion of education of repair skills in high school curriculums to create a “repair mindest” among young consumers to address the disposal culture. Further, Hu et al. [52] proposed a closed-loop supply chain to adopt the circular use of clothing.

2.2. Barriers of Sustainable Clothing and Footwear Consumption and How to Avoid Them

Despite the literature’s suggestions regarding life cycle assessment to minimize the environmental impact of the clothing and footwear industry, consumers still exhibit an attitude–behavior gap [53], i.e., although they pretend to have pro-environmental attitudes, they frequently do not behave sustainably. Drawing on Stern and Oskamp [54] and the subsequent work of Guagnano et al. [55], pro-environmental behaviors are the outcome of both internal (i.e., personal attitudes and values, beliefs, and knowledge) and external (i.e., macro-level forces outside of an individual’s control, e.g., social institutions, economic forces, or physical structures) factors. Thereby, external conditions act as drivers of or barriers to certain behaviors (i.e., physical, financial, legal, or social sources). An individual’s behaviors are consistent with her/his attitudes and values when external conditions are neutral. However, with external conditions making the resulting behavior, e.g., difficult, inconvenient, time-consuming, or expensive, the behavior does not then reflect one’s attitudes or values [54,55]. Consequently, previous literature identified internal and external barriers to sustainable behavior.

2.2.1. Internal Barriers and Remedies

Lacking knowledge and excessive amounts of complex information about sustainability were found to be internal inhibitors: consumers with greater environmental knowledge were found more likely to engage in pro-environmental purchase behaviors in general [7,34,56,57] and, more specifically, in eco-conscious clothing and footwear consumption [32,58,59]. Consumers frequently require more information and better education of, e.g., the materials used for production [35,60,61], since they do not feel capable of making appropriate choices regarding eco-conscious clothing and footwear [29,62]. To overcome the barrier of limited consumer knowledge, ecolabels or seals can be used to provide information for consumers and to indicate a product’s environmental impact and sustainability level. Nevertheless, many different ecolabels are frequently associated with even more information and, thus, might inhibit the purchasing process [36]. Besides, Bly et al. [63] indicated that emotional associations of trust and authenticity rank as more sustainable than ecolabels.
Apart from limited knowledge, the lack of environmental concerns in consumers’ attitudes [38,64], an overall negative attitude towards sustainable products [32,38,65], and differing values [66] might be internal barriers to sustainable apparel consumption.
Another barrier to reduce consumption levels are the perceived high search costs (i.e., perceived time and effort [67]) of consumers associated with the maintenance of clothing and footwear by extending lifespans. For example, using collaborative consumption principles or donating [17,19,46,68,69], repairing or cleansing services [3,15], or even recycling (i.e., creating a circular economy) are environmentally friendly alternatives to disposal and potential drivers to enhance sustainable consumption.
Generally, several studies [70,71,72,73] indicated that men are less likely than women to embrace environmentally friendly behaviors. This so-called gender gap is sometimes referred to as personality differences between the sexes [70]. It is assumed that women tend to be more prosocial, altruistic, and empathetic [73], to take a future time perspective [72], or to bother more regarding health and safety [74]. Brough et al. [71] found the alternative explanation that the gender gap might (partially) be due to the many men’s assumption that “greenness” and “femininity” are cognitively linked and that some of them subsequently—in order to maintain their gender-identity—avoid sustainable behaviors. As a consequence, Brough et al. [71] proposed that the men’s willingness to engage in sustainable behavior can be influenced by affirming their masculinity and, further, by using masculine rather than conventional green branding.

2.2.2. External Barriers and Remedies

External barriers to pro-environmental clothing and footwear consumption arise particularly from potential consequences of sustainability on the manufacturers’ product ranges: sustainability frequently implies smaller product ranges or fewer fashion cycles and collections, respectively, and hence, does not meet consumers’ demand [32,39]. Further, sustainable apparel is frequently perceived as unfashionable or unstylish by consumers [32,58]. Consumers consider the appearance of sustainable fashion as unattractive and, thus, such clothing and footwear does not suit their wardrobe needs nor meet their aesthetic needs [29,75]. Price, quality (with respect to materials and craftmanship), and appearance are even more important criteria to many consumers than ethical aspects [29]. The lack of aesthetic appearance is stressed by the restriction of pro-environmental clothing to natural materials [30], and thus, only a few different styles (e.g., different colors) are available.
Aside from product range consequences, the price of sustainable products might constrain pro-environmental behavior [29,32,38,76]: According to Joergens [29], consumers have limited choice in eco-conscious clothing as they perceive the prices as not comparable to low-cost garments. Since there have been only a few technological advances regarding the mass production of sustainable clothing and footwear, eco-conscious garments carry higher prices than conventional products, and hence, they are unaffordable for many consumers [32]. Collaborative consumption platforms [19,46,77] or manufacturers discounting sustainable purchases (e.g., for returning used clothing and footwear to be recycled into components for new garments) might be suitable alternatives to support eco-conscious clothing consumption.
In the following, we discuss our research design, including the Kano methodology, and how this methodology was applied to measure the impact of the discussed drivers and remedies using the apparel and sportswear industry as a demonstration example.

3. Research Design: A Segmented Kano Perspective for the Apparel and Sportswear Industry

3.1. Kano Model and the Segmented Kano Perspective

The Kano model [24] is a commonly applied approach to investigate the relationship between the performance or the existence of product or service attributes (i.e., components, elements, features, technologies; in our case: sustainability offerings) and customer satisfaction. Moreover, it allows us to predict customer satisfaction—and, consequently, behavioral change—when product or service attributes are varied. For instance, Ingaldi and Ulswicz [78] tested whether sustainability offerings (e.g., re-usable packaging, participation in ecological programs) drive customer satisfaction within an online shop for organic products in order to increase sustainable consumption. Moreover, Rese et al. [27] investigated which new services and technologies could convince consumers to visit physical fast fashion stores and try on clothes in order to reduce returns caused by ordering not-fitting clothes.
The main idea of our Kano model application is to categorize investigated sustainability offerings with respect to their relationship between their existence and customer satisfaction using the well-known Kano categories [79,80,81]:
  • Offerings categorized as must-be (M) are assumed to be taken for granted by the customer. Existence does not lead to customer satisfaction, but, in contrast, absence leads to customer dissatisfaction.
  • Offerings categorized as one-dimensional (O) is proportional to customer satisfaction: existence leads to customer satisfaction, absence to dissatisfaction.
  • Offerings categorized as attractive (A) are assumed to be not expected by customers. Their existence leads to customer satisfaction and, in contrast, their absence does not lead to customer dissatisfaction. The popularity of these offerings is assumed to be rather short-term and thus, they disappear or turn into must-be offerings.
  • Offerings categorized as indifferent (I) are assumed not to affect customer satisfaction. Hence, neither their existence nor their absence impacts customer satisfaction or dissatisfaction, respectively.
  • The presence of reverse (R) offerings leads to customer dissatisfaction, and their absence leads to customer satisfaction.
  • If none of the above categories can be assumed or assessed, the offerings are categorized as questionable (Q).
Offerings can be classified into these categories based on a customer sample. For each offering, a pair of questions is raised: the first question tests the customer’s reaction if the considered offering is present (functional question), whereas the second question tests the customer’s reaction if the considered attribute is absent (dysfunctional question) [24,79,80]. Ideally, the questions are formulated reflecting the “voice of the customer”, i.e., written in a form that can be easily understood by the customer [82]. For both questions, the potential answers are ordinally scaled and range from 1—“I like it”, 2—“It must be that way”, 3—“I do not mind it” to 4—“I can live with it” and 5—“I do not like it” [79,81,83]. The answers reflect the extent to which customer satisfaction is generated if the offering is available and vice versa, the extent to which dissatisfaction is generated if the offering is absent. Combining both answers, offerings can subsequently be classified into one of the categories by using the Kano table (see Table 1).
The derived individual categorizations can be utilized further by aggregating them across all respondents using the customer satisfaction (CS+) and customer dissatisfaction (CS−) indices [83,84,85]:
CS + = # A + # O # A + # O + # M + # I
CS = # O + # M # A + # O + # M + # I
with # A ,   # I ,   # M ,   and # O   being the categorization frequencies, i.e., number of respondents who classified the offering as attractive, indifferent, must-be, or one-dimensional, respectively.
The indices reflect the proportion of respondents for whom the existence (absence, respectively) of an offering attribute impacts customer satisfaction (customer dissatisfaction, respectively). Additionally, CS− has a minus sign to emphasize the negative effects on customer satisfaction (for historical reasons). For each offering, the satisfaction index is within the range of [0, 1] and for customer dissatisfaction within [−1, 0]. A value close to 1 for CS+ indicates a high proportion of customers among whom satisfaction can be generated, and a value close to −1 indicates a high proportion of respondents among whom dissatisfaction can be generated. The scale mean of 0.5 for CS+ (or −0.5 for CS−, respectively) indicates whether the majority of respondents can be positively (or negatively, respectively) stimulated, yielding a two-dimensional grid with four quadrants:
Attractive   offerings ,   if   0.5 CS + 1   and 0 CS > 0.5  
Indifferent   offerings ,   if   0 CS + < 0.5   and 0 CS > 0.5  
Must - be   offerings ,   if   0 CS + < 0.5   and 0.5 CS 1      
One - dimensional   offerings ,   if   0.5 CS + 1   and 0.5 CS 1  
The respondents classifying the offering as reverse (category R, frequency #R) or questionable (category Q, frequency #Q) are not reflected by the CS+ and CS− indices and the grid since only respondents with”‘strong” assessments are taken into consideration. Thus, aside from the satisfaction indices, we can determine the total strength for each offering, which indicates the proportion of attractive, one-dimensional, and must-be assessments of this offering among all assessments:
Total   Strength = # A + # M + # O # A + # I + # M + # O + # Q + # R
Recently, an alternative to the above-described aggregated analysis has been proposed and applied, the so-called segmented Kano perspective. The respondents are clustered according to their assessments using two-mode metric cluster analysis with respect to their responses to the answers to the functional and dysfunctional questions (see Baier et al. [25] using, e.g., double k-means algorithms) or using one-mode non-metric cluster analysis with respect to the derived categories (see Rese et al. [27] and Baier and Rese [26], using Chiu et al.’s [86] well-known two-step algorithm or—with similar results—k-means after binary dummy coding of the categories). The number of clusters can be determined using the usual Bayesian information criteria with respect to the corresponding likelihood functions. Particularly in the case that highly innovative offerings are investigated, the segmented Kano perspective is preferable since the usual categorizations as attractive or indifferent at the aggregated level are reduced, and consumer segments that are highly receptive can be identified.

3.2. Apparel and Sportswear Industry Use Case Selection, Concretization of the Offerings, Questionnaire

During questionnaire development in order to measure the impact of the discussed offerings on sustainable clothing and footwear consumption, it became apparent that the offerings had to be concretized for a certain industry and product range to gain comparable valid insights.
For this purpose, the selection of the apparel and sportswear industry and the consumption of Adidas sneakers as a use case seemed to be a reasonable choice: within the clothing and footwear industry, apparel and sportswear is a large but still rapidly growing market with worldwide revenue of USD 180.96 billion in 2019 and estimated worldwide revenue of USD 207.79 billion in 2025. Major players are Nike (USD 34.88 billion in 2019), Adidas (USD 23.64 billion), VF Corp. (USD 13.29 billion), Puma (USD 5.08 billion), and Under Armour (USD 4.86 billion). Innovations and sustainability are key factors for success in this market. The competition is high, and, moreover, market boundaries are disappearing and other clothing and footwear companies try to enter the attractive sneaker market. E-commerce is becoming increasingly important. Therefore, omnipresence and a good brand image are essential (see statistics and market overview in https://de.statista.com/themen/1626/sportartikel).
Moreover, sneaker consumption is closely related to clothing consumption, particularly when discussing successful sustainability offerings. Adidas—headquartered in Herzogenaurach, Bavaria (Germany)—recently become famous for selling more than 11 million eco-conscious Parley sneakers in 2019. Aside from these comfortable high-performance shoes, whose prices vary from EUR 89 to EUR 179, the collection further comprises shirts and tights. The whole collection is all made of ocean plastic that has been processed to wool yarn. Currently, Adidas has expanded its eco-conscious efforts further and developed apparel and sportswear made of biobased materials (e.g., biodegradable biopolymers produced in large-scale bioreactors, the material called biosteel) and, moreover, makes use of circular business models in which used and returned products are reutilized as components for new products (see Adidas reports at www.adidas.de or https://m.adidas.de/sustainability-parley-ocean-plastic).
Choosing Adidas sneakers as a case for our investigation and drawing on the extant literature on drivers, barriers, and remedies discussed in Section 2, as well as planned implementations in the apparel and sportswear industry (collected via press releases, newsletters, blogs on the internet), a preliminary list of essential sustainability aspects and offerings to consumers was developed by the authors. Then, this list was discussed with two experts responsible for the product range at a major global apparel and sportswear retailer, three experts responsible for product development, design, and marketing at two major global apparel and sportswear manufacturers, and one expert of a major global material science company. Additionally, two 90-minute workshops with a sample of 42 apparel and sportswear consumers (university students) served to finalize the list, as shown in Table 2, with short descriptions of the sustainability offerings.
Based on Table 2, our sustainability offerings were exemplified and illustrated for a questionnaire using—as discussed—Adidas sneakers for exemplification. Overall the questionnaire was constructed as follows: We first provided a general introduction to the study. Then, the respondents were asked few introductory questions regarding their consumption behavior in general (i.e., the number of sneakers bought per year, willingness to pay for conventional sneakers, purchase behavior regarding sneakers, the importance of different criteria when buying sneakers, and sneaker brands bought in the last three years), her/his perception of sustainable consumption in general (i.e., perceived associations with sustainable consumption, perception of own knowledge regarding sustainability, and inhibitors of purchasing sustainable sneakers), and her/his willingness to pay for sustainable sneakers. The asked criteria when buying sneakers—as well as the list of offerings—were the results of the literature review combined with the expert interviews and consumer workshops. Thus, the criteria, which were identified as most important, were included in the questionnaire: price, quality (i.e., materials and craftmanship), appearance, brand, sustainability, comfort, and longevity.
The main part of the questionnaire was based on the Kano model. The respondents were introduced and made familiar with the specific technique and syntax of functional as well as dysfunctional questions of a Kano model, being asked to declare satisfaction in case of presence and in case of absence of a sustainability offering. The 17 offerings of Table 2 were presented within a fictitious scenario comprising detailed explanations and exemplary presentations and illustrations. The offerings referred to the Adidas sneaker product range (even though it is clear that it could have also been referred to other apparel and sportswear ranges) and were not limited to purchases in the Adidas online shop nor in another online shop, as well as an Adidas physical store or another apparel/sportswear physical store. For many offerings (e.g., colors, traffic lights, removable, hidden, or visible labeling, return or sustainability discount, upcycled, biobased, or recycled materials, and cleansing), the scenario was illustrated using Adidas sneakers as an example. The subsequent part of the survey contained control questions assessing the importance of the 17 sustainability offerings when buying sneakers using a 6-point Likert scale ranging from “I don’t mind it” to “very important” (same scale as the importance questions in the introductory part). The last part included questions regarding demographic data (i.e., age, gender, employment status, place of residence, and monthly income) and boxes to leave comments regarding sustainable consumption behavior in general, the chosen case (Adidas), or the questionnaire design.

3.3. Descriptive Statistics of the Sample of Typical Apparel and Sportswear Consumers

The online questionnaire was spread in various social media channels and several courses at a German university from 17 December 2019 to 20 January 2020. A total of 635 responses were recorded. One hundred forty-five questionnaires (22.83%) were rejected since they had not been completed. This might be due to the length of the survey with an average response time of 18 minutes. Thus, a total of 490 filled-out questionnaires was considered for further analysis. Table 3 outlines the sample’s descriptive statistics. The survey was more often completed by women (56.53% of responses). Briefly, 54.49% of our participants were 15 to 24 years old. Participants, which were 35 to 64 years old, constituted a smaller proportion among the respondents (5.92%). This seems reasonable since these people are less likely to use social media and we distributed our questionnaire in a university. The latter is reflected by the high proportion of students (77.35% of the respondents) participating in the study. The sample reflects, to some extent, the target segment for sneakers (younger than the average population) and Adidas customers (younger and a higher percentage of university students and academics compared to the average population).
We gained further insights into the participants’ consumption behavior with our nine introductory questions. The first portion inquired about their consumption behavior in general: 41.8% of the participants buy 2 to 3 sneakers per year, and 61.0% of the respondents indicated that their willingness to pay for conventional sneakers is around EUR 50 to EUR 99. In addition, 27.8% of the participants buy sneakers when they perceive a need. Moreover, 21.0% of the respondents get inspired during browsing in an online shop. Furthermore, respondents ranked the importance of different sneaker buying criteria on a 6-point Likert scale from “I do not mind” (=1) to “Very important” (=6). The most important buying criteria (in decreasing order) were appearance (mean 5.63; standard deviation (SD) 0.701), comfort (mean 5.16; SD 0.951), and quality (with respect to materials and craftmanship; mean 4.99; SD 0.942). The least important criteria were the sneakers’ sustainability (mean 3.14; SD 1.295), the brand (mean 3.95; SD 1.478), and price (mean 4.27; SD 1.214). The majority of the participants bought Adidas (360 responses, 73.9%) and Nike (325 responses, 66.7%) sneakers within the last three years.
The second portion was about the respondents’ perception of sustainability in general. Participants mainly associate sustainable consumption with purchasing environmentally friendly products (388 responses, 79.2%), purchasing durable and repairable products (309 responses, 63.1%), and purchasing fair trade products (263 responses, 53.7%). Fewer respondents associated sustainable consumption with less purchasing (221 responses, 45.1%), and a few had no idea (n = 15, 3.1%). Regarding the major inhibitors of sustainable consumption behavior, respondents referred to a lack of information about sustainable products (247 responses, 50.4%), high prices (245 responses, 50.0%), few alternatives (n = 206, 42.0%), and everyday routine/habits (202 responses, 41.2%). Additionally, the participants’ willingness to pay for sustainable sneakers was inquired. On average, the respondents would spend EUR 116.53 (mean; SD EUR 15.32) for sustainable sneakers in case a comparable conventional sneaker would cost EUR 100. (Please note that prices for Parley sneakers range between EUR 89 and EUR 179). Hence, the majority exhibit a higher willingness to pay for eco-conscious sneakers than for conventional ones. This is comparable to the findings of Niinimäki [33], who found the willingness to pay for sustainable sneakers to be approximately 10%–14% higher than for ordinary sneakers.

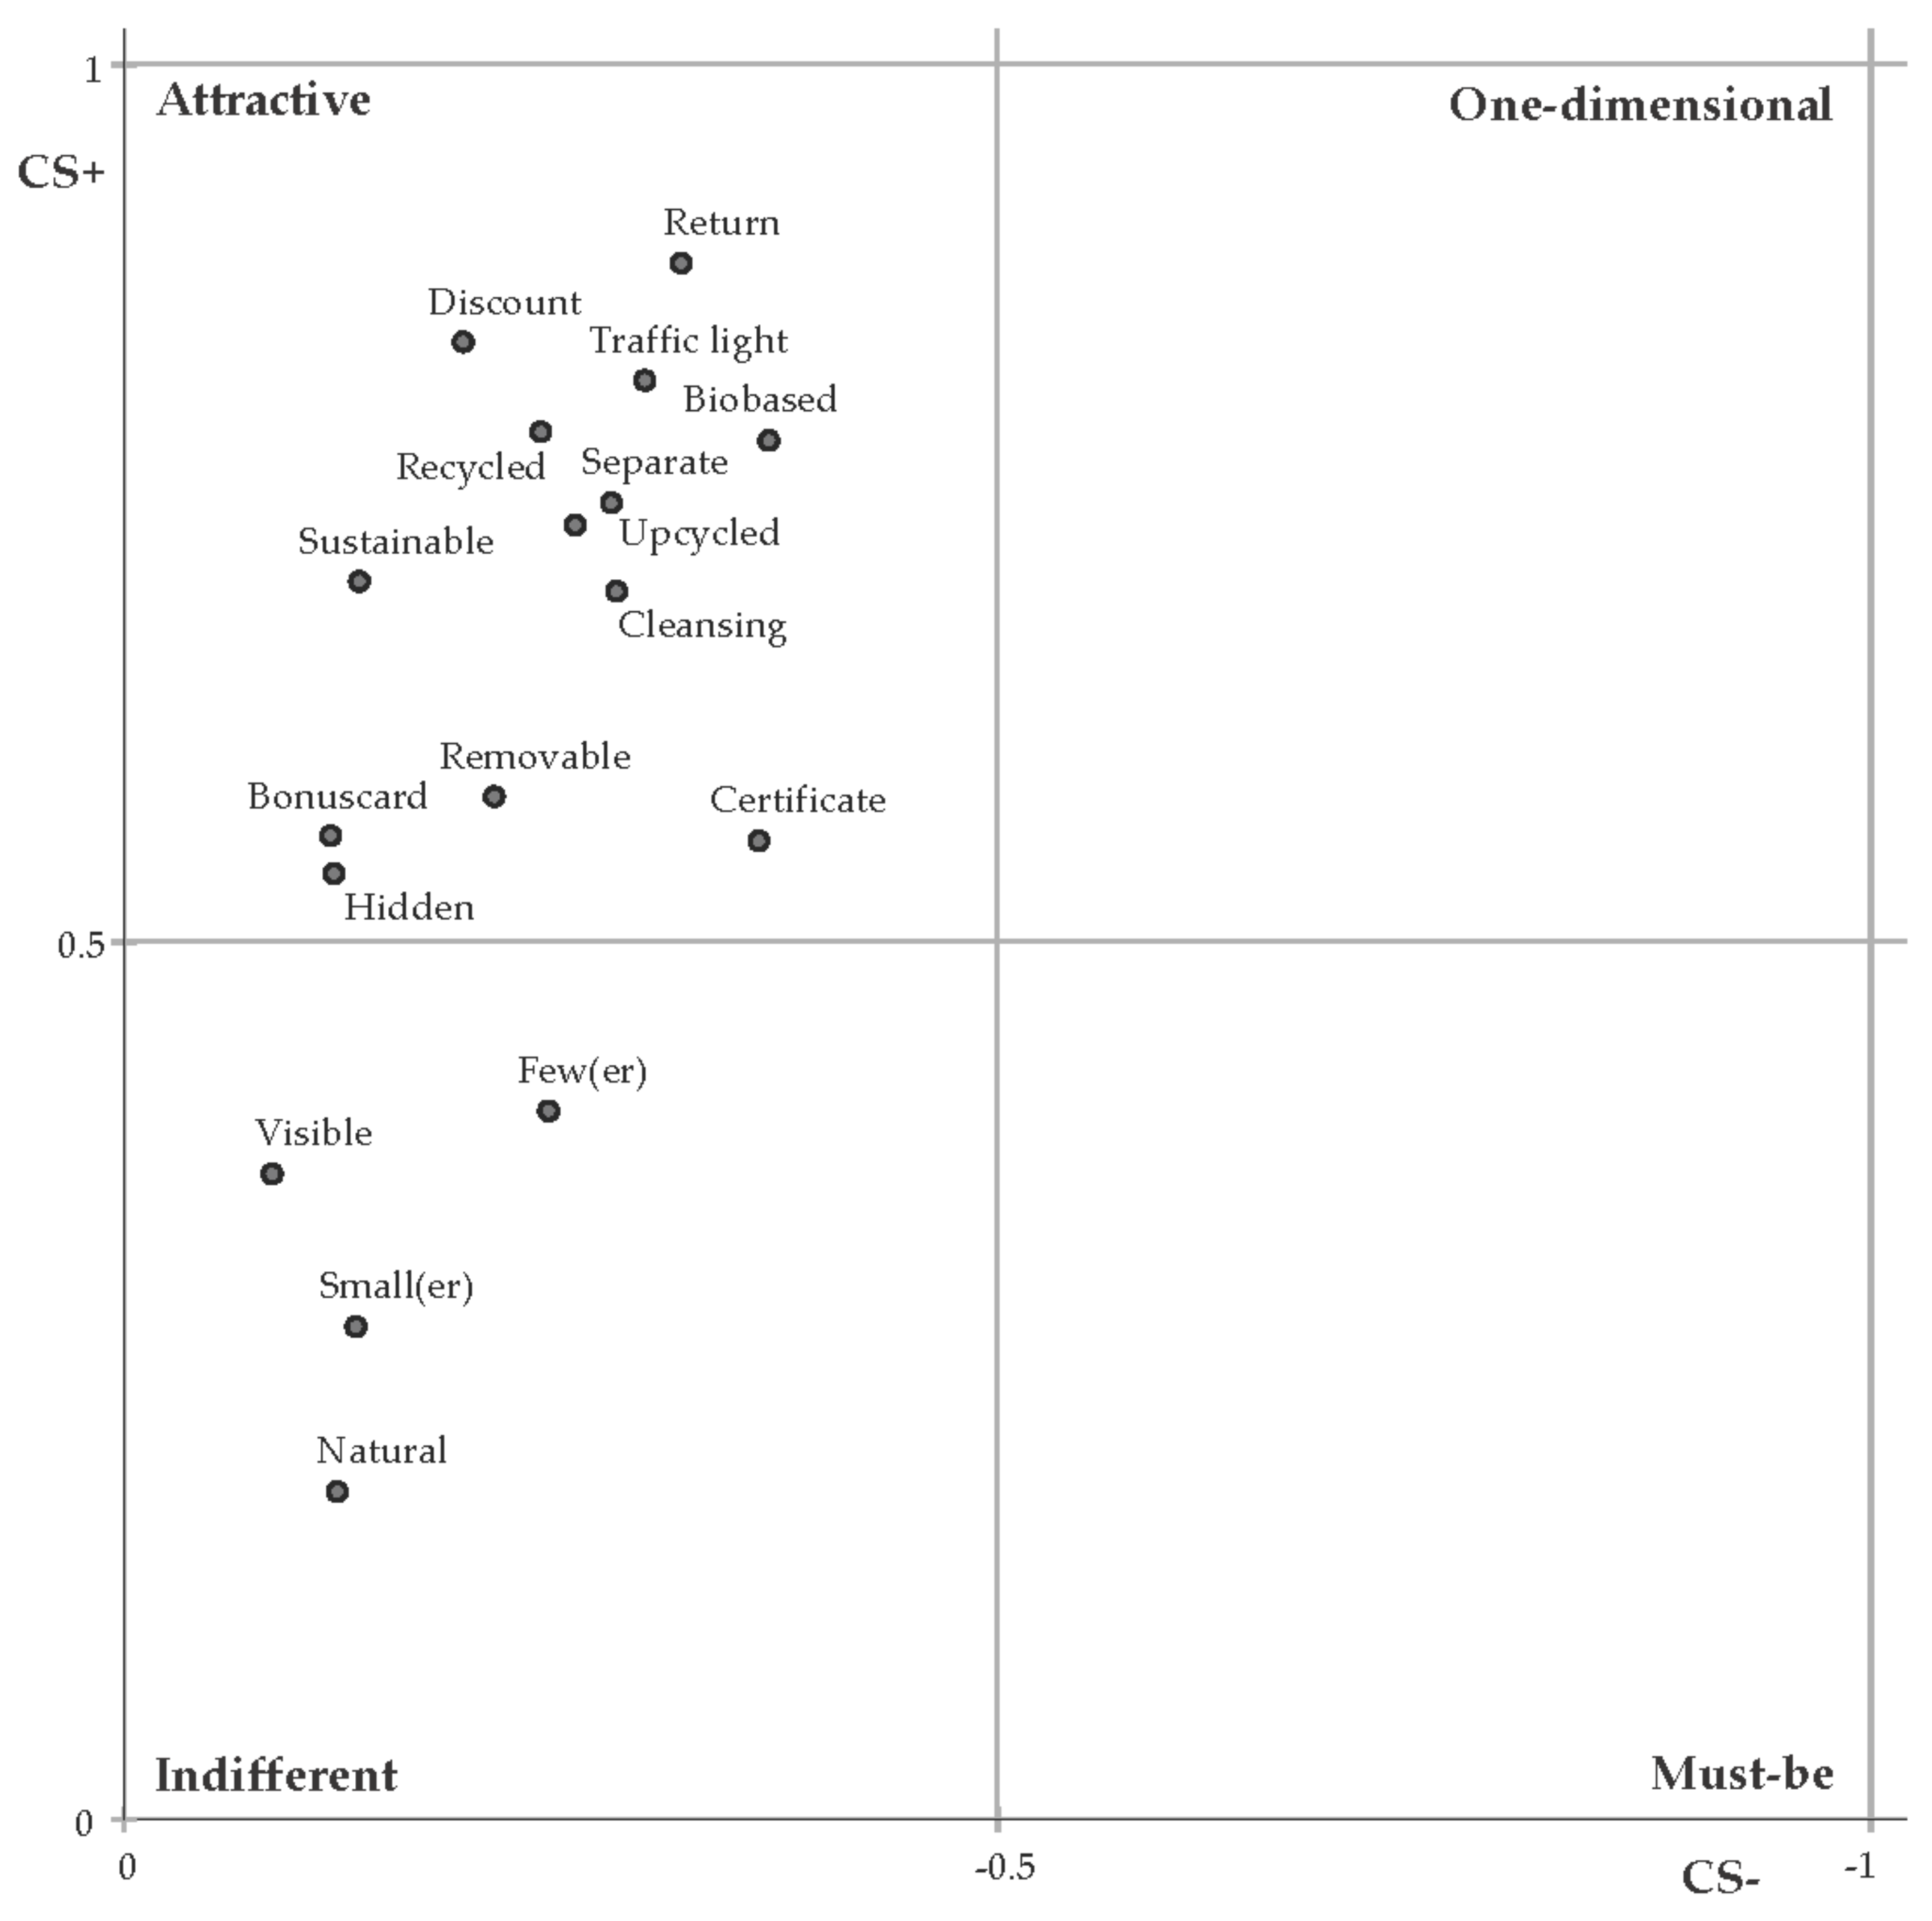
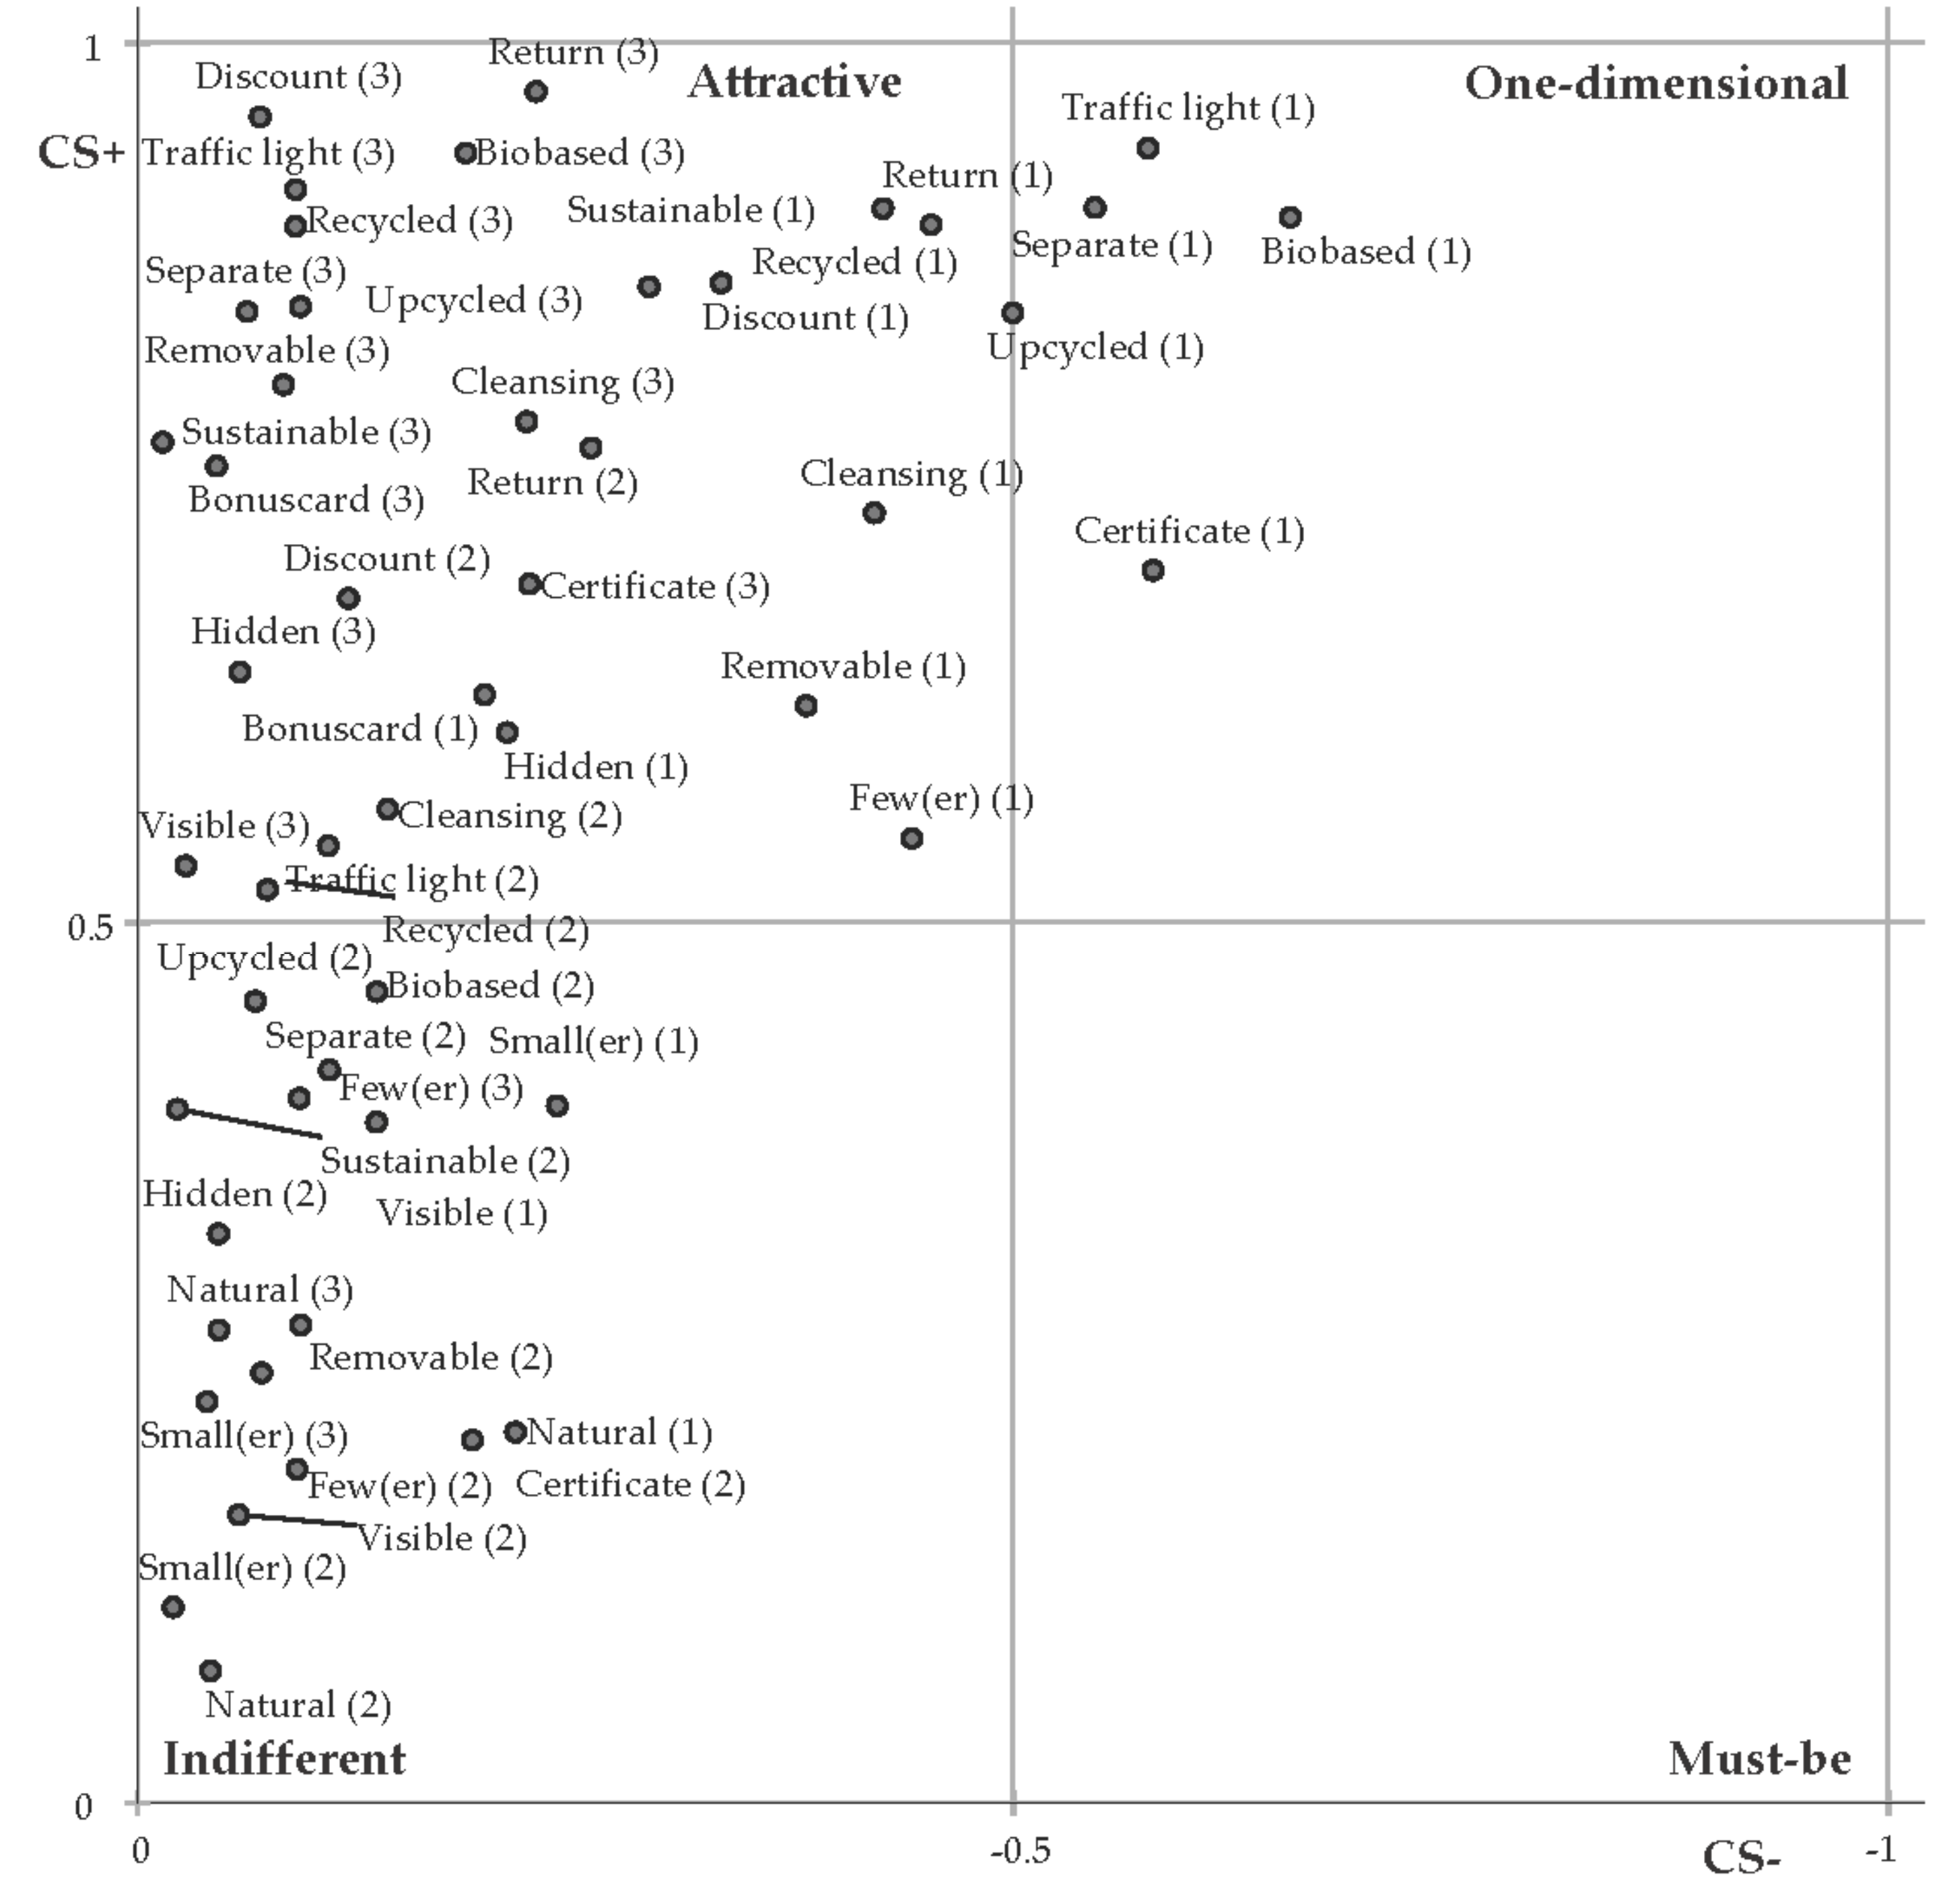
4. Results: A Segmented Kano Perspective for the Apparel and Sportswear Industry

Table 4 reflects the overall assessment of the sustainability aspects and offerings based on the Kano model, indicating category frequencies, the total share TS, as well as the customer satisfaction index CS+ and the customer dissatisfaction index CS−. The sustainability offerings are mostly categorized as attractive and indifferent. Particularly, the offering discounts for sustainable products, recycled materials, sustainable product range, discount for returned products, traffic lights, separate sustainability-section, and upcycled materials were categorized by more than half of the respondents as attractive. Implementing these offerings would increase overall customer satisfaction significantly. In contrast, natural colors, small(er) product ranges, and few(er) life cycles were categorized by more than half of the respondents as indifferent. Some offerings were categorized as one-dimensional by more than 20% of the respondents, indicating that not only their presence would increase satisfaction, but, further, their absence would decrease satisfaction: biobased materials, return discount for used products, traffic light indicating the sustainability level, cleansing and repairing service, a separate sustainability-section, and upcycled materials. Finally, a few offerings will even reduce consumer satisfaction in the case they are implemented: approximately 20% of the respondents categorized visible labeling and small(er) product range as reverse offerings.
Figure 1 illustrates the preceding findings. The offerings are positioned with respect to their CS+ and CS− values. The four quadrants visualize the respondents’ majorities, as discussed in Section 3.1, with respect to the strong categories. Most offerings are categorized as attractive, and few offerings are categorized as indifferent. Since attractive and indifferent categorizations of innovative offerings are frequently the case in Kano investigations, a segment Kano perspective was developed to gain further insights as proposed in Section 3.1: the individual categorizations were analyzed using the well-known two-step clustering procedure by Chiu et al. [86] and the Bayesian information criterion for determining the number of clusters. A three-cluster-solution was found with Cluster 1 termed “Segment 1” (n = 203, 41.4%), Cluster 2 termed “Segment 2” (n = 142, 29.0%) and Cluster 3 termed “Segment 3” (n = 145, 29.6%). Table 5 provides further insights into the categorizations at the segment level.
Apparently, the categorizations vary significantly across the segments and offerings. The majority of the respondents in Segment 1 categorized biobased materials and a traffic light system, indicating the sustainability level as one-dimensional offerings and further, a sustainable product range, a discount for sustainable products, and a discount for returned products as attractive offerings. In contrast to Segment 1, the majority of Segment 3 rated almost every offering as attractive, whereas a majority of Segment 2 rated almost every offering as indifferent. Figure 2 visualizes these differences with an illustration of the segment-specific assessments according to the CS+ and CS- values. Further, the differences between the three segments, with respect to selected background variables, can be seen in Table 6.
Segment 1—the segment where most sustainability offerings are rated as attractive or even one-dimensional—has a significantly higher proportion of female respondents. For them, the importance of price, sustainability, and longevity is also significantly higher than for the average respondent, and moreover, their willingness to pay for sustainable sneakers is significantly higher. However, the importance of brand is significantly lower in this segment. Segment 3—the segment where most sustainability offerings are rated as attractive—has an above-average importance of longevity and price than the average consumer, whereas for Segment 2—the segment where almost every sustainability offering is rated as indifferent—the brand’s importance is significantly higher than for the average respondent. However, it must be mentioned that the importance of sustainability across all segments is low (compared to the other criteria). In other words, the buying process of sneakers seems to be—across all segments—dominated by appearance, comfort, and quality (with respect to materials and craftsmanship).
Since the gender distribution differs significantly across the segments, additional χ2-tests of independence were performed to see whether the categorizations of the offerings directly depend on the participants’ gender. Across the 17 sustainability offerings, only one offering (recycled materials) exhibited significant dependency at the p < 0.01 level, and four offerings (traffic light, sustainable discount, upcycled materials, recycled materials) exhibited significant dependencies at the p < 0.05 level. This further proves the usefulness of the segmented Kano perspective: the three segments differ significantly across the categorizations of all attributes and the participants’ gender differs significantly across the segments, but the participants’ gender cannot be used exclusively to derive the separable segments with respect to categorizations.
Overall, our results indicate that sustainability offerings are attractive and one-dimensional for many consumers, particularly for females, but, compared to purchase criteria like appearance, comfort, and quality (with respect to materials and craftmanship), they are of inferior importance when purchasing sneakers. However, it is not clear whether these findings can be extended to all sorts of apparel and sportswear.

5. Discussion

5.1. Theoretical Contribution

Our findings contribute to a deeper understanding of consumers’ sustainable clothing and footwear consumption behavior, particularly during the pre-purchase phase. Prior research focused either on sustainable consumer behavior in general or investigated sustainable clothing consumption behavior during the post-purchase phase to prevent clothing disposal. We fill a research gap by capturing the consumer’s perspective regarding key sustainability aspects and offerings in terms of product range, labeling, processes, and materials. Hence, drivers (and potential inhibitors) of pro-environmental clothing consumption were determined, which might help to overcome the consumers’ attitude–behavior gap. Thereby, we make several theoretical contributions to extant literature.
First, our findings indicate that discounts for returned products, discounts for sustainable purchases, traffic lights indicating sustainability levels, and biobased materials are highly attractive to the participants. These results extend and align with extant literature (see e.g., [29,32,38,76]), proving that consumers’ sustainable clothing and footwear consumption is frequently constrained due to high prices. Further, preceding research (see, e.g., [35,60,61]) found consumers to have limited knowledge regarding sustainability, and, thus, we identified labeling (e.g., traffic lights) indicating the sustainability level of products as a suitable solution in order to enhance sustainability-related knowledge.
Approximately 20% of the respondents categorized visible labeling and a small(er) product range as reverse offerings leading to customer dissatisfaction. These findings complement the preceding work of, e.g., Harris et al. [58], Hiller Connell [32], or Pookulangara and Shephard [39] who found that pro-environmental clothing frequently does not meet the aesthetic needs and wants of consumers. This is particularly reflected by our participants’ aversion towards a smaller product range. Further, visible labeling might be perceived as unfashionable or disturbing by the consumers.
By applying the segmented Kano perspective, we gained further insights into the participants’ consumption behavior: particularly for female consumers (i.e., the segment with a significantly high proportion of female respondents), the importance of price, sustainability, and longevity of clothing is significantly higher than for the average respondent. This aligns with the gender gap findings of prior literature [70,71,72,73], showing that women are more likely to engage in pro-environmental behavior than men. In our investigation, female respondents classified biobased materials and a traffic light system indicating the sustainability level as one-dimensional offerings, i.e., customer satisfaction grows proportionally with an increasing degree of the offerings’ implementation. Their categorizations are particularly emphasized by previous results of Morgan and Birtwistle [42], which found a lack of knowledge among female consumers (despite their pro-environmental mental attitudes) and thus, more information regarding the sustainability of products is needed, e.g., by using a simple traffic light system.
Nevertheless, the overall importance of sustainability among consumers is still marginal compared to predominant purchasing criteria like appearance, comfort, and quality. This strengthens the preceding results of Joergens [29], who proved quality and appearance of clothing to be more important criteria for many consumers than ethical aspects.

5.2. Managerial Implications

This study provides several managerial implications. First of all, it needs to be highlighted that, in the apparel and sportswear industry, sustainability offerings still play a minor role compared to traditional buying arguments such as appearance, comfort, and quality (i.e., materials and craftmanship). Nevertheless, our study also shows that sustainability aspects and offerings can have a positive impact on customer satisfaction, ultimately leading to increased sales and brand value. In this research, we discussed and applied a new methodology which is able to test a variety of sustainability offerings related to the product range (e.g., purely sustainable product range), labeling (e.g., traffic light indicating sustainability level), sustainable processes (e.g., discount on future purchases for returned products in order to recycle them into components for new products), and used materials (e.g., products made from biobased materials). We could show that these offerings differ significantly in their impact on customer satisfaction. Also, we could show that female (vs. male) consumers are far more receptive to sustainable offerings. This has an implication both for sustainability-related innovations as well as their marketing activities. On the one hand, companies need to ensure that sustainability-related marketing activities fit the typical needs of female consumers. On the other hand, it could be promising to integrate female consumers in early phases of innovation processes aiming for sustainable product offerings as well as the design of related marketing activities and business models (e.g., how to return products to enable recycling).
In terms of the analyzed sustainable offerings, our study provides guidance on two levels. First, since the utilization of upcycled and recycled materials for sustainable products were classified as attractive offerings by the majority of our participants, the apparel industry should increase their efforts to use such materials in production. For instance, Adidas Parley shoes, shirts, and tights are made of upcycled ocean plastics. Further efforts should be made regarding recyclable products, e.g., shoes that are recyclable from laces to sole in order to enable a fully circular business model. Second, sustainable products should be promoted broadly with different marketing techniques: for example, a separate sustainability-section in online shops, as well as stationary stores, may attract consumer attention and minimize search costs. Specific labeling of sustainable products such as a traffic light system and removable or hidden seals for eco-conscious products reduce search efforts, enhance clarity, and might lead consumers towards a sustainable consumption behavior during their purchasing decision. Discounts for returned products or for sustainable products in general might further boost sustainable sales.
In sum, companies should proactively develop strategies to combine sustainable offerings and commercial success following the triple bottom line accounting approach. Our research indicates that combining the social contributions, environmental contributions, and economic contributions requires, on the one hand, meaningful and sustainable products and, on the other hand, creative measures to communicate these products to the consumers.

5.3. Limitations and Future Research

Our research is subject to several limitations that stimulate further research. First, our sample mainly consists of Germans and university students. This seems reasonable since this fits, to some extent, to typical sneaker buyers and to Adidas customers (younger and more students than the general population). However, the generalizability of our results to other clothing and footwear product ranges, as well as other target segments, is limited. Even though in Germany the percentage of university students among their age cohorts now is rather large, one suggestion for further research is to include in the sample, e.g., more people with another employment status, as well as younger and older respondents, to gain more valid results.
Second, our investigation is geographically constrained to Germany, and, therefore, we did not consider cultural differences since consumers of other countries might assess these aspects differently. Future research could replicate our study in a differing cultural context.
Third, the high number of offerings classified as indifferent or attractive might be related to the newness of the offerings but also to the questionnaire’s length (~18 minutes response time on average). Besides, an increasing completion time leads to a higher number of early terminations, and, further, fatigue effects might occur. Further research on this topic could reduce the number of investigated offerings.
Finally, whereas the Kano model and the segmented Kano perspective are able to compare large numbers of sustainability offerings, which is a clear advantage of the approach, some methodological limitations must be mentioned: for example, as discussed, it is often time-consuming for the respondents and often yields many indifferent and attractive categorizations when applied to innovative offerings. Here, it could be helpful in the next step to concentrate on fewer offerings and to apply conjoint analysis and experimental (field) research in order to validate and enhance our findings.

6. Conclusions

To overcome the attitude–behavior gap in terms of sustainable behavior among consumers, we investigated how companies can find out which sustainability offerings drive (or inhibit) consumer satisfaction in the clothing and footwear industry. We proposed and applied the Kano model and the segmented Kano perspective for this purpose in an apparel and sportswear context. Typical consumers (n = 490) evaluated 17 sustainability offerings regarding product range, labeling, processes, and (re-)utilized materials. The analysis results show that there are several sustainability offerings that can promote sustainable consumption. However, on the other side, it could be shown that there are sustainability aspects and offerings that are not suitable for this and should, therefore, be avoided. We hope that our study motivates both researchers and practitioners to contribute to the diffusion of sustainable products not only in the apparel and sportswear industry but also in other areas. Mass adoption and the use of sustainable products are still rare and this must change.

Author Contributions

All authors contributed substantially to this paper. D.B. and T.F.W. were responsible for conceptualization and supervision; D.B. and T.M.R. for theoretical background, methodology, data collection, and analysis; T.M.R. and T.F.W. for managerial implications; and all three authors for writing, reviewing, and editing. All authors have read and agreed to the published version of the manuscript.

Funding

This research received no external funding.

Acknowledgments

The authors would like to thank the participants of the underlying research project for providing support to our study: Paulina Bauer, Delia Fischer, Isabell Gruber, Dara Hentze, Frederic Koecke, Maximilian Meister, Dao Thanh Thao Nguyen, Tina Schmidt, Madeleine Trautmann, and Sabrina Weich. Furthermore, we want to thank all the company and market experts, the 42 students participating in the workshops of the related research projects, and the respondents for helping us to make this research successful.

Conflicts of Interest

In accordance with our ethical obligation as researchers, we are reporting that one co-author, Timm F. Wagner, works for adidas during the preparation and publication of this study.

References

  1. Csikszentmihalyi, M. The costs and benefits of consuming. J. Consum. Res. 2000, 27, 267–272. [Google Scholar] [CrossRef] [Green Version]
  2. Niinimäki, K.; Hassi, L. Emerging design strategies in sustainable production and consumption of textiles and clothing. J. Clean. Prod. 2011, 19, 1876–1883. [Google Scholar] [CrossRef]
  3. Goworek, H.; Fisher, T.; Cooper, T.; Woodward, S.; Hiller, A. The sustainable clothing market: An evaluation of potential strategies for UK retailers. Int. J. Retail. Distrib. Manag. 2012, 40, 935–955. [Google Scholar] [CrossRef] [Green Version]
  4. Barnes, L.; Lea-Greenwood, G. Fast fashion in the retail store environment. Int. J. Retail. Distrib. Manag. 2010, 38, 760–772. [Google Scholar] [CrossRef]
  5. Achabou, M.A.; Dekhili, S. Luxury and sustainable development: Is there a match? J. Bus. Res. 2013, 66, 1896–1903. [Google Scholar] [CrossRef]
  6. Nagurney, A.; Yu, M. Sustainable fashion supply chain management under oligopolistic competition and brand differentiation. Int. J. Prod. Econ. 2012, 135, 532–540. [Google Scholar] [CrossRef]
  7. Goworek, H.; Oxborrow, L.; Claxton, S.; McLaren, A.; Cooper, T.; Hill, H. Managing sustainability in the fashion business: Challenges in product development for clothing longevity in the UK. J. Bus. Res. 2018. [Google Scholar] [CrossRef] [Green Version]
  8. White, K.; Habib, R.; Hardisty, D.J. How to SHIFT consumer behaviors to be more sustainable: A literature review and guiding framework. J. Mark. 2019, 83, 22–49. [Google Scholar] [CrossRef] [Green Version]
  9. Sun, M.; Trudel, R. The effect of recycling versus trashing on consumption: Theory and experimental evidence. J. Mark. Res. 2017, 54, 293–305. [Google Scholar] [CrossRef] [Green Version]
  10. Trudel, R.; Argo, J.J.; Meng, M.D. The recycled self: Consumers’ disposal decisions of identity-linked products. J. Consum. Res. 2016, 43, 246–264. [Google Scholar] [CrossRef]
  11. Wang, T.; Mukhopadhyay, A.; Patrick, V.M. Getting consumers to recycle NOW! When and why cuteness appeals influence prosocial and sustainable behavior. J. Public Policy Mark. 2017, 36, 269–283. [Google Scholar] [CrossRef] [Green Version]
  12. Winterich, K.P.; Nenkov, G.Y.; Gonzales, G.E. Knowing what It makes: How product transformation salience increases recycling. J. Mark. 2019, 83, 21–37. [Google Scholar] [CrossRef]
  13. Eberhart, A.K.; Naderer, G. Quantitative and qualitative insights into consumers’ sustainable purchasing behaviour: A segmentation approach based on motives and heuristic cues. J. Mark. Manag. 2017, 33, 1149–1169. [Google Scholar] [CrossRef]
  14. Sheth, J.N.; Sethia, N.K.; Srinivas, S. Mindful consumption: A customer-centric approach to sustainability. J. Acad. Mark. Sci. 2011, 39, 21–39. [Google Scholar] [CrossRef]
  15. Laitala, K.; Boks, C. Sustainable clothing design: Use matters. J. Des. Res. 2012, 10, 121–139. [Google Scholar] [CrossRef]
  16. Bianchi, C.; Birtwistle, G. Consumer clothing disposal behaviour: A Comparative Study. Int. J. Consum. Stud. 2012, 36, 335–341. [Google Scholar] [CrossRef] [Green Version]
  17. Laitala, K. Consumers’ clothing disposal behavior—A synthesis of research results. Int. J. Consum. Stud. 2014, 38, 444–457. [Google Scholar] [CrossRef]
  18. Maldini, I.; Stappers, P.J.; Gimeno-Martinez, J.C.; Daanen, H.A.M. Assessing the impact of design strategies on clothing lifetimes, usage and volumes: The case of product personalisation. J. Clean. Prod. 2019, 210, 1414–1424. [Google Scholar] [CrossRef]
  19. Zamani, B.; Sandin, G.; Peters, G.M. Life cycle assessment of clothing libraries: Can collaborative consumption reduce the environmental impact of fast fashion? J. Clean. Prod. 2017, 162, 1368–1375. [Google Scholar] [CrossRef]
  20. Trudel, R.; Cotte, J. Does it pay to be good? MIT Sloan Manag. Rev. 2009, 50, 61–68. [Google Scholar]
  21. Auger, P.; Devinney, T.M. Do what consumers say matter? The misalignment of preferences with unconstrained ethical intentions. J. Bus. Ethics 2007, 76, 361–383. [Google Scholar] [CrossRef]
  22. Hughner, R.S.; McDonagh, P.; Prothero, A.; Shultz, C.J.; Stanton, J. Who are organic food consumers? A compilation and review of why people purchase organic food. J. Consum. Behav. 2007, 6, 94–110. [Google Scholar] [CrossRef]
  23. Young, W.; Hwang, K.; McDonald, S.; Oates, C.J. Sustainable consumption: Green consumer behaviour when purchasing products. Sustain. Dev. 2010, 18, 20–31. [Google Scholar] [CrossRef]
  24. Kano, N.; Seraku, N.; Takahashi, F.; Tsuji, S. Attractive quality and must-be quality. J. Jpn. Soc. Qual. Control 1984, 14, 39–48. [Google Scholar]
  25. Baier, D.; Rese, A.; Röglinger, M. Conversational user interfaces for online shops: A Segmented Kano perspective. In Proceedings of the 39th International Conference on Information Systems (ICIS), San Francisco, CA, USA, 13–16 December 2018. [Google Scholar]
  26. Baier, D.; Rese, A. How to increase multichannel shopping satisfaction? A Segmented Kano perspective for the selection of new technologies. J. Retail. Consum. Serv. 2020. (In Press) [Google Scholar]
  27. Rese, A.; Schlee, T.; Baier, D. The need for services and technologies in physical fast fashion stores: Generation Y’s opinion. J. Mark. Manag. 2019, 35, 1437–1459. [Google Scholar] [CrossRef]
  28. Elkington, J. Cannibals with Forks: The Triple Bottom Line of 21st Century Business; New Society Publishers: Stoney Creek, CT, USA, 1997. [Google Scholar]
  29. Joergens, C. Ethical fashion: Myth or future trend? J. Fash. Mark. Manag. 2006, 10, 360–371. [Google Scholar] [CrossRef] [Green Version]
  30. Lundblad, L.; Davies, I.A. The values and motivations behind sustainable fashion consumption. J. Consum. Behav. 2016, 15, 149–162. [Google Scholar] [CrossRef]
  31. Gam, H.J. Are fashion-conscious consumers more likely to adopt eco-friendly clothing? J. Fash. Mark. Manag. 2011, 15, 178–193. [Google Scholar] [CrossRef]
  32. Hiller Connell, K.Y. Internal and external barriers to eco-conscious apparel acquisition. Int. J. Consum. Stud. 2010, 34, 279–286. [Google Scholar] [CrossRef]
  33. Niinimäki, K. Eco-clothing, consumer identity and ideology. Sustain. Dev. 2010, 18, 150–162. [Google Scholar] [CrossRef]
  34. McNeill, L.; Moore, R. Sustainable fashion consumption and the fast fashion conundrum: Fashionable consumers and attitudes to sustainability in clothing choice. Int. J. Consum. Stud. 2015, 39, 212–222. [Google Scholar] [CrossRef]
  35. Shen, B.; Wang, Y.; Lo, C.K.Y.; Shum, M. The impact of ethical fashion on consumer purchase behavior. J. Fash. Mark. Manag. 2012, 16, 234–245. [Google Scholar] [CrossRef]
  36. D’Souza, C.; Taghian, M.; Lamb, P.; Peretiatko, R. Green decisions: Demographics and consumer understanding of environmental labels. Int. J. Consum. Stud. 2007, 31, 371–376. [Google Scholar] [CrossRef]
  37. Nam, C.; Dong, H.; Lee, Y.-A. Factors influencing consumers’ purchase intention of green sportswear. Fash. Text. 2017, 4, 179. [Google Scholar] [CrossRef] [Green Version]
  38. Hustvedt, G.; Dickson, M.A. Consumer likelihood of purchasing organic cotton apparel. J. Fash. Mark. Manag. 2009, 13, 49–65. [Google Scholar] [CrossRef]
  39. Pookulangara, S.; Shephard, A. Slow fashion movement: Understanding consumer perceptions—An exploratory study. J. Retail. Consum. Serv. 2013, 20, 200–206. [Google Scholar] [CrossRef]
  40. Laitala, K.; Boks, C.; Klepp, I.G. Potential for environmental improvements in laundering. Int. J. Consum. Stud. 2011, 35, 254–264. [Google Scholar] [CrossRef]
  41. Jacoby, J.; Berning, C.K.; Dietvorst, T.F. What about disposition? J. Mark. 1977, 41, 22–28. [Google Scholar] [CrossRef]
  42. Morgan, L.R.; Birtwistle, G. An investigation of young fashion consumers’ disposal habits. Int. J. Consum. Stud. 2009, 33, 190–198. [Google Scholar] [CrossRef]
  43. Bianchi, C.; Birtwistle, G. Sell, give away, or donate: An exploratory study of fashion clothing disposal behaviour in two countries. Int. Rev. Retail. Consum. Res. 2010, 20, 353–368. [Google Scholar] [CrossRef] [Green Version]
  44. Birtwistle, G.; Moore, C.M. Fashion clothing—Where does it all end up? Int. J. Retail. Distrib. Manag. 2007, 35, 210–216. [Google Scholar] [CrossRef]
  45. Allwood, J.M.; Laursen, S.E.; Russell, S.N.; de Rodríguez, C.M.; Bocken, N.M.P. An approach to scenario analysis of the sustainability of an industrial sector applied to clothing and textiles in the UK. J. Clean. Prod. 2008, 16, 1234–1246. [Google Scholar] [CrossRef]
  46. Armstrong, C.M.; Niinimäki, K.; Lang, C.; Kujala, S. A Use-Oriented Clothing Economy? Preliminary affirmation for sustainable clothing consumption alternatives. Sustain. Dev. 2016, 24, 18–31. [Google Scholar] [CrossRef]
  47. Hirscher, A.-L.; Niinimäki, K.; Joyner Armstrong, C.M. Social manufacturing in the fashion sector: New value creation through alternative design strategies? J. Clean. Prod. 2018, 172, 4544–4554. [Google Scholar] [CrossRef]
  48. Kim, J.; Kang, S.; Lee, K.H. How social capital impacts the purchase intention of sustainable fashion products. J. Bus. Res. 2018, 1–8. [Google Scholar] [CrossRef]
  49. Laitala, K.; Klepp, I.G.; Boks, C. Changing laundry habits in Norway. Int. J. Consum. Stud. 2012, 36, 228–237. [Google Scholar] [CrossRef]
  50. Lang, C.; Armstrong, C.M.; Brannon, L.A. Drivers of clothing disposal in the US: An exploration of the role of personal attributes and behaviours in frequent disposal. Int. J. Consum. Stud. 2013, 37, 706–714. [Google Scholar] [CrossRef]
  51. Diddi, S.; Yan, R.-N.; Bloodhart, B.; Bajtelsmit, V.; McShane, K. Exploring young adult consumers’ sustainable clothing consumption intention-behavior gap: A Behavioral Reasoning Theory perspective. Sustain. Prod. Consum. 2019, 18, 200–209. [Google Scholar] [CrossRef]
  52. Hu, Z.-H.; Li, Q.; Chen, X.-J.; Wang, Y.-F. Sustainable rent-based closed-loop supply chain for fashion products. Sustainability 2014, 6, 7063–7088. [Google Scholar] [CrossRef] [Green Version]
  53. Kollmuss, A.; Agyeman, J. Mind the Gap: Why do people act environmentally and what are the barriers to pro-environmental behavior? Environ. Educ. Res. 2002, 8, 239–260. [Google Scholar] [CrossRef] [Green Version]
  54. Stern, P.C.; Oskamp, S. Managing scarce environmental resources. In Handbook of Environmental Psychology; Stokols, D., Altman, I., Eds.; Wiley: New York, NY, USA, 1987; pp. 1044–1088. [Google Scholar]
  55. Guagnano, G.A.; Stern, P.C.; Dietz, T. Influences on attitude-behavior relationships. Environ. Behav. 1995, 27, 699–718. [Google Scholar] [CrossRef]
  56. Meinhold, J.L.; Malkus, A.J. Adolescent environmental behaviors. Environ. Behav. 2005, 37, 511–532. [Google Scholar] [CrossRef]
  57. Schahn, J.; Holzer, E. Studies of individual environmental concern. Environ. Behav. 1990, 22, 767–786. [Google Scholar] [CrossRef]
  58. Harris, F.; Roby, H.; Dibb, S. Sustainable clothing: Challenges, barriers and interventions for encouraging more sustainable consumer behaviour. Int. J. Consum. Stud. 2016, 40, 309–318. [Google Scholar] [CrossRef]
  59. Kim, H.-S.; Damhorst, M.L. Environmental concern and apparel consumption. Cloth. Text. Res. J. 1998, 16, 126–133. [Google Scholar] [CrossRef]
  60. Hill, J.; Lee, H.-H. Young Generation Y consumers’ perceptions of sustainability in the apparel industry. J. Fash. Mark. Manag. 2012, 16, 477–491. [Google Scholar] [CrossRef]
  61. Shaw, D.; Hogg, G.; Wilson, E.; Shiu, E.; Hassan, L. Fashion victim: The impact of fair trade concerns on clothing choice. J. Strat. Mark. 2006, 14, 427–440. [Google Scholar] [CrossRef]
  62. Iwanow, H.; McEachern, M.G.; Jeffrey, A. The influence of ethical trading policies on consumer apparel purchase decisions. Int. J. Retail. Distrib. Manag. 2005, 33, 371–387. [Google Scholar] [CrossRef]
  63. Bly, S.; Gwozdz, W.; Reisch, L.A. Exit from the high street: An exploratory study of sustainable fashion consumption pioneers. Int. J. Consum. Stud. 2015, 39, 125–135. [Google Scholar] [CrossRef]
  64. Shim, S. Environmentalism and consumers’ clothing disposal patterns: An exploratory study. Cloth. Text. Res. J. 1995, 13, 38–48. [Google Scholar] [CrossRef]
  65. Song, S.; Ko, E. Perceptions, attitudes, and behaviors toward sustainable fashion: Application of Q and Q-R methodologies. Int. J. Consum. Stud. 2017, 41, 264–273. [Google Scholar] [CrossRef]
  66. Blake, D.E. Contextual effects on environmental attitudes and behavior. Environ. Behav. 2001, 33, 708–725. [Google Scholar] [CrossRef]
  67. Ellen, P.S. Do We Know what we need to know? Objective and subjective knowledge effects on pro-ecological behaviors. J. Bus. Res. 1994, 30, 43–52. [Google Scholar] [CrossRef]
  68. Iran, S.; Geiger, S.M.; Schrader, U. Collaborative fashion consumption—A cross-cultural study between Tehran and Berlin. J. Clean. Prod. 2019, 212, 313–323. [Google Scholar] [CrossRef]
  69. Retamal, M. Collaborative consumption practices in Southeast Asian cities: Prospects for growth and sustainability. J. Clean. Prod. 2019, 222, 143–152. [Google Scholar] [CrossRef]
  70. Luchs, M.G.; Mooradian, T.A. Sex, personality, and sustainable consumer behaviour: Elucidating the gender effect. J. Consum. Policy 2012, 35, 127–144. [Google Scholar] [CrossRef]
  71. Brough, A.R.; Wilkie, J.E.B.; Ma, J.; Isaac, M.S.; Gal, D. Is eco-friendly unmanly? The green-feminine stereotype and its effect on sustainable consumption. J. Consum. Res. 2016, 43, 567–582. [Google Scholar] [CrossRef] [Green Version]
  72. Eisler, A.D.; Eisler, H. Subjective time scaling: Influence of age, gender, and type A and type B behavior. Chronobiologia 1994, 21, 185–200. [Google Scholar]
  73. Lee, J.A.; Holden, S.J.S. Understanding the determinants of environmentally conscious behavior. Psychol. Mark. 1999, 16, 373–392. [Google Scholar] [CrossRef]
  74. Davidson, D.J.; Freudenburg, W.R. Gender and environmental risk concerns. A review and analysis of available research. Environ. Behav. 1996, 28, 302–339. [Google Scholar] [CrossRef]
  75. Beard, N.D. The branding of ethical fashion and the consumer: A luxury niche or mass-market Reality? Fash. Theory 2008, 12, 447–467. [Google Scholar] [CrossRef]
  76. Roberts, J.A. Green consumers in the 1990s: Profile and implications for Advertising. J. Bus. Res. 1996, 36, 217–231. [Google Scholar] [CrossRef]
  77. Geissinger, A.; Laurell, C.; Öberg, C.; Sandström, C. How sustainable is the sharing economy? On the sustainability connotations of sharing economy platforms. J. Clean. Prod. 2019, 206, 419–429. [Google Scholar] [CrossRef]
  78. Ingaldi, M.; Ulewicz, R. How to make e-commerce more successful by use of Kano’s model to assess customer satisfaction in terms of sustainable development. Sustainability 2019, 11, 4830. [Google Scholar] [CrossRef] [Green Version]
  79. Matzler, K.; Hinterhuber, H.H.; Bailom, F.; Sauerwein, E. How to delight your customers. J. Prod. Brand Manag. 1996, 5, 6–18. [Google Scholar] [CrossRef]
  80. Mikulić, J.; Prebežac, D. Which products and services can be used to obtain a high level of customer satisfaction. Manag. Serv. Qual. Int. J. 2011, 21, 46–66. [Google Scholar] [CrossRef] [Green Version]
  81. Nilsson-Witell, L.; Fundin, A. Dynamics of service attributes: A test of Kano’s theory of attractive quality. Int. J. Serv. Ind. Manag. 2005, 16, 152–168. [Google Scholar] [CrossRef]
  82. Hauser, J.R.; Clausing, D. The House of Quality. Harv. Bus. Rev. 1988, 66, 63–73. [Google Scholar]
  83. Berger, C.; Blauth, R.; Boger, D.; Bolster, C.; Burchill, G.; DuMouchel, W.; Pouliot, F.; Richter, R.; Rubinoff, A.; Shen, D.; et al. Kano’s methods for understanding customer-defined quality. Cent. Qual. Manag. J. 1993, 2, 3–36. [Google Scholar]
  84. Shahin, A.; Zairi, M. Kano model: A dynamic approach for classifying and prioritising requirements of airline travellers with three case studies on international airlines. Total Qual. Manag. Bus. Excell. 2009, 20, 1003–1028. [Google Scholar] [CrossRef]
  85. Shahin, A.; Pourhamidi, M.; Antony, J.; Hyun Park, S. Typology of Kano models: A critical review of literature and proposition of a revised model. Int. J. Qual. Reliab. Manag. 2013, 30, 341–358. [Google Scholar] [CrossRef]
  86. Chiu, T.; Fang, D.; Chen, J.; Wang, Y.; Jeris, C. A robust and scalable clustering algorithm for mixed type attributes in large database environment. In Proceedings of the Seventh ACM SIGKDD International Conference on Knowledge Discovery and Data Mining, San Francisco, CA, USA, 26–29 August 2001; pp. 263–268. [Google Scholar]
Figure 1. Depiction of the overall assessment of sustainability offerings (n = 490).
Sustainability 12 02788 g001
Figure 2. Depiction of the segment-specific assessment of sustainability offerings. (segment numbers are in parentheses).
Sustainability 12 02788 g002
Table 1. Kano table: Categories derived from answers to the (dys-) functional questions.
Dysfunctional Question
(1) Like(2) Must be(3) Neutral(4) Live with(5) Dislike
Functional question(1) LikeQAAAO
(2) Must beRIIIM
(3) NeutralRIIIM
(4) Live withRIIIM
(5) DislikeRRRRQ
Note: A = attractive; I = indifferent; M = must-be; O = one-dimensional; Q = questionable; R = reverse.
Table 2. Sustainable aspects and offerings for apparel and sportswear consumers together with references that discuss these offerings as helpful to increase sustainable clothing consumption.
AspectOfferingDetailed DescriptionReferences
RangeSustainableOnly sustainable products are offered.[30,67]
NaturalOnly products in natural colors are offered.[30]
SeparateA separate section with sustainable products is offered.[30,67]
Small(er)A small(er) range is offered (e.g., 1000 instead of 3000 sneakers).[32]
Few(er)Few(er) fashion cycles are launched (e.g., a specific collection is sold for two months instead of two weeks).[32]
LabelingTraffic lightProducts are classified with a traffic light to indicate the sustainability level (e.g., red: minimum, yellow: re/upcycled, green: biobased).[32,36,59]
RemovableProducts are tagged with a removable seal to indicate a high sustainability level.[32,36,59]
HiddenProducts are tagged with a hidden seal to indicate a high sustainability level (e.g., on the sneaker sole).[32,36,59]
VisibleProducts are tagged with a visible seal to indicate a high sustainability level.[32,36,59]
CertificateProducts are officially certified by an ecolabel to indicate a high sustainability level (e.g., Blauer Engel, Organic Textile, Fair Trade).[32,36,59]
ProcessesReturnA discount on the purchase of the next sustainable product is offered when products are returned to be recycled. [32,38,46,76]
DiscountA discount on the purchase of the next sustainable product is offered when a sustainable product is bought.[32,38,46,76]
Bonus cardBonus points are collected when buying products. The more sustainable, the more points. Points can be redeemed when buying sustainnable products. Further, when reaching a minimum number of points, customers get early access to new sustainable products.[32,38,46,76]
MaterialsUpcycledProducts are made of upcycled materials (e.g., ocean plastic).[42,45]
BiobasedProducts are made of biobased and -degradable materials (e.g., biosteel).[42,45]
RecycledProducts are made of components derived from returned products.[42,45]
CleaningA repair and/or cleaning service is offered to prolong the product life cycle. [2,15]
Table 3. Descriptive statistics of the sample (n = 490).
DemographicsSpecificationProportion
Age15–2454.49%
25–3439.59%
35–645.92%
GenderFemale56.53%
Male43.27%
Employment statusStudents77.35%
Employed14.49%
Freelancer2.65%
Other5.51%
Table 4. Overall assessment of sustainability aspects and offerings.
OfferingOverall Category Frequencies (n = 490)TSCS+CS−
#A#I#M#O#Q#R
RangeSustainable2861251549114640.7053−0.1347
Natural623053516963260.1866−0.1220
Separate249100211141558%0.7500−0.2789
Small(er)83257252729626%0.2806−0.1327
Few(er)104245308222733%0.4035−0.2430
LabelingTraffic light26376111332557%0.8199−0.2981
Removable202170277321650%0.5826−0.2119
Hidden205205104622245%0.5386−0.1202
Visible115241528110025%0.3676−0.0848
Certificate1591466610811053%0.5574−0.3633
ProcessesReturn2854691462261%0.8868−0.3189
Discount3136968621466%0.8418−0.1941
Bonuscard20719654913244%0.5602−0.1182
MaterialsUpcycled2451081710621257%0.7374−0.2584
Biobased22878261532355%0.7856−0.3691
Recycled2838417983564%0.7905−0.2386
Cleansing224125211162253%0.6996−0.2819
Note: The most frequent category is marked in bold. A = attractive; I = indifferent; M = must-be; O = one-dimensional; Q = questionable; R = reverse; TS = total strength; CS+ = customer satisfaction index; CS− = customer dissatisfaction index.
Table 5. Segment-specific assessment of sustainability aspects and offerings.
OfferingSegment-Specific Category Frequencies (Segment 1: n = 203 / Segment 2: n = 142 / Segment 3: n = 145)
#A#I#M#O#Q#R
RangeSustainable ***126 / 51 / 10917 / 78 / 3011 / 2 / 248 / 1 / 00 / 1 / 01 / 9 / 4
Natural ***29 / 6 / 27120 / 109 / 7630 / 2 / 311 / 3 / 23 / 6 / 010 / 16 / 37
Separate ***87 / 49 / 1135 / 73 / 2214 / 7 / 097 / 8 / 90 / 1 / 00 / 4 / 1
Small(er) ***51 / 10 / 2295 / 87 / 7521 / 1 / 325 / 1 / 10 / 2 / 011 / 41 / 44
Few(er) ***47 / 16 / 4164 / 104 / 7726 / 3 / 162 / 9 / 111 / 1 / 03 / 3 / 1
LabelingTraffic light ***79 / 63 / 1216 / 60 / 106 / 3 / 2110 / 12 / 111 / 1 / 01 / 3 / 1
Removable ***66 / 27 / 10957 / 90 / 2318 / 4 / 558 / 8 / 70 / 2 / 04 / 11 / 1
Hidden ***86 / 39 / 8071 / 85 / 497 / 3 / 035 / 3 / 80 / 2 / 04 / 10 / 8
Visible ***47 / 13 / 55105 / 85 / 513 / 2 / 021 / 4 / 30 / 1 / 027 / 37 / 36
Certificate ***57 / 21 / 8127 / 89 / 3033 / 19 / 1483 / 7 / 180 / 1 / 03 / 5 / 2
ProcessesReturn ***102 / 75 / 10814 / 28 / 45 / 4 / 081 / 32 / 330 / 2 / 01 / 1 / 0
Sustainable ***109 / 77 / 12723 / 40 / 64 / 2 / 062 / 14 / 100 / 2 / 05 / 7 / 2
Bonuscard ***87 / 25 / 9571 / 93 / 322 / 3 / 037 / 6 / 60 / 1 / 06 / 14 / 12
MaterialsUpcycled ***86 / 52 / 10715 / 73 / 2016 / 0 / 185 / 9 / 120 / 2 / 01 / 6 / 5
Biobased ***64 / 50 / 1145 / 70 / 315 / 5 / 6118 / 14 / 210 / 2 / 01 / 1 / 1
Recycled ***102 / 62 / 1199 / 63 / 1212 / 2 / 380 / 8 / 100 / 3 / 00 / 4 / 1
Cleansing ***78 / 65 / 8139 / 63 / 1215 / 2 / 370 / 8 / 101 / 3 / 00 / 4 / 1
Note: The most frequent category per segment is marked in bold. A = attractive; I = indifferent; M = must-be; O = one-dimensional; Q = questionable; R = reverse; differences across segments are analyzed using the χ2 test of independence with *** p < 0.01.
Table 6. Segment-specific descriptive statistics (Segment 1: n = 203, Segment 2: n = 142, Segment 3: n = 145).
AspectSpecificationsOverallSegment 1Segment 2Segment 3
Age15–2454.5%56.6%53.5%52.5%
25–3439.6%34.4%45.1%41.4%
35–645.92%9.0%1.4%6.1%
Gender ***Female56.5%65.5%46.5%46.2%
Male43.3%34.5%52.8%53.8%
Employment statusStudents77.4%72.0%83.8%78.6%
Employed14.5%16.3%11.3%15.2%
Freelancer2.7%5.4%0.0%1.4%
Other5.5%6.3%5.9%14.8%
Sneakers bought per year<18.4%11.8%7.7%4.1%
134.1%36.0%31.7%33.6%
2–341.8%38.4%44.4%44.1%
>39.4%13.8%16.2%18.2%
Sustainable consumption attitude in generalI’m informed ***3.17 (0.911)3.35 (0.833)2.89 (0.939)3.21 (0.927)
Important for me ***3.45 (0.954)3.81 (0.876)3.01 (0.956)3.39 (0.859)
I would pay more ***3.69 (1.008)4.07 (0.847)3.15 (1.106)3.68 (0.872)
Labels are helpful ***4.40 (0.908)4.74 (0.559)3.79 (1.166)4.52 (0.698)
Sneakers buying motivesI buy when needed3.48 (1.297)3.48 (1.291)3.57 (1.318)3.37 (1.289)
I buy when inspired3.25 (1.321)3.16 (1.316)3.25 (1.274)3.36 (1.372)
Importance when buying sneakersPrice **4.26 (1.214)4.43 (1.130)4.20 (1.216)4.08 (1.299)
Quality4.99 (0.942)5.06 (0.960)4.91 (0.929)4.97 (0.928)
Appearance5.63 (0.701)5.59 (0.714)5.58 (0.707)5.73 (0.669)
Brand ***3.95 (1.478)3.66 (1.538)4.18 (1.462)4.14 (1.342)
Sustainability ***3.14 (1.295)3.46 (1.290)2.80 (1.297)3.02 (1.199)
Comfort5.16 (0.951)5.26 (0.915)5.06 (0.921)5.12 (1.020)
Longevity ***4.35 (1.213)4.46 (1.213)4.07 (1.224)4.47 (1.173)
Willingness to pay for sustainable sneakers compared to conventional ones for € 100.00 ***€ 116.53
(€15.32)
€ 120.61
(€ 14.52)
€ 110.66
(€ 16.30)
€ 116.58
(€ 13.57)
Note: Quality refers to materials and craftsmanship; differences across segments are analyzed with *** p < 0.01, ** p < 0.05, using χ2-tests of independence for the nominal aspects (age, gender, employment status, number of sneakers bought) and F-tests for the metric aspects (attitude and motives with scales 1 = “totally disagree” to 5 = “totally agree”; importance with scales 1 = “I do not mind” to 6 = “very important”; given are mean values (standard deviation)).

