Sustainability by High–Speed Rail: The Reduction Mechanisms of Transportation Infrastructure on Haze Pollution


Abstract
1. Introduction
2. Theoretical Background
2.1. Haze Pollution Reduction Mechanisms
2.2. High-Speed Rail, Institutional Pressure, and Haze Pollution
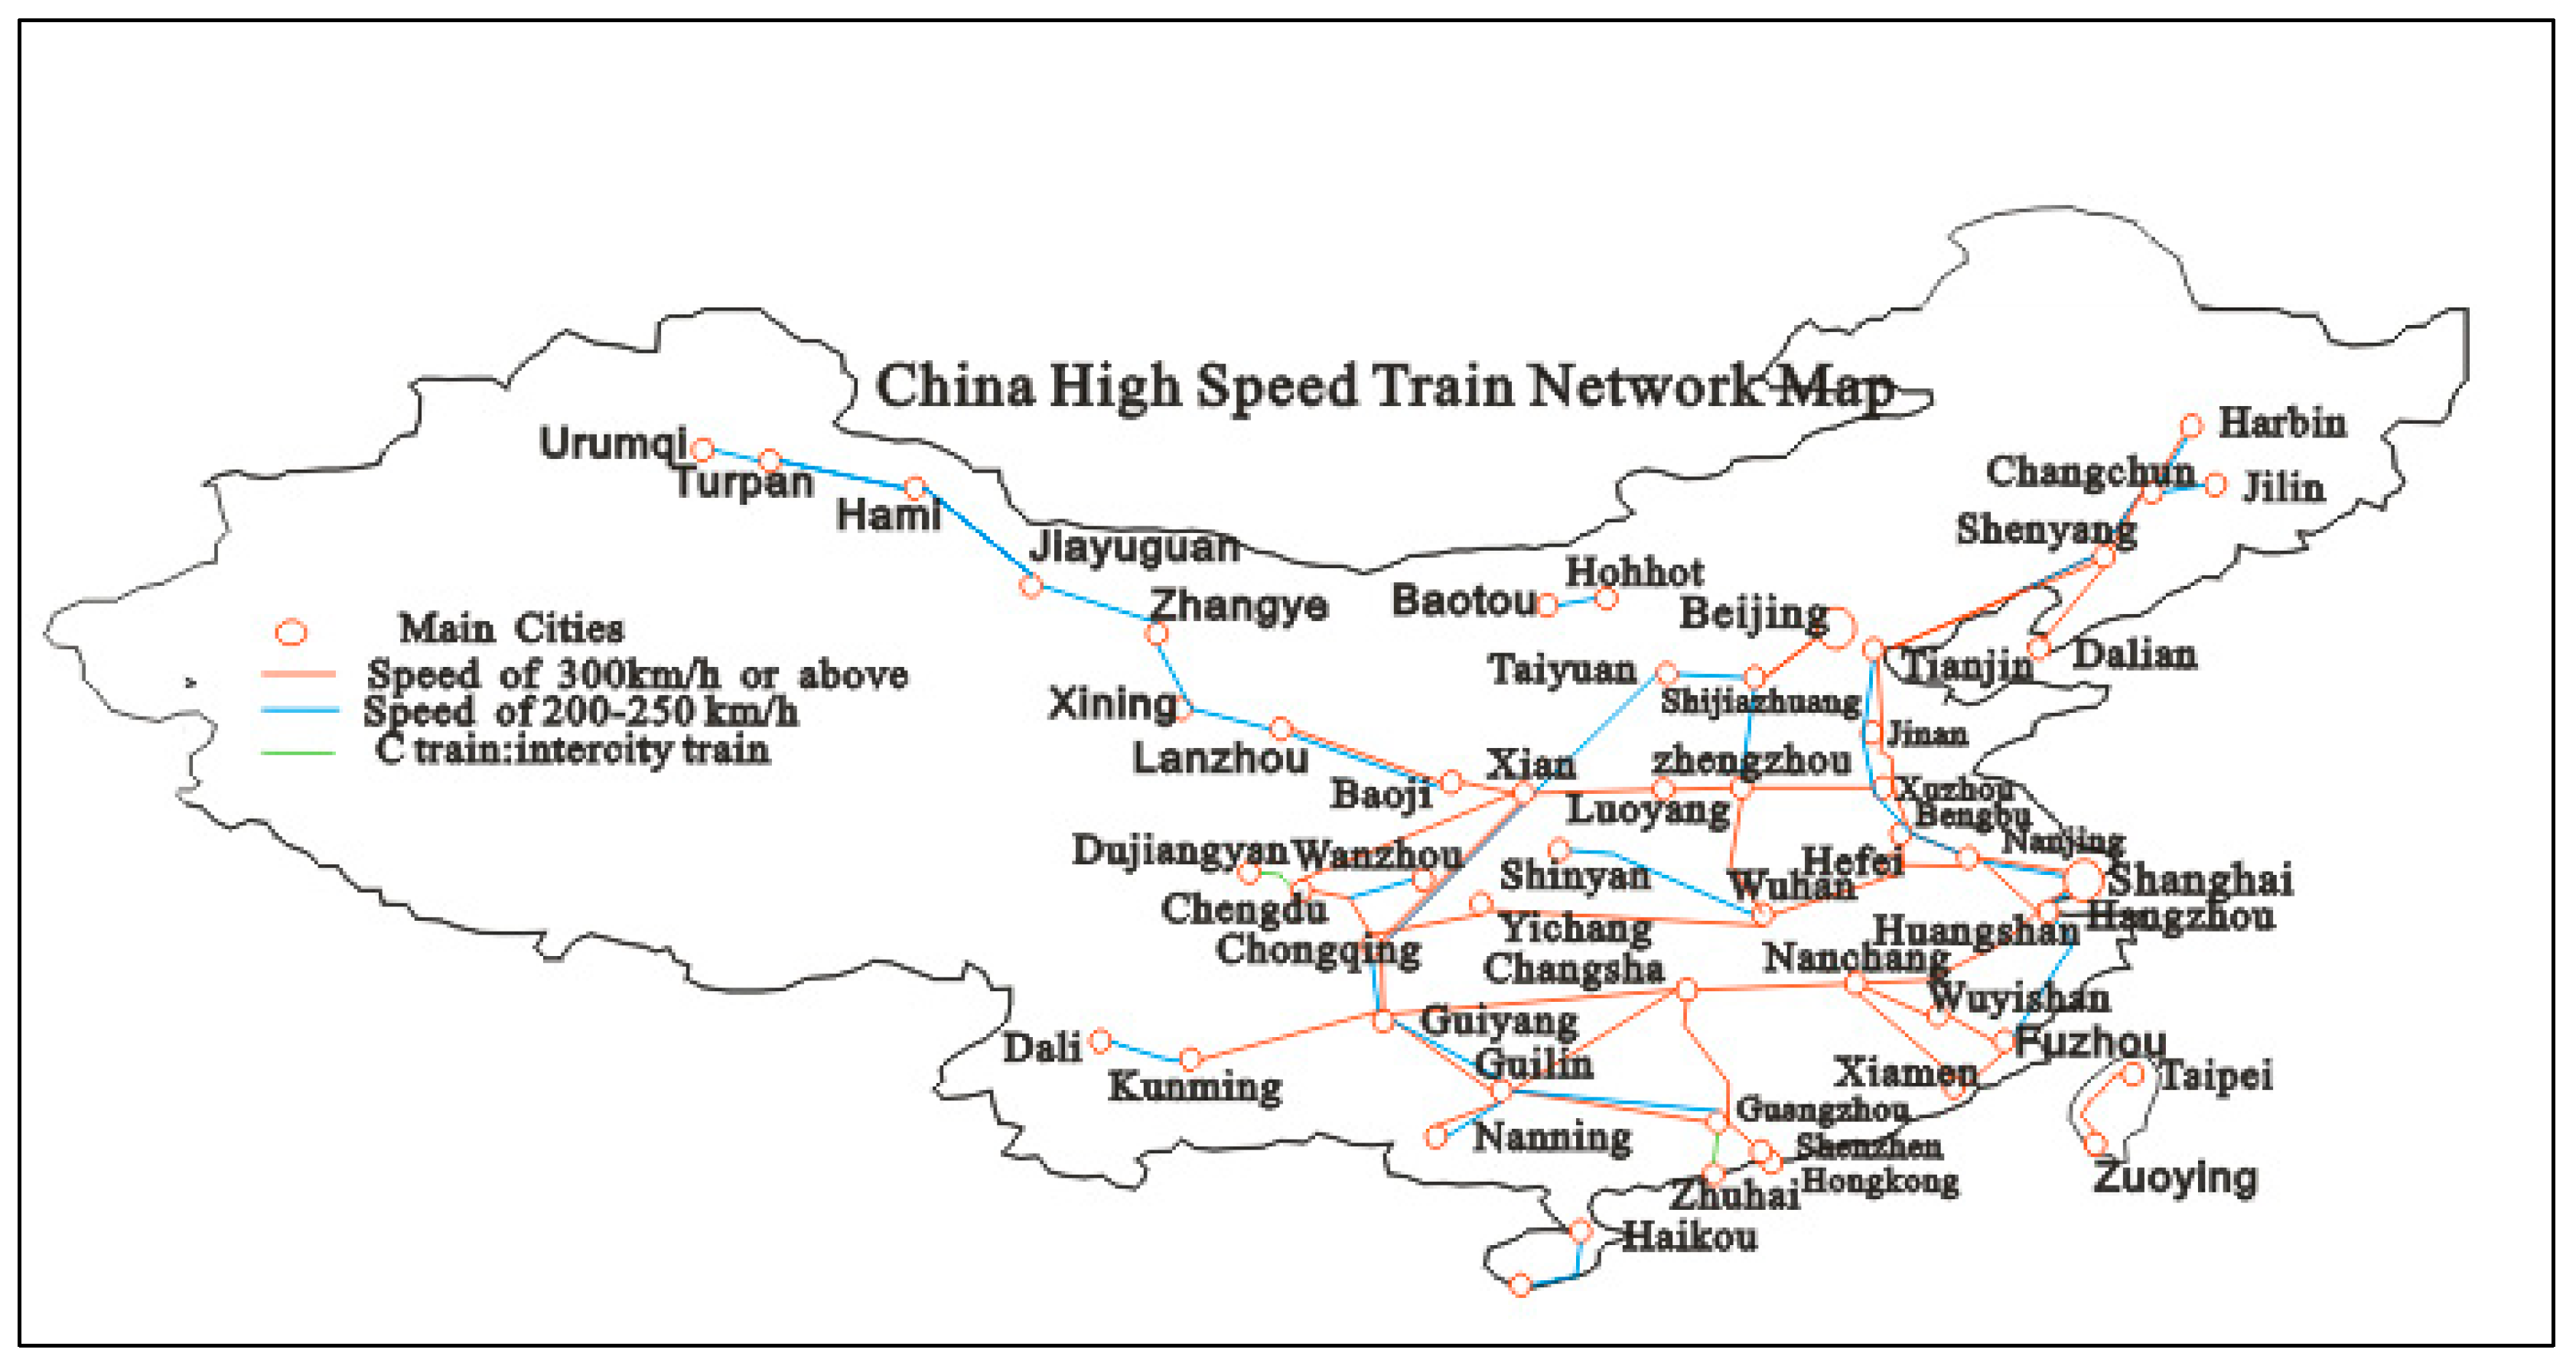
3. Data and Sample
3.1. Data
3.2. Model and Variables
4. Results
4.1. Descriptive Analysis
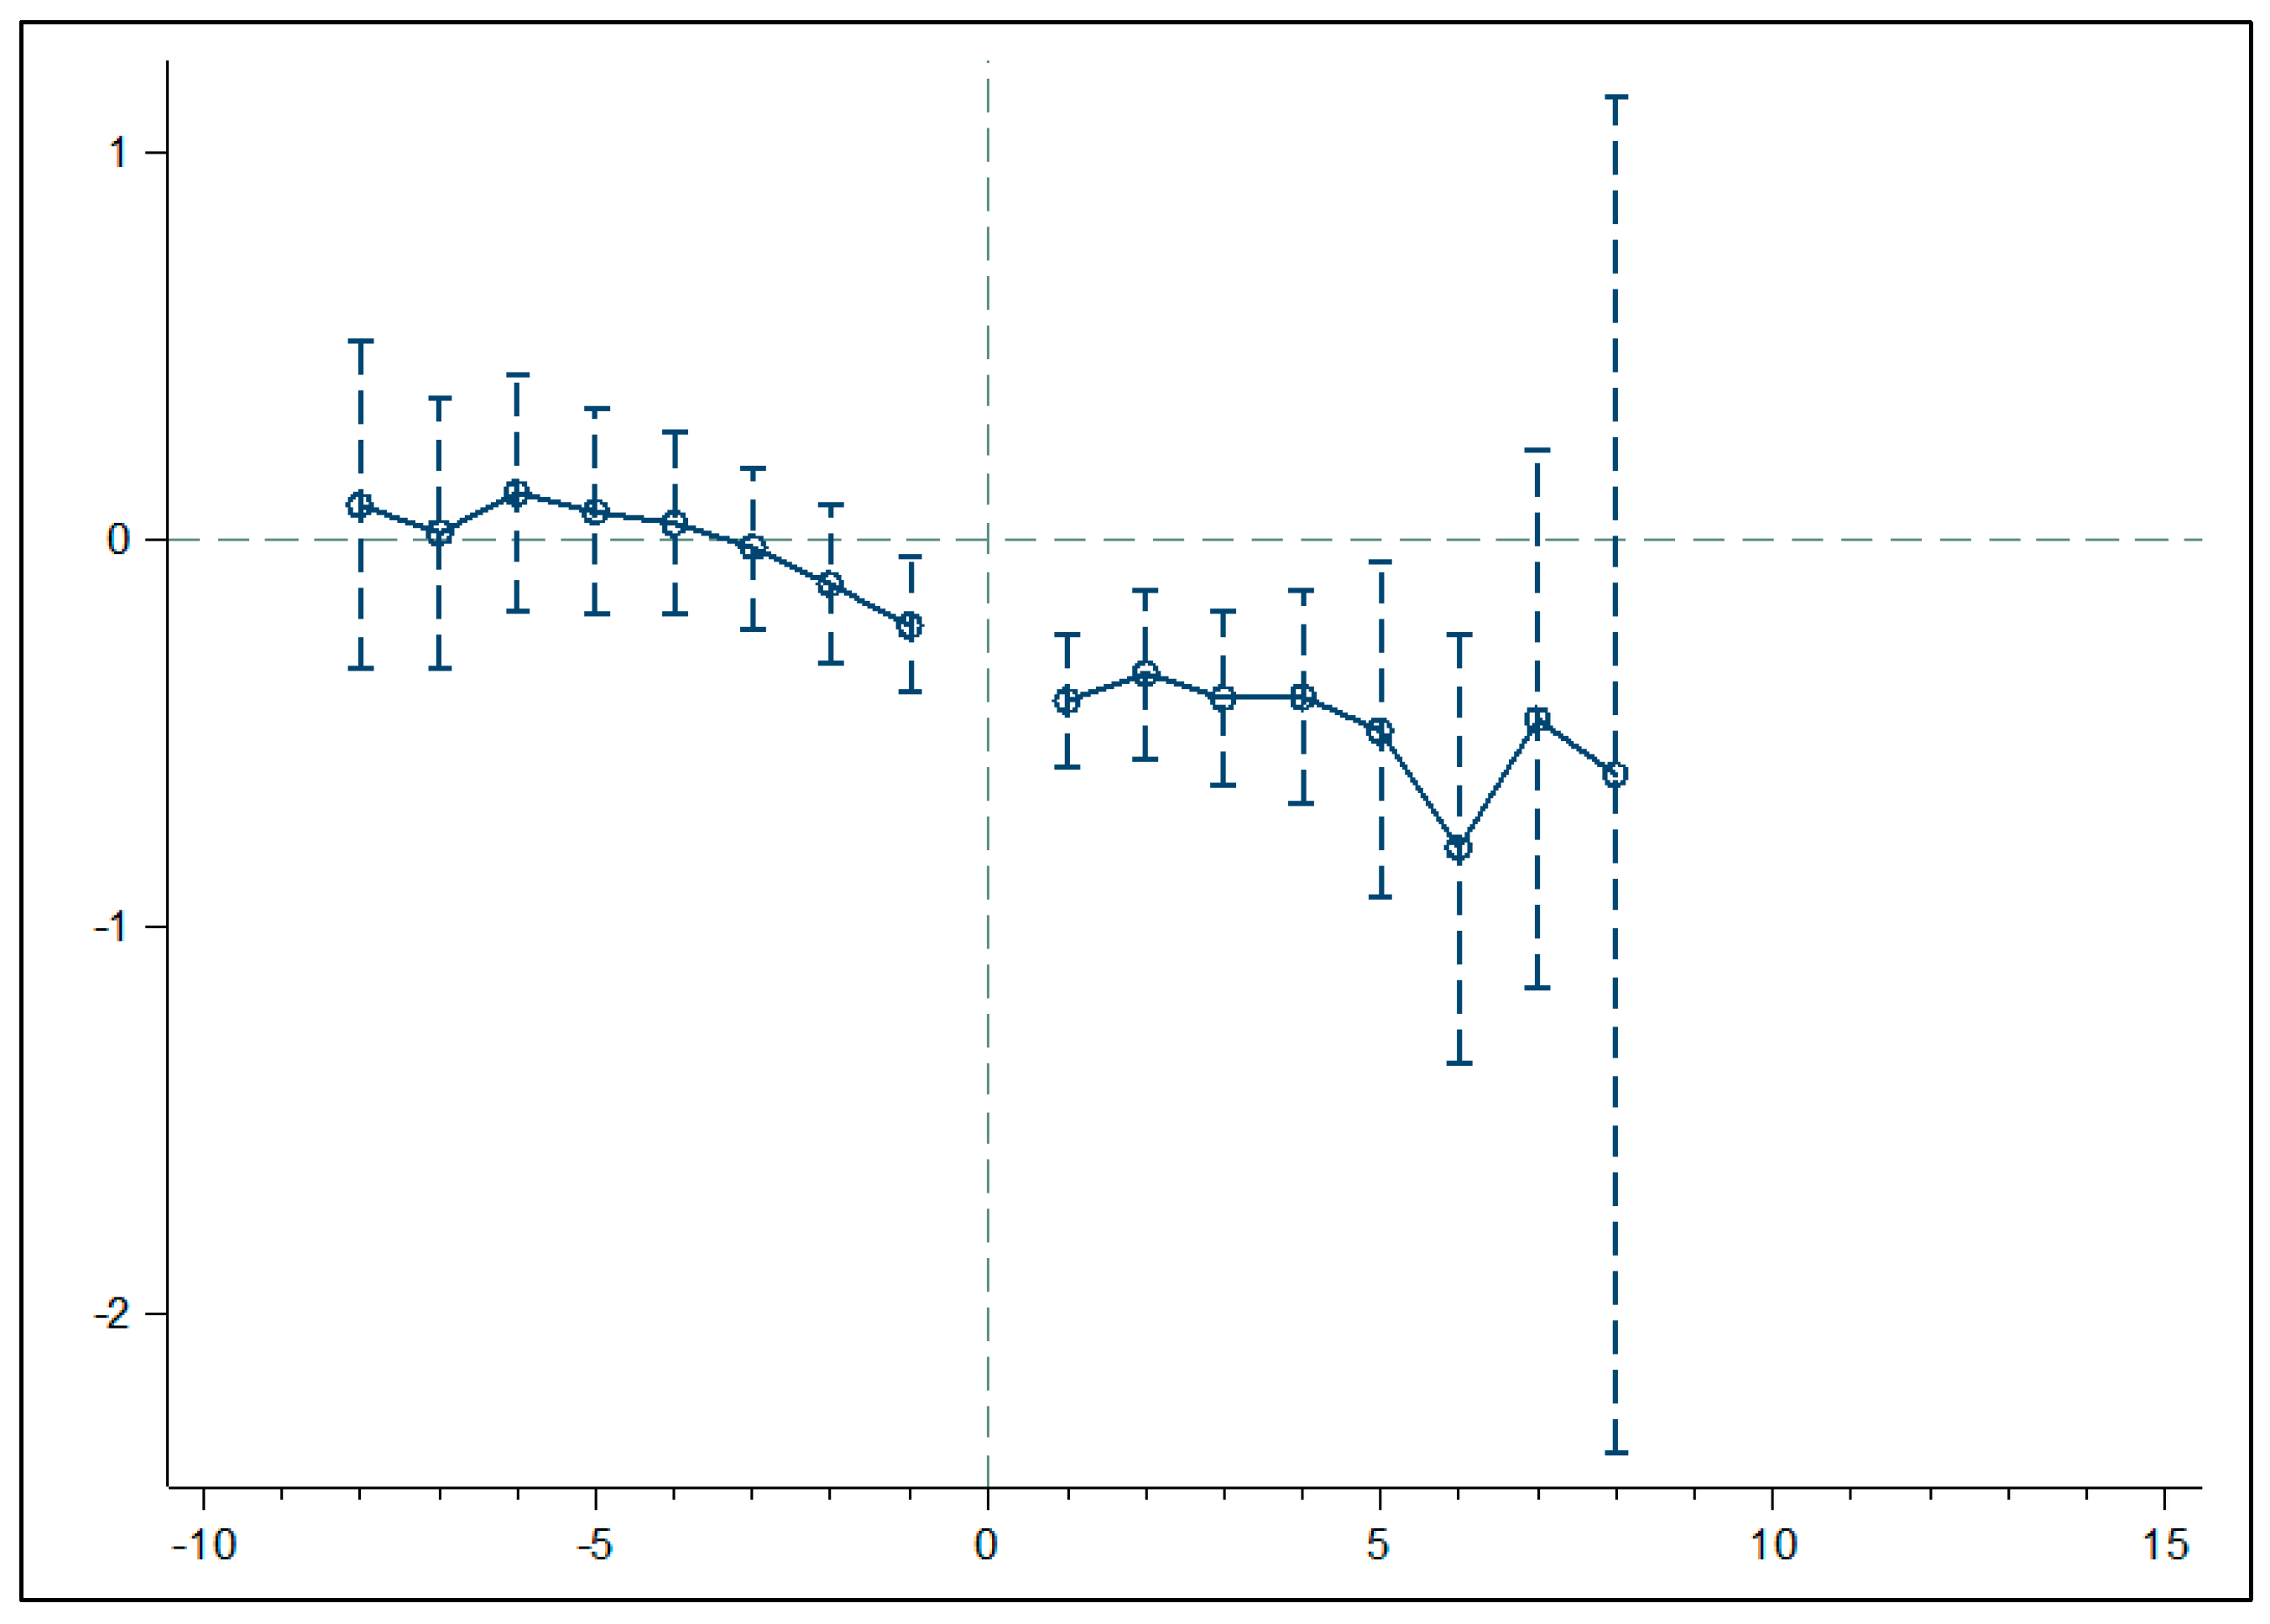
4.2. Baseline Regression of the Time–Varying DID Method
4.3. Endogenous Treatment
4.4. Robustness Checks
5. Conclusions and Discussion
Author Contributions
Funding
Conflicts of Interest
References
- Cheng, Z.; Wang, S.; Jiang, J.; Fu, Q.; Chen, C.; Xu, B.; Yu, J.; Fu, X.; Hao, J. Long–term trend of haze pollution and impact of particulate matter in the Yangtze River Delta, China. Environ. Pollut. 2013, 182, 101–110. [Google Scholar] [CrossRef] [PubMed]
- Zhang, A.; Zhong, L.; Xu, Y.; Wang, H.; Dang, L. Tourists’ perception of haze pollution and the potential impacts on travel: Reshaping the features of tourism seasonality in Beijing, China. Sustainability 2015, 7, 2397–2414. [Google Scholar] [CrossRef]
- Zhao, C.; Zhang, M.; Wang, W. Exploring the influence of severe haze pollution on residents’ intention to purchase energy–saving appliances. J. Clean. Prod. 2019, 212, 1536–1543. [Google Scholar] [CrossRef]
- Nguitragool, P. Negotiating the haze treaty: Rationality and institutions in the negotiations for the ASEAN Agreement on Transboundary Haze Pollution (2002). Asian Surv. 2011, 51, 356–378. [Google Scholar] [CrossRef]
- Stone, R. Counting the cost of London’s killer smog. Science 2002, 298, 2106–2107. [Google Scholar] [CrossRef]
- Carraro, C.; Siniscaico, D. Environmental policy reconsidered: The role of technological innovation. Eur. Econ. Rev. 1994, 38, 545–554. [Google Scholar] [CrossRef]
- Norberg–Bohm, V. Stimulating ‘green’technological innovation: An analysis of alternative policy mechanisms. Policy Sci. 1999, 32, 13–38. [Google Scholar] [CrossRef]
- Luo, L. The influence of institutional contexts on the relationship between voluntary carbon disclosure and carbon emission performance. Account. Financ. 2019, 59, 1235–1264. [Google Scholar] [CrossRef]
- Hahn, R.W.; Stavins, R.N. Economic incentives for environmental protection: Integrating theory and practice. Am. Econ. Rev. 1992, 82, 464–468. [Google Scholar]
- Chen, Y.; Whalley, A. Green infrastructure: The effects of urban rail transit on air quality. Am. Econ. J. Econ. Polic. 2012, 4, 58–97. [Google Scholar] [CrossRef]
- Li, N.; Chen, J.-P.; Tsai, I.-C.; He, Q.; Chi, S.-Y.; Lin, Y.C.; Fu, T.-M. Potential impacts of electric vehicles on air quality in Taiwan. Sci. Total Environ. 2016, 566, 919–928. [Google Scholar] [CrossRef] [PubMed]
- Luo, Z.; Wan, G.; Wang, C.; Zhang, X. Urban pollution and road infrastructure: A case study of China. China Econ. Rev. 2018, 49, 171–183. [Google Scholar] [CrossRef]
- Yang, X.; Lin, S.; Li, Y.; He, M. Can high–speed rail reduce environmental pollution? Evidence from China. J. Clean. Prod. 2019, 239, 118135. [Google Scholar] [CrossRef]
- Dean, J.M.; Lovely, M.E.; Wang, H. Are foreign investors attracted to weak environmental regulations? Evaluating the evidence from China. J. Dev. Econ. 2009, 90, 1–13. [Google Scholar] [CrossRef]
- Li, J.; He, H.; Liu, H.; Su, C. Consumer responses to corporate environmental actions in China: An environmental legitimacy perspective. J. Bus. Ethics 2017, 143, 589–602. [Google Scholar] [CrossRef]
- Yin, J.; Zhang, Y. Institutional Dynamics and Corporate Social Responsibility (CSR) in an Emerging Country Context: Evidence from China. J. Bus. Ethics 2012, 111, 301–316. [Google Scholar] [CrossRef]
- Zeng, S.X.; Ma, H.Y.; Lin, H.; Zeng, R.C.; Tam, V.W.Y. Social responsibility of major infrastructure projects in China. Int. J. ProJ. Manag. 2015, 33, 537–548. [Google Scholar] [CrossRef]
- Feng, X.; Li, Q.; Zhu, Y.; Wang, J.; Liang, H.; Xu, R. Formation and dominant factors of haze pollution over Beijing and its peripheral areas in winter. Atmos. Pollut. Res. 2014, 5, 528–538. [Google Scholar] [CrossRef]
- Huang, R.-J.; Zhang, Y.; Bozzetti, C.; Ho, K.-F.; Cao, J.-J.; Han, Y.; Daellenbach, K.R.; Slowik, J.G.; Platt, S.M.; Canonaco, F. High secondary aerosol contribution to particulate pollution during haze events in China. Nature 2014, 514, 218. [Google Scholar] [CrossRef]
- Wang, Y.; Yao, L.; Wang, L.; Liu, Z.; Ji, D.; Tang, G.; Zhang, J.; Sun, Y.; Hu, B.; Xin, J. Mechanism for the formation of the January 2013 heavy haze pollution episode over central and eastern China. Sci. China Earth Sci. 2014, 57, 14–25. [Google Scholar] [CrossRef]
- Ding, A.; Huang, X.; Nie, W.; Sun, J.; Kerminen, V.M.; Petäjä, T.; Su, H.; Cheng, Y.; Yang, X.Q.; Wang, M. Enhanced haze pollution by black carbon in megacities in China. Geophys. Res. Lett. 2016, 43, 2873–2879. [Google Scholar] [CrossRef]
- Du Kang, D.; Lee, D.I.; Kwon, B.-H.; Kim, K.; Park, J.-K. Features of the detrended cross–correlation analysis in the time series between absorbable particulate matter and meteorological factors. JKPS 2013, 63, 10–17. [Google Scholar] [CrossRef]
- Li, C.K.; Luo, J.-H.; Soderstrom, N.S. Market response to expected regulatory costs related to haze. J. Account. Public Pol. 2017, 36, 201–219. [Google Scholar] [CrossRef]
- Wang, H.; Xu, J.; Zhang, M.; Yang, Y.; Shen, X.; Wang, Y.; Chen, D.; Guo, J. A study of the meteorological causes of a prolonged and severe haze episode in January 2013 over central–eastern China. Atmos. Environ. 2014, 98, 146–157. [Google Scholar] [CrossRef]
- Ziyarati, M.T.; Bahramifar, N.; Baghmisheh, G.; Younesi, H. Greenhouse gas emission estimation of flaring in a gas processing plant: Technique development. PSEP 2019, 123, 289–298. [Google Scholar] [CrossRef]
- Zhang, J.; Wang, G. Energy saving technologies and productive efficiency in the Chinese iron and steel sector. Energy 2008, 33, 525–537. [Google Scholar] [CrossRef]
- Chen, Z. Impacts of high–speed rail on domestic air transportation in China. J. Transp. Geogr. 2017, 62, 184–196. [Google Scholar] [CrossRef]
- Lin, Y. Travel costs and urban specialization patterns: Evidence from China’s high speed railway system. J. Urban Econ. 2017, 98, 98–123. [Google Scholar] [CrossRef]
- Kim, Y.-G.; Kim, S.-W.; Mok, J.-Y.; Kim, S.-S.; Kim, K.-H. Estimation of ride comfort for Korean high speed train at high speed. JKSR 2007, 10, 146–152. [Google Scholar]
- Willigers, J.; van Wee, B. High–speed rail and office location choices. A stated choice experiment for the Netherlands. J. Transp. Geogr. 2011, 19, 745–754. [Google Scholar] [CrossRef]
- Chen, Z.; Haynes, K.E. Impact of high–speed rail on international tourism demand in China. Appl. Econ. Lett. 2015, 22, 57–60. [Google Scholar] [CrossRef]
- Haynes, K.E. Labor markets and regional transportation improvements: The case of high–speed trains An introduction and review. Ann. Reg. Sci. 1997, 31, 57–76. [Google Scholar] [CrossRef]
- Levinson, D.M. Accessibility impacts of high–speed rail. J. Transp. Geogr. 2012, 22, 288–291. [Google Scholar] [CrossRef]
- Blanquart, C.; Koning, M. The local economic impacts of high–speed railways: Theories and facts. Eur. Transp. Res. Rev. 2017, 9, 12. [Google Scholar] [CrossRef]
- Hornung, E. Railroads and growth in Prussia. J. Eur. Econ. Assoc. 2015, 13, 699–736. [Google Scholar] [CrossRef]
- Tierney, S. High–speed rail, the knowledge economy and the next growth wave. J. Transp. Geogr. 2012, 22, 285–287. [Google Scholar] [CrossRef]
- Laumbach, R.J.; Kipen, H.M. Respiratory health effects of air pollution: Update on biomass smoke and traffic pollution. J. Allergy Clin. Immunol. 2012, 129, 3–11. [Google Scholar] [CrossRef]
- Ahmed, C.; Jiang, H.; Chen, J.Y.; Lin, Y.-H. Traffic–related particulate matter and cardiometabolic syndrome: A review. Atmosphere 2018, 9, 336. [Google Scholar] [CrossRef]
- Bourne, R.R.; Collaborators, G.R.F. Global, regional, and national comparative risk assessment of 79 behavioural, environmental and occupational, and metabolic risks or clusters of risks, 1990–2015: A systematic analysis for the Global Burden of Disease Study 2015. The Lancet 2016, 388, 1659–1724. [Google Scholar]
- Skinner, M.W.; Joseph, A.E.; Kuhn, R.G. Social and environmental regulation in rural China: Bringing the changing role of local government into focus. Geoforum 2003, 34, 267–281. [Google Scholar] [CrossRef]
- Buysse, K.; Verbeke, A. Environmental strategy choice and financial profitability: Differences between multinationals and domestic firms in belgium. RGSM 2003, 9, 43–63. [Google Scholar]
- Jofre–Monseny, J.; Sole–Olle, A. Tax Differentials in Intraregional Firm Location: Evidence from New Manufacturing Establishments in Spanish Municipalities. Reg. Stud. 2010, 44, 663–677. [Google Scholar] [CrossRef]
- Wang, R.; Wijen, F.; Heugens, P.P. Government’s green grip: Multifaceted state influence on corporate environmental actions in China. Strateg. Manag. J. 2018, 39, 403–428. [Google Scholar] [CrossRef]
- Wang, H.; Qian, C. Corporate philanthropy and corporate financial performance: The roles of stakeholder response and political access. Acad. Manag. J. 2011, 54, 1159–1181. [Google Scholar] [CrossRef]
- Lerner, J. Venture capitalists and the oversight of private firms. J. Financ. 1995, 50, 301–318. [Google Scholar] [CrossRef]
- Hortaçsu, A.; Martínez–Jerez, F.; Douglas, J. The geography of trade in online transactions: Evidence from eBay and mercadolibre. Am. Econ. J. MicroEcon. 2009, 1, 53–74. [Google Scholar] [CrossRef]
- Kim, K.H.; Kim, K.S.; Kim, D.Y.; Kim, J.H.; Kang, S.H. Brand equity in hospital marketing. J. Bus. Res. 2008, 1, 75–82. [Google Scholar] [CrossRef]
- Bertot, J.C.; Jaeger, P.T.; Grimes, J.M. Using ICTs to create a culture of transparency: E–government and social media as openness and anti–corruption tools for societies. Gov. Inform. Q. 2010, 27, 264–271. [Google Scholar] [CrossRef]
- Sturges, P. Corruption, transparency and a role for ICT. IJIE 2004, 2, 1–9. [Google Scholar]
- Gaskins, L.E. The Effect of Information and Communications Technology (ICT) Diffusion on Corruption and Transparency (a Global Study); Texas A&M International University: Laredo, TX, USA, 2013. [Google Scholar]
- Liang, K.-Y.; Zeger, S.L. Longitudinal data analysis using generalized linear models. Biometrika 1986, 73, 13–22. [Google Scholar] [CrossRef]
- Hardin, J.W.; Schmiediche, H.; Carroll, R.J. Instrumental variables, bootstrapping, and generalized linear models. Stata J. 2003, 3, 351–360. [Google Scholar] [CrossRef]
- Moffat, A.; Auer, A. Corporate Environmental Innovation (CEI): A government initiative to support corporate sustainability leadership. J. Clean. Prod. 2006, 14, 589–600. [Google Scholar] [CrossRef]
- Clò, S.; Ferraris, M.; Florio, M. Ownership and environmental regulation: Evidence from the European electricity industry. Energy Econ. 2017, 61, 298–312. [Google Scholar] [CrossRef]
- De Roeck, K.; Delobbe, N. Do environmental CSR initiatives serve organizations’ legitimacy in the oil industry? Exploring employees’ reactions through organizational identification theory. J. Bus. Ethics 2012, 110, 397–412. [Google Scholar] [CrossRef]
- Depoers, F.; Jeanjean, T.; Jérôme, T. Voluntary disclosure of greenhouse gas emissions: Contrasting the carbon disclosure project and corporate reports. J. Bus. Ethics 2016, 134, 445–461. [Google Scholar] [CrossRef]
- Fiorani, M.; Tombaz, S.; Martensson, J.; Skubic, B.; Wosinska, L.; Monti, P. Modeling energy performance of C–RAN with optical transport in 5G network scenarios. Jocn 2016, 8, B21–B34. [Google Scholar] [CrossRef]
- He, J. Pollution haven hypothesis and environmental impacts of foreign direct investment: The case of industrial emission of sulfur dioxide (SO2) in Chinese provinces. Ecol. Econ. 2006, 60, 228–245. [Google Scholar] [CrossRef]
- Shao, S.; Yang, L.; Yu, M.; Yu, M. Estimation, characteristics, and determinants of energy–related industrial CO2 emissions in Shanghai (China), 1994–2009. Energy Policy 2011, 39, 6476–6494. [Google Scholar] [CrossRef]
- Kan, H.; London, S.J.; Chen, G.; Zhang, Y.; Song, G.; Zhao, N.; Jiang, L.; Chen, B. Season, sex, age, and education as modifiers of the effects of outdoor air pollution on daily mortality in Shanghai, China: The Public Health and Air Pollution in Asia (PAPA) Study. Environ. Health Persp. 2008, 116, 1183–1188. [Google Scholar] [CrossRef]
- Beck, T.; Levine, R.; Levkov, A. Big bad banks? The winners and losers from bank deregulation in the United States. J. Financ. 2010, 65, 1637–1667. [Google Scholar] [CrossRef]
- Wang, C.; Mo, B.; He, Z.; Xie, X.; Zhao, C.X.; Zhang, L.; Shao, Q.; Guo, X.; Wujcik, E.K.; Guo, Z. Hydroxide ions transportation in polynorbornene anion exchange membrane. Polymer 2018, 138, 363–368. [Google Scholar] [CrossRef]
- Heckman, J.J. Statistical Models for Discrete Panel Data; Department of Economics and Graduate School of Business, University of Chicago: Chicago, IL, USA, 1979. [Google Scholar]
- Del Pero, F.; Delogu, M.; Pierini, M.; Bonaffini, D. Life Cycle Assessment of a heavy metro train. J. Clean. Prod. 2015, 87, 787–799. [Google Scholar] [CrossRef]
- Delogu, M.; Del Pero, F.; Berzi, L.; Pierini, M.; Bonaffini, D. End–of–Life in the railway sector: Analysis of recyclability and recoverability for different vehicle case studies. Waste Manag. 2017, 60, 439–450. [Google Scholar] [CrossRef] [PubMed]


| Variables | Definitions |
|---|---|
| LnPM10 | Haze score (μg /m3) |
| WheHSR | HSR dummy: If the city opens an HSR in the observation year, HSR = 1; otherwise, HSR = 0. |
| Govexpend | Government expenditures/GDP (%) |
| Phonepeople | Number of mobile users/total population (%) |
| Govregulation | Investment of industrial pollution control/GDP (%) |
| Lnoilhome | Total oil supply/total population (tons/10,000 people) |
| Lngashome | Total gas supply/total population (tons/10,000 people) |
| Lnpublictrans | Public buses per 10,000people (unit) |
| Lnaveragepay | Average wage of workers (yuan) |
| Secondgdp | Output value of the secondary industry/GDP (%) |
| Lnfdi | Actual foreign investment/GDP (%) |
| Lnpergdp | Per capita GDP (yuan) |
| Lnnumhistu | Number of high school students/total population (%) |
| Lnsciemplo | Number of scientific research employees/total population (%) |
| Secondemploy | Number of secondary industry employees/total population (%) |
| Lnpopdensity | Population density (10,000people/km2) |
| HSR=1 | HSR=0 | ||||||||
|---|---|---|---|---|---|---|---|---|---|
| Variable | Observation | Mean | St.Er | Min | Max | Mean | St.Er | Min | Max |
| LnPM10 | 3409 | 12.42 | 4.13 | 2.77 | 16.92 | 12.92 | 2.60 | 2.77 | 16.92 |
| Govexpend | 3395 | 0.30 | 0.22 | 0.08 | 2.43 | 0.28 | 0.30 | 0.07 | 4.94 |
| Phonepeople | 3433 | 56.73 | 705.11 | 0.03 | 11841.22 | 46.10 | 260.98 | 0.02 | 7590.31 |
| Lnoilhome | 3106 | 3.72 | 1.41 | 0.01 | 7.23 | 2.74 | 1.52 | 0.01 | 8.33 |
| Lngashome | 3326 | 3.62 | 1.38 | 0.01 | 7.96 | 3.30 | 1.33 | 0.15 | 8.58 |
| Lnpublictrans | 2862 | 2.26 | 0.59 | 0.77 | 5.42 | 1.90 | 0.60 | 0.28 | 4.65 |
| Lnaveragepay | 3434 | 10.85 | 0.32 | 9.56 | 11.70 | 10.38 | 0.44 | 8.51 | 11.70 |
| Secondgdp | 3154 | 48.43 | 10.18 | 18.57 | 79.36 | 49.41 | 10.92 | 15.70 | 89.34 |
| Lnfdi | 3282 | 0.00 | 0.00 | 0.00 | 0.03 | 0.01 | 0.01 | 0.01 | 0.17 |
| Govregulate | 3407 | 2.40 | 0.56 | 0.68 | 4.34 | 2.69 | 0.64 | 0.68 | 4.61 |
| Lnpergdp | 3154 | 10.76 | 0.57 | 9.09 | 12.28 | 10.17 | 0.70 | 7.66 | 12.28 |
| Lnnumhistu | 3321 | 11.24 | 1.14 | 8.02 | 13.78 | 10.17 | 1.30 | 5.45 | 13.78 |
| Lnsciemplo | 3434 | 2.05 | 1.64 | 0.01 | 5.50 | 0.63 | 1.18 | 0.01 | 5.11 |
| Secondemploy | 3436 | 48.28 | 13.82 | 8.12 | 83.30 | 43.26 | 14.17 | 1.77 | 83.30 |
| Lnpopdensity | 2865 | 6.15 | 0.67 | 3.83 | 7.88 | 5.65 | 0.93 | 1.57 | 7.87 |
| LnPM10 | 1 | 2 | 3 | 4 | 5 | 6 | 7 | 8 | 9 | 10 | 11 | 12 | 13 | 14 | |
|---|---|---|---|---|---|---|---|---|---|---|---|---|---|---|---|
| 1.WheHSR | −0.07 | 1.00 | |||||||||||||
| 2.Govexpend | −0.48 | 0.03 | 1.00 | ||||||||||||
| 3.Phonepeople | 0.01 | −0.07 | −0.07 | 1.00 | |||||||||||
| 4.govregulate | 0.06 | −0.18 | −0.07 | 0.11 | 1.00 | ||||||||||
| 5.Lnoilhome | 0.06 | 0.27 | −0.12 | 0.00 | −0.04 | 1.00 | |||||||||
| 6.Lngashome | 0.05 | 0.10 | −0.21 | 0.13 | −0.22 | 0.28 | 1.00 | ||||||||
| 7.Lnpublictrans | 0.36 | 0.21 | −0.24 | 0.04 | −0.11 | 0.47 | 0.37 | 1.00 | |||||||
| 8.Lnaveragepay | −0.07 | 0.42 | 0.27 | −0.19 | −0.34 | 0.41 | 0.14 | 0.35 | 1.00 | ||||||
| 9.Secondgdp | 0.27 | −0.04 | −0.35 | 0.03 | 0.04 | 0.23 | 0.06 | 0.20 | 0.06 | 1.00 | |||||
| 10.Lnfdi | −0.07 | 0.00 | 0.05 | 0.00 | −0.05 | 0.00 | 0.06 | 0.01 | −0.03 | 0.00 | 1.00 | ||||
| 11.Lnpergdp | 0.49 | 0.32 | −0.22 | −0.06 | −0.27 | 0.60 | 0.43 | 0.59 | 0.73 | 0.37 | 0.01 | 1.00 | |||
| 12.Lnnumhistu | 0.17 | 0.33 | −0.14 | 0.00 | −0.14 | 0.42 | 0.29 | 0.51 | 0.28 | −0.05 | 0.01 | 0.42 | 1.00 | ||
| 13.Lnsciemplo | −0.17 | 0.41 | 0.21 | −0.11 | −0.10 | 0.29 | 0.03 | 0.18 | 0.68 | −0.14 | −0.03 | 0.43 | 0.19 | 1.00 | |
| 14.Secondemploy | 0.23 | 0.14 | −0.29 | 0.03 | −0.09 | 0.37 | 0.25 | 0.36 | 0.19 | 0.57 | −0.03 | 0.51 | 0.21 | 0.07 | 1.00 |
| 15.Lnpopdensity | 0.16 | 0.20 | −0.27 | 0.04 | −0.27 | 0.16 | 0.23 | 0.15 | 0.09 | 0.12 | 0.01 | 0.16 | 0.47 | 0.02 | 0.39 |
| Variables | Model1 | Model2 | Model 3 | Model 4 | Model 5 | Model 6 |
|---|---|---|---|---|---|---|
| DID | −0.17 *** | −0.19 *** | −0.16 ** | −0.18 *** | −0.20 *** | |
| (−2.78) | (−2.76) | (−2.23) | (−2.72) | (−2.60) | ||
| DID*Lnphonepeople | 0.07* | |||||
| (1.78) | ||||||
| Lnphonepeople | 0.17 ** | 0.16 ** | ||||
| (2.44) | (2.32) | |||||
| DID*Govexpend | −0.21 * | |||||
| (−1.68) | ||||||
| Govexpend | 0.16 | 0.18 | ||||
| (0.90) | (0.94) | |||||
| Govregulate | 0.07 | 0.08 | 0.08 | 0.08 | 0.07 | 0.07 |
| (1.28) | (1.44) | (1.50) | (1.50) | (1.33) | (1.33) | |
| Lnoilhome | 0.03 | 0.03 | 0.02 | 0.01 | 0.03 | 0.03 |
| (0.85) | (0.95) | (0.50) | (0.47) | (1.05) | (1.05) | |
| Lngashome | −0.04 | −0.04 | −0.06 * | −0.06 ** | −0.05 | −0.05 |
| (−1.33) | (−1.40) | (−1.93) | (−1.97) | (−1.48) | (−1.46) | |
| Lnpublictrans | 0.08 | 0.09 | 0.08 | 0.08 | 0.09 | 0.09 |
| (1.18) | (1.33) | (1.20) | (1.17) | (1.29) | (1.29) | |
| Lnaveragepay | 0.40 * | 0.43 ** | 0.41 * | 0.41 * | 0.38 * | 0.38 * |
| (1.90) | (2.03) | (1.92) | (1.95) | (1.78) | (1.79) | |
| Secondgdp | 0.02 *** | 0.02 *** | 0.02 *** | 0.02 *** | 0.02 *** | 0.02 *** |
| (4.38) | (4.32) | (4.41) | (4.44) | (4.20) | (4.21) | |
| Lnfdi | 1.18 | 1.23 | 1.25 | 1.21 | 1.09 | 1.07 |
| (0.65) | (0.67) | (0.68) | (0.66) | (0.60) | (0.58) | |
| Lnpergdp | 0.24 * | 0.24 * | 0.18 | 0.17 | 0.26 ** | 0.26 ** |
| (1.87) | (1.86) | (1.38) | (1.32) | (2.02) | (2.02) | |
| Lnnumhistu | 0.24 *** | 0.23 *** | 0.23 *** | 0.24 *** | 0.23 *** | 0.24 *** |
| (4.48) | (4.57) | (4.57) | (4.58) | (4.55) | (4.56) | |
| Lnsciemplo | −0.14 *** | −0.13 *** | −0.14 *** | −0.14 *** | −0.13 *** | −0.13 *** |
| (−2.92) | (−2.74) | (−2.77) | (−2.91) | (−2.76) | (−2.76) | |
| Secondemploy | 0.01 | 0.01 | 0.01 | 0.01 | 0.01 | 0.01 |
| (0.50) | (0.51) | (0.58) | (0.65) | (0.53) | (0.52) | |
| Lnpopdensity | −0.07 | −0.06 | −0.05 | −0.06 | −0.06 | −0.06 |
| (−0.96) | (−0.81) | (−0.78) | (−0.82) | (−0.88) | (−0.88) | |
| Constant | 3.11 | 2.73 | 2.23 | 2.30 | 3.01 | 2.97 |
| (1.58) | (1.39) | (1.13) | (1.16) | (1.52) | (1.50) | |
| Year fixed | Yes | Yes | Yes | Yes | Yes | Yes |
| N | 2327 | 2327 | 2327 | 2327 | 2313 | 2313 |
| Wald Chi2 | 1018.87 | 1030.55 | 1038.77 | 1043.50 | 1023.89 | 1023.99 |
| Model1 | Model2 | Model3 | Model4 | |
|---|---|---|---|---|
| VARIABLES | WheHSR | LnPM10 | WheHSR | LnPM10 |
| WheHSR | −0.23 *** | −0.16 ** | ||
| (−3.13) | (−2.35) | |||
| Lambda | 2.08 *** | −1.11 ** | ||
| (4.50) | (−2.02) | |||
| Trainyear | −0.01 *** | |||
| (−3.93) | ||||
| Latitude | 0.01 | |||
| (0.34) | ||||
| Govregulate | 0.08 | 0.19 *** | −0.01 | 0.08 |
| (0.95) | (2.82) | (−0.17) | (1.60) | |
| Lnoilhome | 0.18 *** | 0.31 *** | 0.09 *** | −0.06 |
| (5.07) | (4.21) | (2.97) | (−1.13) | |
| Lngashome | −0.05 | −0.12 *** | 0.03 | −0.07 ** |
| (−1.47) | (−2.96) | (0.81) | (−2.15) | |
| Lnpublictrans | 0.12 | 0.24 *** | 0.11 | −0.02 |
| (1.42) | (2.63) | (1.43) | (−0.24) | |
| Lnaveragepay | 0.46 * | 1.30 *** | 0.16 | 0.22 |
| (1.74) | (4.29) | (0.68) | (0.99) | |
| Secondgdp | −0.01 | 0.02 *** | 0.01 | 0.01 *** |
| (−0.35) | (4.20) | (0.49) | (3.36) | |
| Lnfdi | −1.40 | 0.64 | 2.43 | −2.27 |
| (−0.29) | (0.23) | (0.60) | (−1.05) | |
| Lnpergdp | −0.09 | −0.23 | −0.10 | 0.37 *** |
| (−0.74) | (−1.36) | (−0.86) | (2.72) | |
| Lnnumhistu | 0.02 | 0.29 *** | 0.18 *** | 0.07 |
| (0.43) | (4.15) | (4.66) | (0.71) | |
| Lnsciemplo | −0.08 | −0.33 *** | −0.03 | −0.06 |
| (−1.00) | (−4.84) | (−0.34) | (−1.10) | |
| Secondemploy | −0.01 ** | −0.01* | −0.01 | 0.01 |
| (−2.39) | (−1.82) | (−1.48) | (1.58) | |
| Lnpopdensity | 0.19 *** | 0.29 ** | 0.27 *** | −0.31 ** |
| (2.71) | (2.51) | (4.63) | (−2.22) | |
| Constant | −6.49 *** | −9.32 *** | −6.65 *** | 9.85 ** |
| (−2.98) | (−2.71) | (−3.25) | (2.52) | |
| Year Fixed | Yes | Yes | Yes | Yes |
| N | 1563 | 1537 | 2341 | 2307 |
| Wald Chi2 | 453.73 | 700.56 | 516.49 | 1048.7 |
| Model1 | Model2 | Model3 | Model4 | Model5 | Model6 | Model7 | Model8 | |
|---|---|---|---|---|---|---|---|---|
| Variables | CO2 | SO2 | without Municipalities | Without Municipalities & Autonomous | 2007–2011 | 2005–2013 | LnPM10 | LnPM10 |
| DID | −0.05 ** | −0.03 | −0.17 *** | −0.13 * | −0.22 ** | −0.22 *** | −0.11 | −0.23 *** |
| (−2.12) | (−0.66) | (−2.42) | (−1.82) | (−2.35) | (−2.81) | (−1.24) | (−2.78) | |
| DID*Lninternetpeople | 0.04 ** | |||||||
| (2.50) | ||||||||
| Lninternetpeople | 0.05 * | |||||||
| (1.65) | ||||||||
| DID*Lnemployee | 0.01 | |||||||
| (0.10) | ||||||||
| Lnemployee | −0.05 | |||||||
| (−1.01) | ||||||||
| Constant | −2.40 *** | 7.76 *** | 3.47 * | 3.59 * | −0.67 | 1.41 | 1.34 | 1.43 |
| (−2.66) | (6.30) | (1.73) | (1.77) | (−0.25) | (0.67) | (0.63) | (0.67) | |
| Control | Yes | Yes | Yes | Yes | Yes | Yes | Yes | Yes |
| Year fixed | Yes | Yes | Yes | Yes | Yes | Yes | Yes | Yes |
| N | 1761 | 2345 | 2311 | 2119 | 1439 | 2080 | 2077 | 2071 |
| Wald Chi2 | 850.96 | 843.98 | 1008.74 | 955.51 | 565.16 | 940.64 | 1047.21 | 1028.4 |
© 2020 by the authors. Licensee MDPI, Basel, Switzerland. This article is an open access article distributed under the terms and conditions of the Creative Commons Attribution (CC BY) license (http://creativecommons.org/licenses/by/4.0/).
Share and Cite
Chen, Y.; Wang, Y.; Hu, R. Sustainability by High–Speed Rail: The Reduction Mechanisms of Transportation Infrastructure on Haze Pollution. Sustainability 2020, 12, 2763. https://doi.org/10.3390/su12072763
Chen Y, Wang Y, Hu R. Sustainability by High–Speed Rail: The Reduction Mechanisms of Transportation Infrastructure on Haze Pollution. Sustainability. 2020; 12(7):2763. https://doi.org/10.3390/su12072763
Chicago/Turabian StyleChen, Yu, Yuandi Wang, and Ruifeng Hu. 2020. "Sustainability by High–Speed Rail: The Reduction Mechanisms of Transportation Infrastructure on Haze Pollution" Sustainability 12, no. 7: 2763. https://doi.org/10.3390/su12072763
APA StyleChen, Y., Wang, Y., & Hu, R. (2020). Sustainability by High–Speed Rail: The Reduction Mechanisms of Transportation Infrastructure on Haze Pollution. Sustainability, 12(7), 2763. https://doi.org/10.3390/su12072763