Article

Comparison of Energy Efficiency Indicators of Road Transportation for Modeling Environmental Sustainability in “Green” Circular Industry

1
Faculty of Science and Forestry, University of Eastern Finland, P.O. Box 111, FI-80101 Joensuu, Finland
2
Stora Enso Wood Supply Finland, P.O. Box 309, FI-00101 Helsinki, Finland
*
Author to whom correspondence should be addressed.
Sustainability 2020, 12(7), 2740; https://doi.org/10.3390/su12072740
Submission received: 21 February 2020 / Revised: 27 March 2020 / Accepted: 28 March 2020 / Published: 31 March 2020

Abstract

:
The Finnish forest industry is committed to applying novel technologies for increasing carbon-neutral development and environmental sustainability in “green” circular industry. This study compares the energy efficiency indicators of road freight transportation. Additionally, effects of four mass limits of vehicle combinations are analyzed after a three-year adaptation process that took place in a wood procurement region of 100% renewable resources. The wood-based energy efficiency model (load’s wood energy/fossil transport energy) was the most accurate and precise measure as the development indicator. The indicator showed that the transportation systems (60, 64, 68, and 76 t) and (64, 68, and 76 t) were carbon negative (122, 133, 144, and 108) (142, 147, and 133) in 2014 and 2016, respectively. The numbers reveal positive energy ratio of renewable wood and fossil fuels. In comparison to 60 t, the use of 68 t vehicles increased energy efficiency most effectively in the systems, by 18.0% and 20.5%, respectively. The indicator robustly revealed the energy efficiency of a partial system in the smaller supply region, which depended on the region’s transportation conditions. This novel knowledge can be applied for advancing the adaptation toward carbon-neutral supply networks. There is also the development potential of an industrial ecosystem model for optimizing the environmental sustainability of “green” circular industry.

1. Introduction

1.1. Decarbonizing Technologies of Transportation in Green Circular Economy

Scientists and governments around the world are making great efforts to reach the zero-carbon emission level in green circular economies [1]. Current research can identify promising carbon-negative technologies of renewable raw materials with carbon capture and sequestration as strategies for long-term climate change mitigation [2,3]. Thereby, the European Commission seeks efficient solutions to target Europe to consume less fossil energy. To reach greenhouse gas reductions and a low-carbon economy [4], the suggested steps are to reach a 40% cut by 2030 and a 60% cut by 2040 [5]. Under recent meetings, the EU has even agreed to carbon neutrality by 2050.
The Commission emphasizes that the change toward a low-carbon economy is feasible if the transportation sector contributes to achieving the steps. The transportation sector’s adaptation process is important because the Commission has anticipated that, without regulations, the quantity of road transportation (ton-kilometer, tkm) will increase to 80% above its 2005 level by 2030 [6,7]. Correspondingly, the EU will focus on the transition towards environmental sustainability in traffic, advancing the use of zero-emission transportation [8,9]. This means that the road freight transportation sector of production industry needs to implement technical, engineering-based energy efficiency improvements to ensure that the climate goals will be attained [6,10]. In addition, the development of road transportation logistics and supply system-specific energy efficiency measurements will be necessary to reach the goals and to fulfill the sustainability criteria of greenhouse gas reductions (≥60%) [11,12,13].
As with any new sustainability directive, countries are faced with ongoing challenges when designing optimum roadmaps toward environmental sustainability [14]. As an example, the Ministry of Transport and Communications of Finland has published a new proposal for an action plan for eliminating greenhouse gas emissions in transportation by 2045 [9]. According to the plan, the technical energy efficiency of trucks will be developed to the Euro VI standard, which is to be assessed no later than 2020. Besides that, the solution for carbon-free traffic lies in energy efficient applications of road transportation systems and logistics in a green circular economy. In practice, however, the available renewable wood resources of RES (renewable energy sources) in EU countries are limited for both forest and biofuel industries [15,16,17]. In theory, the potential amount of sustainable energy from extensive production systems of forest wood could range from 625 to 898 million m3 yr-1 (i.e., from 5312 to 7633 PJ (Petajoule), respectively) in 2030, while the annual total demand for transportation fuels is 18,123 PJ, if the fuel consumption can be retained at the level of 2015 [18]. This means that only in some countries could the available wood resources replace the national fossil fuel consumption of road freight transportation [11,19]. This may be possible in Finland because annual wood increase (growth) is larger than decrease in wood stock of forests (Figure 1). However, at the long-term circular base (e.g., 50 years), it is apparent that forests’ viable carbon sink can only be retained by increasing the country’s forest thinning and clear cutting. In this respect, wood harvesting has increased too slowly during recent decades.
Figure 1 shows an unbalanced forestry situation (20%) that has continued for about 40 years and is actually a threat for a long-term balanced carbon sink. Therefore, the government approved its climate and energy strategy for 2030 in 2016, and set an objective that the renewable energy share of the market should be raised by 50% or more by 2030 [20]. Ultimately, the government aims to create a 100% carbon-neutral energy base, emphasizing the country’s forests as a source for energy, fuel, and other sustainable products (green circular economy) [11]. However, there is a wide research gap in terms of integrating RES into a forest-industrial energy symbiosis. In addition to balancing sustainable forestry, the environmental sustainability of green circular industry presupposes that wood as RES is utilized in balanced wood-flow systems (Figure 2) [11,21]. Apart from midstream and downstream [22,23], the focus is on upstream of RES—that is, the supply network of company suppliers. On the other hand, Mirkouei et al. [24] integrated RES and production to calculate the carbon balance of midstream of a supply chain system for a crude bio-oil production plant. Here, utilization of renewable wood biomass occurs through a dynamic supply network with hundreds of mills, e.g., by balancing carbon via transportation operation (activities) through the utilization of energy-efficiency measures in multi-objective operations research [11]. This requires closer external collaboration across logistics companies and firms, an information process which should be made more efficient in the country’s dynamic industrial ecosystems [25,26,27,28,29].
Correspondingly, the forest industry optimizes energy-, information-, monetary-, and wood- flows of the ecosystem model and advances the green circular economy through the development of carbon-neutral production and energy efficient logistics operations [11,30]. These companies (e.g., Metsä Group, Stora Enso, and UPM-Kymmene) are global providers of renewable solutions for global markets. In practice, companies’ eco-industrial parks are managed by a policy for energy and carbon, using technically and commercially feasible technology to seek to substitute fossil-based and other non-renewable materials with renewable raw materials [31,32,33]. Actually, the forest industry is being moved towards environmental sustainability in an urban-rural symbiosis of the balanced industrial ecosystem [34,35,36].

1.2. Energy Efficiency Measurement of Road Freight Transportation

Several researchers have reported that road freight transportation is a significant carbon source [10,19,36,37,38]. Additionally, trucks are the cause of almost one-third of total exhaust emissions from transportation [39,40]. In countries with large forest areas and scattered population density, road transportation contributes to more than 20% of the negative climate impact in the forest industry [41]. On the other hand, road transportation is a necessary service from forests to industrial mills, which could be managed more effectively in current ecosystem models [34,35,36]. Furthermore, Trianni et al. [42] and Hakawati et al. [43] report that energy efficiency is considered the primary criterion of success amongst small-scale enterprises. Therefore, there is public pressure to adapt the vehicle combinations of transportation fleets to meet the increasing energy efficiency requirements of environmental sustainability. In this respect, the energy efficiency measurement of road transportation fleets is an important indicator and criterion about the state of sustainability of the forest industry, and deserves additional development work. Though countries are investing in renewable fuels, fossil fuels are still industrialized society’s most important fuel, accounting for 87% of global fuel consumption [44,45]. It is therefore also important to compare the energy efficiency of transportation fleets for fossil fuel consumption to the vehicle load’s renewable wood energy utilization (Figure 3).
Over the past three decades, comparisons of energy efficiencies have been made by using modeling frameworks from the optimization, system simulation, or combined ecosystem methodologies [10,36,43,46]. According to the literature, numerous operations studies have been conducted for a quite small raw-material procurement region of a single heating plant system [47,48]. However, an ecosystem environment of green circular industry is more complex and large forest industry organizations use mainly combined methods to solve decision-making problems in their wood procurement regions. In practice, the industry does not have its own timber transportation fleets. Therefore, about 200 trucks of 34 supply-chain entrepreneurs may be needed to transport wood from forests to industrial mills [48,49]. Currently, a synchronized transportation system (STS) is used in collaboration between procurement and supply organizations for the management of the environmental sustainability of the supply network [50] (Figure 4). The STS provides information systems and tools that can be used for calculating energy efficiency in separate transportation regions. Besides, in theory, new energy efficiency measures of transportation systems could be tailored to old planning methods and support wood procurement managers better in their decision making, in order to aim to solve energy efficiency goals related to environmental sustainability and carbon-neutral road freight transportation.
With respect to energy efficiency research frameworks, timber trucks’ and forest machines’ fossil fuel consumption has been investigated often in energy studies that relate to exhaust emissions [26,51]. Plants are also considered very often in research frameworks [46,52,53]. For example, Printz et al. [46] used trucks’ fuel economy (MWh l−1) to simulate the energy efficiency of the forest chip supply chain system. However, the energy efficiency of any logistics operation of the industrial ecosystem has only seldom been a research topic [11,28]. Correspondingly, accurate energy efficiency calculation in the transportation operation requires tailored measurements to ensure effective assessments of road freight transportation for a varying percentage of renewable wood (Figure 2) [11]. After that and under related boundary assumptions of different wood supply regions, the measurements can be used for robust energy efficiency evaluation toward concrete development of carbon neutral wood transportation fleets of the STS. In this study, four potential energy efficiency measurements are compared to find a robust calculation model in road transportation conditions of 100% renewable wood stock (Figure 1). It is also assumed that the best measure clearly indicates differences of the transportation systems in order to use the selected indicator later in an industrial optimization model for solving environmental problems of wood flow systems and networks (Figure 2).
The energy efficiency models of STSs will be tested in industrial ecosystem data with efficient vehicle technologies for increasing carbon neutrality. In this regard, selection of vehicle combinations is an important part of the adaptation process of the transportation fleet (Figure 4) [54]. In addition to decreased fossil fuel and increased biofuel consumption, recent studies have shown that the increase in carbon neutrality depends on the road transportation distance, the load’s size, and used vehicle combinations [11,50]. Tattini et al. [55] and Salvucci et al. [56] reported that different infrastructures (location of plants, lakes, boundaries, and border zones) may affect the energy efficiency of road transportation. This study also tests the models with respect to different regional transportation conditions in separate transportation regions in which fleets are adapted to the 76 t mass limit (Figure 5), thus providing a profound understanding about proper energy efficiency models in different operational conditions. Additionally, the results can be incorporated into wider studies that reformulate an optimization model of industrial ecosystem for improving environmental sustainability of a green circular industry [11]. Currently, the abovementioned information on energy efficiency measurement is not available among researchers, officials, and stakeholders of the forest industry. To sum up, this study has the following specific aims:
  • To analyze the energy efficiency measurement models to enable the development of a carbon-neutral road transportation fleet in the wood supply network of a green circular industry (forest stands of 100% renewable wood);
  • To reveal effects that different transportation regions might have on the energy efficiency of the STSs with respect to road freight transportation conditions; and
  • To provide the useful energy efficiency indicator of the STS to advance the transport fleet’s structure of local enterprises for improving carbon neutrality in their supply chains toward environmental sustainability in supply networks of the forest industry.

2. Material and Methods

2.1. Data

The study data was collected in two parts. The earlier road freight transportation material was collected from the enterprise resource planning (ERP) system between 1/1/2014 and 4/30/2014. A forest industry company provided the data about timber delivery from forests to its plant destinations in the northern study area (Figure 5). The eastern Finland area was divided into three regions (A, B, and C) based on different transportation conditions (Figure 5)
The material consists of 31 vehicle combinations that delivered 1496 laden loads to plants. This synchronized transportation system consists of 60, 64, 68, and 76 t vehicle combinations. The brand distribution of the data on transportation vehicles is relatively the same: The share of Volvo was 55% of vehicle combinations, and the share of Scania was 45%. Their engine powers were between 445 and 545 kW and model years between 2007 and 2014. They were measured to collect information about the laden distance traveled, the total laden mass and the self-mass of the vehicle combination (Table 1).
A total of 87% of the measured loads were transported by 64 and 68 t vehicle combinations (Table 1), whereas 76 t combinations accounted for 5% of the measurements. For the calculation of average values for each size category of vehicle combinations, the variation ranges are also given on the transportation trips. A growing trend in the variation of the load size and fuel consumption is seen for the larger vehicle combination. It can also be noticed that the range of distance and payload size for each size of vehicle combination is large. For example, the longest distance traveled by a 76 t combination is 335 km. The load size and driving distance range are the fundamentals of transport performance. Together, they are calculated as a ton-kilometer (tkm), which in itself is one of the energy efficiency indicators used in logistics planning, control, and management in current practice [54,57]. Mounting of a crane on a truck reduces the potential load mass of the truck by a total of about two tons, or by the crane’s own weight. Table 1 also shows that the share of cranes in transportation is relatively stable across all categories of vehicle combinations, varying between 41% and 52%.
The later material was collected from the ERP system between 1/1/2016 and 12/31/2016. The data mining system was utilized to automatically collect real digital big data from 204 vehicles (Table 2). A total of 39% of the measured loads were transported by 64 and 68 t vehicle combinations, whereas 76 t combinations accounted for 61% of the measurements. The vehicles’ measurement data include results from fuel consumption, payload-constraint mass, transport distances, logistics transport situations, etc., from 212,218 timber load deliveries from forests to mills.
The different transportation conditions of regions might have an impact on the energy efficiency of the STSs. In addition to the different infrastructure (road networks, plant destinations, and border zones), vehicles’ loads might be different, e.g., including timber (load assortments) from several roadside storages and stands. These differences are described by data collected from three transportation regions of the eastern study area (Table 3).
Fuel consumption was estimated for the vehicle combinations using the average data collected in the companies. There is a linear relationship between size of vehicle and fuel consumption (Figure 6). In the dataset, the fuel consumption table is described in the 60 t and 76 t combinations with different payload sizes. Average fuel consumptions of 64 and 68 t combinations were obtained by calculating the linear increase over the range of consumption values from 60 t to 76 t vehicle combinations. As an example, for a 37 t payload, in Figure 6, the average fuel consumption of 64 t is 0.5 l per 100 km higher than the consumption of the 60 t combination. Correspondingly, the average fuel consumption of the 68 t combination is one liter per 100 km higher than the 60 t combination’s consumption. Furthermore, the difference between the fuel consumption of the 76 t and 60 t combinations is two liters per 100 km. Empty 60, 64, 68, and 76 t vehicle combinations consume 34, 35, 36, and 38 l per 100 km-1, respectively.
It is mentioned above that fuel consumption varies depending on the payload size, as shown in Figure 7. In fact, fuel consumption is depicted by using theoretical gradual growth in load sizes. For example, when the payload size is 37–40 t, average consumption of the 60 t vehicle stays at about 58 l per 100 km-1 and increases to 58.7 l when the load size is 41–44 t. When the load size exceeds 50 t, fuel consumption increases at a linear pace of 0.7 l per 100 km for each ton of the next load.

2.2. Calculation Models for Energy Efficiency Measurements

Tracing the flow of energy through the industrial wood flow system is necessary to evaluate the environmental sustainability of wood procurement and its functions and inventories [43,58]. To that end, regions’ wood supply networks were separated from the entire renewable wood flow network. Each route of a wood supply network consists of a series of operations and inventories, operating dynamically both timely and sequentially, and each individual operation introduces its own efficiency (ηx) to the route as a whole. The overall route energy efficiency (ηroute) can be calculated by multiplying the individual operation efficiencies (Figure 2, Model 1).
  η route = x = 1 n η x
where
  • ηroute = overall route energy efficiency
  • ηx = energy efficiency of operation (x) in the route
  • n = number of operations in the route.
Road freight transportation is an operation. To evaluate the energy efficiency of individual transportation, several models are needed in the calculation method. In addition, alternative energy efficiency models provided the results that were used to analyze and compare the energy efficiency measurements to enable the development of the carbon-neutral road transportation in a renewable wood supply network of a green circular economy. Fuel quantity in kilograms is obtained using Model 2 [59].
mdiesel = ρdieselVdiesel
where
  • mdiesel = mass, kg
  • ρdiesel = density, kg m-3
  • Vdiesel = volume, m3
The net calorific value of wood in the arrival mode is obtained using Model 3 [60].
Qnet,ar = Qnet,d ∙(100 – Mar)/100 – c ∙ Mar
where
  • Qnet,ar = net calorific value of the incoming wood, MJ kg-1
  • Qnet,d = net (lower) calorific value of the dry matter, MJ kg-1
  • Mar = moisture content of wood at the time of arrival, weighted in the wet fuel mass, %
  • c = constant 0.02441 MJ kg-1, equivalent to the water evaporation rate at a temperature of 25 °C
The transport performance is calculated using Model 4 [57].
K = MwoodDwood
where
  • K = transport performance, tkm
  • Mwood = amount of renewable wood transported, t
  • Dwood = transport distance, km
The energy-specific measure for the energy of fuel consumption per transportation performance is calculated using Model 5 [61].
Eeff5 = Econ / K
where
  • Eeff5 = energy-specific performance efficiency, kWh tkm-1
  • Econ = amount of fossil energy consumed, kWh
  • K = transport performance, tkm
The performance-specific measure for transportation performance per energy of fuel consumption is calculated using Model 6 [62,63,64].
Eeff6 = K / Econ
where
  • Eeff6 = performance-specific energy efficiency, tkm kWh-1
  • K = transport performance, tkm
  • Econ = amount of fossil energy consumed, kWh
The natural resource-based energy efficiency measure (i.e., the efficiency ratio of energy transported and consumed) is calculated using Model 7.
Eeff = Etran / Econ
where
  • Eeff = energy efficiency
  • Etran = amount of renewable wood energy transported, kWh
  • Econ = amount of fossil energy consumed, kWh

2.3. Conversion of Fuel Consumption to Energy

Fuel consumption of timber transportation is expressed in liters per 100 km (l 100km-1). Diesel fuel belongs to light fuel oils, the density of which, according to quality (winter/summer), varies between 800 and 850 kg m-3 [65,66,67,68]. Here, the diesel density of 840 kg m-3 was used in the calculations. By using Model 2, the quantity of diesel consumed by the transportation load was calculated in kilograms of density and volume. The fuel energy quantity was obtained by conversion with the net calorific value coefficient, which is 43 MJ kg-1 for light fuel oils [59]. Because a kWh is equivalent to 3.6 MJ, the amount of energy consumed expressed in kWh is calculated by dividing MJ by 3.6.

2.4. Conversion of Renewable Wood to Energy

The energy contained in wood material is calculated using Model 3 (i.e., utilizing the net calorific value of the incoming fuel. The calculation used the gross calorific value of the wood, 19.167 MJ kg-1. This value is the mean value of birch, pine, and spruce species [69]. Therefore, the work does not take into account wood species’ effect on the variation of the gross calorific values [69]. In addition, the energy content is described using four different moisture content percentages of wood. Then, the load size (kilograms) of a vehicle combination is multiplied by the net calorific value and results in the amount of energy, which is divided by the ratio of 3.6 to indicate the energy contained in kilowatt-hours (kWh). As shown in Figure 8, the net calorific value in the arrival mode decreases when the moisture content percentage increases. In other words, drier wood contains more energy [11]. For example, if the moisture content of the wood is 55% in the arrival mode, the calorific value, in this case, is 4.5 MJ kg-1 less than it is for dry wood with a moisture content of 35%.

2.5. Use of Energy Efficiency Measurement as Indicator of Environmental Sustainability

Four energy efficiency measurements were tested by green circular industry models of the green circular industry. Model 4, as a performance-based efficiency indicator, measured transportation deliveries of loads as ton-kilometers (tkm) [54,57], which indicates the most energy-efficient combination with the highest transportation performance. The next measurement, Model 5, defines the energy-specific indicator that measured the energy efficiency of fuel consumption per transportation performance [61]. In this model, the most efficient vehicle combination appears with the lowest energy efficiency value. Correspondingly, Model 6 defines the energy-specific efficiency indicator that was used to describe transportation performance per consumed fuel [62,63,64]. This model indicates the most energy efficient combination with the highest energy efficiency value. Model 7 defines an energy efficiency measurement (physics formula) that takes account of efficiency between a payload’s wood energy and the fuel consumption of a vehicle combination. With this measure, the most energy efficient combination is indicated with the highest value. In this model, the moisture content of the wood directly influences the net calorific value of the wood in the arrival mode at a transport destination and therefore also the amount of energy contained in the vehicle combination. In addition to representation of the physics formula, in theory, this is also a natural wood resource-based energy efficiency measurement.
The energy efficiency of the STS was analyzed in northern Finland (NF) and eastern Finland (EF) by using the measures. Next, the robustness of the energy efficiency measures was determined, as calculated efficiency information is going to be used in a wood supply optimization model (in industrial ecosystem model); thereafter, the model is developed using also criteria of environmental sustainability. In order to select the most robust measure for formulation of an optimization model, four measures (indicator values) were compared to each other. Based on the comparison of the measures, useful modeling parameters and variables, as well as the energy efficiency indicator of STS, can be determined to enable the development of an effective transportation fleet for the various geographical regions. The energy efficiency values of 2014 (NF) can also be compared with the energy efficiency values of 2016 (EF) after selection of the energy efficiency indicator.
The ordinal ranking method was used in the comparison of measures. It determined total sums of the most positive rankings of the indicators. In addition, it also determined totals on impacts of transportation conditions. So, the analysis was based on the robustness of energy efficiency measurement for ranking of vehicle combinations 64, 68, and 76 t of transportation fleets in the transportation regions. Figures of rankings depict the ordinal ranking of their positive appearance. The vehicle combinations were ranked from the most effective to the worst and received ranking numbers 1 (first), 2 (second), or 3 (third). The values of timber transportation conditions were calculated about ERP data based on the average quantity of the stand’s load assortment in a vehicle’s load. Finally, the most robust indicator was applied for the development of effective transportation fleets toward environmental sustainability in three regions.

3. Results

3.1. Energy Efficiency of Timber Transportation in 2014

Results from the northern region are presented first to illustrate the energy efficiency of timber transportation at the beginning of 2014 (Figure 5). The average energy content of fossil fuel consumption and amount of energy transported as 100% renewable wood by loads of vehicle combinations (60, 64, 68, and 76 t) of the STS with various wood moisture percentages can be seen in Table 4. The 76 t vehicle combination consumed an average of 12% more energy than the 60 t vehicle combination. The amount of energy transported as wood (kWh) decreases constantly with the wood moisture content (%). For example, the energy content of the average load (50.5 t) of the 76 t combination was 3.9-fold greater when the percentage of moisture content changed from 75% to 35%.
The usefulness of energy efficiency measurement was analyzed using values of Model 7. The measure indicates the most energy-efficient vehicle combination in the STS (Table 5). The energy efficiency measurement calculates a payload’s 100% renewable wood energy per laden vehicle’s fuel consumption (kWh kWh-1).

3.2. Energy Efficiency Indicators of Environmental Sustainability

The same moisture content of wood (55%) is used in the following calculations of the results. Figure 9 shows how much the energy efficiency changes when different efficiency measures are used. If energy efficiency is measured by means of transportation performance alone (i.e., as tkm), 76 t is the most energy efficient combination. In this case, compared with the 60 t combination, an increase of up to 19% is observed when using the combination of 76 t, while the 68 and 64 t combinations had lower levels of efficiency compared to 60 t. If the energy of fuel consumption is measured (Model 5) (i.e., when calculating as the ratio of the energy consumed in transportation and the transport performance), the most efficient vehicle combination appears with the lowest energy efficiency value. Actually, this measure also indicates that the 76 t is the most energy-efficient combination for timber transportation; its energy efficiency was about 5% higher than that of the 60 t combination.
If an energy efficiency measure related transportation performance (tkm) to the energy value of fuel consumption (Model 6), the use of 76 t vehicles increased energy efficiency by 5.8% compared to the 60 t vehicle combination, and again, the most efficient group was the 76 t vehicle combination. As an example of the renewable wood resource-based energy efficiency measurement (Model 7), a relationship of transported 100% renewable wood energy and consumed 100% fossil fuel energy was used. The calculated energy efficiency order differs from the previous metrics, as the most efficient vehicle combination was the 68 t vehicle combination (+22%) compared with the 60 t combination. Correspondingly, the 76 t vehicle combination lost up to 11% of the energy efficiency of the STS compared to the 60 t combination. Altogether, use of the right measure was about 30% more important with large and heavy vehicles (LHVs).

3.3. Usefulness of Energy Efficiency Indicators

Next, usefulness of energy efficiency measurements was analyzed in the eastern study area after a three-year adaptation period (Figure 5) (Table 6). Again, four energy efficiency indicators were compared in the STS consisting of three vehicle combinations (64, 68, 76 t). The fuel consumption of laden and empty vehicles was used. The energy efficiency ranking of vehicle combinations varied with regard to measures. For example, the transportation performance (tkm) indicated that the 76 t vehicle combination was the best compared with the 64 t combination; however, consumed energy-based measures (Model 5 and Model 6) indicated that the energy efficiency of 76 t was the second, while 68 t was the best. Besides, Model 7 indicated that the most efficient vehicle combination was 68 t (+3.0%). Correspondingly, the 76 t vehicle combination was the third and performed 3.9% worse in energy efficiency of the STS compared to the 64 t combination.
Table 7 shows the energy efficiency measurements of the STSs in regions A, B, and C in the eastern study area (Figure 5). These transportation fleets were formulated as separate STSs. The variations of energy efficiency rankings of three STSs are remarkable between the vehicle combinations (64, 68, 76 t). Models 5 and 6 indicated the same efficiency order of vehicle combinations in this comparison for all regions. Based on the results, it is difficult to make suggestions about the vehicle combinations for a selection of the most efficient transportation fleet.
The robustness of energy efficiency measurements of STSs for ranking of vehicle combinations 64, 68, and 76 t with respect to their transportation effectiveness is illustrated in Table 8. First, four measurements were compared using the ordinal ranking method. Next, the impact of transportation conditions on effectiveness of the vehicle combinations 64, 68, and 76 t of the STSs was analyzed in three transportation regions and in the eastern study area. Model 7 (i.e., wood-based energy efficiency measurement) was the most effective indicator, with 21 ranking points (sum of totals in Table 8). Models 5 and 6 were the second and third, with 16 points. The transport performance (tkm) was the worst measure in this respect, without any points

3.4. Energy Efficiency Analysis of Timber Transportation in 2016

The usefulness of the energy efficiency measurements of STSs is further illustrated by using the Model 7 in Figure 10. In addition to energy efficiency values, the calculations indicate that wood transportation is carbon negative. The STS of region A was the most evenly distributed with respect to energy efficiency, all vehicle combinations and regions. In this STS of the eastern study area, energy efficiency can be increased quite equally by the vehicles, while the 64 t vehicle combination was the most efficient. In addition, in transportation fleets of region B, energy efficiency of the STS can be increased effectively if the fleet is adapted first or most often to use the 68 and 76 t vehicle combinations instead of the smaller 64 t combination.

4. Discussion and Future Research

The energy efficiency models of STS were tested for improving the environmental sustainability of road freight transportation. The main focus of the tests was to select the most robust indicator from four energy efficiency models [65,66,67,
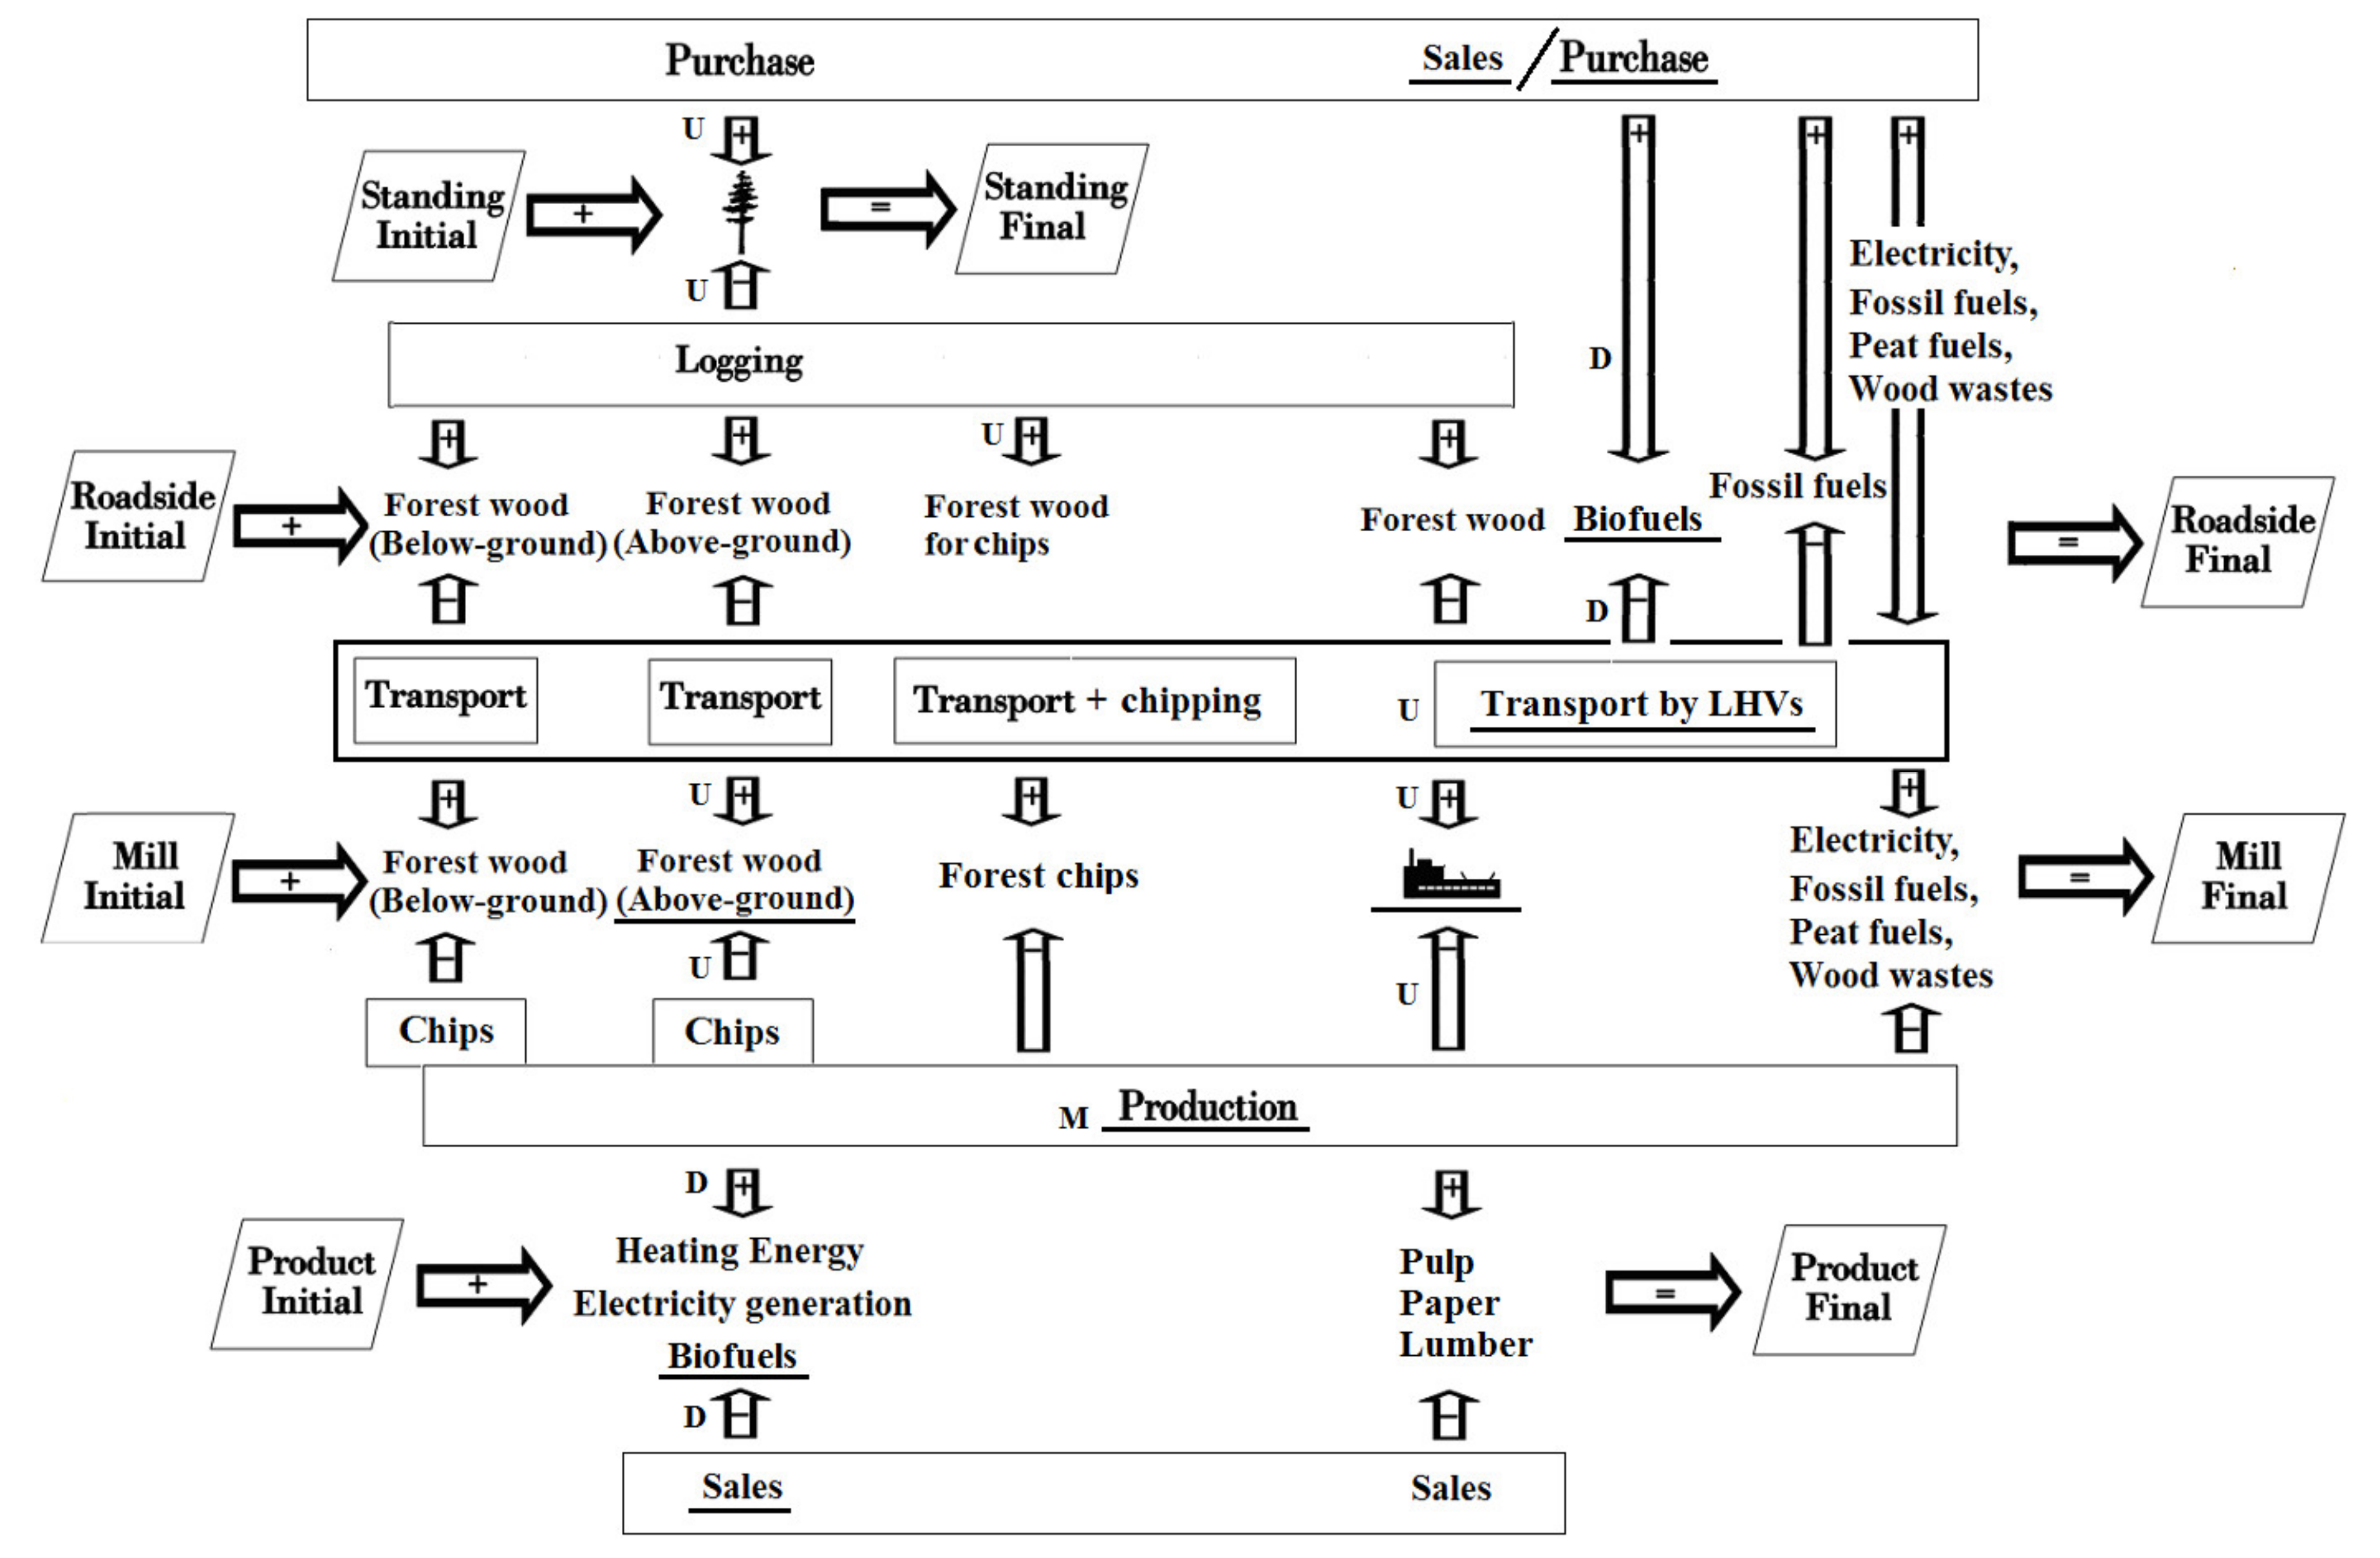
68] for development of carbon-neutral transportation fleets that included 60, 64, 68, and 76 t vehicle combinations. The indicator will be used in ecosystem modeling of “green” circular industry (
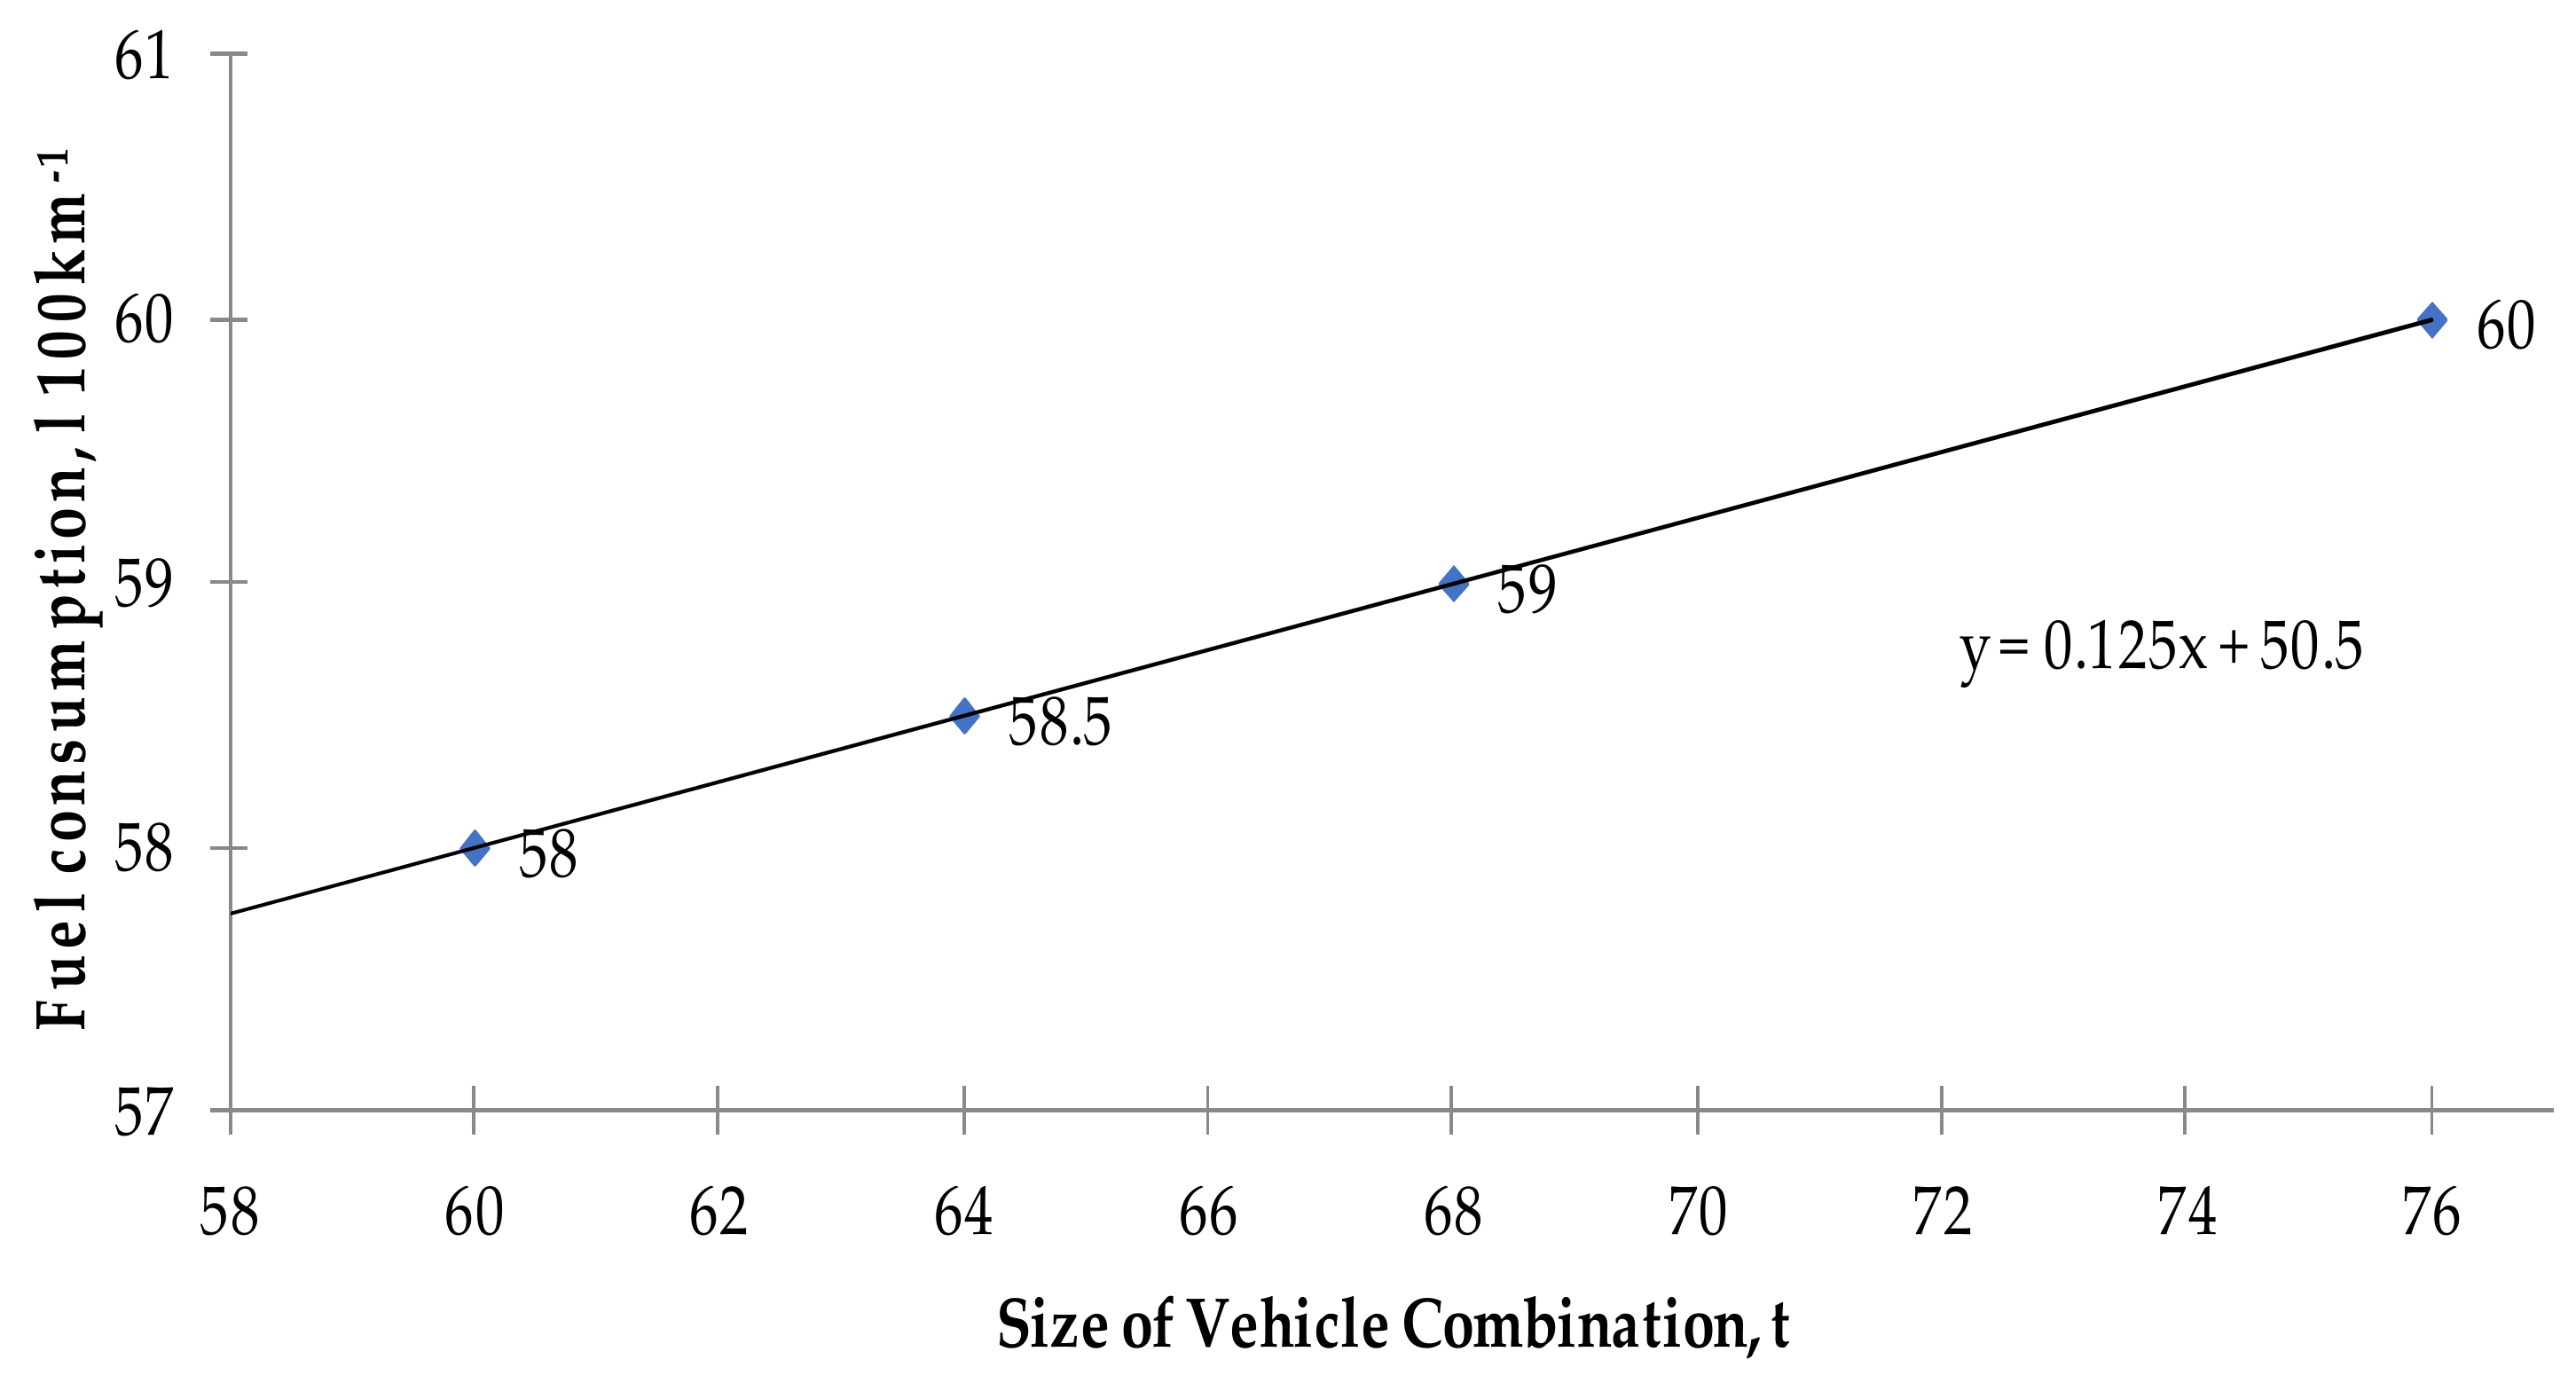
Figure 2). As the energy consumed by trucks corresponds to the trend in liter-based fossil fuel consumption, the models were converted to match the common energy consumption unit (kWh) [44,45]. Besides fossil fuel, biofuel consumption could also be taken into account in calculations and ecosystem modeling [11]. 
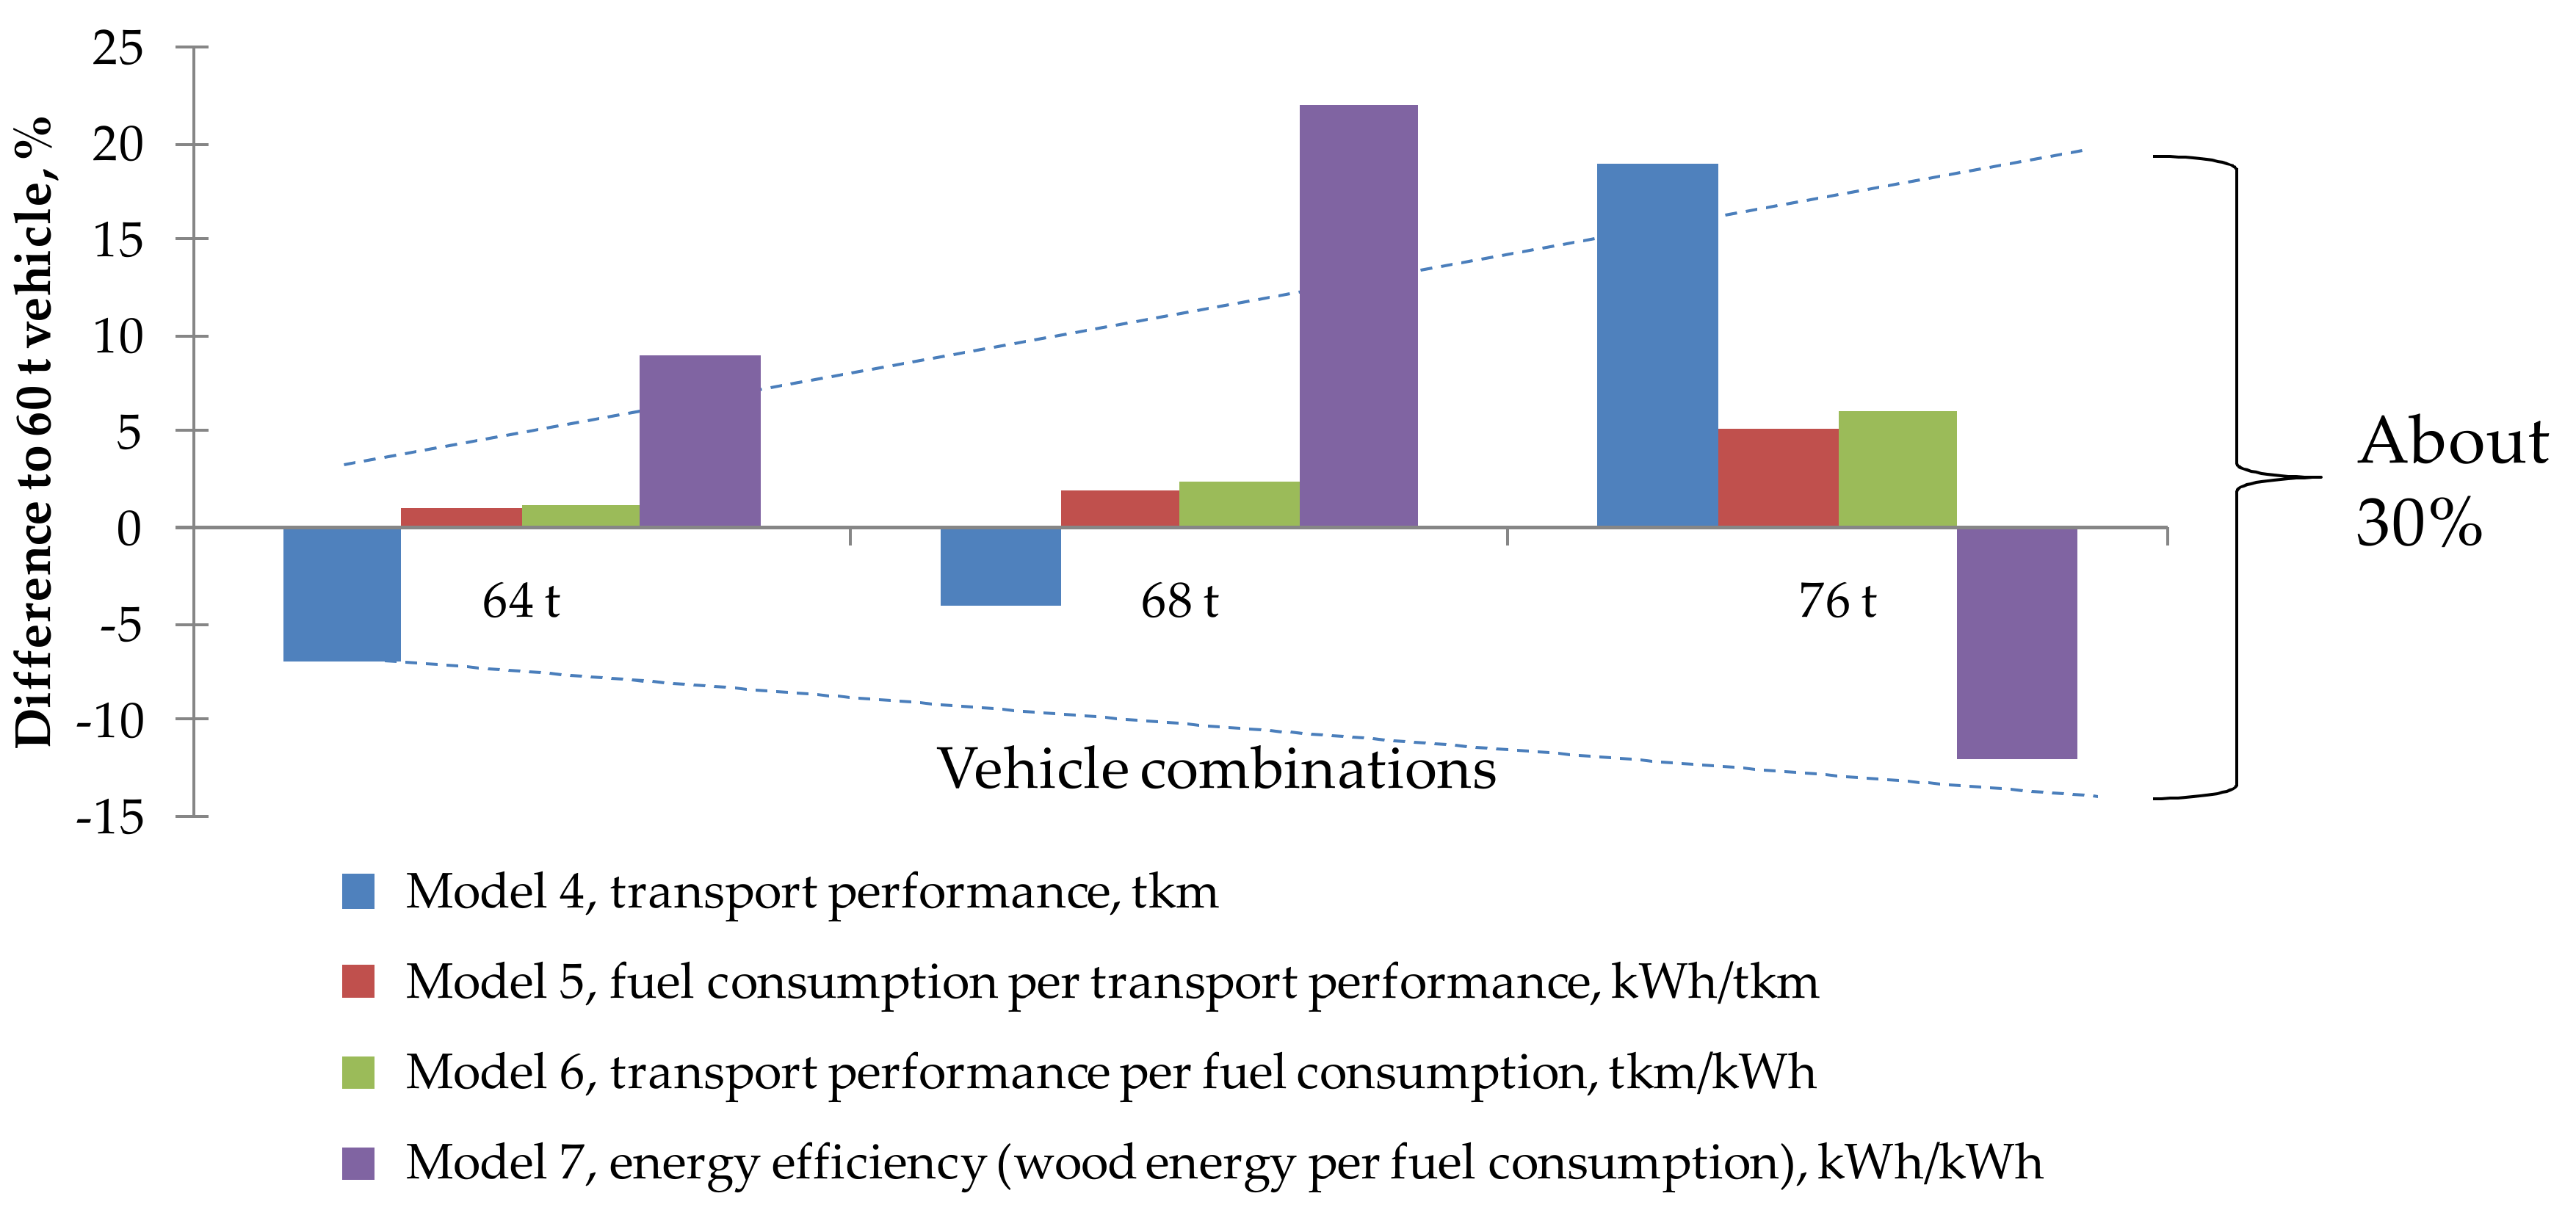
Table 8 shows that the natural renewable wood resource-based energy efficiency measure (Model 7) was the most accurate and precise development indicator. Model 7 defines this energy efficiency indicator that accounts for relationships between a payload’s 100% renewable wood energy and a vehicle’s fossil fuel consumption. Comparing indicator values in different loads of vehicle combinations among themselves reliably showed differences. In summary, the novel Model 7 (load’s renewable wood energy/fossil transport energy) is recommended for more common use as a robust measure in transportation statistics, planning and related fields for environmentally sustainable development. As an example, it was applied in Nordic transportation conditions.
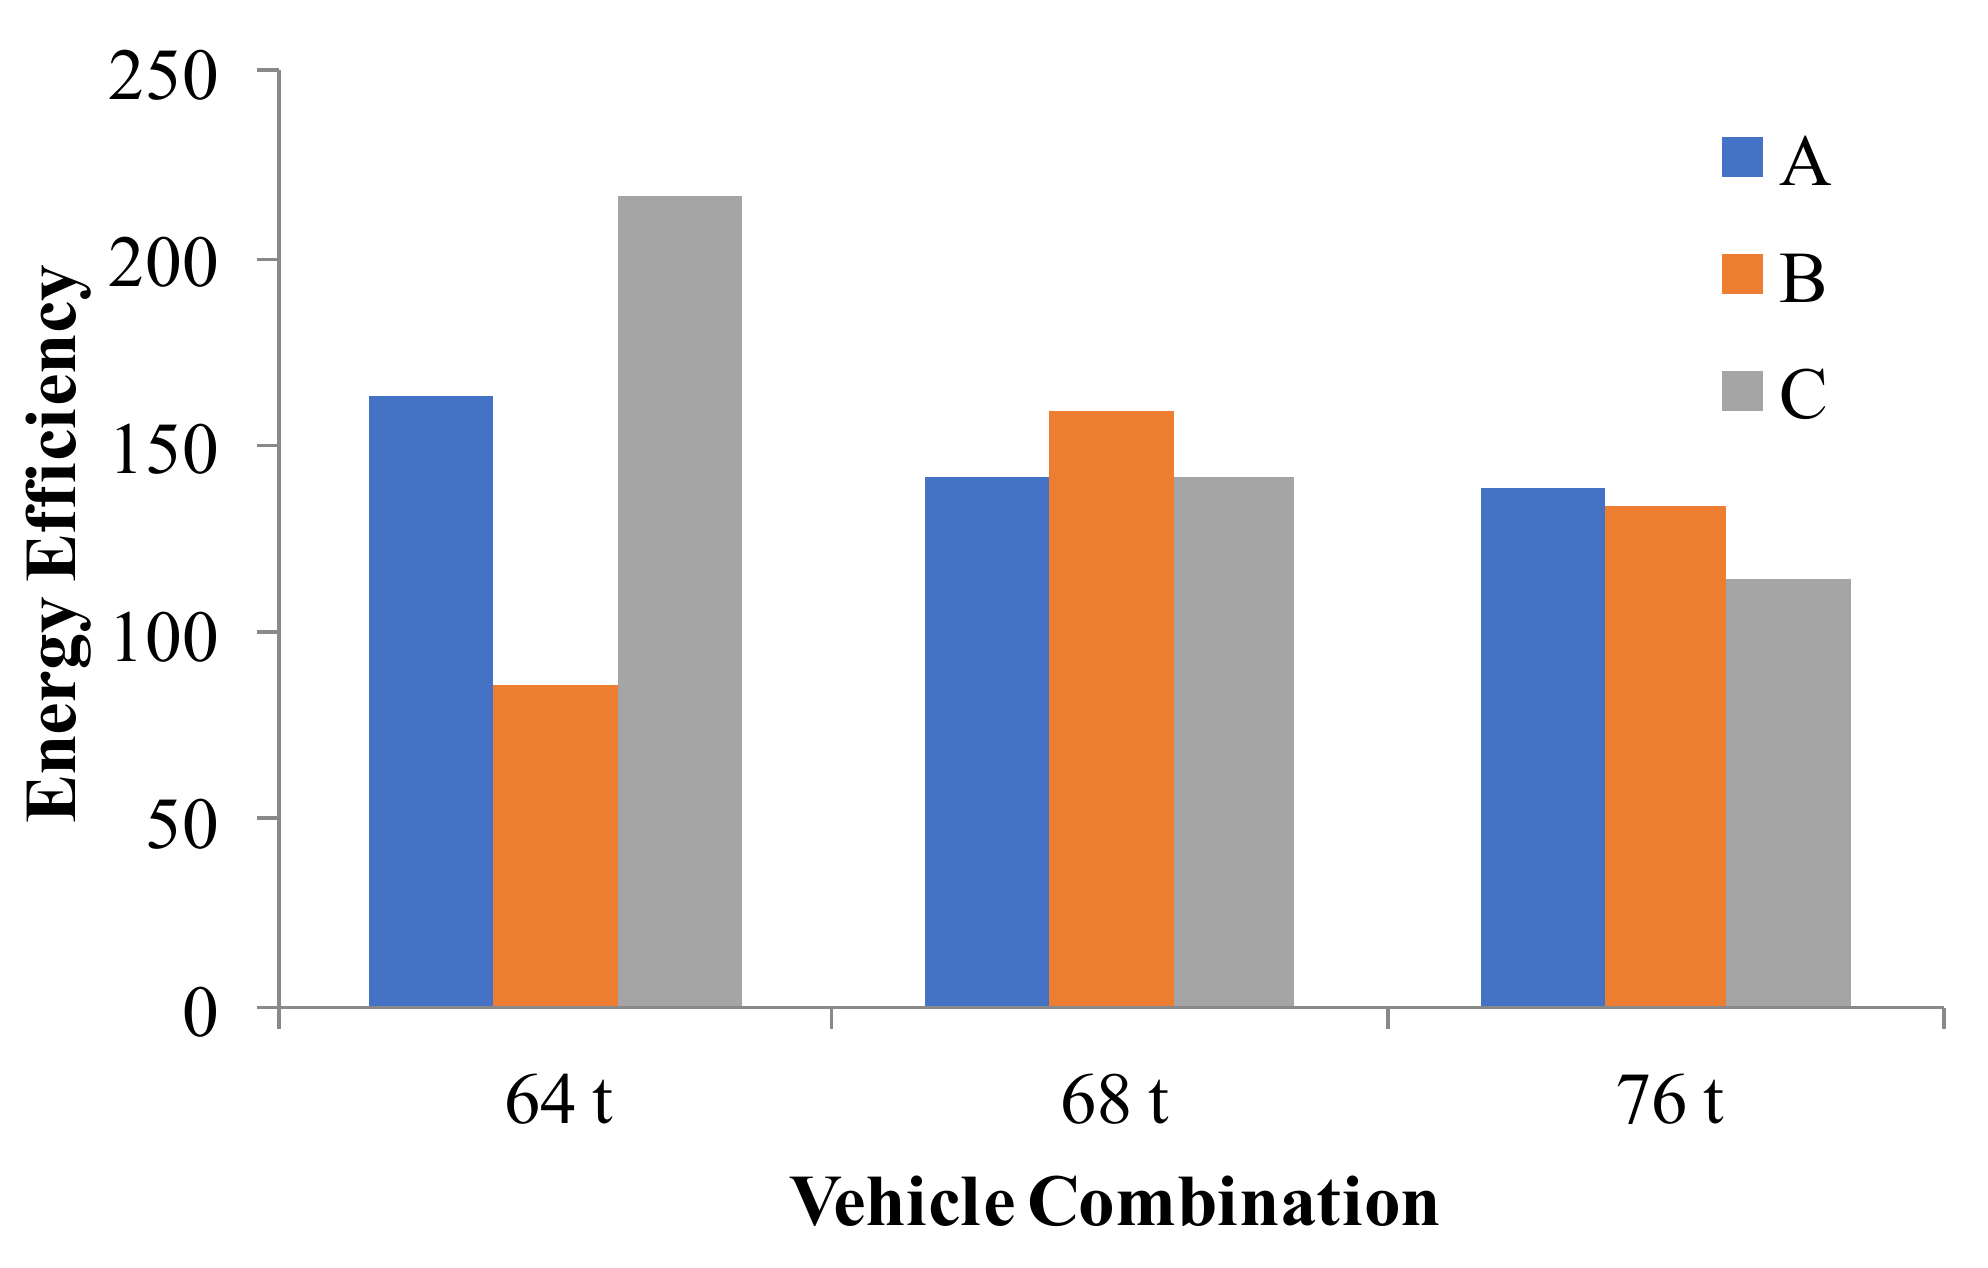
The indicator revealed that the road freight transportation systems (60, 64, 68, and 76 t) and (64, 68, and 76 t) were carbon negative both in the northern (122, 133, 144, and 108) and the eastern study area (142, 147, and 133), respectively. The calculations compared the energy efficiency of heavier vehicle combinations to the 60 or 64 t vehicle combinations as it is important to investigate how much the maximum permissible mass increase of the vehicle combination affected energy efficiency. In the eastern study area, vehicle combinations 64, 68, and 76 t without 60 t were used in the fleet in 2016, since the three-year adaptation process from 2014 shifted the fleet toward larger and heavier vehicles (LHVs). Therefore, 64 t vehicles instead of 60 t were used in efficiency comparisons in the eastern study area. The use of 68 t vehicles increased energy efficiency most effectively in both regions, respectively, by 18.0% and 20.5%. However, 76 t vehicles were not so successful, at −11% and −3.9%, respectively. The most efficient 76 t vehicles operated in wood supply region A by producing an energy efficiency value of 139.8 for laden vehicles in 2016 (Figure 10), which means an efficiency increase of 29.4% compared to the 2014 level (Table 5). There were clear and quite large ranges in energy efficiencies between the partial transportation regions (A, B, and C) of the eastern study area (Table 7 and Figure 10). Consequently, the indicator also revealed that the energy efficiency of the STSs is dependent on regional transportation conditions. If we take a careful look at the research area map (Figure 5), there are great differences in the regions’ road networks. In addition, there are differences in plant numbers as possible transportation destinations. Together, these conditions affected vehicle routing, optimization, and scheduling alternatives of transportation fleets. In this respect, the indicator enables transportation entrepreneurs to plan loads and manage their vehicles in the selected area in the most energy efficient way.
Although several studies have suggested that the use of RES and renewable products can mitigate climate change [46], utilization of studies in practice has been difficult due to the different and unspecified analytical frameworks of energy efficiency measurements. It is clear that industrial supply networks are too complex to solve by simulation models [11]. Apart from simulation, in utilizing optimization frameworks the quantity value (energy relation between the renewable wood resource and fossil fuel consumption)-based energy efficiency measure (Model 7) could be recommended to indicate the attained energy efficiency level of the STS and LHVs for analytical reformulation on ecosystem optimization models. On the other hand, efficiency can often be expressed as a percentage of the result that could ideally be expected in some studies [42,46], but in wood supply networks’ transport freight operation, efficiency was better to quantify with a non-percentage value. So, the used energy efficiency analysis provided a plausible measurement framework and novel insights into the relationships of transportation conditions and the transportation fleet combinations. It seems that, using energy efficiency information provided by the indicator (Model 7) for formulation of parameters and variables of industrial ecosystem model (Figure 2), the carbon neutrality of vehicles and environmental sustainability of transportation could be optimized (not simulated) in separate transportation regions in which fleets are adapted to the larger mass limit.
The indicator confirmed that during the three-year adaptation process of road transportation fleets there has been a remarkable increase in energy efficiency of the STSs. This means that environmental sustainability of road transportation was improved during the adaption period from 2014 to 2016. The indicator also confirmed the assumption that fleet-management methods are needed to achieve all of LHV’s benefits in wood transportation fleets and supply networks. These results are consistent with previous studies [20,50]. In addition, the results are plausible and they can be generalized consistently, because they are based on the analyzed real-world RES data of a large global forest industry company (Figure 1). The company actually delivered one-third of used wood resources to mills (23 million m3) per year in Finland [11,48].
The data of wood supply and procurement organizations were collected (data-mining) from practice (ERP systems) about wood delivery from selected transportation regions to their plant destinations. The material was big digital data, which provided reliable calculation of results and analysis to the study aims. Researchers selected three geographical regions, which consisted of different transportation conditions (e.g., both effective and ineffective logistics networks). These are matters for discussion that need to be tackled more carefully. If the energy efficiency of region C is considered, Figure 5 shows that it is near the Russian border, where the road network was ineffective for LHVs. Clearly, the transportation effectiveness of this region also depended on plant locations because the number of plants was four instead of nine or six, as in regions A and B, respectively. Regions A and B were more effective than C, and together, the regions were used successfully to reveal the impacts of the different transportation conditions on the benefits of LHVs in “high-capacity transportation” (Table 6 and Table 7, Figure 10). Clearly, the data collection was planned carefully and the received results appear logical, which also comes from used physics and clear mathematical reasoning of calculation [43,58]. In this respect, it is evident that the wood resource-based energy efficiency measure (Model 7) is consistent and most useful in operations research analysis with 100% renewable wood (Figure 1). This is novel knowledge compared to previous studies [28,29,52,54]. However, more comprehensive logistics data analysis is needed about an adaptation process to solve, for example, backhauling alternatives with several clients for more comprehensive supply-network analysis [10]. Besides, at least minimization of empty-load driving of vehicles would be useful to take into consideration in routing and supply-network optimizations (Figure 4). Otherwise, with the bounded regional material of this study alone, the energy efficiency discussion might focus more on the inbound logistics of forest industry companies without valuable full collaboration and support of entrepreneurs (contractors) for the development of the industrial ecosystem model [11,61].
The research presented here draws upon data that is a representation of the homogenous road transportation situation in Nordic countries. Key threats to the validity of generalized inferences in operations research are that specific findings with restricting assumptions cannot be guaranteed to be appropriate to regions outside of the scope of the studies [24,47]. On the other hand, there is no technical problem for the use of this measure in transportation situations of other countries or smaller percentages (<100%) of renewable wood (Figure 1). Correspondingly, researchers, officials, and stakeholders of other forest- and “green” industry companies abroad can similarly apply the natural (wood) resource-based energy efficiency indicator to their transportation conditions [24,36]. Besides the robust efficiency measurement framework, the environmental sustainability of the transportation operations could be optimized by multi-objective models in the future with respect to varying energy efficiency parameters (criteria) instead of assumptions (constants) as some studies have suggested [11,24]. Accordingly, the wood flow from forest to mills (upstream) could be balanced with respect to multiple criteria to ensure the decarbonization target of the EU in economically and environmentally sustainable supply networks which have been deemed necessary in green industry. This kind of approach was suggested by Kostevšek et al. [36] in an energy production (midstream) context. In this same framework, the review by Butturi et al. [33] represents a first synthesis of the knowledge in the fields of energy symbiosis, eco-industrial parks, and renewable energy sources. Recently, Palander et al. [11] applied green circular optimization model for circulating 100% renewable wood from forest to biofuel of wood transportation vehicles. The model circulates upstream, midstream, and downstream of the industrial ecosystem, which can be expanded by results of literature and this study.
Based on these research results, some practical answers can be suggested to policy makers’ climate concern as steps toward sustainable forest industry [5,9]. In regard to energy efficiency of road transportation (as an example about supply networks’ operations), the goals to create a 100% carbon-neutral base can be implemented in the forest industry utilizing renewable forest resources [9]. There is no question that LHVs go at least some way towards alleviating carbon neutrality concerns. Even carbon-negative operations already happen in the forest industry’s green circular economy [2,3]. However, the consistency of conclusions is questionable if the share of 100% renewable wood will decrease in the future (Figure 1). Unfortunately, this problem is possible in any country if forest wood harvesting is limited for the sake of short-term public benefits of a carbon sink policy. A lot of trees might die due to the lack of harvesting or due to forest fires pumping carbon into the climate, which are also warming the climate, accelerating climate change, and causing shorter rotation of forest life. Therefore, intensive wood harvesting and silvicultural operations should be increased in forestry to secure the vital carbon sink of forests, e.g., for its 50-years rotation of balanced forestry (Figure 1). Since forests are the main absorber of carbon, sustainable forest management is undoubtedly necessary to adapting and achieving climate goals.

5. Conclusions

Forest industry provides renewable products and can address their environmental sustainability burdens by developing logistics operations. This study developed energy efficiency indicators for carbon-neutral transportation. The wood-based energy efficiency measure (payload’s renewable wood energy/fossil transport energy) was the most robust model as the development indicator. The indicator showed that fleets of synchronized transportation system (60, 64, 68, and 76 t) and (64, 68, and 76 t) were actually carbon negative (122, 133, 144, and 108) (142, 147, and 133) in 2014 and 2016, respectively (value of 1 means a carbon-neutral transportation). These positive effects (in terms of the energy efficiency measures) of a three-year adaptation process were calculated in the transportation systems with 100% renewable wood supply from different raw-material procurement regions to production. In addition to significant advance in the adaptation of fleets, the indicator revealed that the energy efficiency of the system is dependent on regional transportation conditions. This novel knowledge about the effects of supply regions can be utilized to advance the adaptation further in transportation fleets, e.g., toward larger and heavier vehicles. In addition, the indicator enables transportation entrepreneurs to plan loads and manage their vehicles in the selected area in the most energy efficient way.
The energy efficiency measurement framework will provide development potential of optimization tools for improving carbon neutrality of transportation fleets. The proposed framework has great technical potential for balancing operations of renewable raw-material logistics in the industrial ecosystem. In summary, the integration of physics principle of Model 7 with the multiple-objective optimization framework could advance design of decision-making systems for improving decarbonization and environmental sustainability development in the green circular industry. The proposed framework will enhance the sustainability performance of the industrial ecosystem addressing its three aspects (i.e., economic, environmental, and social performance). The companies, researchers, officials, and other stakeholders abroad can similarly apply the resource-based energy efficiency indicator, although it would be possible to use only a smaller percentage (<100%) of renewable raw material in their non-balanced industrial operation environments.

Author Contributions

Writing - original draft, Writing - review & editing, Supervision, T.P.; Writing - review & editing, Formal analysis, H.H.; Writing - original draft, Formal analysis, E.K.; Resources, Supervision, K.K. All authors have read and agreed to the published version of the manuscript.

Funding

This research did not receive any specific grant from funding agencies in the public, commercial or not-for-profit sectors.

Conflicts of Interest

The authors declare no conflicts of interest.

References

  1. Feng, J.-C.; Yan, J.; Yu, Z.; Zeng, X.; Xu, W. Case study of an industrial park toward zero carbon emission. Appl. Energy 2018, 209, 65–78. [Google Scholar] [CrossRef]
  2. Benson, S.M. Negative-emissions insurance. Science 2014, 344, 1431. [Google Scholar] [CrossRef] [Green Version]
  3. Sanchez, D.L.; Callaway, D.S. Optimal scale of carbon-negative energy facilities. Energy 2016, 170, 437–444. [Google Scholar] [CrossRef] [Green Version]
  4. EUR-Lex. A Roadmap for Moving to a Competitive Low Carbon Economy in 2050. Available online: https://eur-lex.europa.eu/legal-content/EN/ALL/?uri=CELEX%3A52011AE1389 (accessed on 12 April 2019).
  5. EUR-Lex. A Policy Framework for Climate and Energy in the Period from 2020 to 2030. Available online: https://eur-lex.europa.eu/legal-content/EN/TXT/PDF/?uri=CELEX:52014DC0015&from=EN (accessed on 12 April 2019).
  6. Directive 2012/27/EU of the European Parliament and of the Council of 25 October 2012 on Energy Efficiency, Amending Directives 2009/125/EC and 2010/30/EU and Repealing Directives 2004/8/EC and 2006/32/EC. Available online: http://eur-lex.europa.eu/legal-content/EN/TXT/?qid=1399375464230&uri=CELEX:32012L0027 (accessed on 12 April 2019).
  7. Korzhenevych, A.; Dehnen, N.; Bröcker, J.; Holtkamp, M.; Meier, H.; Gibson, G.; Varma, A.; Cox, V. Update of the Handbook on External Costs of Transport; European Commission, DG Mobility and Transport: Ispra, Italy, 2014. [Google Scholar]
  8. OECD. Moving Freight with Better Trucks: Improving Safety, Productivity and Sustainability; OECD: Paris, France, 2011; Available online: http://www.oecd-ilibrary.org/transport/ (accessed on 12 April 2019).
  9. Ministry of Transport and Communications. Transport emissions to zero by 2045; Ministry of Transport and Communications: Helsinki, Finland, 2019; Available online: https://valtioneuvosto.fi/en/article/-/asset_publisher/liikenteen-paastot-nollaan-vuoteen-2045-mennessa (accessed on 12 April 2019).
  10. Mulholland, E.; Teter, J.; Cazzola, P.; McDonald, Z.Ó.; Gallachóira, B.P. The long haul towards decarbonising road freight – A global assessment to 2050. Appl. Energy 2018, 216, 678–693. [Google Scholar] [CrossRef]
  11. Palander, T.; Haavikko, H.; Kärhä, K. Towards sustainable wood procurement in forest industry—The energy efficiency of larger and heavier vehicles in Finland. Renew Sustain. Energy Rev. 2018, 96, 100–118. [Google Scholar] [CrossRef]
  12. European Parliament. Decision No 406/2009/EC of the European Parliament and of the Council of 23 April 2009 on the Effort of Member States to Reduce Their Greenhouse Gas Emissions to Meet the Community’s Greenhouse Gas Emission Reduction Commitments Up to 2020; European Parliament: Brussels, Belgium, 2009. [Google Scholar]
  13. Directive 2009/28/EC of the European Parliament and of the Council of 23 April 2009 on the Promotion of the Use of Energy from Renewable Sources and Amending and Subsequently Repealing Directives 2001/77/EC and 2003/30/EC. Available online: http://www.energy-community.org/pls/portal/docs/360177.PDF (accessed on 12 April 2019).
  14. Gonzalez-Salazar, M.A.; Miguel, A.; Venturini, M.; Poganietz, W.-R.; Finkenrath, M.; Kirsten, T.; Acevedo, H.; Spina, P.R. Development of a technology roadmap for bioenergy exploitation including biofuels, waste-to-energy and power generation & CHP. Appl. Energy 2016, 180, 338–352. [Google Scholar]
  15. Rettenmaier, N.; Schorb, A.; Köppen, S.; Biomass Energy Europe. Status of Biomass Resource Assessment, Version 3. Felis, Freiburg. 2010. Available online: http://www.eu-bee.eu/_ACC/_components/ATLANTIS-DigiStore/BEE_D3.6_Status_of_biomass_resource_assessments_V3_1_04906.pdf?item=digistorefile;247973;837&params=open;gallery (accessed on 12 April 2019).
  16. Mantau, U.; Saal, U.; Prins, K.; Steierer, F.; Lindner, M.; Verkerk, H.; Final report. Real Potential for Changes in Growth and Use of EU Forests. EUwood. 2010. Available online: http://ec.europa.eu/energy/renewables/studies/doc/bioenergy/euwood_final_report.pdf (accessed on 12 April 2019).
  17. Schulze, E.D.; Körner, C.; Law, B.E.; Haberl, H.; Luyssaert, S. Large-scale bioenergy from additional harvest of forest biomass is neither sustainable nor greenhouse gas neutral. GCB Bioenergy 2012, 4, 611–616. [Google Scholar] [CrossRef]
  18. Lin, T.; Rodríguez, L.F.; Davis, S.; Khanna, M.; Shastri, Y.; Grift, T.; Ting, K.C. Biomass Feedstock Preprocessing and Long-distance Transportation Logistics. GCB Bioenergy 2015, 8, 180–190. [Google Scholar] [CrossRef]
  19. Hoefnagels, R.; Resch, G.; Junginger, M.; Faaij, A. International and domestic uses of solid biofuels under different renewable energy support scenarios in the European Union. Appl. Energy 2014, 131, 139–157. [Google Scholar] [CrossRef]
  20. Ministry of Economic Affairs and Employment of Finland. Government Report on the National Energy and Climate Strategy for 2030; Publications of the Ministry of Economic Affairs and Employment: Helsinki, Finland, 2017. Available online: http://julkaisut.valtioneuvosto.fi/bitstream/handle/10024/79247/TEMjul_12_2017_verkkojulkaisu.pdf (accessed on 12 April 2019).
  21. Palander, T. Tactical Models of Wood-Procurement Teams for Geographically Decentralized Group Decision-Making. Ph.D. Thesis, University of Eastern Finland, Joensuu, Finland, 1998. Available online: https://www.researchgate.net/publication/44364975_Tactical_models_of_wood-procurement_teams_for_geographically_decentralized_group_decision-making_Teijo_Palander (accessed on 12 April 2019).
  22. Dorotić, H.; Pukšec, T.; Duić, N. Multi-objective optimization of district heating and cooling systems for a one-year time horizon. Energy 2019, 169, 319–328. [Google Scholar] [CrossRef]
  23. Dorotić, H.; Pukšec, T.; Duić, N. Economical, environmental and exergetic multi-objective optimization of district heating systems on hourly level for a whole year. Appl. Energy 2019, 251, 113394. [Google Scholar] [CrossRef]
  24. Mirkouei, A.; Haapala, K.R.; Sessions, J.; Murthy, G.S. A mixed biomass-based energy supply chain for enhancing economic and environmental sustainability benefits: A multi-criteria decision making framework. Appl. Energy 2017, 206, 1088–1101. [Google Scholar] [CrossRef]
  25. Handler, R.M.; Shonnard, D.R.; Lautala, P.; Abbas, D.; Strivastava, A. Environmental impacts of roundwood supply chain options in Michigan: Life-cycle assessment of harvest and transport stages. J. Clean. Prod. 2014, 76, 64–73. [Google Scholar] [CrossRef]
  26. Svenson, G.; Fjeld, D. The impact of road geometry, surface roughness and truck weight on operating speed of logging trucks. Scand. J. For. Res. 2017, 32, 515–527. [Google Scholar] [CrossRef]
  27. Lijewski, P.; Merkisz, J.; Fuć, P.; Ziółkowski, A.; Rymaniak, L.; Kusiak, W. Fuel consumption and exhaust emissions in the process of mechanized timber extraction and transport. Eur. J. For. Res. 2017, 136, 153–160. [Google Scholar] [CrossRef] [Green Version]
  28. Liimatainen, H.; Pöllänen, M. Trends of energy efficiency in Finnish road freight transport 1995–2009 and forecast to 2016. Energy Policy 2010, 38, 7676–7686. [Google Scholar] [CrossRef]
  29. Hämäläinen, E.; Hilmola, O.P. Energy efficiency at the paper mill—Dilemma of improvement. Energy Effic. 2017, 10, 809–821. [Google Scholar] [CrossRef]
  30. Palander, T.; Kärhä, K. Characteristics of energy performance measures for 100% carbon-neutral wood procurement of forest industry. In New Trends in Nanotechnology, Material and Environmental Sciences; Zhu, J., Jin, A., Zhu, D., Eds.; AV AkademikerVerlag: Berlin, Germany, 2018; pp. 304–332. [Google Scholar]
  31. Stora Enso’s Policy for Energy and Carbon. 2016. Available online: http://assets.storaenso.com/se/com/DownloadCenterDocuments/Policy_for_Energy_and_Carbon.pdf (accessed on 12 April 2019).
  32. Sokka, L.; Pakarinen, S.; Melanen, M. Industrial symbiosis contributing to more sustainable energy use—An example from the forest industry in Kymenlaakso, Finland. J. Clean. Prod. 2011, 19, 285–293. [Google Scholar] [CrossRef]
  33. Butturi, M.A.; Lolli, F.; Sellitto, M.A.; Balugani, E.; Gamberini, R.; Rimini, B. Renewable energy in eco-industrial parks and urban-industrial symbiosis: A literature review and a conceptual synthesis. Appl. Energy 2019, 255, 113825. [Google Scholar] [CrossRef]
  34. Korhonen, J. Four ecosystem principles for an industrial ecosystem. J. Clean. Prod. 2001, 9, 253–259. [Google Scholar] [CrossRef]
  35. Korhonen, J. A material and energy flow model for co-production of heat and power. J. Clean. Prod. 2002, 10, 537–544. [Google Scholar] [CrossRef]
  36. Kostevšek, A.; Klemeš, J.J.; Varbanov, P.S.; Papa, G.; Petek, J. The concept of an ecosystem model to support the transformation to sustainable energy systems. Appl. Energy 2016, 184, 1460–1469. [Google Scholar] [CrossRef] [Green Version]
  37. Sonne, E. Greenhouse gas emissions from forestry operations: A lifecycle assessment. J. Environ. Qual. 2006, 35, 1439–1450. [Google Scholar] [CrossRef] [PubMed]
  38. Ghose, A.; Chinga-Carrasco, G. Environmental aspects of Norwegian production of pulp fibres and printing paper . J. Clean. Prod. 2013, 57, 293–301. [Google Scholar] [CrossRef]
  39. McKinnon, A. The economic and environmental benefits of increasing maximum truck weight: The British experience. Transp. Res. Part D Transp. Environ. 2005, 10, 77–95. [Google Scholar] [CrossRef]
  40. McKinnon, A.C.; Piecyk, M. Measurement of CO2 emissions from road freight transport: A Review of UK Experience. Energy Policy 2009, 37, 3733–3742. [Google Scholar] [CrossRef]
  41. Palander, T. The environmental emission efficiency of larger and heavier vehicles—A case study of road transportation in Finnish forest industry. J. Clean. Prod. 2017, 155, 57–62. [Google Scholar] [CrossRef]
  42. Trianni, A.; Cagno, E.; Farné, S. Barriers, drivers and decision-making process for industrial energy efficiency: A broad study among manufacturing small and medium sized enterprises. Appl. Energy 2016, 162, 1537–1551. [Google Scholar] [CrossRef]
  43. Hakawatia, R.; Smyth, B.M.; McCullough, G.; De Rosa, F.; Rooney, D. What is the most energy efficient route for biogas utilization: Heat, electricity or transport? Appl. Energy 2017, 206, 1076–1087. [Google Scholar] [CrossRef] [Green Version]
  44. Biresselioglu, M.E.; Yelkenci, T. Scrutinizing the causality relationships between prices, production and consumption of fossil fuels: A panel data approach. Energy 2016, 102, 44–53. [Google Scholar] [CrossRef]
  45. Reuß, M.; Grube, T.; Robinius, M.; Preuster, P.; Wasserscheid, P.; Stolten, D. Seasonal storage and alternative carriers: A flexible hydrogen supply chain model. Appl. Energy 2017, 200, 290–302. [Google Scholar] [CrossRef]
  46. Prinz, R.; Väätäinen, K.; Laitila, J.; Sikanen, L.; Asikainen, A. Analysis of energy efficiency of forest chip supply systems using discrete-event simulation. Appl. Energy 2019, 235, 1369–1380. [Google Scholar] [CrossRef]
  47. Mirkouei, A.; Haapala, K.R.; Sessions, J.; Murthy, G.S. A review and future directions in techno-economic modeling and optimization of upstream forest biomass to bio-oil supply chains. Renew Sustain. Energy Rev. 2017, 67, 15–35. [Google Scholar] [CrossRef]
  48. Haavikko, H.; Kärhä, K.; Hourula, M.; Palander, T. Attitudes of Small and Medium-Sized Enterprises towards Energy Efficiency in Wood Procurement: A Case Study of Stora Enso in Finland. Croat. J. For. Eng. 2019, 40, 107–123. [Google Scholar]
  49. Hope, K. Annual Report on European SMEs 2016/2017, Focus on Self-Employment, SME Performance Review 2016/2017, Final Report; European Commission, Internal Market, Industry, Entrepreneurship and SMEs: Ispra, Italy, 2017. [Google Scholar]
  50. Palander, T.; Kärhä, K. Improving Energy Efficiency in a Synchronized Road-Transportation System by Using a TFMC (Transportation Fleet-Management Control) in Finland. Energies 2019, 12, 670. [Google Scholar] [CrossRef] [Green Version]
  51. Holzleitner, F.; Kanzian, C.; Stampfer, K. Analyzing time and fuel consumption in road transport of round wood with an onboard fleet manager. Eur. J. For. Res. 2011, 130, 293–301. [Google Scholar] [CrossRef]
  52. Joelsson, J.M.; Gustavsson, L. CO2 emission and oil use reduction through black liquor gasification and energy efficiency in pulp and paper industry. Resour. Conserv. Recyc. 2008, 52, 747–763. [Google Scholar]
  53. Kilponen, L.; Ahtila, P.; Parpala, J.; Pihko, M. Improvement of pulp mill energy efficiency in an integrated pulp and paper mill. In Proceedings of the 2001 ACEEE Summer Study on Energy Efficiency in Industry “Increasing Productivity through Energy Efficiency”, Hilton Tarrytown, Tarrytown, NY, USA, 24–27 July 2001; pp. 363–374. [Google Scholar]
  54. Palander, T. Environmental benefits from improving transportation efficiency in wood procurement systems. Transp. Res. Part D Transp. Environ. 2016, 44, 211–218. [Google Scholar] [CrossRef]
  55. Tattini, J.; Gargiulo, M.; Karlsson, K. Reaching carbon neutral transport sector in Denmark—Evidence from the incorporation of modal shift into the TIMES energy system modeling framework. Energy Pol. 2018, 113, 571–583. [Google Scholar] [CrossRef]
  56. Salvucci, R.; Gargiulo, M.; Karlsson, K. The role of modal shift in decarbonising the Scandinavian transport sector: Applying substitution elasticities in TIMES-Nordic. Appl. Energy 2019, 253, 113593. [Google Scholar] [CrossRef]
  57. Tuomaala, M.; Ahtila, P.; Haikonen, T.; Kalenoja, H.; Kallionpää, E.; Rantala, J.; Tuominen, P.; Shemeikka, J.; Rämä, M.; Sipilä, K.; et al. Energy Efficiency Measures and Potentials; Publications of Aalto-University: Espoo, Finland, 2012; Volume 1, pp. 1–340. [Google Scholar]
  58. Hammond, G.P. Engineering sustainability: Thermodynamics, energy systems, and the environment. Int. J. Energy Res. 2004, 28, 613–639. [Google Scholar] [CrossRef]
  59. Seppänen, R.; Kervinen, M.; Parkkila, I.; Karkela, L.; Meriläinen, P. MAOL-Tables; Otavan kirjapaino Oy: Keuruu, Finland, 2012; pp. 1–167. [Google Scholar]
  60. Alakangas, E.; Hurskainen, M.; Laatikainen-Luntama, J.; Korhonen, J. Suomessa käytettävien polttoaineiden ominaisuuksia . VTT Technol 2016, 258, 1–229. Available online: http://www.vtt.fi/inf/pdf/technology/2016/T258.pdf (accessed on 12 April 2019).
  61. Kallionpää, E.; Rantala, J.; Kalenoja, H. Energy Efficiency in Logistics—Measurement and Improving of Logistics Energy Efficiency; Publications of Ministry of Transport and Communication: Helsinki, Finland, 2010; Volume 25, pp. 1–73. [Google Scholar]
  62. Trafi, Responsibility Measurements, Liikenteen turvallisuusvirasto Trafi. 2017. Available online: https://www.trafi.fi/filebank/a/1505300658/e0369531f9c6b7f480f91ae033c6e970/27383-Vastuullisuusmittareita_092017.pdf (accessed on 12 April 2019).
  63. Trafi, Responsibility Model of Traffic Enterprises, Liikenteen turvallisuusvirasto Trafi. 2018. Available online: https://www.trafi.fi/tieliikenne/ammattiliikenne/vastuullisuusmalli (accessed on 12 April 2019).
  64. SKAL, Energy Efficiency, Suomen Kuljetus ja Logistiikka. 2018. Available online: https://www.skal.fi/fi/jasennetti/tietopankki/kuljettaminen/energiatehokkuus (accessed on 12 April 2019).
  65. Neste, Pro Diesel Summer Quality, Product Information. 2017. Available online: https://www.neste.fi/static/datasheet_pdf/150425_fi.pdf (accessed on 12 April 2019).
  66. Neste, Pro Diesel Winter Quality, Product Information. 2017. Available online: https://www.neste.fi/static/datasheet_pdf/150445_fi.pdf (accessed on 12 April 2019).
  67. Teboil, Diesel Summer Quality, Product Information. 2018. Available online: https://www.teboil.fi/globalassets/tuotetiedotteet/diesel-kl.pdf (accessed on 12 April 2019).
  68. Teboil, Diesel Winter Quality, Product Information. 2018. Available online: https://www.teboil.fi/globalassets/tuotetiedotteet/diesel--29_-38.pdf (accessed on 12 April 2019).
  69. Nurmi, J. The calorific values of terrestrial biomass for small-sized trees. Acta Forestalia Fennica 1993, 236, 1–30. [Google Scholar]
Figure 1. Overview of the unbalanced renewable wood flow from forest feedstock (million m3) to the forest industry in 2017 in Finland.
Sustainability 12 02740 g001
Figure 2. Dynamics of a supply system’s material, energy, and monetary flows. Overview of inventories (states), operations (stages), and a sustainable cycle of advanced biofuels for the engines of larger and heavier vehicles for road freight transportation is underlined in the supply system. U = upstream; M = midstream; D = downstream.
Sustainability 12 02740 g002
Figure 3. Carbon-negative transportation fleet of renewable wood consists of large and heavy vehicle (LHV) combinations.
Sustainability 12 02740 g003
Figure 4. A synchronized transportation system (STS) and information flows in a wood supply region.
Sustainability 12 02740 g004
Figure 5. Northern and eastern study areas in Finland; NF and EF, respectively. Green highways are used as traffic routes of the heaviest and largest timber transportation vehicles. Red marks depict plants of transportation regions A, B, and C.
Sustainability 12 02740 g005
Figure 6. The average fuel consumption of a vehicle combination with a payload size of 37 t.
Sustainability 12 02740 g006
Figure 7. Fuel consumption of the vehicle combinations to varying payload sizes.
Sustainability 12 02740 g007
Figure 8. The effect of moisture content (%) of wood on the net calorific value (MJ kg-1) in arrival mode of transportation.
Sustainability 12 02740 g008
Figure 9. Energy efficiency differences between 64, 68, and 76 t vehicle combinations in comparison with the 60 t vehicle combination using four different energy efficiency measurements in the same wood supply region.
Sustainability 12 02740 g009
Figure 10. Energy efficiency comparison between the vehicle combinations of the STSs in three wood supply regions (A, B, C) of the eastern study area: Energy efficiency is calculated as the energy content of 100% renewable wood (kWh) per energy content of fuel consumption (kWh) of laden vehicles (Model 7). Energy efficiency is compared to carbon neutral level (0).
Sustainability 12 02740 g010
Table 1. The material of the timber loads measured in the northern study area: The load distribution, the presence of the crane in the measurement, the average values and the ranges for the transport, the size of the payload, and the fuel consumption by four mass limits of the vehicle combinations.
MaterialVehicle Combination
60 t64 t68 t76 t
Measured loads Distribution, %839485
Crane included in truck Proportion of loads, %42415147
Transportation distanceAverage, km147134141160
Range, km12–29326–3778–34075–335
Load sizeAverage, t44.946.047.150.5
Range, t33.2–56.031.3–58.123.3–59.034.2–60.2
Fuel consumptionAverage, l 100km-159.560.360.963.1
Range, l 100km-157.0–64.156.5–66.055.0–67.259.0–68.9
Table 2. The material of the timber loads measured in the eastern study area: The average values and the ranges for transport distance, size of the payload, and fuel consumption by three mass limits of the vehicle combinations.
MaterialVehicle Combination
64 t68 t76 t
Measured loadsNumber198,16708,20121,582
Transportation distanceAverage, km148139134
Range, km9–2819–3741–441
Load sizeAverage, t42.946.349.6
Range, t1–631–761–75
Fuel consumptionAverage, l 100km-158.760.562.0
Range, l 100km-135.5–66.537.0–73.239.0–75.9
Table 3. Timber transportation conditions for vehicle combinations of 64, 68, and 76 t in regions A, B, and C (Figure 5): Enterprise resource planning (ERP) material consists of stands’ average values regarding used wood assortments in vehicles’ payloads of road transportation.
MaterialABC
64 t68 t76 t64 t68 t76 t64 t68 t76 t
Number load assortments28698800224,8315307805240,53129550945280
Load assortments’ average size, t29.627.228.522.829.730.029.830.428.6
Fuel consumption as loaded, l 100 km-156.256.157.654.656.857.956.356.757.8
Fuel consumption of laden trip, kWh368.5386.7415.8538.7377.7454.3276.2430.8504.1
Fuel consumption of empty trip, kWh283.3329.8353.9423.3301.2352.1343.2415.4404.8
Load assortments’ energy content, kWh600,35548,46575,67462,76602,83608,71598,46610,61575,67
Empty driving distance, km58.267.170.587.061.370.270.584.580.7
Load assortments’ driving distance, km65.568.872.398.766.478.549.075.987.4
Number of plants999666444
Highways with speed >60 km h-1, km146814681468737737737501501501
Local roads with speed ≤60 km h-1, km140714071407784784784105110511051
Table 4. Fuel consumption (FC) and the amount of 100% renewable wood energy (WE) of laden vehicle combinations 60, 64, 68, and 76 t of the STS based on their average payload sizes of 44.9, 46.0, 47.1, and 50.5 t, respectively. The amount of WE is depicted according to different moisture contents of wood.
Energy typeMoisture content60 t64 t68 t76 t
%kWh
FC-0.9500.8740.8931.065
WE7537.037.838.741.5
WE5567.293.095.2102.1
WE35145148152163
WE15199203208223
Table 5. The energy efficiency of laden vehicle combinations (60, 64, 68, and 76 t) of the STS based on their average payload sizes of 44.9, 46.0, 47.1, and 50.5 t, respectively. Energy efficiency is depicted according to different moisture contents of wood.
Moisture content60 t64 t68 t76 t
%kWh kWh-1
7549546044
55122133148108
35194212236172
15266291323236
Table 6. Energy efficiency measurements of the STS in the eastern study area: Bold font depicts the most efficient combination among vehicle combinations (64, 68, and 76 t) of the STS, M = model.
Energy Efficiency MeasurementMVehicle Combination
64 t68 t76 t
Transport performance, tkm4391833999243281
Fuel consumption per transport performance, kWh tkm-150.1930.1810.192
Transport performance per fuel consumption, tkm kWh-165.3435.4315.402
Wood energy per fuel consumption, kWh kWh-1776.78279.09173.793
Table 7. Energy efficiency measurements of timber transportation fleets in three regions of eastern Finland: Bold font depicts the most efficient among the vehicle combinations (64, 68, and 76 t) of the STS: M = model, R = region’s STS. The moisture content of wood is 55%.
Energy Efficiency MeasurementMRVehicle Combination
64 t68 t76 t
Transport performance, tkm4A365733689240611
Fuel consumption per transport performance, kWh tkm-15A0.1810.2130.192
Transport performance per fuel consumption, tkm kWh-16A5.6115.1535.292
Wood energy per fuel consumption, kWh kWh-17A92.1176.55274.793
Transport performance, tkm4B423823796344631
Fuel consumption per transport performance, kWh tkm-15B0.2330.1810.182
Transport performance per fuel consumption, tkm kWh-16B4.4135.6015.532
Wood energy per fuel consumption, kWh kWh-17B48.11388.80175.482
Transport performance, tkm4C356634875148102
Fuel consumption per transport performance, kWh tkm-15C0.1720.1710.193
Transport performance per fuel consumption, tkm kWh-16C5.7625.7615.293
Wood energy per fuel consumption, kWh kWh-17C96.62172.16263.343
Table 8. Impact of transportation conditions on robustness of energy efficiency measurements for ranking of vehicle combinations 64, 68 and 76 t of the STSs in the transportation regions A, B and C and in the eastern study area (EF): Figures of materials M1 and M2 depict the ordinal ranking of their positive appearance. The best combination gets ranking number 1 (first). M1 depicts ranking of roadside storage that is based on average calculations of a forest stand’s load assortment in a vehicle’s load. M2 depicts ranking of transport networks in the regions. The total is the sum of the most positive rankings (1) in transportation conditions.
MaterialABCEF
646876646876646876646876
Model 4, tkm321231312321
Model 5, kWh tkm-1132312213312
Model 6, tkm kWh-1132312213312
Model 7, kWh kWh-1123312123213
M1Number of load assortments321321321321
Load assortment’s average size, t132321213321
Fuel consumption as loaded, l 100 km-1213123123123
Fuel consumption of laden trip, kWh123312123213
Fuel consumption of empty trip, kWh123312132123
Load assortment’s energy content, kWh132321213321
Empty driving distance, km123312132213
Load assortment’s driving distance, km123312123213
M2Number of plants111222333---
Highways with speed > 60 km h-1111222333---
Local roads with speed ≤ 60 km h-1111333222---
Total 944143521233

