Article

Study on Dynamic Total Factor Carbon Emission Efficiency in China’s Urban Agglomerations

1
Key Laboratory of Land Surface Pattern and Simulation, Institute of Geographic Sciences and Natural Resources Research, Chinese Academy of Sciences, Beijing 100101, China
2
Center for Chinese Agricultural Policy, Chinese Academy of Sciences, Beijing 100101, China
3
College of Urban and Environmental Sciences, Central China Normal University, Wuhan 430079, China
4
School of Economics and Management, Sanming University, Sanming 365004, China
5
Research Center of Low Carbon Economy, Research Base of Humanities and Social Sciences of Fujian Institutions of Higher Learning, Sanming 365004, China
6
State Key Laboratory of Water Environment Simulation, School of Environment, Beijing Normal University, Beijing 100875, China
7
College of Geography and Environment, Shandong Normal University, Jinan 250358, China
*
Author to whom correspondence should be addressed.
Sustainability 2020, 12(7), 2675; https://doi.org/10.3390/su12072675
Submission received: 6 March 2020 / Revised: 18 March 2020 / Accepted: 27 March 2020 / Published: 28 March 2020
(This article belongs to the Special Issue Sustainable Urban Transitions: Towards Low-Carbon, Circular Cities)

Abstract

:
The scale effect of urbanization on improving carbon emission efficiency and achieving low-carbon targets is an important topic in urban research. Using dynamic panel data from 64 prefecture-level cities in four typical urban agglomerations in China from 2006 to 2016, this paper constructed a stochastic frontier analysis model to empirically measure the city-level total-factor carbon emission efficiency index (TCEI) at different stages of urbanization and to identify rules governing its spatiotemporal evolution. We quantitatively analyzed the influences and functional characteristics of TCEI in the four urban agglomerations of Pearl River Delta, Beijing-Tianjin-Hebei, the Yangtze River Delta, and Chengdu-Chongqing. Results show that the TCEI at different stages of urbanization in these urban agglomerations is increasing year by year. The overall city-level TCEI was ranked as follows: Pearl River Delta > Beijing-Tianjin-Hebei > Yangtze River Delta > Chengdu-Chongqing. Improvements in the level of economic development and urbanization will help achieve low-carbon development in a given urban agglomeration. The optimization of industrial structure and improvement of ecological environment will help curb carbon emissions. This paper provides decision-making references for regional carbon emission reduction from optimizing industrial and energy consumption structures and improving energy efficiency.

1. Introduction

Regional development trends show that cities are increasingly becoming urban agglomerations in China. They are areas where economic ties and industrial structure are concentrated. Urban agglomerations are also the most significant source of carbon emissions [1,2,3]. While having advantages such as condensed spatial layout, industrial development, and close internal connections, urban agglomerations also need to address low-carbon development and the construction of ecological civilization [4,5,6]. The Thirteenth Five-Year Plan clearly states that “urban agglomerations promote the development of surrounding areas with strong radiation-driven functions as the core. While optimizing the development of the Beijing-Tianjin-Hebei, Yangtze River Delta, and Pearl River Delta urban agglomerations, China must promote the formation of more regional growth poles” [7]. The report of the 19th National Congress of the CPC also said that “the development of urban agglomerations is an important practice in cracking regional development problems” [8]. Although the radiation-driven and coordinated development functions of urban agglomerations play an important role in activating national economic ties, promoting industrial clusters, and optimizing urban spatial development patterns, they also create degradation of the ecological environment and cause high carbon emissions.
Since 2007, China has been the second largest carbon emitter in the world, behind the United States [9]. Immediately after this, China’s carbon emissions entered a round of rapid growth in the context of expanding domestic demand in 2008 [10]. Urban agglomerations contributed 71.7% of national carbon emissions [11] and by 2030, urban agglomerations will have contributed 83% of national carbon emissions [12]. China is in a stage of rapid urbanization, and its energy efficiency is generally lower than that of developed countries [13,14,15]. At the 2015 Paris Climate Conference, China promised in its National Independent Contribution that [16], compared to 2005, its CO2 emissions per unit of gross domestic product would decrease by 60% to 65% [17]. Chinese industry is facing tremendous pressure to reduce carbon emissions. Therefore, studying total-factor carbon emission efficiency (TCEI) and implementing carbon emission reduction measures from the perspective of urban agglomerations is important for exploring regional sustainable development. Results will contribute to the early implementation of carbon emission standards at the city, regional, and national levels.
The economic growth of urban agglomerations inevitably results in a substantial increase in energy consumption and carbon emissions [18]. Improving TCEI is an effective means to achieve low- carbon goals in urban agglomerations and their expansion areas [19]. Studying carbon emission efficiency has progressed from a single factor perspective to a full factor perspective. Researchers and institutions from various countries have defined carbon emission efficiency from different perspectives. Kaya and Yokobori [20] proposed the use of carbon productivity to define carbon emission efficiency from a single factor perspective in 1993. They believed that carbon emission efficiency was the ratio of GDP to carbon emissions over time. Mielnik et al. [21] took energy consumption into account and used the ratio of carbon emissions to energy consumption to measure carbon emission efficiency. Sun [22] subsequently proposed the use of the carbon emissions per unit of GDP to represent carbon emission efficiency. These researchers defined the relationship between carbon emissions and regional economic output in terms of input–output relations. However, it is difficult to comprehensively summarize the carbon emission efficiency of a country or region based on these two factors. Recent studies have undertaken in-depth analysis of carbon emission efficiency from a full factor perspective. For example, Ramanathan [23,24] defined carbon emission efficiency under a comprehensive framework including economic development, energy consumption, and carbon emissions. He then analyzed the relationship between the three factors in terms of temporal changes and spatial linkages and used data envelope analysis (DEA) to measure the carbon emission efficiency of seventeen countries in the Middle East and North Africa [25]. Zhou et al. [26,27,28] used the bootstrap method to introduce relaxation variables into the research framework to construct an indicator system. They constructed a Malmquist CO2 emission performance index indicator based on the Malmquist index, and used different DEA models to estimate carbon emission efficiency. Reinhard et al. [29] used a DEA model and a stochastic frontier analysis (SFA) function to measure the carbon emission efficiency of a multidimensional region and they compared the advantages and disadvantages of these two methods. Dong et al. [30] used the SFA method to measure and compare the carbon emission efficiency of various provinces in China. Guo et al. [31] used a DEA model to evaluate the carbon emission performance of 29 Chinese provincial administrative regions (Tibet and Taiwan were not included because of a lack of data) by computing potential carbon emission reductions for energy conservation technology and energy structural adjustment. Subsequently, research on carbon emission efficiency has examined spatial feature disclosure and influential factor analysis. For example, Zhang et al. [32] used the Log Mean Divisia index method to deconstruct changes in China’s carbon emissions and carbon emission intensity from the perspectives of energy sources and industrial structure, showing there was a positive relationship between economic growth and carbon emissions, and they were spatially aggregated. Ma et al. [33,34] measured the spatial distribution and evolution pattern of carbon dioxide emission efficiency using the global and local spatial autocorrelation Moran’s I index. Cheng et al. [35] used an improved non-radial directional distance function to construct a new meta-frontier total-factor carbon emission efficiency index and analyzed spatial and temporal heterogeneity. Wang et al. [36] used spatial econometric models to explore the spatial characteristics of CO2 emissions, and the economic externalities of spatial units.
In relation to carbon emission efficiency, Wang [37] used Shephard’s distance function to analyze the influencing factors for carbon emission efficiency. The results show that technological progress has an important role in improving carbon emission efficiency. Zhou et al. [28] used convergence theory and panel regression analysis to conclude that intensity, ownership structure, and industrial structure have a significant impact on carbon emission efficiency. Rahman et al. [38] conducted Granger causality tests on the long-term effects of carbon emission efficiency and on carbon emission efficiency from the perspective of long-term influencing factors. They used error correction models to conclude that input and energy prices have a positive impact on carbon emission efficiency and factors like technology spillover have a negative impact. Zhang et al. [39] used the Tobit model to conclude that economic development level, energy structure, industrial structure. and endowment structure have differing effects on carbon emission efficiency. Cheng et al. [40] used spatial autocorrelation analysis methods and spatial panel models to reveal that China’s carbon emission intensity has been increasing.
In summary, based on this previous research into carbon emission efficiency and its influencing factors, measuring carbon emission efficiency needs to integrate multiple factors such as the economy, resources and environment, and measurement methods including DEA and SFA. The DEA model does not need to construct a specific function form, so it can avoid production function forms that may lead to the wrong conclusions. However, because it ignores random noise, DEA may give inaccurate efficiency estimates. DEA is also susceptible to outliers, especially when it processes macro data. SFA is a parametric method, which can provide a specific function to represent the coefficients of each factor in the estimation process. Random errors need to be considered, and it can distinguish inefficient items and random errors. SFA has significant advantages in processing low-quality macroeconomic data. Because of the limited available data, existing research has mostly focused on provinces or individual cities. There is little literature on the carbon emission efficiency of urban agglomerations, and it is impossible to clearly reflect the spatial differences between regional connectivity and efficiency. In addition, most scholars use conventional mathematical fitting methods to study the factors influencing carbon emission efficiency. Mathematical fitting methods cannot capture the effect of spatial autocorrelation. Using spatial geo-economic knowledge and spatial econometric methods to study the spatiotemporal evolution of carbon emission efficiency in urban agglomerations also needs to be improved.
This paper used a parametric SFA method to analyze the total-factor carbon emission efficiency (TCEI) of 64 prefecture-level cities in four major urban agglomerations in China including the Pearl River Delta, Beijing-Tianjin-Hebei, the Yangtze River Delta, and Chengdu-Chongqing. Quantitative analysis on the characteristics of factors influencing TCEI was carried out using the Tobit regression model. We proposed strategies for improving carbon emission efficiency and reducing carbon emissions in the four major urban agglomerations in China.

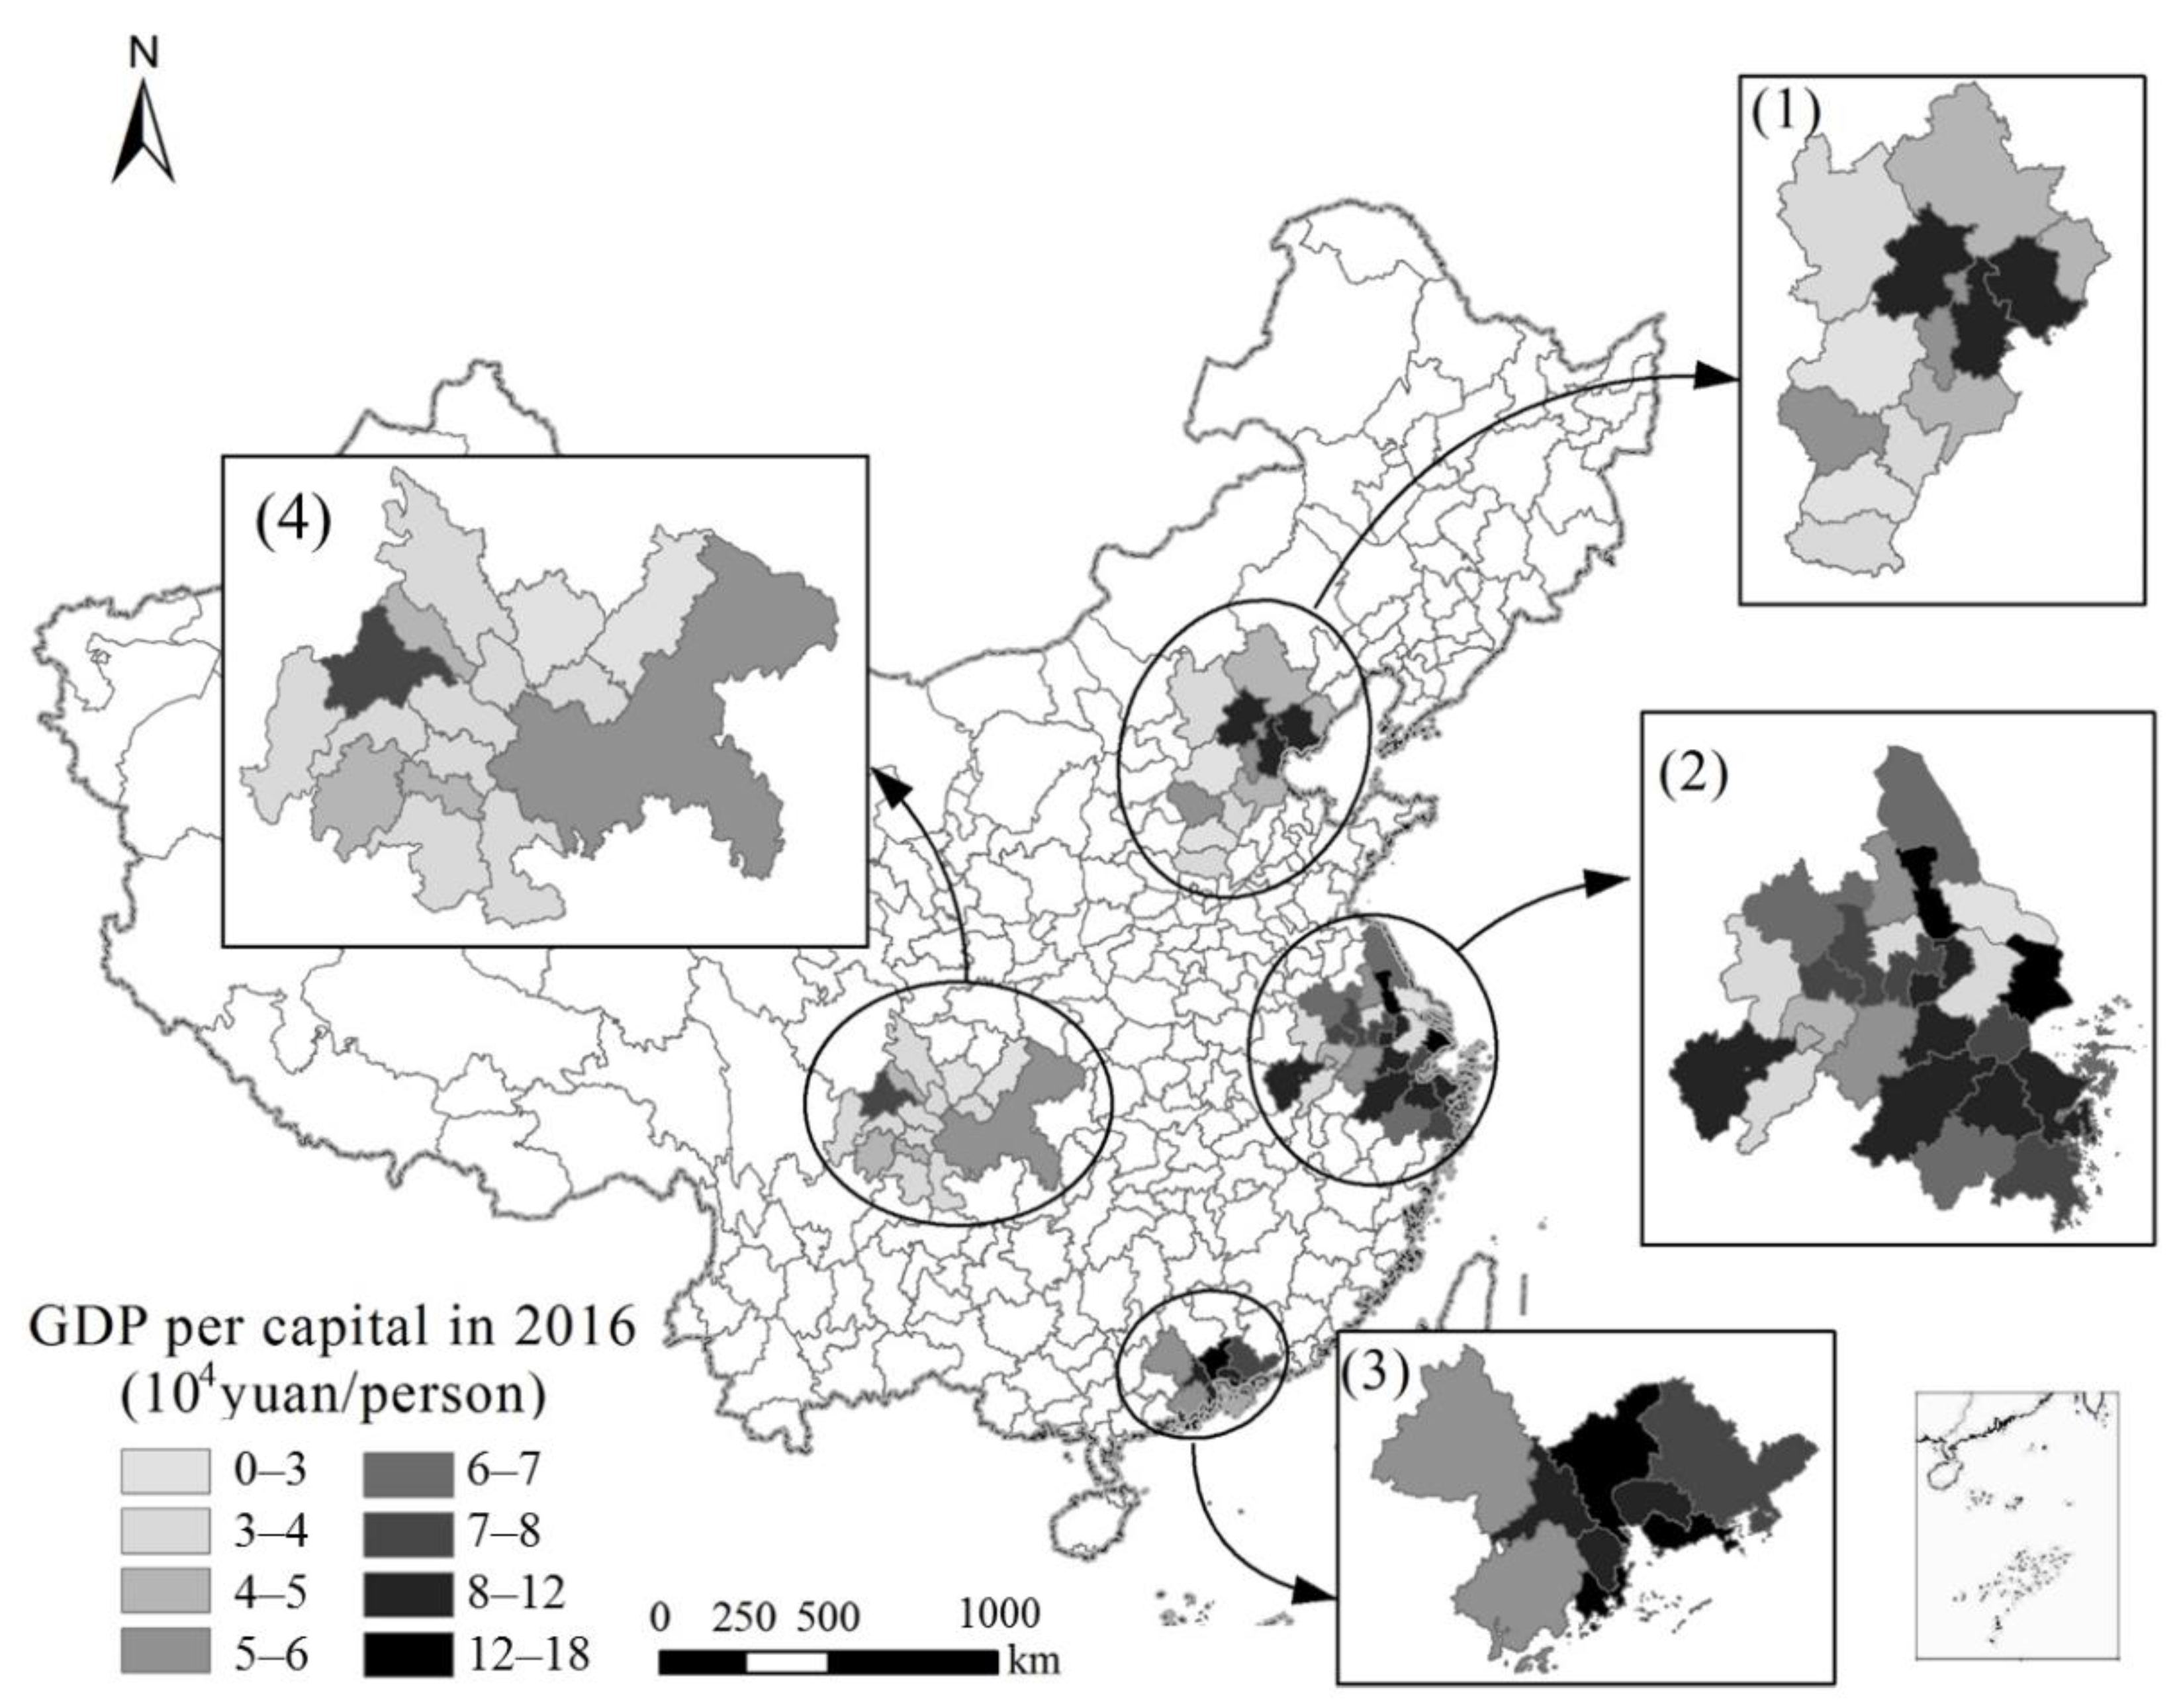
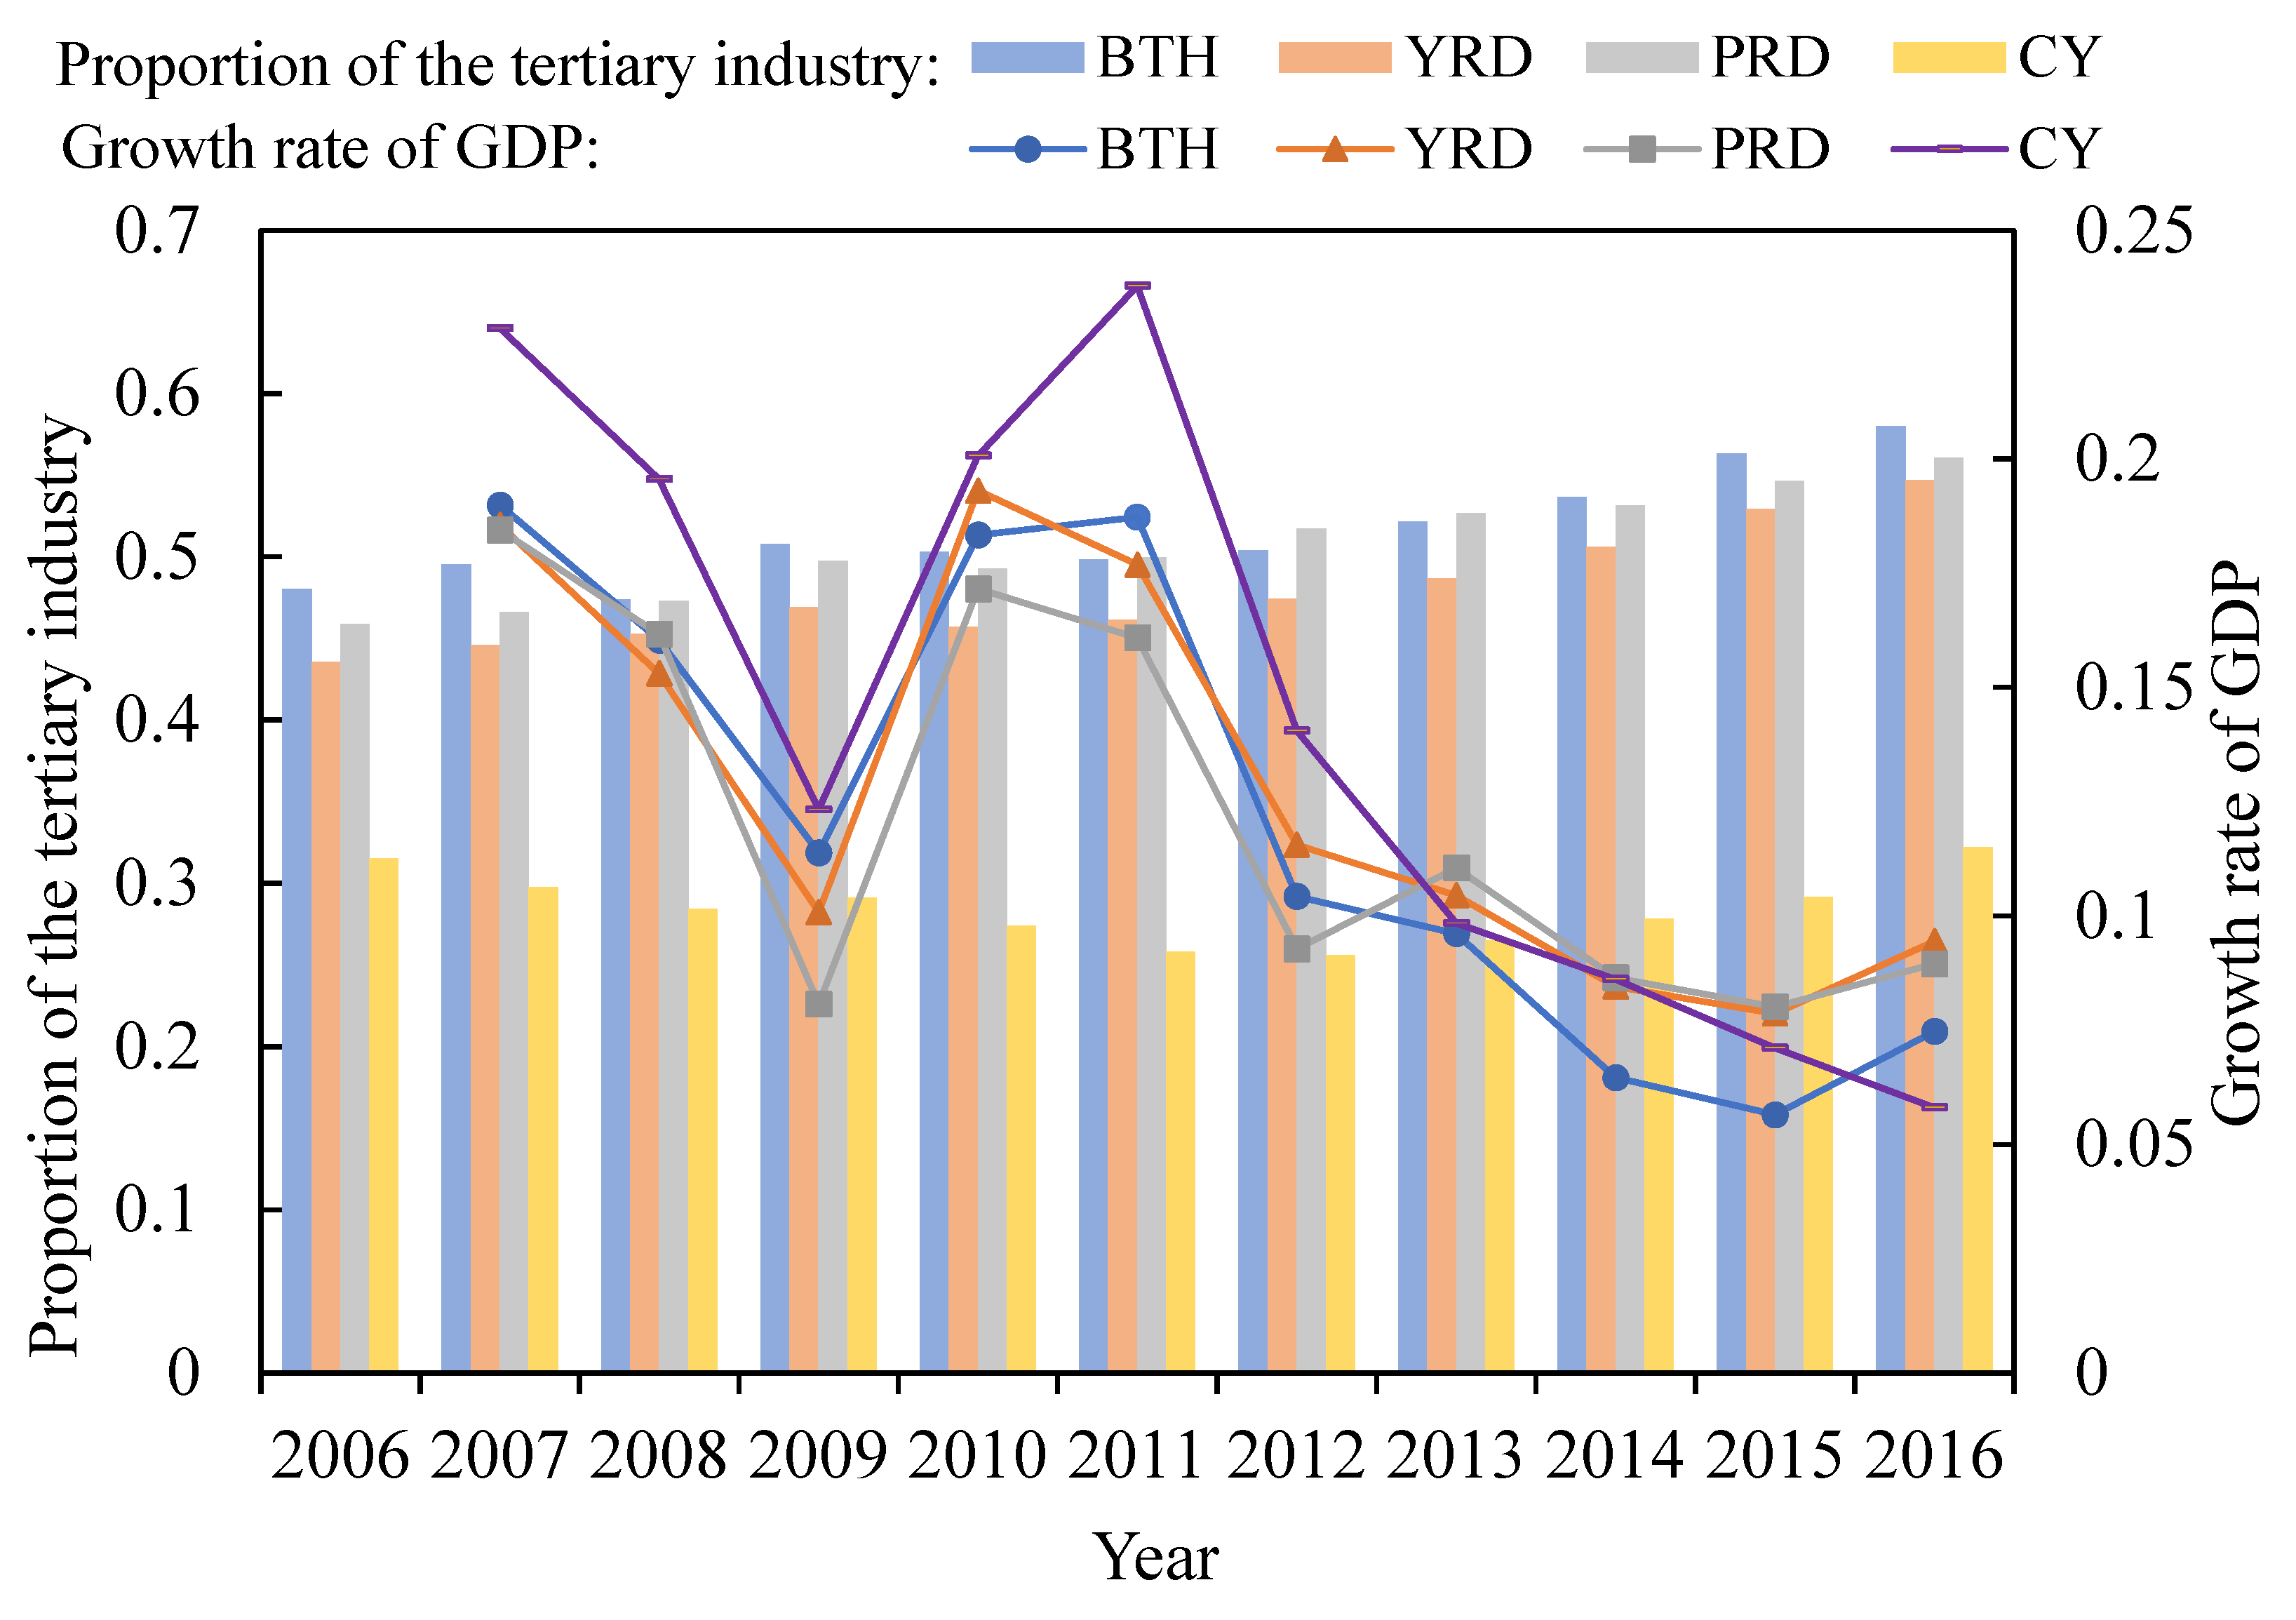
2. Economic Development and Carbon Emissions in the Four Urban Agglomerations

2.1. Economic Development Status

Based on the different nature, type, scale, and spatial distribution of the cities clustered in a specific area, this paper selected four major urban agglomerations in China: the Beijing-Tianjin-Hebei, the Yangtze River Delta, the Pearl River Delta, and the Chengdu-Chongqing urban agglomerations which include 64 prefecture-level cities (Table 1). These urban agglomerations are distributed in the eastern coastal and inland areas (Figure 1). The three major urban agglomerations of Beijing- Tianjin- Hebei, the Pearl River Delta, and the Yangtze River Delta contain 18% of the country’s population with 3.6% of the land area, creating about 36% of GDP, and their industries are more concentrated, economic links are closer, and green transportation and energy efficiency standards are easier to achieve [41,42]. The Chengdu-Chongqing urban agglomeration has the geographical advantage of communicating with the southwest and northwest, connecting domestic and foreign countries. It can promote strategic fit and interactions between the “the Belt and Road” and the Yangtze River Economic Belt and accelerate the development of the central and western regions. The Chengdu-Chongqing urban agglomeration also forms an important geographical circle with the first three major urban agglomerations, which has great strategic significance. In addition, the strong radiation and economic development potential of the two major cities of Chengdu- Chongqing, gives the region enough potential to become a favorable contender for China’s fourth largest urban agglomeration.
In terms of economic growth, the four major urban agglomerations show a generally consistent trend. The economic development system is improving, various technologies are becoming mature, and economic development is relatively stable. In 2008, due to the impact of the economic crisis, GDP growth declined slightly, after which GDP growth rose and fell until 2011 and gradually stabilized. From 2006 to 2013, the Chengdu-Chongqing urban agglomeration showed the fastest GDP growth rate, and Pearl River Delta urban agglomeration showed the slowest GDP growth rate. There was a small difference between the GDP growth rate of Beijing-Tianjin-Hebei and the Yangtze River Delta urban agglomerations. Between 2013 and 2016, the growth rate of Beijing-Tianjin-Hebei and Chengdu-Chongqing urban agglomerations showed a significant decline, but in 2016, the development speed of Beijing-Tianjin-Hebei urban agglomeration increased. The overall growth rate of the four major urban agglomerations shows a trend of “divergence–convergence–re-divergence”, which is generally higher than the national average. The four major urban agglomerations play an important driving role in national economic development.
In terms of industrial structure, Figure 2 shows that the proportion of tertiary industries in the BTH, PRD, and YRD continued to increase (by about 50%) between 2006 and 2016. In 2016, the proportion of tertiary industries was close to 60%, meaning that service industries had a prominent position in driving economic development, the industrial structure had become more advanced, and the economic structure had been continuously optimized. However, the proportion of tertiary industry in the CY was significantly lower than that of other urban agglomerations (about 30%), and there was a downward trend around 2011. The research base period of this article is 2006, so the first growth rate of GDP in the research period appeared in 2007. Since 2011, the GDP growth rate of the CY also fell rapidly, declining more than other urban agglomerations. This shows that the proportion of the tertiary industry is crucial to economic development.

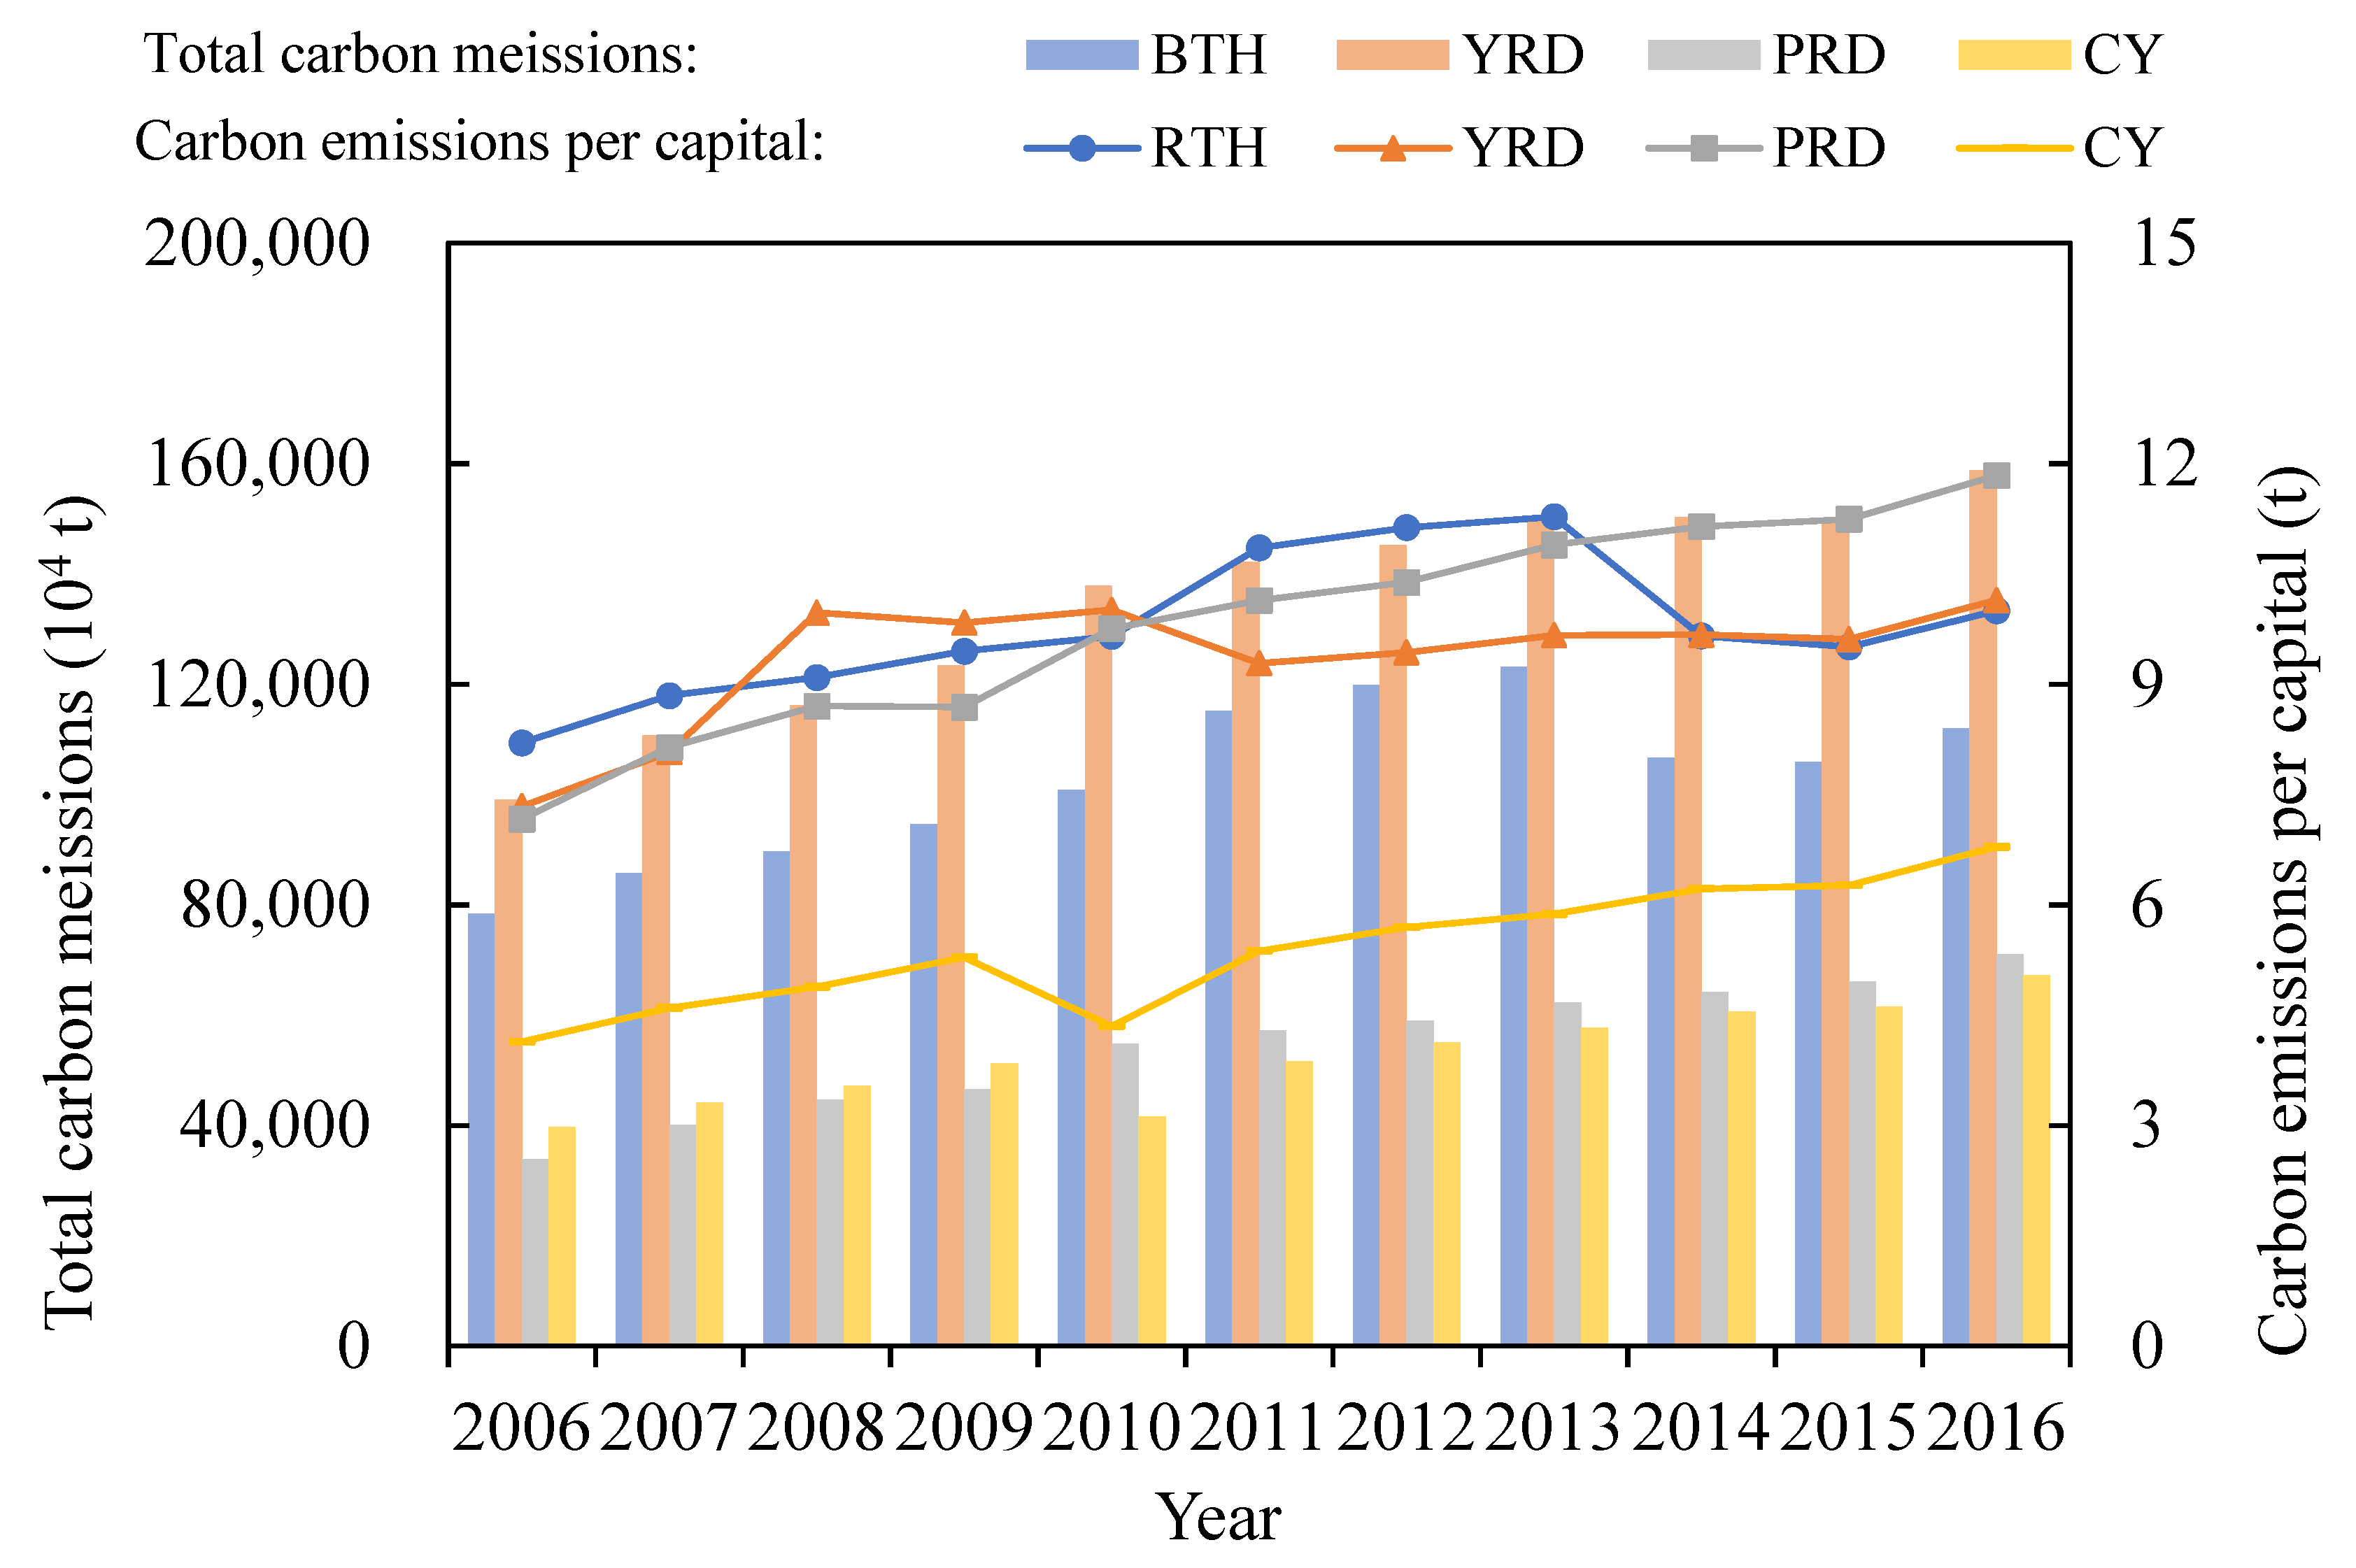
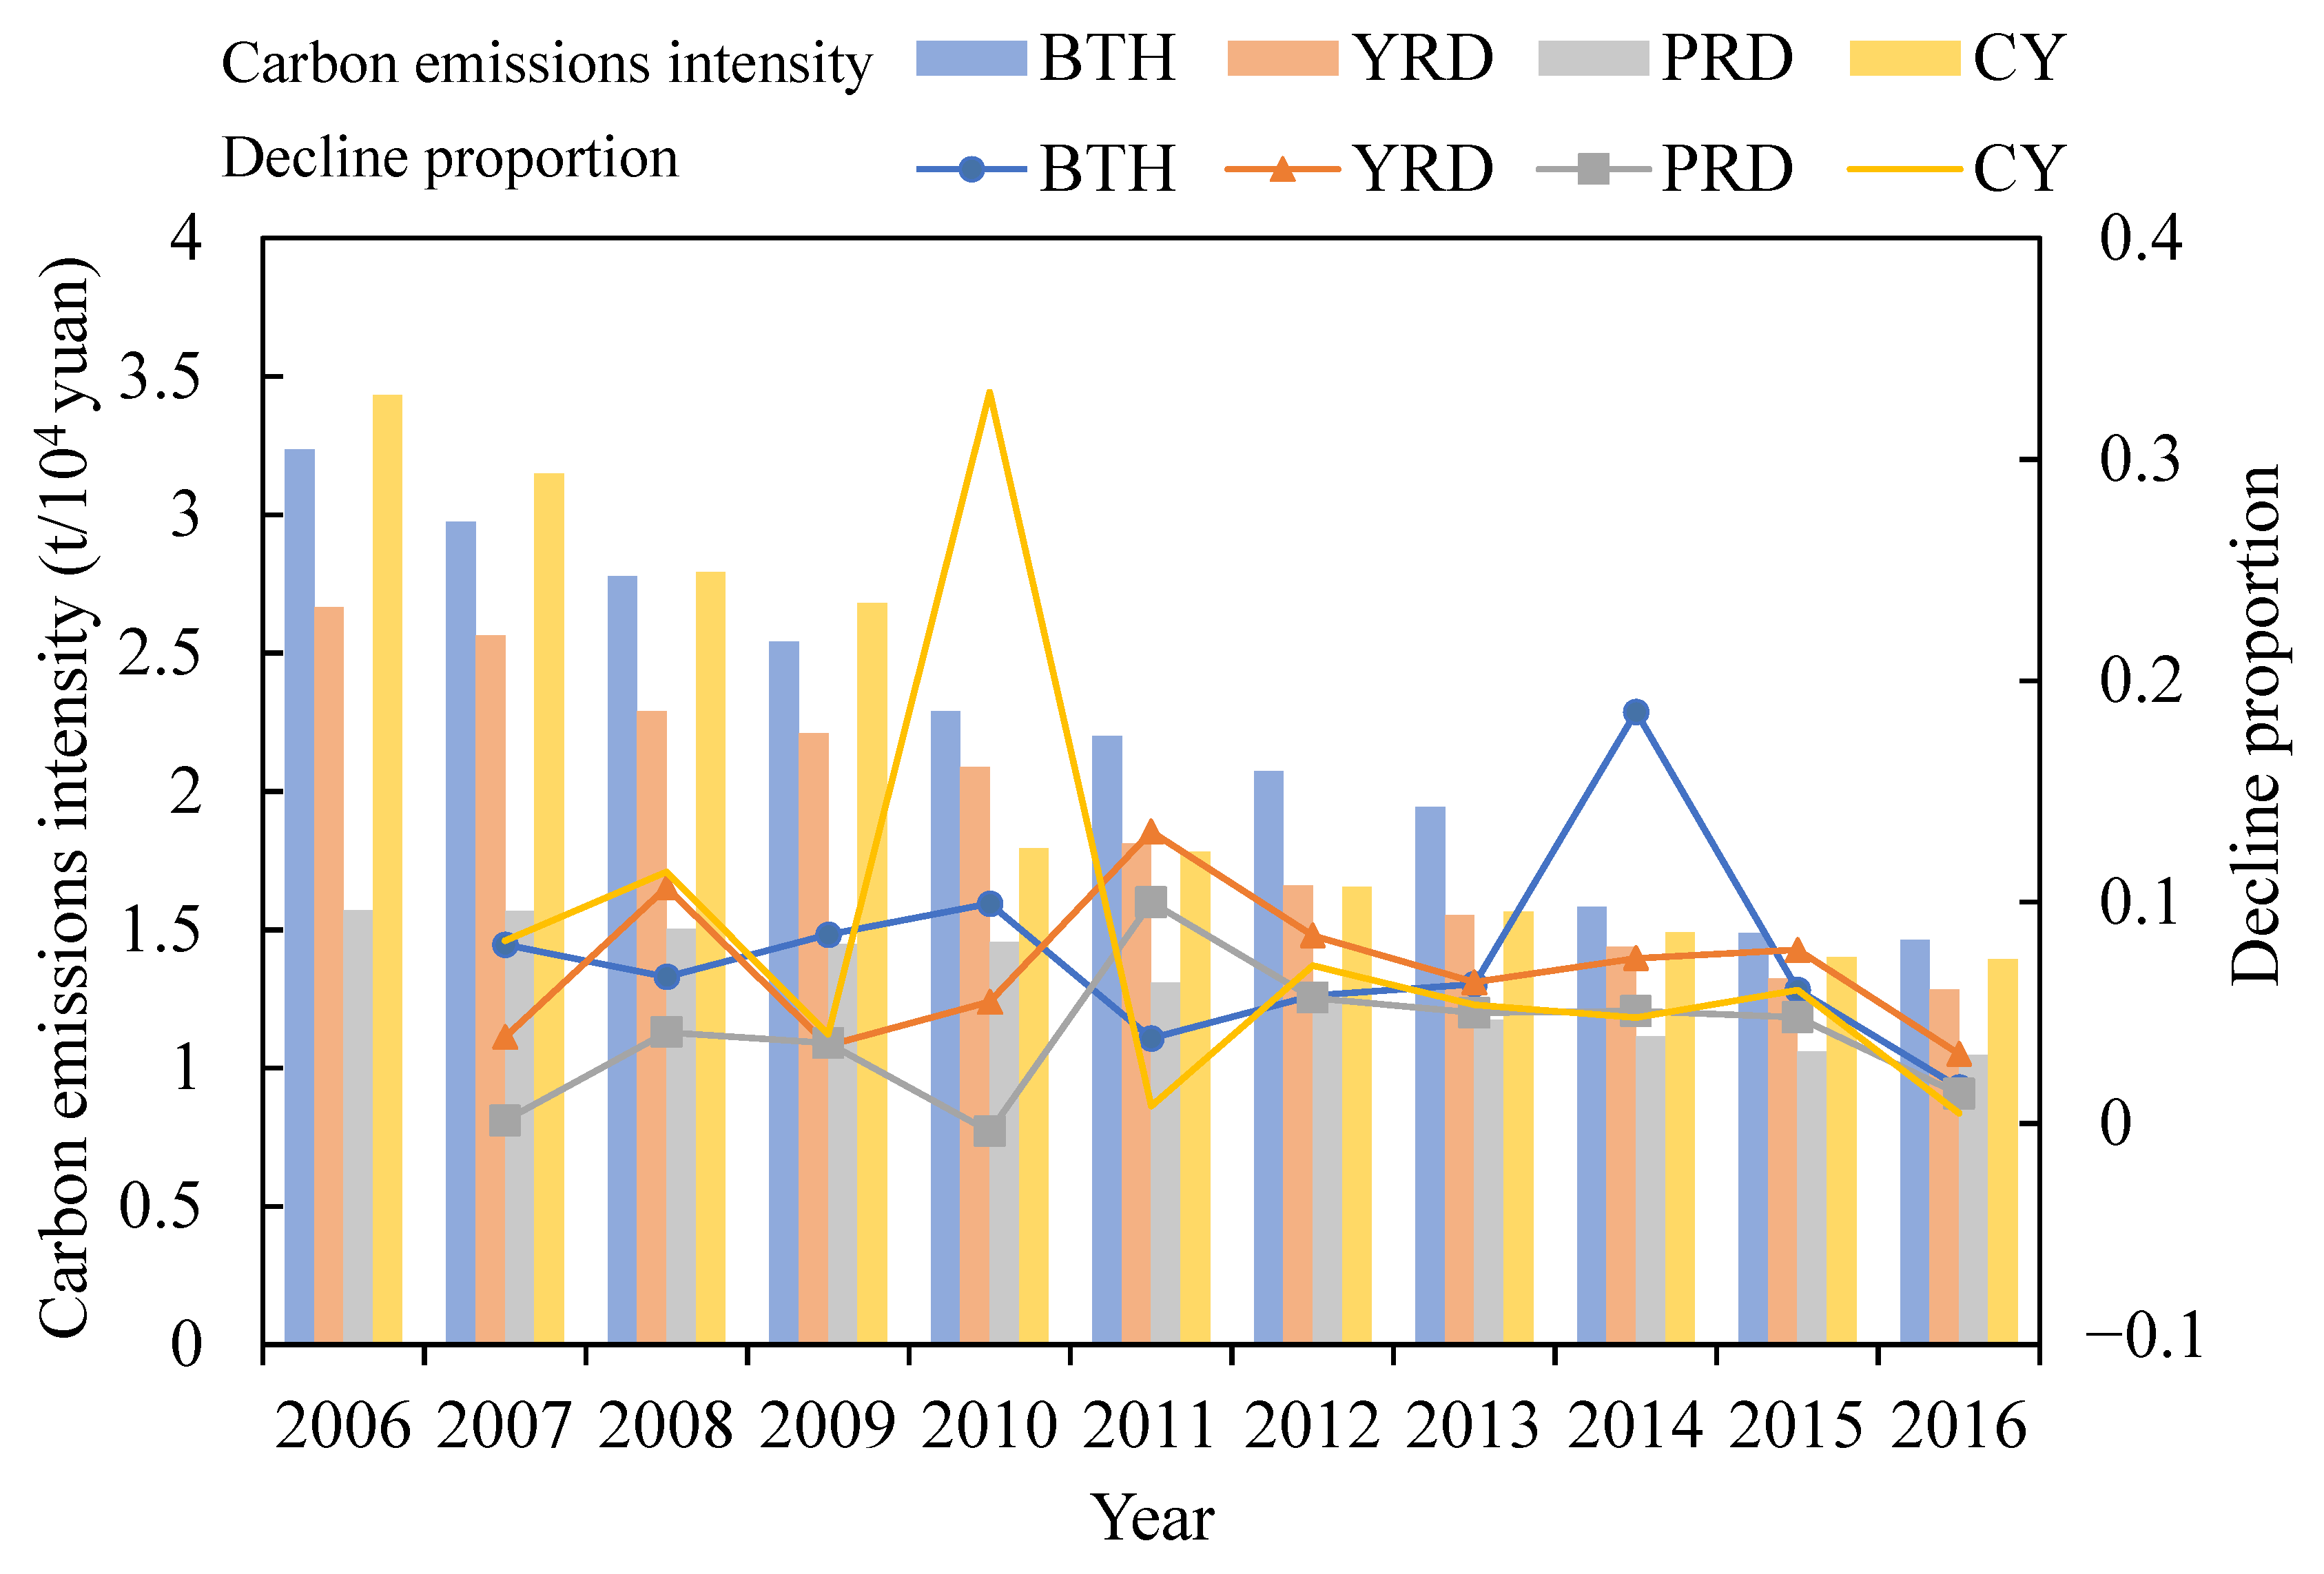
2.2. Status of Carbon Emissions

Urban agglomerations have always been the main arenas in addressing climate change and practicing a low-carbon economy in China. The four major urban agglomerations of Beijing-Tianjin-Hebei, the Pearl River Delta, the Yangtze River Delta, and Chengdu-Chongqing have more clustered industries, closer economic ties, highly productive development, and progressive production. As the economy grows, the carbon emissions of the four major urban agglomerations have shown a continuous increase in total emissions and a gradual decline in intensity. As of 2016, the total carbon emissions of the four major urban agglomerations were in the order of the Yangtze River Delta > Beijing-Tianjin-Hebei > the Pearl River Delta > Chengdu-Chongqing. The total carbon emissions of the Beijing-Tianjin-Hebei urban agglomeration showed a significant downward trend in 2014: industry chain extension and grooming and regional spatial layout optimization played a key role in this process. The annual average carbon emissions growth rates of the Yangtze River Delta, Beijing-Tianjin-Hebei, Pearl River Delta and Chengdu-Chongqing urban agglomerations were 4.91%, 3.87%, 7.8%, and 5.9%, respectively. This shows a catch-up effect, which reflects the fact that the annual average growth rate of carbon emissions in the urban agglomerations with larger total carbon emissions was lower than that in the urban agglomerations with smaller total carbon emissions. Regardless of the impact of area and population density, this paper found that the Chengdu-Chongqing urban agglomeration showed the lowest per capita carbon emissions. For the remaining three urban agglomerations, the per capita carbon emissions of the Yangtze River Delta remained basically stable; those of the Pearl River Delta urban agglomeration increased year by year; and the per capita carbon emissions of the Beijing-Tianjin-Hebei urban agglomeration declined slightly. Overall, the total carbon emissions of each urban agglomeration showed a trend consistent with the per capita carbon emissions (Figure 3).
The carbon emissions intensity (carbon emission/GDP) represents the carbon emissions corresponding to the GDP per unit area. It shows the relationship between carbon emissions and GDP, which implies the possibility of reducing carbon emissions while ensuring economic development. The concept of sustainability can be used to measure regional energy use efficiency, economic development, and technological progress. It reflects the energy consumption structure and carbon emission efficiency to a certain extent, and it is an important indicator of high-quality regional economic development. In terms of the four major urban agglomerations, as of 2016, their carbon emission intensity was in order of Beijing-Tianjin-Hebei > Chengdu-Chongqing > Yangtze River Delta > Pearl River Delta, and the carbon emissions intensity in all four major urban agglomerations has shown a downward trend year by year (Figure 4). From the beginning of 2006 to 2016, the decline in carbon emissions intensity is relatively stable year by year. The Chengdu-Chongqing urban agglomeration and the Beijing-Tianjin-Hebei urban agglomeration showed the largest declines in carbon emission intensity, with average annual declines of 8.1% and 7.5%, respectively. In 2016, the carbon emission intensity converged to around 1.1 to 1.5 t/104 yuan, indicating that when urban agglomeration development reaches a certain degree, there are similar levels of industrial development, energy structure optimization, and low-carbon technological innovation. The industrial transfer and efficiency difference between various urban agglomerations may be the main reasons for the difference in carbon emission intensity among urban agglomerations.

3. Research Methods and Data Sources

3.1. Measurement and Calculation of Carbon Emission Efficiency

In view of the empirical research on traditional production factors in this paper, some assumptions needed to be made regarding output maximization or cost minimization [43,44]. Debreu [45] and Farrell [46] made significant progress in studies of production efficiency. They pointed out that the measurement of technical efficiency should be based in the direction of output or input, which is called Debreu-Farrell efficiency. Debreu-Farrell efficiency is used as the basic framework for production efficiency analysis, which facilitates estimating carbon emission performance and inserts undesired output into traditional production functions. Assuming that the input factors in the production process are capital (K), labor (L), and energy (E) [35]. This paper considers carbon emissions as undesired output, and it refers to the research results of Bai et al. [47,48] to incorporate CO2 emissions into the production function. It extends the definition of traditional production technology into an economic system [49,50], and defines input vectors x = ( K ,   L ,   E ) R N + , where each variable can generate two vectors including O = R M + (expected output) and U = R L + (unexpected output), thus measuring production technology.
P ( K ,   L ,   E ) = { ( K ,   L ,   E ,   O ,   U ) :   ( K ,   L ,   E )   c a n   p r o d u c e   ( O ,   U ) }
In this paper, a TCEI evaluation model was established with the help of a distance function method, which increased the expected output (O) and reduced the undesired output (U). The direction vector p = ( p o ,   p u ) indicates that industrial output increases in the p o direction, and carbon emissions decrease in the p u direction. The distance function is expressed as follows:
D ( K ,   L ,   E , O ,   U ) = s u p { β : ( O + β p o ,   U β p u ) P ( K ,   L ,   E ) }
In the formula, D ( K ,   L ,   E ,   O ,   U ) represents the highest growth rate and emission reduction rate of industrial output.
The carbon emission efficiency is expressed as follows:
T C E I = 1 D ( K ,   L ,   E ,   O ,   U )
To measure the carbon emission efficiency, the SFA method was used to estimate the directional distance function. Because the trans-log function is simple and it can take into account the interaction between different variables, based on this assumption, the directional distance function was expressed as Equation (A1) in Appendix A. According to the functional properties proposed by Färe et al. (1989, 2005), if the increase of industrial output in the p o direction is a , the corresponding decrease in carbon emissions in the p u direction is also a . Let α = U i t , the increase of GDP and decrease of CO2 emission are U i t . As a result, we have the following formula based on the above settings, and more details are shown as Equations (A2)–(A4) in Appendix A.
L n U i t = A + β k L n K i t + β l L n L i t + β e L n E i t + β o ( L n O i t + L n U i t ) + β k l L n K i t L n L i t + β k e L n K i t L n E i t + β k o L n K i t ( L n O i t + L n U i t ) + β l e L n L i t L n E i t + β l o L n L i t ( L n O i t + L n U i t ) + β e o L n E i t ( L n O i t + L n U i t ) + 1 2 β k k ( L n K i t ) 2 + 1 2 β l l ( L n L i t ) 2 + 1 2 β e e ( L n E i t ) 2 + 1 2 β o o ( L n O i t + L n U i t ) 2 + v i t η i t
Where η i t = D ( L n K i t ,   L n L i t ,   L n E i t ,   L n O i t ,   L n U i t ) is the efficiency of industry sector i in the t -th year. The correlation coefficient satisfied the following equation:
β o β u = 1 ;   β o o = β o u = β u u ;   β k o = β k u ;   β l o = β l u ;   β e o = β e u

3.2. Identification of Influencing Factors

The Tobit model proposed by Tobit (1958) is used for regression analysis. The Tobit model is also called a Censored Regression Model or a Restricted Dependent Variable Model. The model uses maximum likelihood to estimate parameters:
Y i t = β 0 + β n X i t n + ε
In the formula, Yit is the carbon emission efficiency of the i-th prefecture-level city in the t-th year; Xit is the impact factor value of the carbon emission efficiency influencing factors of the i-th prefecture-level city in the t-th year. There are n influencing factors, which are described in detail in Section 3.3; β0 is a constant term; βT is an unknown parameter vector; εi is a perturbation term, and it follows a normal distribution.

3.3. Data Sources and Indicator Selection

This paper focuses on economic, social, and energy consumption data for four typical urban agglomerations (Table 2). Measuring carbon emission efficiency required five indicators, including labor force (number of employees at the end of the year), fixed asset investment, classified energy consumption (in standard coal), GDP and carbon emissions (CO2) for 64 prefecture-level cities from 2006 to 2016. Eight factors including the per capita GDP (economic development level, 10,000 yuan/person), the urbanization rate (urbanization level), the proportion of secondary industry (industrial structure, industrialization rate), the proportion of tertiary industry (industrial structure), the proportion of GDP above designated size (industrial agglomeration), sewage treatment rate (ecological index), proportion of total exports to GDP (external dependence), and actual use of foreign capital in that year (external dependence, in US$10,000) were analyzed as influencing factors. The data were sourced from the China Statistical Yearbooks from 2007 to 2017 and the provincial and municipal statistical yearbooks. Some modifications were needed: economic data like GDP needed to be revised with the 2006 production price index to obtain comparable data for the same period, and carbon emissions data needed to be calculated based on energy consumption data.

4. Results and Analysis

4.1. Model Parameter Estimation

Based on the established model, Table 3 shows the estimated results of the SFA Model. After testing, the model constructed in this paper was shown to be valid. The estimated coefficient of industrial GDP was negative (−0.0891) and significant at the level of 5%, indicating that the higher the industrial GDP of a sector, the lower the corresponding efficiency loss and the higher the carbon emission efficiency. The carbon dioxide emission coefficient (βc) was positive (0.9109), which indicated that the larger the carbon dioxide emissions, the greater the efficiency loss and the lower the carbon emission efficiency. The above results were in line with the assumptions proposed in this paper on carbon emission efficiency and they do not contradict the actual production figures. Input factors had an indirect impact on carbon emission efficiency through GDP and carbon emissions. Capital (βk = −0.0104), labor (βl = −0.0584), and energy (βe = −1.0397) inputs led to increased carbon emission efficiency, and the impact of energy, labor, and capital inputs decreased carbon emission efficiency.

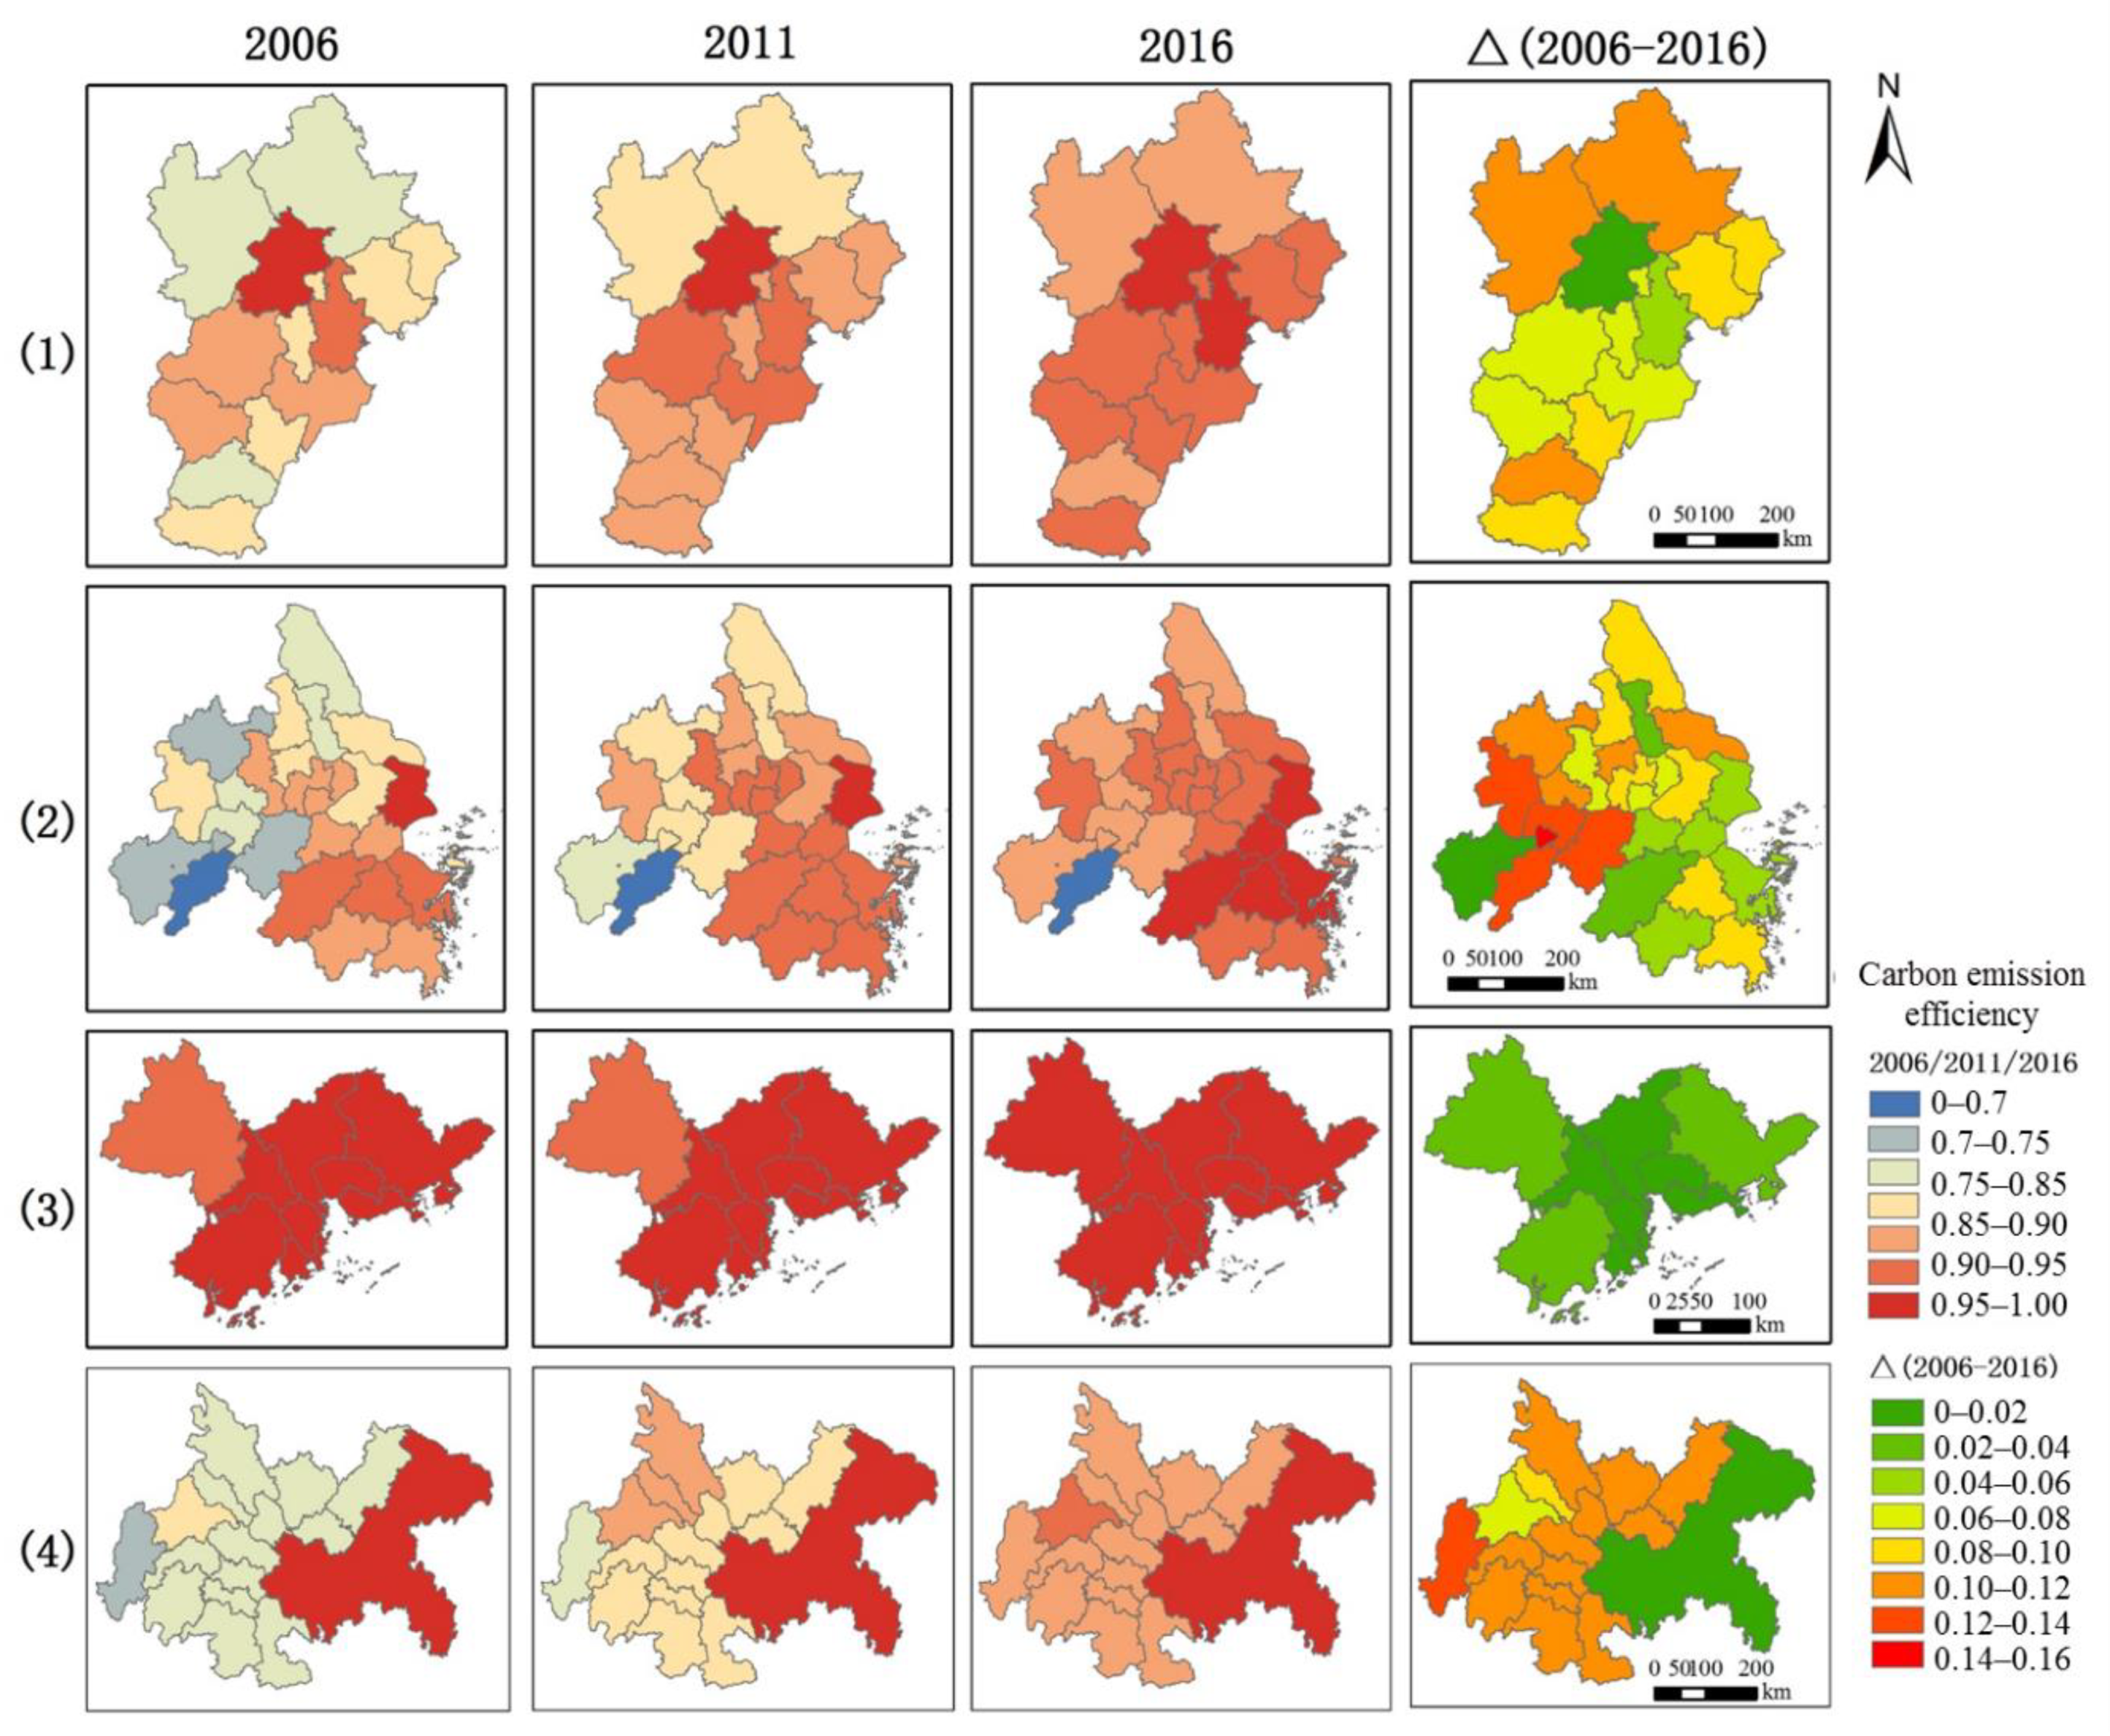
4.2. Spatiotemporal Evolution of Carbon Emission Efficiency

The four major urban agglomerations showed the same trend in carbon emission efficiency, but there were differences in the magnitude of the changes (Figure 5). In terms of the overall status of the urban agglomerations, from 2006 to 2016, the average annual increase in the carbon emission efficiency of the Pearl River Delta, Beijing-Tianjin-Hebei, Yangtze River Delta, and Chengdu-Chongqing urban agglomerations was 0.0985, 0.0921, 0.0917, and 0.0806, respectively. The carbon emission efficiency increased year by year. In 2016, the carbon emission efficiency of 12 cities in the Yangtze River Delta urban agglomeration including Luzhou, Ma’an, Xuancheng, Tongling, Chizhou and Anqing, and Zigong, Suining, Guang’an, Ziyang, Meishan and Ya’an in Chengdu-Chongqing urban agglomeration was still lower than the multi-year average of all cities (0.8847). The reasons may be that the levels of economic development, industrial structure, and technological equipment of the Pearl River Delta, Beijing-Tianjin-Hebei, and the Yangtze River Delta urban agglomerations are relatively high with strong low-carbon radiation effects, showing obvious diffusion effects. The Pearl River Delta urban agglomeration is at the forefront of reform and economic opening up, and there are many high-tech innovative enterprises. The Beijing-Tianjin-Hebei urban agglomeration is centered on Beijing, with abundant resource advantages and strong scientific and technological strength, thereby stimulating economic growth, improving energy efficiency and reducing carbon emissions. In addition, Hebei has concentrated on eliminating high-polluting and energy-consuming enterprises, with improved carbon emission efficiency. The Yangtze River Delta urban agglomeration has benefited from rising high-end manufacturing, and the number of high-tech enterprises has increased. The Chengdu-Chongqing urban agglomeration is mainly dominated by enterprises with high energy consumption and heavy pollution, and the government is promoting upgrades to the industrial structure.
This paper used data from 2006, 2011, and 2016 to represent the difference in carbon emission efficiency between various urban agglomerations (Figure 6). We compared the overall carbon emission efficiency status of urban agglomerations in the same period. For 2006, 2011, and 2016, the carbon emission efficiency of the four major urban agglomerations were ranked as follows: Pearl River Delta > Beijing-Tianjin-Hebei > Yangtze River Delta > Chengdu-Chongqing. The Beijing-Tianjin-Hebei urban agglomeration included Beijing and Tianjin as high-value centers for carbon emission efficiency and generally exhibited the characteristics of high carbon emission efficiency in the south and low carbon emission efficiency in the north. The carbon emission efficiency of Zhangjiakou, Chengde, and Xingtai increased by more than 0.10, and the carbon emission efficiency difference between Zhangjiakou, Chengde, and Xingtai and Beijing decreased from 0.1275, 0.1980 and 0.1911 in 2006 to 0.0638, 0.1012, and 0.0975 in 2016. The carbon emission efficiency of the Yangtze River Delta urban agglomeration presented characteristics of high carbon emission efficiency in the east and low carbon emission efficiency in the west. The cities with higher internal carbon emission efficiency were more dispersed, and the potential for increasing the carbon emission efficiency of western cities was higher than that of the east. The overall carbon emission efficiency was relatively high, and the internal gap was small. In 2016, the carbon emission efficiency of all nine cities exceeded 0.95, which was a small increase compared with 2006. Chongqing was the center with the highest carbon emission efficiency for Chengdu-Chongqing, and its carbon emission efficiency was significantly higher than other cities. Compared with other cities, the carbon emission efficiency of Ya’an had increased significantly. The main reason was that Hebei Province, in accordance with the Beijing-Tianjin-Hebei Regional Environmental Protection Initiative to Break Through the Cooperation Framework Agreement, adopted measures to reduce coal pressure, reduce loose coal, and control oil quality to promote carbon emission efficiency. However, resource allocation is not balanced in the Beijing-Tianjin-Hebei urban agglomeration region, industrial dependence among cities is low, and Beijing and Tianjin have an obvious industrial agglomeration effect, which can attract investors and entrepreneurs, and form clusters of high-tech and innovative industries, leading to significantly higher carbon emission efficiency than that of the surrounding cities. In terms of resource agglomeration, the municipalities can provide investors and entrepreneurs with a better platform to attract skilled workers to gather in Beijing and Tianjin, forming a siphon effect in the surrounding areas and concentrating the various resources from the surrounding cities in the central cities. The Yangtze River Delta urban agglomeration has developed light industry, with a reasonable industrial structure, equipped with high-end industries, and the central cities (Shanghai, Hangzhou, Nanjing) cooperate closely with surrounding cities. The resources, technology, and capital of the central cities spread outward, driving development in the surrounding cities. The economic development level and the overall carbon emission efficiency in the Pearl River Delta region are high due to decentralization; the economy is well developed, the economic structure is reasonable, the industry is high-end, with high level manufacturing services, and high carbon emission efficiency. The Chengdu-Chongqing urban agglomeration hosts many defense technology companies using steel, automobiles, coal power, chemical and other industries as their leading industries. Except for the automobile, motorcycle manufacturing, and some equipment manufacturing industries, other industries have developed independently in each city, and industrial scale efficiencies and clusters have not formed. As a result, inter-city industries are not sufficiently coordinated, and their relative carbon emission efficiency is low.

4.3. Characteristics of Influencing Factors

In the model regression results (Table 4), Prob > chi2 = 0.0000 indicates that there are no issues including multicollinearity, heteroscedasticity, and sequence correlation in the model regression results. Most variables had a significant impact on TCEI at a significance level of 1%. Among these, the proportion of the tertiary industry (×4) and proportion of total exports to GDP (×7) did not pass the significance test, but from a coefficient perspective, they had some influence on increasing TCEI. Per capita GDP (×1) was positively correlated with TCEI. The urbanization rate (×2), the proportion of secondary industry (×3), and the ecological index (×6) could increase TCEI. If each influencing factor is increased by one unit, it will increase TCEI by 100.76%, 6.95%, 5.83%, and 25.89%, and the proportion of GDP above the scale (×5) will have a negative impact on TCEI. If the influencing factors are increased by one unit, the TCEI is reduced by 0.05%.
The level of economic development is an important sign for regional economic development. GDP per capita is an important basis for measuring the economic quality in a region. The expansion of the economic scale in a region will provide a rich material basis for scientific and technological innovation, thereby promoting environmental technological progress, and ultimately leading to higher carbon emission efficiency. Urbanization is part of the economic structural changes that accompany economic development. It is also the result of the combined effects of economic, political, and technological factors in a region. For example, most modern companies that develop with urbanization have increasingly implemented carbon management practices under internal and external pressures [51,52]. Therefore, an increase in the urbanization rate can lead to an increase in carbon emission efficiency. Secondary industry is the leading industry for the Chinese economy, and its carbon emissions account for more than 80% of total emissions, especially for heavy industries represented by petroleum processing, coking, and nuclear fuel processing. Secondary industry is characterized by high energy consumption and high emissions. The implementation of energy savings and emission reduction is of great significance for promoting low-carbon development in the entire industry. The heavy industry structure above a designated size has a particularly evident negative impact on environmental pollution. Therefore, it is necessary to analyze the impact of heavy industry structure on carbon emissions. The ecological index can be used to characterize the advanced level of the industrial structure. The ecological evolution of the industrial structure can restrain increases in the energy consumption intensity and promote high-quality and high-level economic development. Thereby, it can improve carbon emission efficiency.

5. Conclusions and Implications

This paper mainly concerns the carbon emission efficiency of four typical urban agglomerations in China. By establishing an SFA model, this paper measured the TCEI of a total of 64 prefecture-level cities and rules behind its temporal and spatial evolution in the Beijing-Tianjin-Hebei, the Yangtze River Delta, the Pearl River Delta, and the Chengdu-Chongqing urban agglomerations from 2006 to 2016. Based on this, we constructed an index of factors influencing carbon emission efficiency, and further quantitatively analyzed the characteristics of the factors influencing the carbon emission efficiency in the four urban agglomerations through a Tobit regression model. The conclusions were as follows:
(1) The carbon emission efficiency measurement model established in this paper was effective and it can be used to measure production efficiency considering undesired output.
(2) During the period 2006–2016, the carbon emission efficiency of the Pearl River Delta, Beijing-Tianjin-Hebei, Yangtze River Delta, and Chengdu-Chongqing urban agglomerations increased year by year, but there is still room for improvement. The overall carbon emission efficiency of urban agglomerations is ranked as follows: Pearl River Delta > Beijing-Tianjin-Hebei > Yangtze River Delta > Chengdu-Chongqing.
(3) From the perspective of influencing factors, per capita GDP was positively correlated with carbon emission efficiency. The urbanization rate, the proportion of secondary industry, and the ecological index have a significant effect on increasing carbon emission efficiency, which means that all regions can focus on adjusting their industrial structure, improving the level of the ecological environment, increasing the efficiency of carbon emissions, and achieving green sustainable development of cities while developing the economy.
Based on the above conclusions, this paper proposes the following: while ensuring healthy economic growth, we should focus on promoting industrial ecology, accelerating industrial upgrades, gradually eliminating inefficient industries, optimizing industrial structures, breaking urban barriers, giving full play to the radiation-driven effects of central cities on surrounding cities, strengthening the interdependence between industries, and extending the industrial chain. The government should vigorously develop high-tech industries, promote technological exchanges and cooperation between cities, reduce the development gap between cities, and increase carbon emission efficiency.
Although this paper has developed a good model of the carbon emission efficiency of urban agglomerations, there were some limitations. First, due to the differences in the compilation specifications in terms of statistical yearbooks in various provinces (cities), there will be some errors in the energy consumption data used by the research institute. In addition, this paper only used the main energy sources for accounting: energy with small consumption and incomplete records in the statistical yearbook were not included in the accounting scope. Second, we need to further improve consideration of the indicator system for influencing factors. However, these limitations do not affect the validity of the results and conclusions in this paper. Our research provides an important reference for China, especially for Chinese urban agglomerations, to formulate carbon emission reduction policies.

Author Contributions

Conceptualization, F.Z. and G.J.; investigation, N.X., C.W. and J.L.; data curation and writing—review and editing, F.Z. and C.W.; supervision and proofreading, G.J and J.L. All authors have read and agreed to the published version of the manuscript.

Funding

This research was financially supported by the research funds from the state key program of National Natural Science Foundation of China (Grant No. 71533004), The National Key Research and Development Program of China (grant number 2016YFA0602502) and the National Social Science Foundation Project for Western China (16XJY004).

Conflicts of Interest

The authors declare no conflict of interests.

Appendix A

L n D i t = A + β k L n K i t + β l L n L i t + β e L n E i t + β o L n O i t + β u L n U i t + β k l L n K i t L n L i t + β k e L n K i t L n E i t + β k o L n K i t L n O i t + β k u L n K i t L n U i t + β l e L n L i t L n E i t + β l o L n L i t L n O i t + β l u L n L i t L n U i t + β e o L n E i t L n O i t + β e u L n E i t L n U i t + β o u L n O i t L n U i t + 1 2 β k k ( L n K i t ) 2 + 1 2 β l l ( L n L i t ) 2 + 1 2 β e e ( L n E i t ) 2 + 1 2 β o o ( L n O i t ) 2 + 1 2 β u u ( L n U i t ) 2 + v i t
In the formula, D i t represents the distance function of the industrial sector i in the t -th year.
D ( K i t ,   L i t ,   E i t ,   O i t + α p o ,   U i t α p u ) = D i t α
D i t U i t = D ( K i t ,   L i t ,   E i t ,   O i t + U i t ,   U i t U i t ) = D ( K i t ,   L i t ,   E i t ,   O i t + U i t ,   0 )
D ( L n K i t ,   L n L i t ,   L n E i t ,   L n O i t + L n U i t ,   0 ) = A + β k L n K i t + β l L n L i t + β e L n E i t + β o ( L n O i t + L n U i t ) + β k l L n K i t L n L i t + β k e L n K i t L n E i t + β k o L n K i t ( L n O i t + L n U i t ) + β l e L n L i t L n E i t + β l o L n L i t ( L n O i t + L n U i t ) + β e o L n E i t ( L n O i t + L n U i t ) + 1 2 β k k ( L n K i t ) 2 + 1 2 β l l ( L n L i t ) 2 + 1 2 β e e ( L n E i t ) 2 + 1 2 β o o ( L n O i t + L n U i t ) 2 + v i t

References

  1. Roland, G.; Tim, D.; Baklanov, A.; Gregory, R.; Tom, M. Megacities and large urban agglomerations in the coastal zone: Interactions between atmosphere, land, and marine ecosystems. AMBIO 2013, 42, 13–28. [Google Scholar]
  2. Tao, F.; Zhang, H.Q.; Hu, J.; Xia, X.H. Dynamics of green productivity growth for major Chinese urban agglomerations. Appl. Energy 2017, 196, 170–179. [Google Scholar] [CrossRef]
  3. Zhuang, M.; Baležentis, T.; Tian, Z.H.; Shao, S.H.; Geng, Y.; Wu, R. Environmental performance and regulation effect of china’s atmospheric pollutant emissions: Evidence from “Three regions and ten urban agglomerations”. Environ. Resour. Econ. 2019, 74, 211–242. [Google Scholar]
  4. Wang, C.; Engels, A.; Wang, Z.H. Overview of research on china’s transition to low-carbon development: The role of cities, technologies, industries and the energy system. Renew. Sust. Energy Rev. 2018, 81, 1350–1364. [Google Scholar] [CrossRef]
  5. Bai, Y.P.; Deng, X.Z.; Gibson, J.; Zhao, Z.; Xu, H. How does urbanization affect residential CO2 emissions? An analysis on urban agglomerations of China. J. Clean. Prod. 2019, 209, 876–885. [Google Scholar]
  6. Jin, G.; Chen, K.; Wang, P.; Guo, B.S.; Dong, Y.; Yang, J. Trade-offs in land-use competition and sustainable land development in the north China plain. Technol. Forecast. Soc. Change 2019, 141, 36–46. [Google Scholar] [CrossRef]
  7. Central Compilation & Translation Press. The 13th Five-Year Plan for Economic and Social Development of the People’s Republic of China. 2016. Available online: https://en.ndrc.gov.cn/newsrelease_8232/201612/P020191101481868235378.pdf. (accessed on 19 December 2019).
  8. GOV.CN. The Report of the 19th National Congress of the CPC, 18 October 2017. 2017. Available online: http://www.gov.cn/zhuanti/2017-10/27/content_5234876.htm. (accessed on 22 December 2019).
  9. Wang, S.; Wang, H.; Zhang, L.; Dang, J. Provincial carbon emissions efficiency and its influencing factors in China. Sustainability 2019, 11, 2355. [Google Scholar] [CrossRef] [Green Version]
  10. Jin, G.; Guo, B.S.; Deng, X.Z. Is there a decoupling relationship between CO2 emission reduction and poverty alleviation in China? Technol. Forecast. Soc. Change 2020, 151, 119856. [Google Scholar] [CrossRef]
  11. Zhu, Z.Q.; Liu, Y.; Tian, X.; Wang, Y.F.; Zhang, Y. CO2 emissions from the industrialization and urbanization processes in the manufacturing center Tianjin in China. J. Clean. Prod. 2017, 168, 867–875. [Google Scholar] [CrossRef]
  12. Liu, Q.; Lei, Q.; Xu, H.; Yuan, J. China’s energy revolution strategy into 2030. Resour. Conserv. Recycl. 2018, 128, 78–89. [Google Scholar] [CrossRef]
  13. Li, B.Z.; Yao, R.M. Urbanisation and its impact on building energy consumption and efficiency in China. Renew. Energy 2009, 34, 1994–1998. [Google Scholar] [CrossRef]
  14. Lin, B.Q.; Ouyang, X.L. Energy demand in China: Comparison of characteristics between the US and China in rapid urbanization stage. Energy Convers. Manag. 2014, 79, 128–139. [Google Scholar] [CrossRef]
  15. Wang, Q.; Wu, S.D.; Zeng, Y.E.; Wu, B.W. Exploring the relationship between urbanization, energy consumption, and CO2 emissions in different provinces of China. Renew. Sustain. Energy Rev. 2016, 54, 1563–1579. [Google Scholar] [CrossRef]
  16. GOV.CN. China Submitted Intended Nationally Determined Contributions File to UNFCCC, 30 June 2015. 2015. Available online: http://www.gov.cn/xinwen/2015-06/30/content_2887337.htm. (accessed on 22 December 2019).
  17. Dong, F.; Long, R.; Li, Z.; Dai, Y. Analysis of carbon emission intensity, urbanization and energy mix: Evidence from China. Nat. Hazards 2016, 82, 1375–1391. [Google Scholar] [CrossRef]
  18. Chen, L.; Xu, L.; Yang, Z. Accounting carbon emission changes under regional industrial transfer in an urban agglomeration in China’s pearl river delta. J. Clean. Produc. 2017, 167, 110–119. [Google Scholar] [CrossRef]
  19. Wang, S.; Fang, C.; Sun, L.; Su, Y.; Chen, X.; Zhou, C.; Feng, K.; Hubacek, K. Decarbonizing china’s urban agglomerations. Ann. Am. Assoc. Geogr. 2019, 109, 266–285. [Google Scholar] [CrossRef]
  20. Kaya, Y.; Yokobori, K. Environment, Energy and Economy: Strategies for Sustainability; Brookings Institution: Washington, DC, USA, 1998; Volume 3, pp. 15–20. [Google Scholar]
  21. Mielnik, O.; Goldemberg, J. Communication the evolution of the “carbonization index” in developing countries. Energy Policy 1999, 27, 307–308. [Google Scholar] [CrossRef]
  22. Sun, J.W. The decrease of CO2 emission intensity is decarbonization at national and global levels. Energy Policy 2005, 33, 975–978. [Google Scholar] [CrossRef]
  23. Ramanathan, R. A multi-factor efficiency perspective to the relationships among world GDP, energy consumption and carbon dioxide emissions. Technol. Forecast. Soc. Change 2006, 73, 483–494. [Google Scholar] [CrossRef]
  24. Ramanathan, R. Combining indicators of energy consumption and CO2 emissions: A cross-country comparison. Int. J. Global Energ. Issues 2002, 17, 214–227. [Google Scholar] [CrossRef]
  25. Ramanathan, R. An analysis of energy consumption and carbon dioxide emissions in countries of the middle east and north Africa. Energy 2005, 30, 2831–2842. [Google Scholar] [CrossRef]
  26. Zhou, P.; Ang, B.W.; Poh, K.L. Slacks-based efficiency measures for modeling environmental performance. Ecol. Econ. 2006, 60, 111–118. [Google Scholar] [CrossRef]
  27. Zhou, P.; Ang, B.W.; Poh, K.L. A survey of data envelopment analysis in energy and environmental studies. Eur. J. Oper. Res. 2008, 189, 1–18. [Google Scholar] [CrossRef]
  28. Zhou, P.; Ang, B.W.; Han, J.Y. Total factor carbon emission performance: A Malmquist index analysis. Energy Econ. 2010, 32, 194–201. [Google Scholar] [CrossRef]
  29. Reinhard, S.; Lovell, C.A.K.; Thijssen, G.J. Environmental efficiency with multiple environmentally detrimental variables: Estimated with SFA and DEA. Eur. J. Oper. Res. 2000, 121, 287–303. [Google Scholar] [CrossRef]
  30. Dong, F.; Li, X.; Long, R.; Liu, X. Regional carbon emission performance in China according to a stochastic frontier model. Renew. Sustain. Energy Rev. 2013, 28, 525–530. [Google Scholar] [CrossRef]
  31. Guo, X.D.; Zhu, L.; Fan, Y.; Xie, B.C. Evaluation of potential reductions in carbon emissions in Chinese provinces based on environmental DEA. Energy Policy 2011, 39, 2352–2360. [Google Scholar] [CrossRef]
  32. Zhang, Y.J.; Da, Y.B. The decomposition of energy-related carbon emission and its decoupling with economic growth in China. Renew. Sustain. Energy Rev. 2015, 41, 1255–1266. [Google Scholar] [CrossRef]
  33. Ma, H.Z.; Bai, Y.P.; Che, L. Spatio-Temporal Pattern Changes of Chinese Provincial Carbon Dioxide Emission Efficiency. Destech Transactions on Economics, Business and Management, 2017 (icem). Available online: http://www.dpi-proceedings.com/index.php/dtem/article/view/13212/12735 (accessed on 26 December 2019).
  34. Yan, D.; Lei, Y.; Li, L.; Song, W. Carbon emission efficiency and spatial clustering analyses in China’s thermal power industry: Evidence from the provincial level. J. Clean. Prod. 2017, 156, 518–527. [Google Scholar] [CrossRef]
  35. Cheng, Z.; Li, L.; Liu, J.; Zhang, H. Total-factor carbon emission efficiency of china’s provincial industrial sector and its dynamic evolution. Renew. Sustain. Energy Rev. 2018, 94, 330–339. [Google Scholar] [CrossRef]
  36. Wang, B.; Sun, Y.; Wang, Z. Agglomeration effect of CO2 emissions and emissions reduction effect of technology: A spatial econometric perspective based on China’s province-level data. J. Clean. Prod. 2018, 204, 96–106. [Google Scholar] [CrossRef]
  37. Wang, C. Decomposing energy productivity change: A distance function approach. Energy 2007, 32, 1326–1333. [Google Scholar] [CrossRef]
  38. Rahman, M.M.; Kashem, M.A. Carbon emissions, energy consumption and industrial growth in Bangladesh: Empirical evidence from ARDL cointegration and granger causality analysis. Energy Policy 2017, 110, 600–608. [Google Scholar] [CrossRef]
  39. Zhang, Y.J.; Liu, Z.; Zhang, H.; Tan, T.D. The impact of economic growth, industrial structure and urbanization on carbon emission intensity in China. Natural Hazards 2014, 73, 579–595. [Google Scholar] [CrossRef]
  40. Cheng, Y.Q.; Wang, Z.Y.; Zhang, S.Z.; Ye, X.Y.; Jiang, H.M. Spatial econometric analysis of carbon emission intensity and its driving factors from energy consumption in China. Acta Geogr. Sin. 2013, 68, 418–1431. [Google Scholar]
  41. Xing, X.; Gu, W.; Liu, X. Apparel color preferences for different regions in China: The connection to personal values. Color Res. Appl. 2018, 43, 423–435. [Google Scholar] [CrossRef]
  42. Jin, B. Seeking balance: Resource conservation, environmental protection and industrial development. In China’s Path of Industrialization; Springer: Singapore, 2020; pp. 131–158. [Google Scholar]
  43. Kumbhakar, S.C.; Denny, M.; Fuss, M. Estimation and decomposition of productivity change when production is not efficient: A paneldata approach. Econom. Rev. 2000, 19, 312–320. [Google Scholar]
  44. Lin, B.Q.; Wang, X.L. Exploring energy efficiency in China’s iron and steel industry: A stochastic frontier approach. Energy Policy 2014, 72, 87–96. [Google Scholar] [CrossRef]
  45. Debreu, G. ‘The coefficient of resource utilization’. Econometrica 1951, 19, 273–292. [Google Scholar] [CrossRef]
  46. Farrell, M. ‘The measurement of productive efficiency’. J. R. Stat. Soc. 1957, 3, 253–290. [Google Scholar] [CrossRef]
  47. Bai, Y.P.; Deng, X.Z.; Zhang, Q.; Wang, Z. Measuring environmental performance of industrial sub–sectors in China: A stochastic metafrontier approach. Phys. Chem. Earth Part A/B/C 2017, 101, 3–12. [Google Scholar] [CrossRef]
  48. Bai, Y.P.; Deng, X.Z.; Jiang, S.; Zhang, Q.; Wang, Z. Exploring the relationship between urbanization and urban eco–efficiency: Evidence from prefecture–level cities in China. J. Clean. Prod 2018, 195, 1487–1496. [Google Scholar] [CrossRef]
  49. Färe, R.; Grosskopf, S.; Lovell, C.A.K.; Pasurka, C. Multilateral productivity comparisons when some outputs are undesirable: A nonparametric approach. Rev. Econ. Stat. 1989, 71, 90–98. [Google Scholar] [CrossRef]
  50. Färe, R.; Grosskopf, S.; Noh, D.W.; Weber, W. Characteristics of a polluting technology: Theory and practice. J. Econ. 2005, 126, 469–492. [Google Scholar] [CrossRef]
  51. Herold, D.M.; Lee, K.H. The influence of internal and external pressures on carbon management practices and disclosure strategies. Australas. J. Environ. Manag. 2018, 26, 63–81. [Google Scholar] [CrossRef]
  52. Herold, D.M.; Farr-Wharton, B.; Lee, K.H.; Groschopf, W. The interaction between institutional and stakeholder pressures: Advancing a framework for categorising carbon disclosure strategies. Bus. Strategy Environ. 2018, 2, 1–14. [Google Scholar] [CrossRef]
Figure 1. Economic development of the four major urban agglomerations. Note: (1) the Beijing-Tianjin-Hebei (BTH), (2) the Yangtze River Delta (YRD), (3) the Pearl River Delta (PRD), and (4) the Chengdu-Chongqing (CY) urban agglomerations.
Sustainability 12 02675 g001
Figure 2. Trends in economic growth and the proportion of tertiary industries in the four major urban agglomerations from 2006 to 2016.
Sustainability 12 02675 g002
Figure 3. Total carbon emissions and per capita carbon emissions in urban agglomerations from 2010 to 2016.
Sustainability 12 02675 g003
Figure 4. Carbon intensity of the four major urban agglomerations from 2006 to 2016.
Sustainability 12 02675 g004
Figure 5. Changes in the carbon emission efficiency of four major urban agglomerations over time.
Sustainability 12 02675 g005
Figure 6. Spatial changes in carbon emission efficiency of the four urban agglomerations. Note: (1) the Beijing-Tianjin-Hebei, (2) the Yangtze River Delta, (3) the Pearl River Delta, and (4) the Chengdu-Chongqing urban agglomerations.
Sustainability 12 02675 g006
Table 1. The scope of the four major urban agglomerations in China.
Urban AgglomerationNumber of Prefecture-Level CitiesPrefecture-Level CitiesReference
Beijing-Tianjin-Hebei (BTH)13Beijing; Tianjin; Baoding, Tangshan, Langfang, Shijiazhuang, Handan, Qinhuangdao, Zhangjiakou, Chengde, Cangzhou, Xingtai, and Hengshui2015 Outline of Beijing-Tianjin-Hebei Coordinated Development Plan
Yangtze River Delta (YRD)26Shanghai; Nanjing, Wuxi, Changzhou, Suzhou, Nantong, Yancheng, Yangzhou, Zhenjiang, Taizhou, Jiangsu Province; Hangzhou, Ningbo, Jiaxing, Huzhou, Shaoxing, Zhejiang, Jinhua, Zhoushan, Taizhou; Hefei, Wuhu, Ma’anshan, Tongling, Anqing, Luzhou, Chizhou, and Xuancheng2016 Yangtze River Delta Urban Agglomeration Development Plan
Pearl River Delta (PRD)9Guangzhou, Shenzhen, Foshan, Zhongshan, Huizhou, Dongguan, Zhuhai, Jiangmen, and Zhaoqing of Guangdong Province2008 Outline of the Reform and Development Plan of the Pearl River Delta Region
Chengyu (CY)16Chongqing; Chengdu, Zigong, Luzhou, Deyang, Mianyang, Suining, Neijiang, Leshan, Nanchong, Meishan, Yibin, Guang’an, Ya’an, Ziyang, and Dazhou2016 Chengdu-Chongqing Urban Agglomeration Development Plan
Table 2. Statistics of the basic variables and influencing factors in the four urban agglomerations.
Variable NameDescriptionUnitSample SizeAverageVarianceMinMax
CCO2Energy carbon emissions10,000 tons7045.37 × 1035.25 × 1033.75 × 1022.66 × 104
YGDPGDP100 million yuan7043.13 × 1034.23 × 1031.30 × 1022.81 × 104
PCapital Investment in fixed assets100 million yuan7041.37 × 1061.24 × 10769.81.74 × 108
LLabor forceEmployed populationTen thousand people7043.05 × 1023.13 × 1028.411.72 × 103
EEnergy Total energy consumption10,000 tons of standard coal7042.20 × 1032.21 × 1031.57 × 1021.17 × 104
x1Economic levelGDP per capita1.02 million yuan/person7044.35 × 10−22.87 × 10−24.21 × 10−31.64 × 10−1
x2Urbanization rateProportion of urban population%7045.27 × 10−11.92 × 10−11.78 × 10−11.00
x3Industrial structureProportion of GDP in the secondary and tertiary industries%7049.03 × 10−17.48 × 10−26.80 × 10−11.00
x4Industrial agglomerationGross output value of industrial enterprises above designated size106 million yuan7045.54 × 10−16.47 × 10−17.01 × 10−33.24
x5Ecological levelMunicipal wastewater treatment rate%70466.723.56.4199.8
x6External dependenceThe proportion of total exports and total GDP%7043.92 × 10−24.86 × 10−22.48 × 10−62.67 × 10−1
x7External dependenceActual amount of foreign capital used in the year$10 million7041.78 × 10−13.10 × 10−14.57 × 10−43.08
Table 3. Parameter estimation results of stochastic frontier analysis model.
CoefficientVariableCoef. ValueStd. Err.zP > |z|
β0_cons0.3913 **0.17942.180.029
βklnK−0.01040.0264−0.390.694
βllnL−0.0584 **0.0245−2.380.017
βelnE−1.0397 ***0.0775−13.410.000
βylnY−0.0891 **0.0491−1.810.070
βclnC0.9109 **---
βkllnK*lnL−0.0116 ***0.0035−3.330.001
βkelnK*lnE−0.00930.0110−0.840.399
βkylnK*lnY0.0094 **0.00402.330.020
βkclnK*lnC0.0094 **---
βlelnL*lnE−0.0587 ***0.0093−6.310.000
βlylnL*lnY0.0342 ***0.00625.480.000
βlclnL*lnC0.0342 ***---
βeylnE*lnY0.00770.02720.280.776
βeclnE*lnC0.0077---
βyclnY*lnC0.0258---
1/2βkk1/2lnK*lnK−0.00900.0067−1.350.177
1/2βll1/2lnL*lnL−0.00060.0008−0.710.478
1/2βee1/2lnE*lnE0.0058 **0.00242.420.016
1/2βyy1/2lnY*lnY0.02580.02680.960.335
1/3βcc1/2lnC*lnC0.0258---
Number of obs = 704Wald chi2(14) = 73875.77
Log likelihood = 1652.568Prob > chi2 = 0.000
Note: * significant at 10%; ** significant at 5%; *** significant at 1%.
Table 4. Result of carbon emission efficiency influencing factors.
VariablesCoef.Std. Err.tP-value[95% Conf. Interval]
x11.0376 *** 0.0840 12.3500 0.0000 0.8726 1.2026
x20.0695 *** 0.0155 4.4800 0.0000 0.0390 0.1000
x30.0583 * 0.0345 1.6900 0.0910 −0.0094 0.1260
x40.0053 0.0056 0.9400 0.3470 −0.0057 0.0163
x5−0.0005 *** 0.0001 −5.3600 0.0000 −0.0006 −0.0003
x60.2589 *** 0.0428 6.0500 0.0000 0.1749 0.3429
x70.0073 0.0098 0.7400 0.4600 −0.0120 0.0265
_cons0.7668 *** 0.0284 27.0400 0.0000 0.7112 0.8225
/sigma0.04138150.0011027
Log likelihood = 122.0705
Pro > chi2 = 0.0000
LR chi2(7) = 77.56
Pseudo R2 = −0.4656
Note: * significant at 10%; ** significant at 5%; *** significant at 1%.

