1. Introduction
The role of values, broadly conceived, in climate-related decision-making is now a prominent theme of climate communication research, e.g., [
1,
2,
3,
4]. In particular, there is a growing literature on the way cultural values promote polarized views on climate change, e.g., [
5,
6,
7] and the way affect (e.g., [
8]), values, and worldviews throw light on attitudinal polarization and differences in risk perception between scientists and non-scientists, e.g., [
9,
10]. Recent theorizing has highlighted two kinds of thinking, slow and fast [
11] but cf. e.g., [
12]. Slow thinking is roughly modeled by theories developed to best solve problems and make decisions; fast thinking is more context-dependent, intuitive or automatic—a mental shortcut in relation to slow thinking. Affect heuristics, reliance on feelings such as the “goodness” or “badness” of an object [
8], is a typical example of the latter.
It might be expected that, in their “fast” thinking, forest professionals will be driven by values more than scientists are. Scientists, it might be supposed, rely on slow thinking. They are also less likely to be influenced by values and affect: processes such as deliberation, experimentation, and peer-review help to ensure that this is so, e.g., [
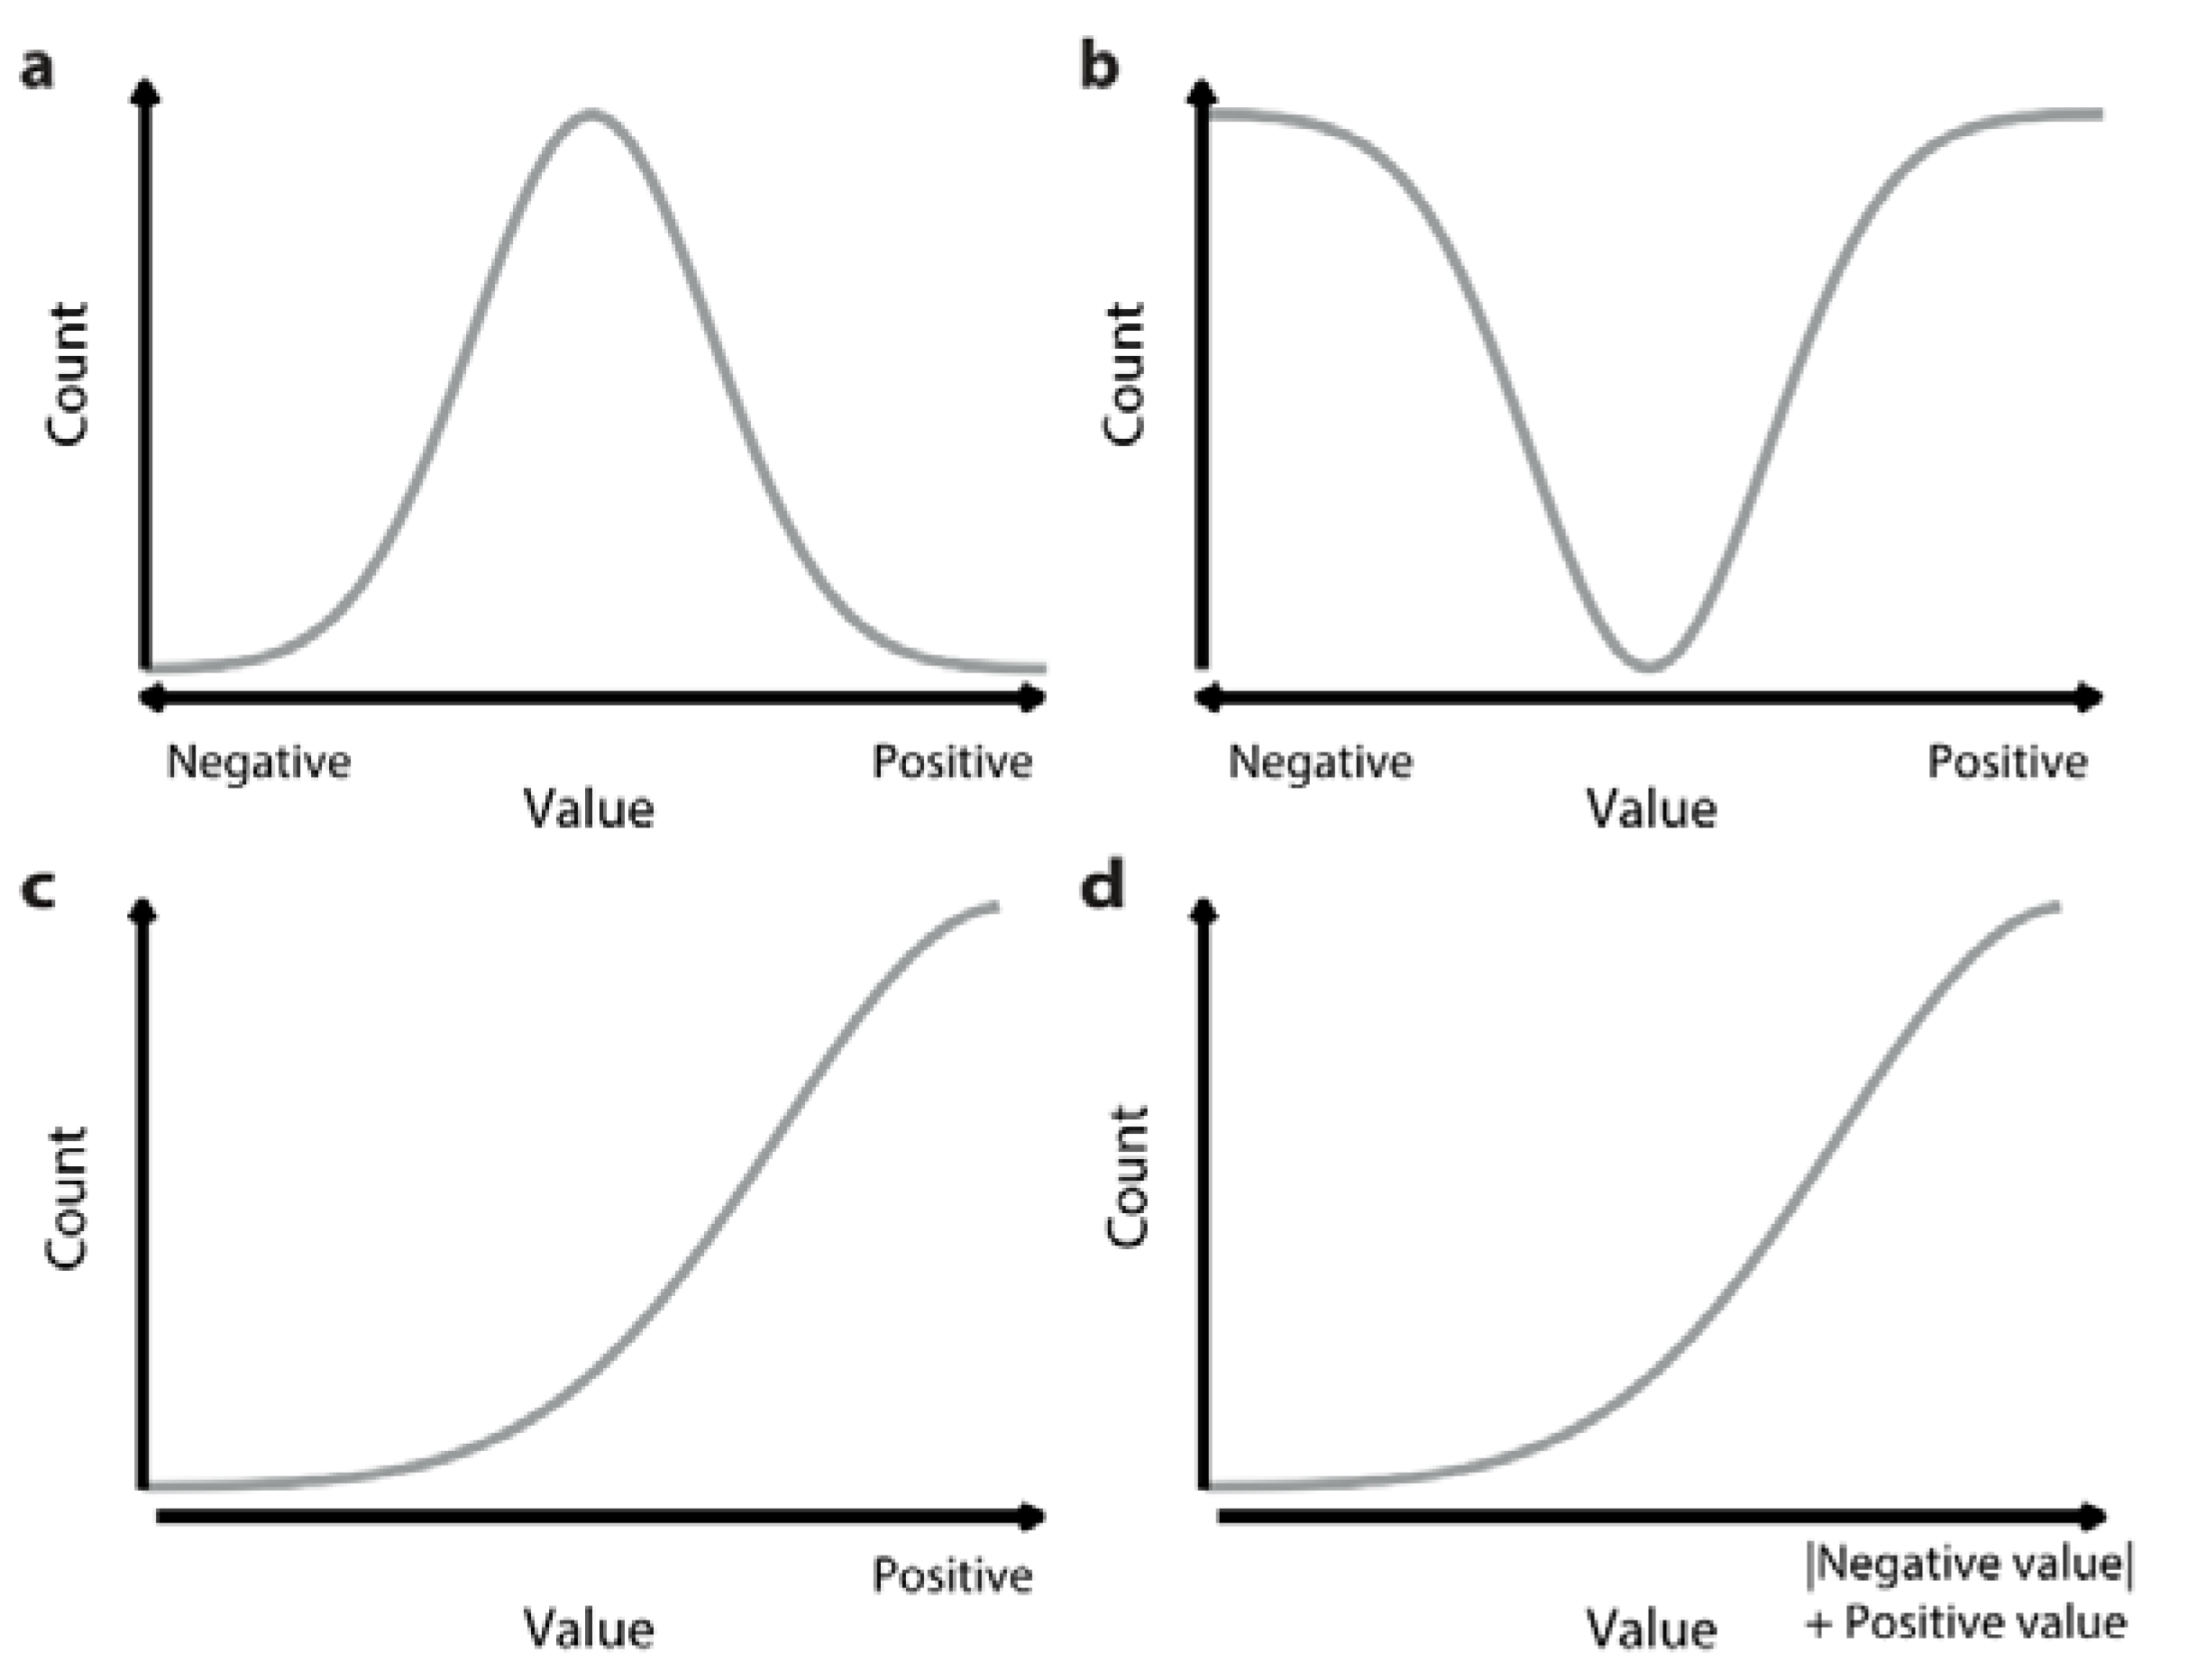
10]. If this is true, and no other salient and underlying psychological mechanisms are in play, we might expect groups of forest professionals to exhibit homogeneity of expected values at the individual level and polarization at the population level (
Figure 1, top right), while no such effects would be visible among scientists (
Figure 1, top left). By “homogeneity of expected values” (or “value homogeneity” for short) we mean the degree to which an individual’s aggregated valuations of the different effects of a certain object, process, or event—in this case the effects of climate change on forests and forest-related activities—are either positive or negative (
Figure 1).
The value homogeneous person will have similar value expectations about several effects of climate change. Thus, for example, if he or she expects climate change always to have negative effects on X, he or she will also expect it to have negative effects on Y. A person with inhomogeneous values will not conform to this pattern. However, such an individual might still display considerable strength of expected values. For example, his or her valuations might be that X is always positive and Y is always negative. A polarized population contains individuals with homogeneous expectations of both kinds (positive and negative), whereas a population with inhomogeneous individuals does not.
Homogeneity of expected values and polarization are interesting in their own rights. However, knowing the extent of homogeneity of expected values and polarization is useful for practical purposes, as it tells us something about what kinds of communication are needed to support mitigation and adaptation decisions. The value inhomogeneous individual might be uncertain about the specific effects of a certain option (and their value) and need context-sensitive communication as a decision aid. Normatively speaking, it should be rational
a priori to expect both positive and negative effects of climate change (such as CO
2 fertilization of forests and increased forest damage by disturbance events, e.g., [
13]). The degree of strength of expected values (VS) one displays in such a case might depend both on one’s strength of belief in specific effects and their value (and how certain one is about what those will be). Since it is to be expected that experiences of climate change-related effects will differ across a continent such as Europe [
14], we should also expect to find variation between countries on the negative–positive value scale.
However, it would be rational to attribute homogeneously negative value to climate change effects if one has warranted expectations that the world, or relevant individual elements of it, have passed a climatic tipping point [
15] into another climate system with uniformly worse consequences than the present one. If it is true that relevant climate effects are always of one and the same kind, then expectations of positive effects will rationally affect one’s expectations of negative effects—if one strongly expects A, one cannot also strongly expect not-A. Hence, in addition to affect-driven reasoning, homogeneity of expected values indicates the presence of tipping point thinking.
To test for homogeneity of expected values, polarization, and the influence of affect in forest professionals’ and scientists’ perceptions of climate change and adaptation measures, the following tests were formulated:
Operational homogeneity of expected values test 1: If a population consists of mainly value homogeneous individuals, the homogeneity of expected values of at least 50% of the individuals of the population will fall outside of ±25% of the midpoint of the homogeneity of expected values range.
Homogeneity of expected values test 2: If forest professionals are more value homogeneous than scientists in relation to climate change impacts on forests, they will display a higher homogeneity in their valuations of a range of expected effects of climate change on forests and forest-related activities.
Operational polarization test 1: If a population is polarized, the homogeneity of expected values of at least 25% of the population will fall below the midpoint-25% of the homogeneity of expected values range and at least 25% of the population will fall above the midpoint +25% of the homogeneity of expected values range.
Polarization test 2: If the population of forest professionals is more polarized than the population of scientists in relation to climate change impacts on forests, the population of forest professionals will consist of more individuals with homogeneous expectations of both kinds (positive and negative) than the population of scientists.
Affect test 1: A person driven by the affect heuristic in relation to climate change impacts on forests will homogeneously value (either positively or negatively) a range of expected effects of climate change on forests and forest-related activities.
Affect test 2: If forest professionals are more driven by the affect heuristic than scientists are in relation to climate change impacts on forests, they will display a higher homogeneity in their valuations of a range of expected effects of climate change on forests and forest-related activities.
2. Materials and Methods
For the purposes of the present study, we designed a questionnaire to elicit and assess the values assigned to expected effects of climate change by forest professionals and scientists working on forests and climate change in Europe. Approximately 10,000 forest professionals (including forest advisors, forest planners, forest managers, forest directors, policymakers, and forest technicians) were invited to participate in the survey by representatives of 10 European countries participating in the COST Action FP 1304 network “Towards robust PROjections of European FOrests UNDer climate change” (PROFOUND) (
Table S1). All 172 participants, mainly scientists, in the same COST Action were invited to respond to the survey as well.
The countries involved covered a north-to-south and west-to-east gradient across Europe, representing a wide range of bio-climatic conditions and a mix of economic–social–political structures. The invitees belonged to organizations that had been selected to represent a wide range of forest organizations in each country. Counting only forest professionals working neither as scientists nor at universities, 746 responses were collected. A further 67 responses were collected from PROFOUND scientists.
The questionnaire was formulated in English and translated into the native languages of the professional respondents in each country. This was to make forest professionals comfortable responding to the survey, even if they would not feel proficient enough in the English language to respond to a questionnaire in English. The scientists were presented with a questionnaire in English which was the working language of the PROFOUND COST Action in which they all participated. As computers and the internet are widely used in the European forest industry today, the invitations were distributed by e-mail and were accompanied by a covering letter explaining the objectives of the study and the purpose for which the data collected would be used (
Supplementary Materials). The questionnaire was implemented in the open source LimeSurvey tool Version 2.05+, 2015, [
16] and the survey was open from April 22 to August 16 in 2016. Respondents returned the questionnaires voluntarily.
The survey included 32 questions in total relating to climate change and forests, forest projection models, and socio-demography (
Supplementary Materials). Responses to four of the 32 questions were used in this study. These concerned whether climate change in the respondent’s country would lead to increasingly positive or negative effects from sudden or gradual events in relation to 11 climate-relevant objects, respectively (Questions A–D in
Table S2), i.e., sustained timber production, sustained pulpwood production, sustained biomass production for energy use, production of non-timber products such as mushrooms and berries, hunting, biodiversity, provision of outdoor recreation opportunities such as forest walks, storage of carbon, ecosystem services such as avalanche protection and clean water, economic gain, and rural livelihood development. Only responses provided by the 674 forest professionals and 63 scientists who had responded to all questions in
Table S2 were used in the present study. The frequency of “Yes, always” or “Often” responses to the 11 objects of each of the 4 questions relating to negative or positive effects of sudden or gradual climate change was used to determine whether the respondents had value homogeneous views on climate change effects (Questions A–D in
Table S2). The following homogeneity of expected values (VH) measure was constructed:
where N is the number of times a certain response was given to questions A–D, and a = 4 if the response is “Yes, always” or = 3 if it is “Often”. In this way, negative scores were assigned to negative expected values and positive scores were assigned to positive expected values. Any response to questions A-D other than “Yes, always” or “Often” yielded a = 0. The values used to convert valuations expressed in words to numbers were chosen to reflect the number of alternative answers to each question (
Table S2). The VH is thus a measure of how strongly sudden and gradual climate changes are expected to have determinately negative or positive effects on all 11 objects per respondent (N can thus be maximally 11). The VH can range from −88 to +88. An individual with a homogeneous set of values will expect that sudden or gradual climate changes always or often lead to either a negative (VH < <0) or a positive (VH > >0) effect on the objects. A person with inhomogeneous values, on the other hand, will expect that the effects are sometimes determinately negative and sometimes determinately positive (responding “Yes, always” or “Often” to questions about both positive and negative effects), or neither determinately negative nor determinately positive (VH = 0) (responding “Rarely”, “No, never” or “Do not know”). This might be the case for climate change effects on the same object as well. For instance, increasing growth and timber production might be expected because of a warmer climate at the same time as one is expecting increasing disturbance from storms or insects causing a reduction in timber production. An individual believing in these positive and negative effects may end up with an inhomogenous set of values (VH = 0) with respect to timber production. A polarized population will consist of several individuals who, as a group, display homogeneous expectations of both kinds (positive and negative), whereas a population without polarization will consist of individuals with inhomogeneous values and will not contain a substantial number of individuals with VH < <0 or VH > >0 (
Figure 1).
Additionally, to measure the strength of the respondents’ valuations, a corresponding strength of expected values (VS) measure was constructed:
where N is the number of times a certain response was given to questions A-D, and a = 4 if the response is “Yes, always” or = 3 if it is “Often”. Any response to questions A-D other than “Yes, always” or “Often” yields a = 0. VS can range from 0 to + 176. The values used to convert valuations expressed in words to numbers were chosen to reflect the number of alternative answers to each question (
Table S2). VS is of particular interest if we wish to distinguish among two kinds of scenarios that qualify as value inhomogeneous (VH = 0), i.e., it separates cases where individuals expect weak effects (either positive or negative, and perhaps uncertainly so) from cases where individuals expect strong effects of which some are positive and others negative. For instance, an individual believing in the positive effects of increasing growth and timber production and the negative effects of increasing disturbance of storms or insects causing a reduction in timber production may have an inhomogenous set of values (VH = 0) but these values can have considerable strength (VS > 0). Finally, the following implications should hold: if VS = |VH| and VH < 0, all determinate effects are negative.
If VS = VH, all determinate effects are positive (
Figure 1, lower left). The larger the difference between VS and |VH| in a population, when VS > |VH|, the more polarized the population (
Figure 1, upper right). To comply with the nominal nature of response variables, the χ2 test was used to test for differences between groups of respondents. All tests were two-tailed and were carried out at α = 0.05 except the power analyses of the homogeneity of expected values tests that were either one-sided or two-sided. All analyses were conducted using the R Project for Statistical Computing v3.3.1 [
17], the graphics and non-parametric bootstrap used to determine the confidence limits of mean counts were realized by the ggplot2 package [
18], and the power analysis was realized by the pwr package [
19].
Due to The General Data Protection Regulation (GDPR) of the European Union on the protection of individuals with regard to the processing of personal data and the free movement of such data, the data cannot be made publicly available other than in an aggregated form.
3. Results
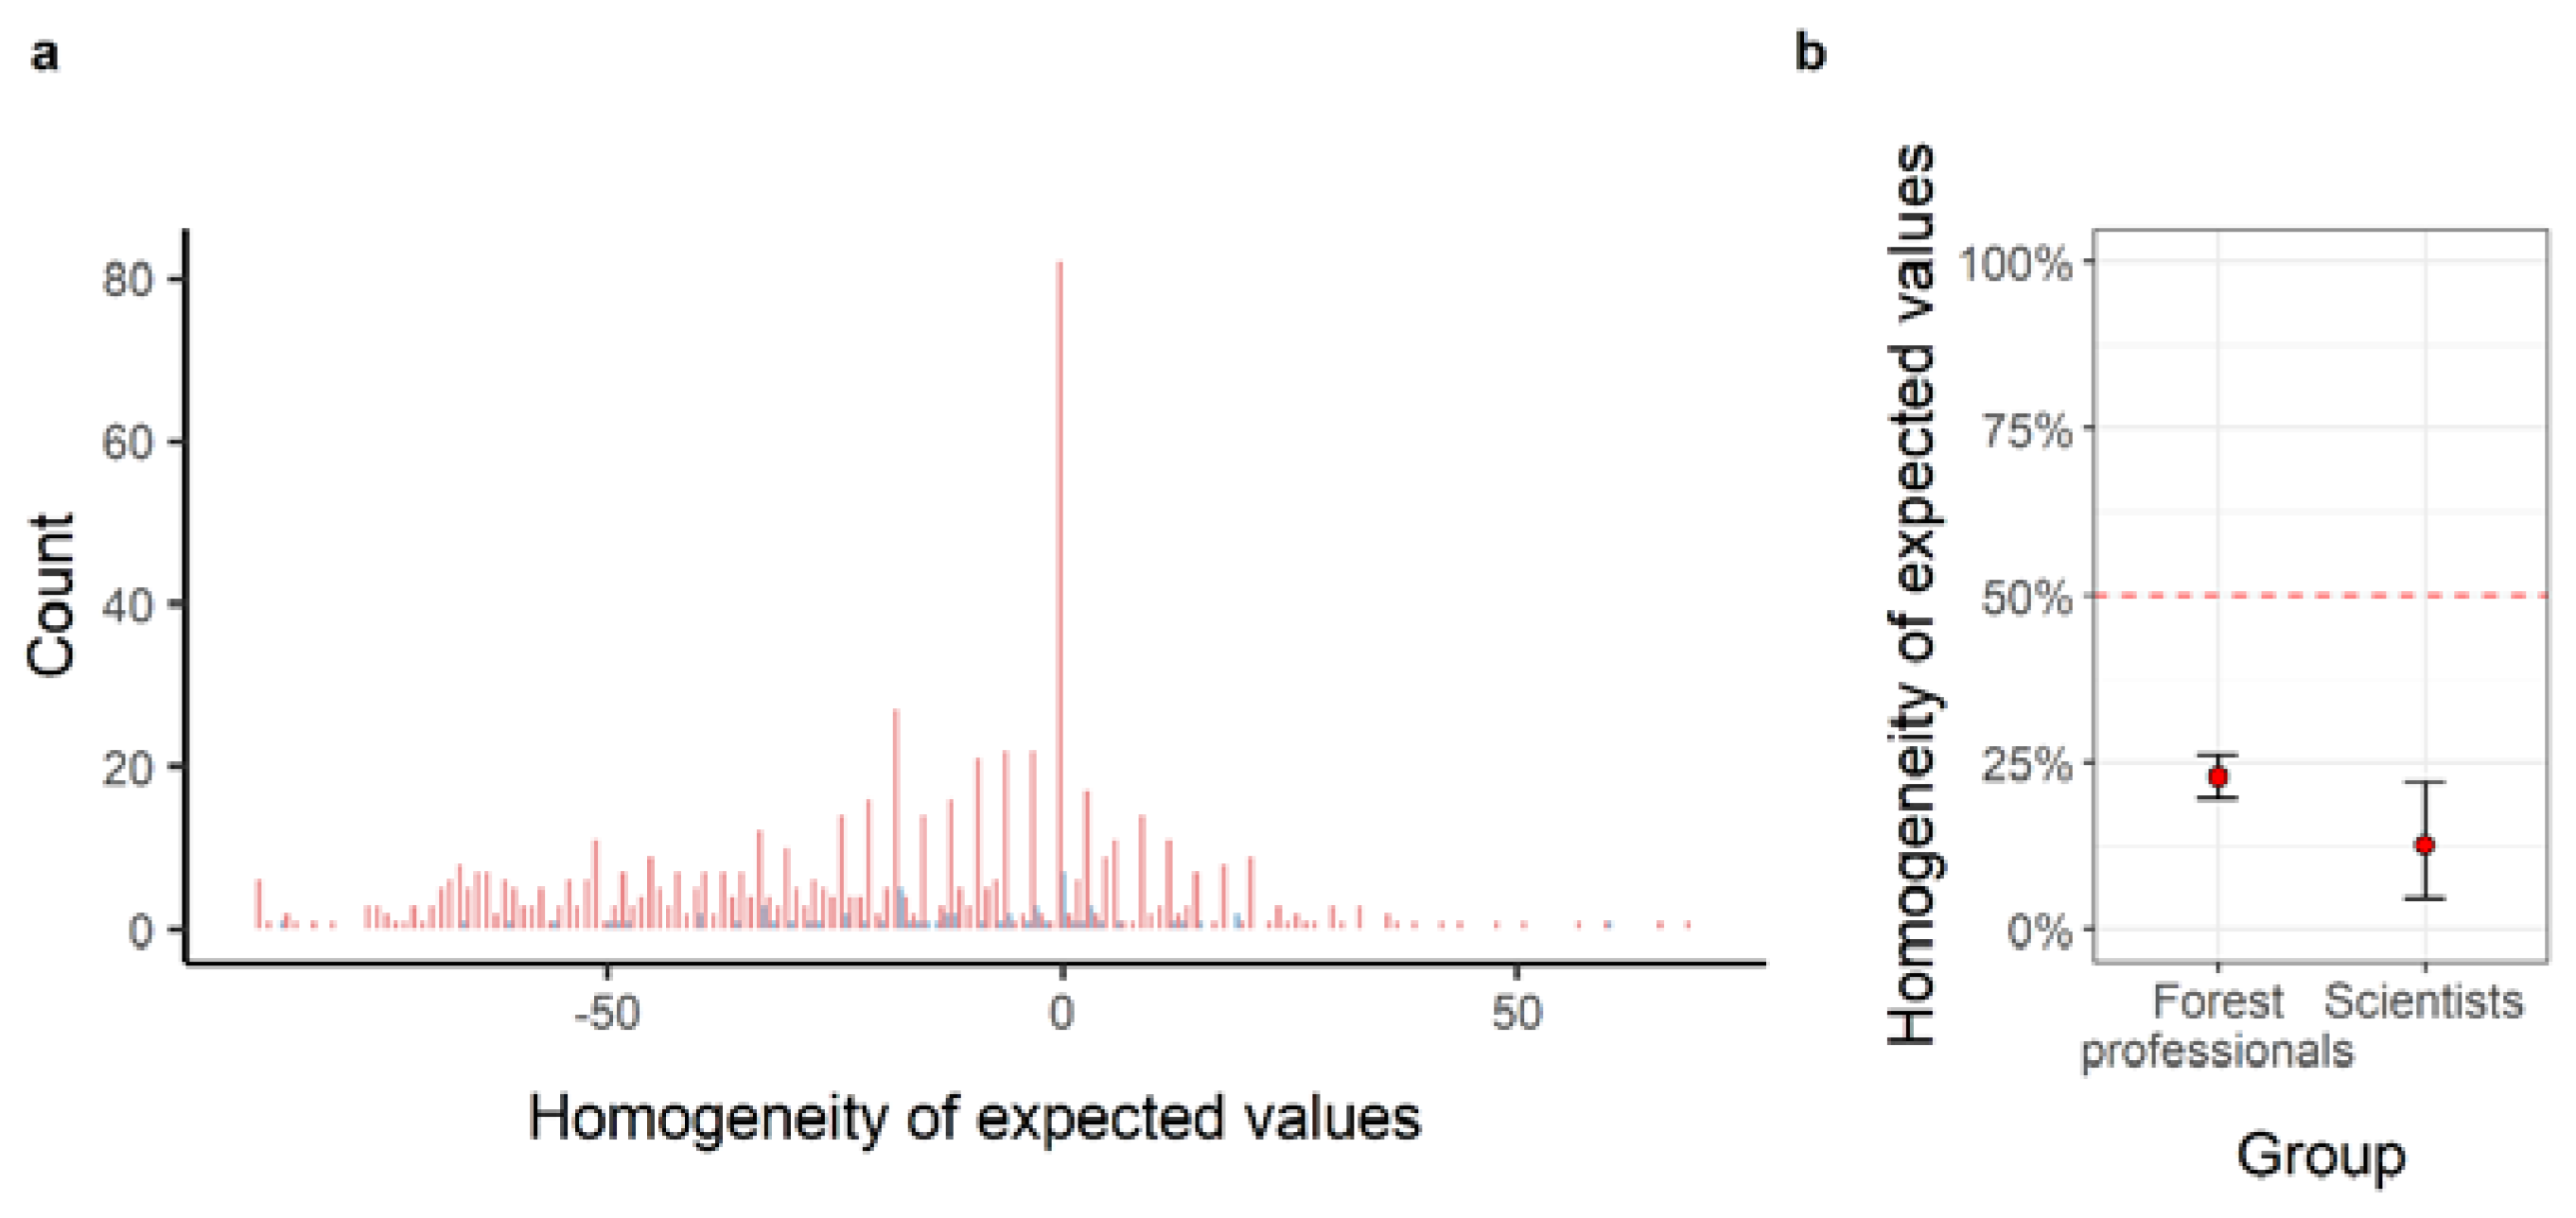
With countries pooled, substantial homogeneity of expected values was found neither among forest professionals nor scientists and no statistically significant difference between the two groups of respondents was found (
Figure 2). Hence, the homogeneity of expected values tests (1 and 2) and both affect tests (1 and 2) failed. However, the limited statistical power of 65%, because of the modest sample size of scientists, compared to recommended 80% [
20] may have played a role in limiting the significance of the comparison conducted between forest professionals and scientists (
Figure 2).
Still, without substantial homogeneity of expected values (VH), the polarization tests also failed (
Figure 2), as they did for sudden and gradual climate change effects assessed separately (
Figures S1 and S2).
It could be expected that there was a tendency to say “yes” to all questions, resulting in a net value of 0. However, this was not the case. Among the forest professionals (n = 674), 2 responded “Often” to all questions and 7 responded “Yes, always” to all questions. Among the scientists (n = 63), none responded “Often” or “Yes, always” to all questions.
Value homogeneous individuals display VH < -44 or VH > 44. Bars represent 95% confidence bands and dashed line (red) corresponds to the test limit for a value homogeneous population (Operational homogeneity of expected values test 1). Power analysis revealed that for each group the effect size observed has a 100% probability of detecting that less than 50% of the population of respondents were value homogeneous (Operational homogeneity of expected values test 1) when there is an effect there to be detected. Power analysis also revealed that between-groups comparison of effect size has a 65% probability of detecting that the forest professionals were more value homogenous than the scientists (Homogeneity of expected values test 2) when there is an effect there to be detected, and an n of approximately 99 scientists would be needed to obtain statistical power at the recommended 80% level [
20]. For both scientists and forest professionals, VH shifted moderately towards more negative values where sudden climate effects were concerned (
Figure S1). However, the mode for VH was 0 for both types of effects among both populations of respondents (
Figure S1).
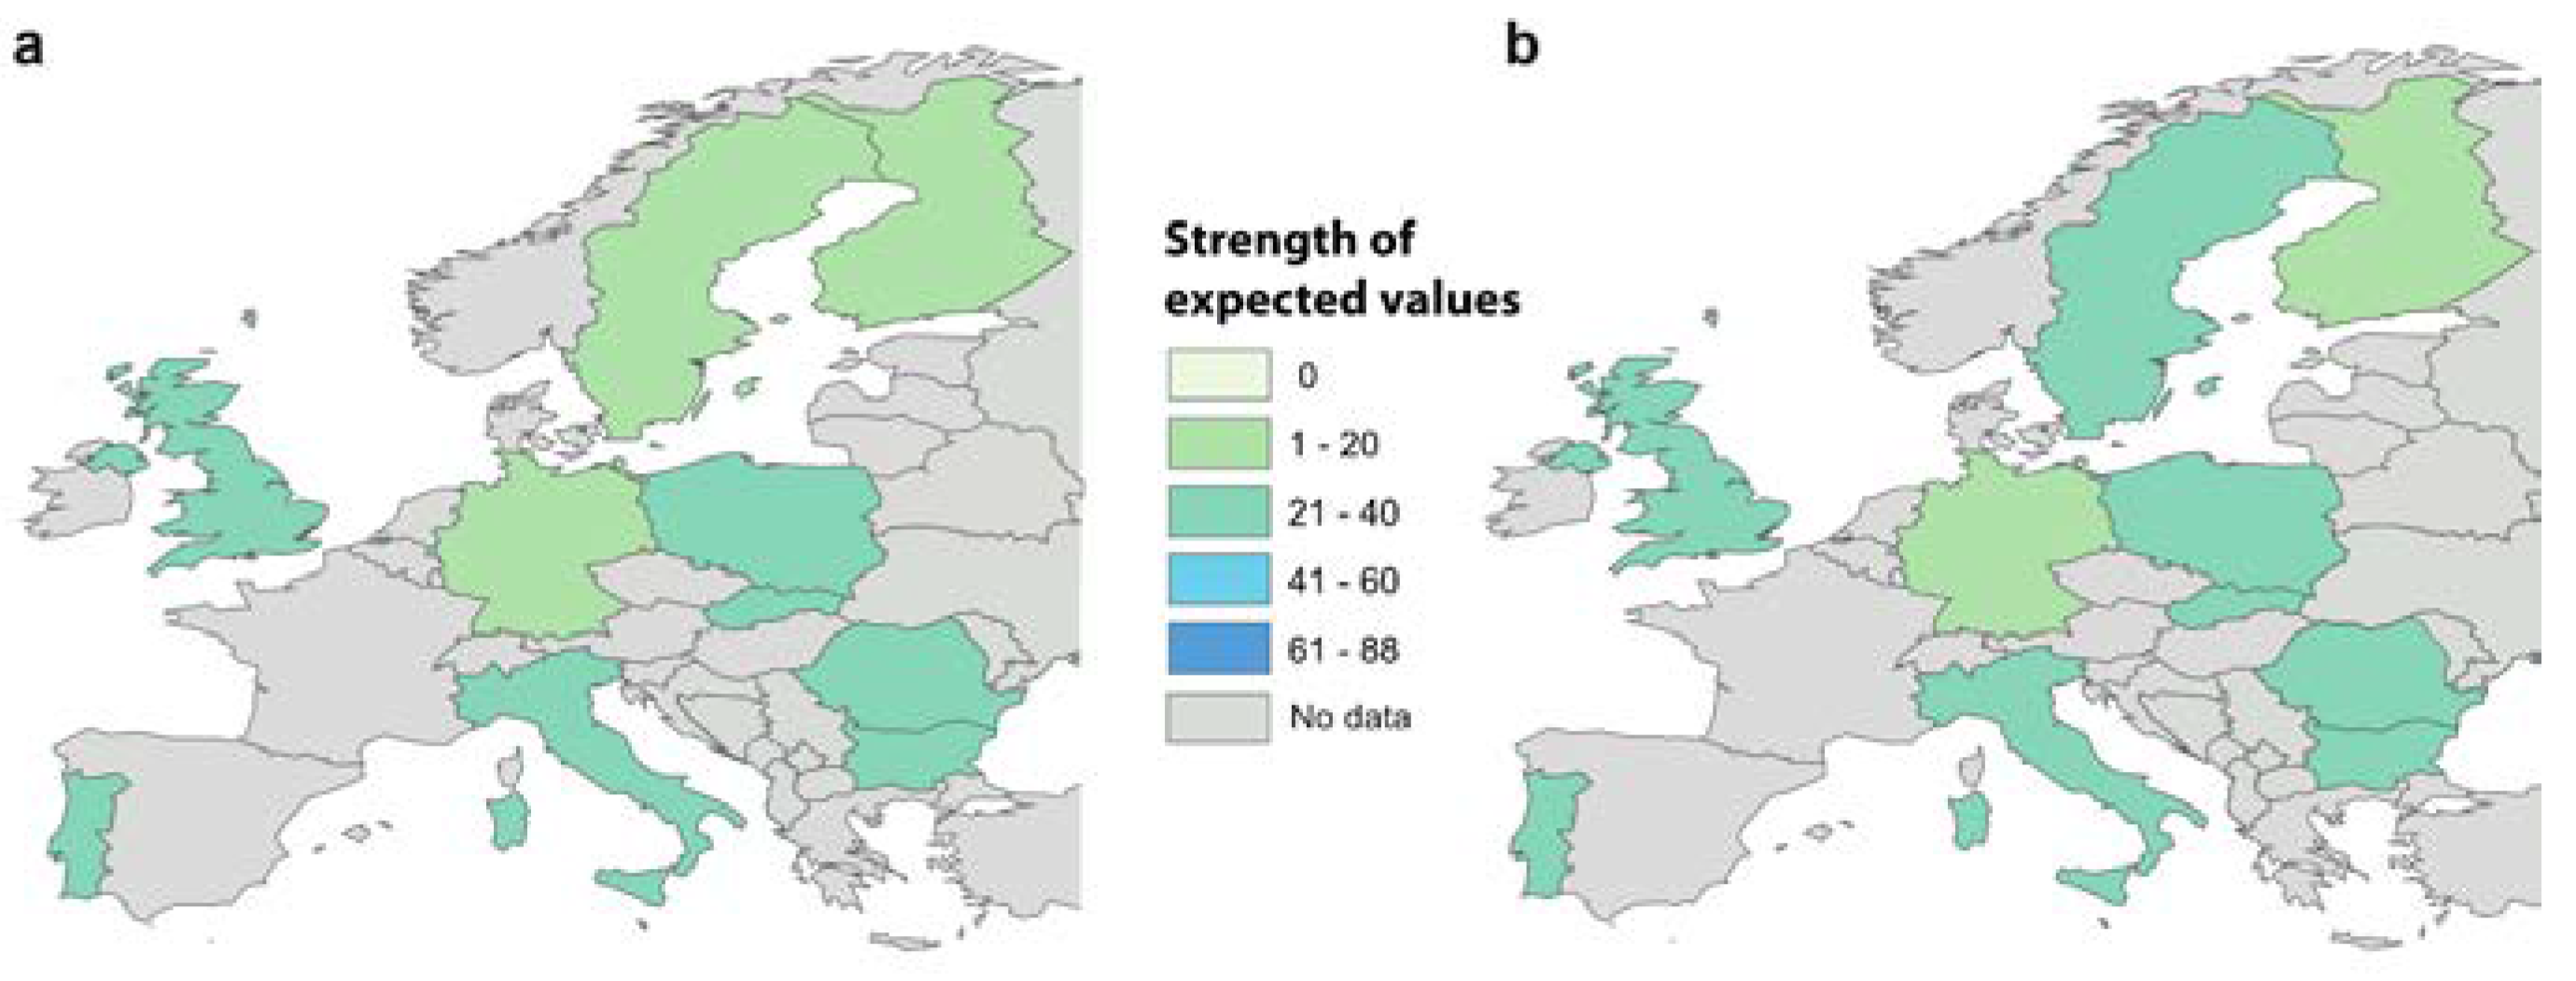
The pattern was more complex when differences among individual countries were considered. This can be seen already by looking at strength of expected values (VS) (
Figure 3). If VS = 0, no determinate values are assigned to the effects on any of the objects. Hence, there can be no homogeneity of expected values. In fact, the VS mode was 0 in almost all European countries for gradual effects (except Sweden and Slovakia) and in the majority of European countries for sudden effects (
Figure S3).
Median strength of expected values for (a) sudden and (b) gradual expected climate change effects. Base map modified from GISCO - Eurostat (European Commission) with Administrative boundaries: © EuroGeographics © Food and Agriculture Organization of the United Nations © Turkstat.
Some countries had an exceptionally large proportion of forest professionals with a weak strength of expected values (30% display VS = 0 in Finland for sudden changes, and 24% display VS = 0 in Poland for both sudden and gradual climate change) (
Table S3). In three European countries (Finland, Germany, and Sweden) the median VS was close to zero for sudden changes, and in two it was close to zero for gradual changes (Finland and Germany) (
Figure 3). The median VS for the other European countries was in the interval 21–40, which is equivalent to assigning it a determinate value (i.e., stating that the gradual or sudden changes always or often have a negative or positive effect) in > = 5 but < = 10 of the 44 scenarios.
The mode for VH was 0 in all European countries except Bulgaria and Italy for sudden climate changes (
Figure S4). Again, Finland had an exceptionally large proportion (36%) of forest professionals displaying weak homogeneity of expected values in relation to sudden changes (
Table S3).
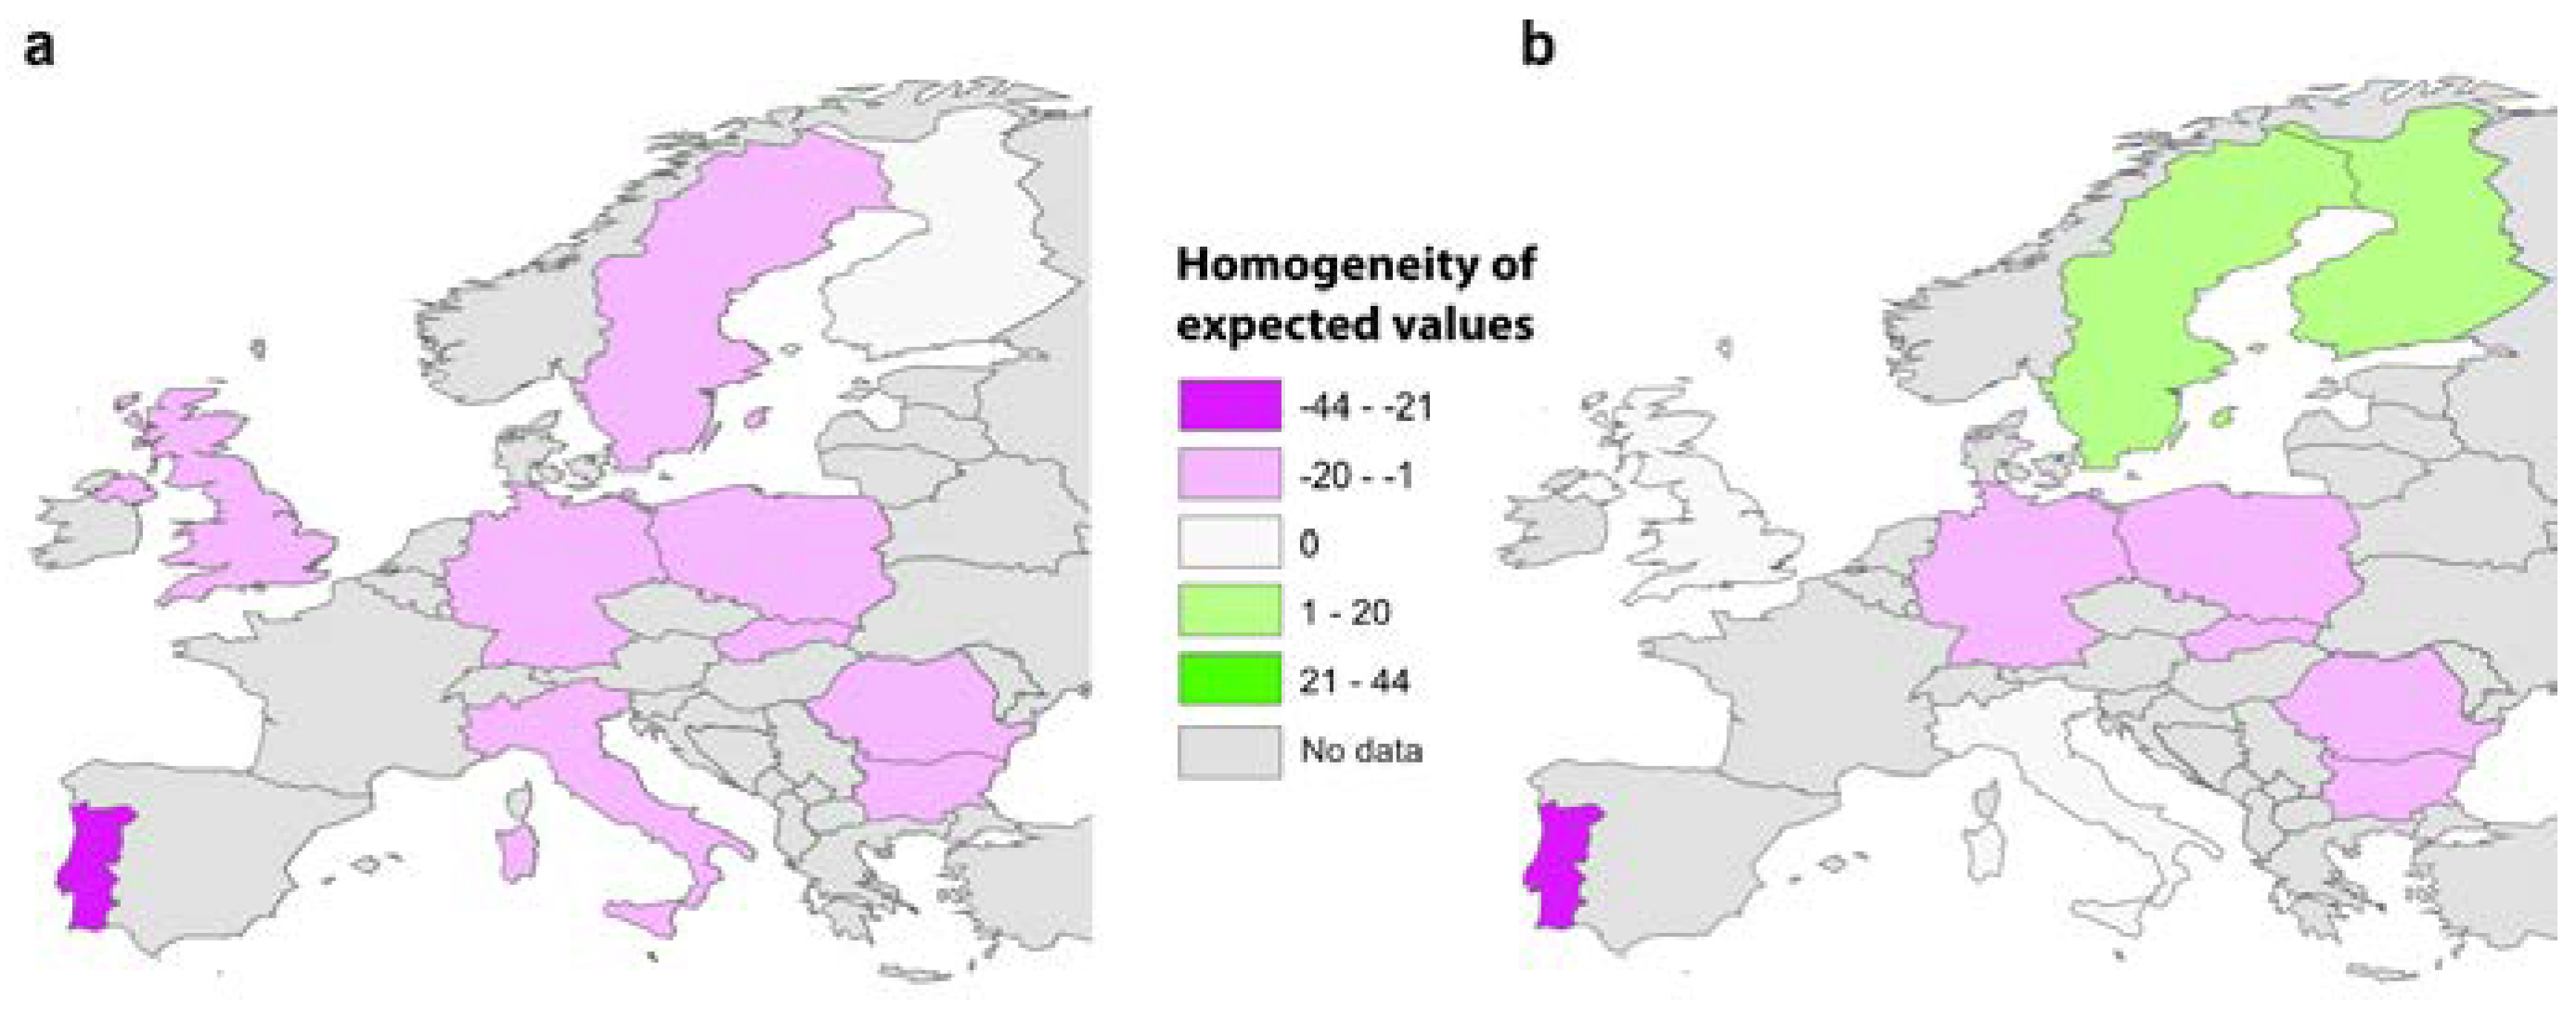
Finland and Sweden were the only countries with a clearly positive median VH (for gradual changes) (
Figure 4). For sudden changes, the median of VH was most positive and least negative in Finland (
Figure 4). Portugal displayed the most negative median of VH, for both sudden and gradual changes, among all the European countries analyzed.
Comparing the median of VS and VH values, we found that there was no indication of polarization in Portugal (
Figure 3;
Figure 4). The VS and VH values were almost equal, proving that the homogeneity of expected values in Portugal was one-sided (as in bottom left panel in
Figure 1) and negative.
There were four countries where the median values of VS and VH differed, a fact that might indicate polarization: Sweden (gradual changes), UK (gradual changes), Poland (gradual changes), and Italy (gradual changes). However, all four countries exhibited very little homogeneity of expected values. This is explained by a high variation within individuals in these countries, who had negative as well as positive expectations about climate change.
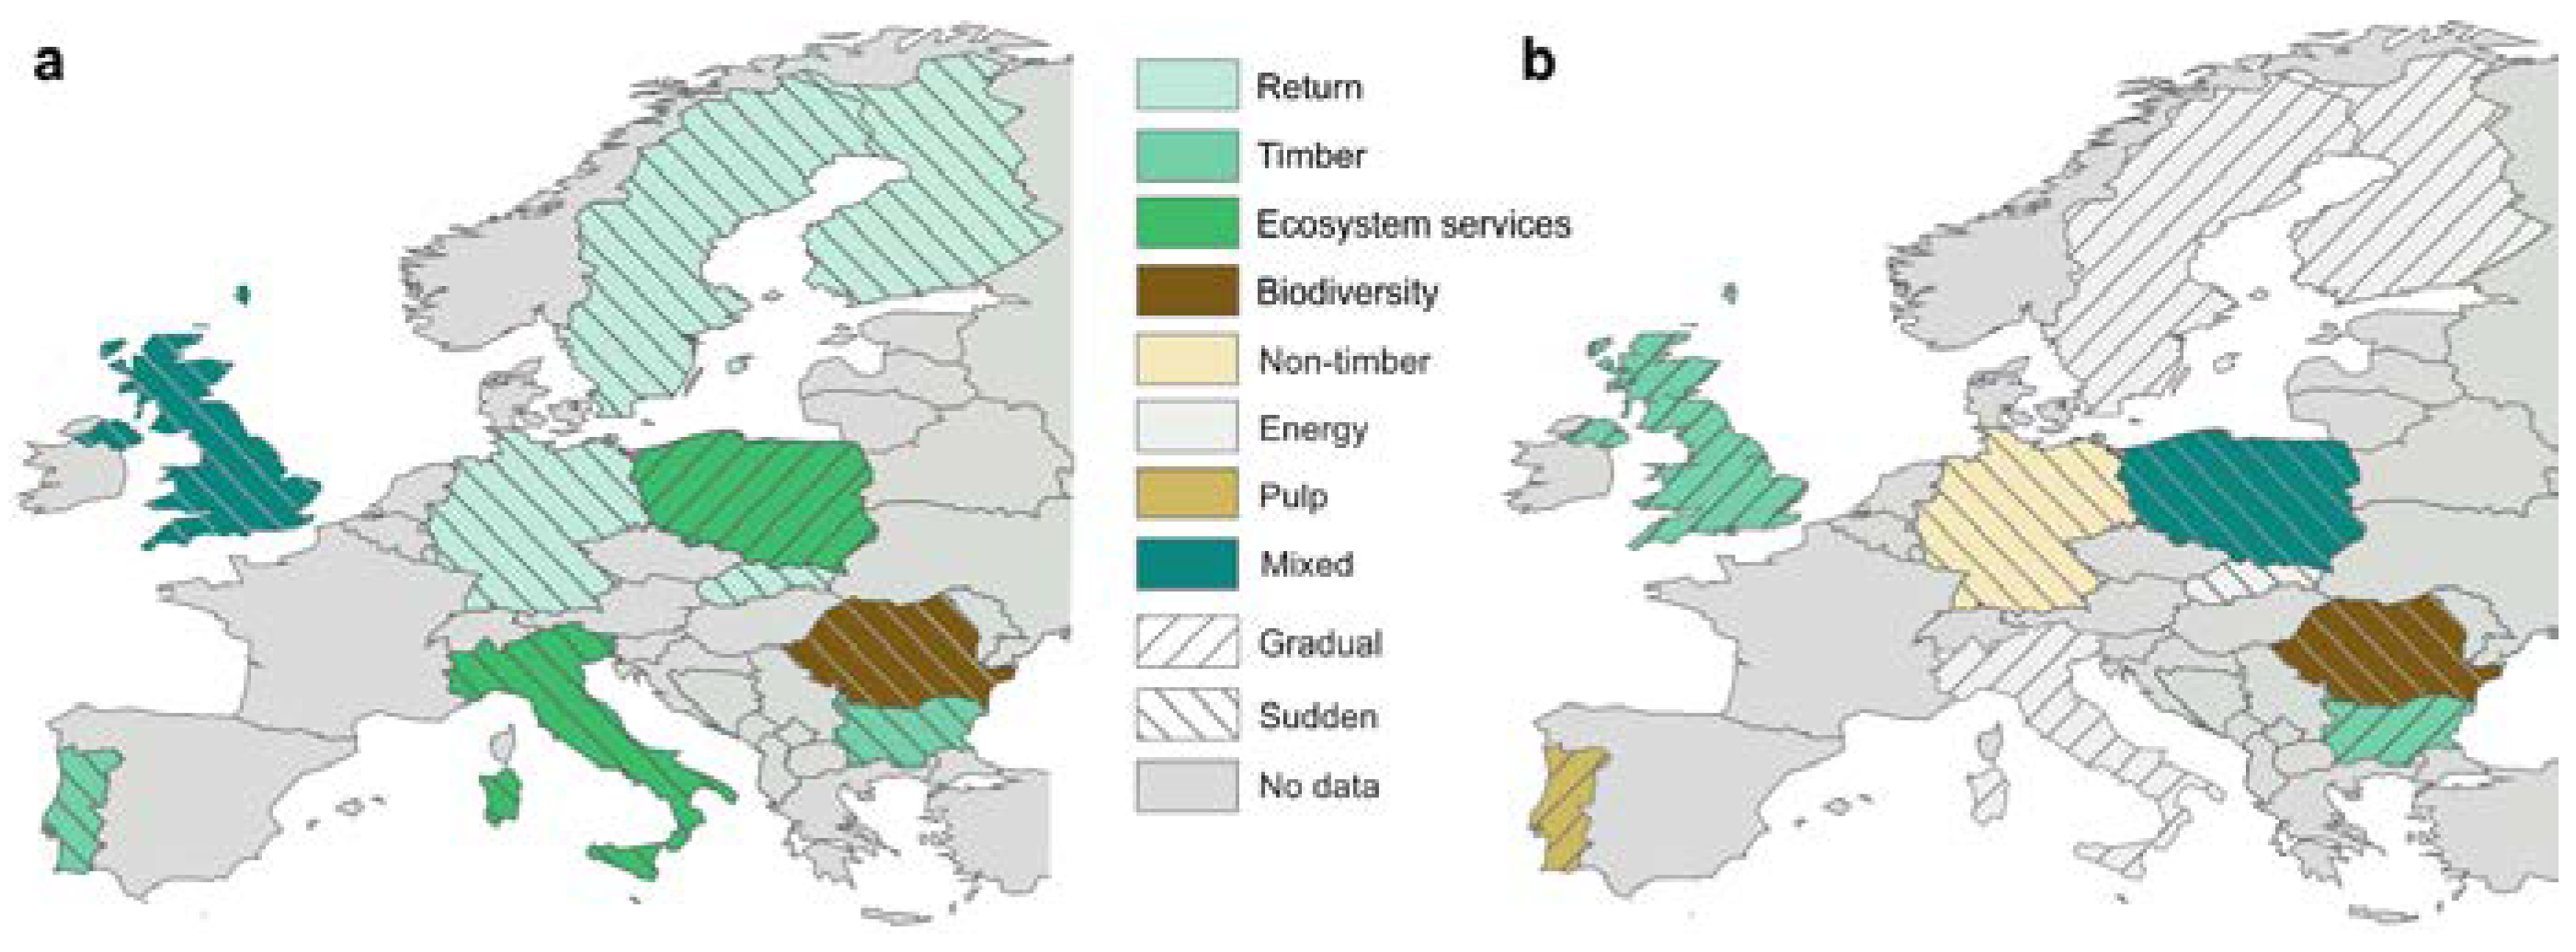
At the European level, a gradient of homogeneity of expected values from the North/North-East to the South/South-West emerged, particularly when sudden climate changes were considered. The aggregated determinate values of the expected effects in Northern European countries were more neutral than they were in Southern countries, where they were more negative. Expectations for impacts on timber production, economic returns, and regulatory ecosystem services were mostly negative, while expectations for biodiversity and energy production were mostly positive. Also, in some cases sudden and gradual changes were expected to have opposite effects on the same object (e.g., timber production in Bulgaria and biodiversity in Romania) (
Figure 5).
In the UK, sudden negative effects on timber and ecosystem services scored equal, while in Poland sudden positive effects on biodiversity and economic return scored equal.
4. Discussion
Our findings showed that European forest professionals and scientists did not exhibit polarized expectations about the values of specific impacts of climate change on forests in their countries. We were thus not interested in measuring, for instance, political or ideological polarization, e.g., [
21,
22] per se. Rather we wanted to assess the extent to which such political or ideological polarization—if it does exist among forest professionals and scientists—had an effect on values related to the expected effects of climate change.
The results suggested that the effect size of affects, cultural values, and ideological polarization were not so large that they could reasonably be expected to overwhelm the cognitive processes associated with forest professionals’ and scientists’ deeply considered responses to the effects of climate change.
However, there are interesting differences in the expected values of forest professionals with regard to climate change impacts across European countries, and this is something that could be of fundamental importance in the design and efficacy of climate change communications. In the Northern European countries, the aggregated values of the expected effects were more neutral than they were in Southern Europe, where they were more negative.
The potential influence of the affect heuristic [
8] ought to be considered when climate-related decision-making is analyzed, since “reliance on affect is generally a quicker, easier, and more efficient way to navigate in a complex, uncertain, and sometimes dangerous world” [
23] (p. 322). However, the affect heuristic does not necessarily operate in the deeply considered responses of forest professionals and scientists seeking to promote adequate adaptation and mitigation measures for the expected effects of climate change on forests. In this study, neither the forest professionals nor the scientists, across 10 European countries, were value homogeneous in the way that would be expected if polarization mechanisms, such as affect heuristics, were in play (
Figure 2). Nor were the forest professionals more value homogeneous than scientists (
Figure 2), although a modest number of scientist respondents somewhat reduced the power of the homogeneity of expected values test (see
Figure 2).
For both the forest professionals and the scientists, the homogeneity of expected values (with a negative value) was moderately higher for sudden changes (
Figure S4). Moreover, according to Slovic [
24], negative events can destroy trust more efficiently than positive (trust-building) events can create it, because the former are usually more noticeable, and because positive events, while they are sometimes visible, are often fuzzier and indistinct [
24]. Hence, almost by definition, gradual changes are less visible than sudden changes. In light of this, it makes sense that sudden negative effects were expected to occur more frequently than gradual negative changes (
Figure 4 and
Figure S1).
We are not asserting that because the tests failed, the affect heuristic is absent. Our conclusion is the more cautious one that the hypothesis that the heuristic has a vital role in accounting for expected values among the forest professionals and scientists could be rejected in the case we examined. We acknowledge that it is difficult to generalize from this finding to real-life decision-making. The influence of the affect heuristic might explain why these judgments change under time pressure or after being exposed to negative/positive information, e.g., [
25].
Throughout the paper, we assumed that mechanisms such as the affect heuristic, cultural perspectives, or ideological polarization work by modifying the way we value expected effects of climate change. However, there appear to be two ways in which the heuristic and cultural perspectives can influence risk perception and decision-making: via values or via beliefs [
26]. Cultural perspectives may influence the uptake of (scientific) evidence by affecting beliefs rather than values [
27]. To the extent that this is so, the present study could not discern the impact of affects and other values. Indeed, if cultural perspectives were to act in this way, this would explain more clearly why measuring strength of belief is such an effective way of predicting adaptation decisions in forestry [
14].
The most plausible explanation of our results, however, is that in several European countries the values of expected effects of climate change are strongly context-dependent. Given a belief–desire model of intentional action, and given also that the respondents believed in local effects of climate change, context-dependency would imply that individual valuations might have substantial explanatory power in relation to specific adaptation decisions. It is also plausible that the context-dependency of values identified herein is such that the values depend to some extent on beliefs about the further local consequences of climate change-related effects. It is not until the consequences have been mapped that the value is determined.
It is widely acknowledged that effective climate change communication requires a detailed understanding of the target audience [
4]. The similarities and differences in values of European forest professionals motivate the following observations and communication strategies:
- (1)
Previous studies have argued that polarization implies that communicators need to consider the culturally, politically, or ideologically informed worldviews of the decision-makers, see e.g., [
5], but we did not find strong indications of polarization. Culturally, politically, or ideologically informed worldviews could be important in some contexts—e.g., where subpopulations of forest professionals with certain political views are involved. However, the results of this study imply that specifically tailored communication strategies that are limited by the fear of contradicting cultural worldviews [
26] are not generally required for scientists or forest professionals in Europe.
- (2)
The hypothesis that affects and values play different roles in scientists and in forest professionals, and that the latter are more sensitive to (affect) heuristics [
10], was not corroborated by our results. However, the somewhat limited statistical power of the test conducted in this study calls for further studies comparing the homogeneity of expected values between scientists and forest professionals (see
Table S4). Our results point to the state of affairs that responses among both scientists and professionals are deeply considered and that they, therefore, can be informed by the same
kind of information as long as differences in what individual professionals and scientists need to know are acknowledged. It should also be noted that forest professionals often have acquired scientific training as part of their education.
- (3)
What needs to be known might differ between countries. In countries like Sweden where homogeneity of expected values is low (see
Figure 4) and strength of expected values is comparatively high (
Figure 3), communication initiatives need to provide detailed information explaining the causal links that make local adaptation or mitigation measures effective for reducing risk or taking opportunity. In this way, they will contribute information that is needed by the decision-making agents in their already ongoing and deeply considered responses.
- (4)
In situations where value homogeneity is high, another type of communication effort is needed. The risk implied by homogeneity of expected values is that new adaptation measures will not be taken up and tried out. Why try something new if all options yield the same value? Here, progress could be made by focusing on the effectiveness of specific adaptation and mitigation measures, and arguing that these measures, as compared with conventional ones, make a difference. In connection with this point, judging from the data acquired in this study, it might be useful to look more closely at Portugal—and to some extent Finland—where homogeneity of expected values was relatively strong.
- (5)
Finally, in cases where belief in local effects of climate change is initially weak [
28], communications that strengthen belief might be effective, even in cases with high homogeneity of expected values.

 ,
, 


