1. Introduction
Cycling is a clean and sustainable mode of transportation and an important part of a sustainable multimode urban traffic system [
1,
2,
3,
4,
5,
6]. However, as vulnerable traffic participants, cyclists are vulnerable to injury or even fatality in accidents, and their safety situation is worrying. According to the statistics of the Traffic Management Bureau of the Ministry of Public Security of the People’s Republic of China [
7], in 2017, the number of bicycle traffic accidents in China was 18,144, with 22,872 casualties and 39.74 million yuan of direct property loss. These statistics themselves likely underestimate traffic risk for cyclists, as they are based on reported crashes. Multiple studies have shown that bicycle crashes might be underestimated [
8,
9]. Some studies place the extent of underestimation at well over 50%. Most research on bicycle traffic safety focuses on the factors affecting bicycle use [
10,
11], the behavior of cyclists [
12,
13] and vehicle-bicycle conflicts [
14,
15,
16]. Chen [
17] identified a risk perception stage from the occurrence to the eventual evolution of a traffic conflict into an accident. Most traffic accidents occur due to a lack of comprehensive and timely awareness and early warning of the risks related to people, vehicles and roads. When a conflict occurs, it is difficult for a driver to control and avoid a vehicle in time. The risk of accidents can be reduced if the risk perception is strengthened, violation behavior is reduced and rapid response ability is improved. The term ‘risk’ refers to the possibility of injury to a road user caused by any physical or bodily factor or combination thereof, including obstacles on the road, slippery road surfaces, weather conditions, vehicle problems and distraction of the road user [
18]. The term ‘risk perception’ refers to the perception ability of road users. Horswill [
19] considered the perception of dangerous situations and proposed a correlation between risk perception and traffic accidents. Therefore, research on the risk perception of cyclists is needed.
In recent years, extensive studies have considered road traffic risk perception, and many scholars have conducted studies on the risk perception of cyclists from different perspectives. Some scholars have also explored the root causes of bicycle traffic accidents. For example, to better understand the causes of collisions between motor vehicles and bicycles at roundabouts, Møller [
20] studied the perception of risk and the understanding of traffic rules of cyclists in certain circumstances. The results showed that an underestimation of risk and ignorance of relevant traffic rules may lead to collisions between motor vehicles and bicycles at roundabouts and that cyclists prefer a road design that clearly defines the behaviors of road users. Some scholars have explored the main factors affecting the use of bicycles. For example, to further explore the psychological factors affecting the use of bicycles, Fernández-Heredia [
21] studied the relationship between risk perception and bicycle use. It was found that bicycle choice factors can be directly observed and measured— potential variables are related to risk perception and attitude, and the identification of these potential variables helps in developing good bicycle policies. To further explore the influence of risk perception differences among different types of cyclists on the determinants of bicycle use, Sanders [
22] studied the differences in risk perception of cyclists with different skill levels, experience and behavior. Kummeneje [
23] explored the relationship between risk perception and cyclists’ decisions regarding cycling during different seasons of the year. They discovered that the seasonal difference in perceived risk is an important factor that influence decisions regarding cycling, as well as the frequency of cycling in winter. Some scholars have further explored how to improve bicycle traffic safety using the theory of risk perception to promote the development of bicycle traffic. For example, Manton [
24] investigated risk perception through the application of psychological maps and other tools to provide a basis for improving the relevant facilities and safety of bicycle traffic. By investigating the risk perception and behavior of currently active commuter cyclists in Sao Paulo, Bösehans [
25] provided the latest information about the current situation faced by cyclists, which can help in formulating bicycle traffic development policies. Branion-Calles [
26] investigated the relationship between the availability of bicycle infrastructure and the safety awareness of more than 3000 cyclists living in six major cities in Canada and the United States. It was found that expanding the bicycle network to increase the availability of bicycle facilities may increase existing cyclists’ awareness of bicycle safety, but personal characteristics also play an important role in awareness. Wang [
27] compared the impact of intersection design features on the safety perception of different types of cyclists and found that certain design features have different impacts on the safety perception of different types of cyclists. The research results also proposed infrastructure investments for specific groups to promote the development of cycling. These studies indicate that the risk perception of cyclists is an important factor affecting the safety and development of bicycle traffic. Therefore, more research is needed to investigate the risk perception ability of cyclists.
When conducting research on risk perception, most scholars use literature reviews, characteristic analyses and other methods to determine the influencing factors. To quantify the impact of these factors on risk perception, most researchers use questionnaires combined with traffic surveys to collect data. Furthermore, scholars typically use factor analysis to integrate multiple factors into several main factors for the purpose of dimension reduction, which could ensure the integrity of questionnaire information and reduce the number of factors. For example, Dong [
28] employed factor analysis to analyze the factors with a strong correlation in collision risk perception and extracted common factors to reduce the number of dependent variables and amount of computational complexity in the model. In addition, a multifactor analysis method must be selected to analyze the survey results quantitatively. Commonly used multifactor analysis methods include the analysis of variance, discriminant analysis, cluster analysis, multiple linear regression, logistic regression, and Cox regression methods. For example, when Tova [
29] studied the risk perception of motorcycle riders and car drivers, he used variance analysis to find that the presence or absence of a driver’s license has a significant impact on driver learning, indicating that a driver’s license places certain restrictions on drivers. Anneka [
30] used binary logistic regression analysis to establish a safety perception model of cyclists in Dublin City. This paper claimed that survival analysis can be used to study cyclists’ risk perception due to the existing commonality between survival analysis and risk perception analysis. The cumulative probability of survival was applied as an index to reflect the risk perception sensitivity, and a Cox regression model was established. After the model was established, the covariates in the model were determined, and basic data were prepared. Correlation analysis of the covariates was performed. After satisfying the correlation verification, parameters in the model were estimated to obtain the model estimation results.
Bicycles are convenient, healthy, affordable and suitable for short trips. As a result, most middle school students choose to ride bicycles to school, especially in small and medium cities [
31]. However, a large number of investigations have discovered that middle school students commit serious traffic violations, such as side-by-side cycling, eating snacks, playing with mobile phones, cycling with people, chasing competitions, and group fighting [
32], which greatly increase the safety risks. How to reduce middle school student bicycle traffic accidents, improve their travel safety, and simultaneously promote the development of bicycle traffic have become key issues to resolve. According to the related literature, few studies of the risk perception of cyclists have focused on middle school students. Therefore, the proposed method is applied to the research on the risk perception sensitivity of middle school cyclists.
In this paper, firstly, the applicability of the survival analysis method is demonstrated. The cumulative probability of survival is considered as the index of the risk perception sensitivity of cyclists, and a risk perception Cox regression model is established. Secondly, middle school cyclists are considered as the research object. A combination of questionnaire and traffic conflict surveys are employed to collect data, and factor analysis is performed to quantify the data. Statistical Product and Service Solutions (SPSS) 20.0 software is used to estimate the model, and estimated results and cumulative probability of the survival distribution of cyclists’ risk perception influencing factors for the average level are obtained. The risk perception sensitivity is divided into levels according to the cumulative probability of survival. While the remaining factor means are held constant, the value of a single factor is varied to analyze the impact of different factors on the risk perception sensitivity of cyclists. The findings of this study can be used as a basis to improve the sensitivity of risk perception, prevent traffic conflicts and provide a theoretical basis for risk perception research on vulnerable traffic participants.
The remainder of this paper is organized as follows:
Section 2 introduces the Cox risk perception model, which is based on survival analysis.
Section 3 introduces the data collection and processing methods.
Section 4 presents the analysis results and discussion. Finally, the conclusion is given in
Section 5.
2. Model
Survival analysis is a method by which to analyze the survival time of organisms or human beings based on data obtained from actual investigations and measurements. This method can be applied to investigate the relationships and influence degrees between survival time and influencing factors. It has also been applied in the field of traffic engineering in recent years [
33,
34,
35]. Survival analysis focuses on not only the survival time but also the continuous change process of a termination event. As time passes, when the survival time
is reached, a termination event occurs or does not occur, and the corresponding data are defined as non-censored data and censored data, respectively.
Whether traffic conflict occurred is determined to be largely affected by cyclists’ risk perception. As the sensitivity of risk perception decreases, traffic conflict becomes increasingly likely. To be consistent with the survival analysis, the new variable (reciprocal of risk perception score) is defined. Accordingly, traffic conflict can be described as follows: as the variable increases, when the limit value is reached, traffic conflict occurs or does not occur. The definition of observed data is presented as follows. Censored data: The observation value is greater than or equal to the limit value but no traffic conflict exists. Non-censored data: The observation value is less than or equal to the limit value , and no traffic conflict exists. Therefore, survival analysis can be used to study cyclists’ risk perception.
In the analysis of cyclists’ risk perception, is obtained by calculating the reciprocal of the risk perception score, and the risk perception score is based on a five-point Likert scale. The risk perception questionnaire’s column can be added to the questionnaire. The mean of each questionnaire’s data is calculated as the risk perception score of the survey object, and the reciprocals are calculated to obtain the corresponding observation value of the survey object.
The purpose of this paper is to study the risk perception of middle school cyclists (emphasis on probabilistic risk perception (EPRP)). The level of risk perception represents the sensitivity of cyclists to traffic conflict; so the distribution of risk perception scores must be considered. However, the test value is a random variable that is affected by many factors. The Cox model is utilized in this paper to analyze the impact of covariates on risk perception. To intuitively understand the risk perception sensitivity of cyclists based on the results of the Cox model, the cumulative probability of survival is used as an index to reflect the risk perception sensitivity.
The Cox model was proposed by D. R. Cox, a British statistician, in 1972. The model has three advantages: (1) The model is a classic multifactor analysis method. (2) The model does not consider the survival time distribution (the distribution of risk perception scores is not considered in this paper). (3) The method is applicable in the presence of censored data. In this paper, an important research aim is to explore the risk perception sensitivity and influencing factors.
The distribution of the limit value
is described as a risk function that considers external factors:
In Equation (1), is the benchmark risk function, which indicates the risk rate without any external influence; is a known function; and is a parameter, which corresponds to the covariate.
The Cox proportional risk model is obtained by assuming that function
in Equation (1) is in an exponential form
:
The right side of Equation (2) is composed of and , where is an unknown nonparametric component that has no assumptions and is a parametric component. Thus, the Cox proportional risk model is referred to as a semi parametric model.
According to the relationship between survival functions
and
, the cumulative probability of survival
. This result can be combined with Equation (2) to obtain the cumulative probability of survival function of conflict considering external factors:
In Equation (3), is the benchmark continuous probability function, which indicates the probability that the observed value is greater than without considering external factors. The covariate parameter indicates that an increase in the covariate will increase the probability of conflict, and indicates that an increase in the covariate will reduce the probability of conflict. Therefore, model parameter must be calibrated to perform a quantitative analysis of the risk perception sensitivity and influencing factors.
After the model is established, the covariates in the model should be determined, and basic data should be prepared. Correlation analysis of the covariates should be performed. After satisfying the correlation verification, the parameters in the model are estimated to obtain the model estimation results.
3. Data
To determine the covariates in the model, that is, the influencing factors of risk perception, middle school cyclists were considered as the research object to analyze their risk perception influencing factors. Basic data were obtained using questionnaires and traffic conflict surveys, and the factors were quantified to transform the data into a form that can be directly employed for modeling analysis.
3.1. Survey Design
The research on the risk perception of middle school cyclists limits the subject to middle school students. We study their perception ability with respect to various external subjective and objective risks in the process of cycling. That is, the recognition, understanding and feedback of the system composed of people, vehicles, roads, environment and management, as well as the influence mechanisms of various factors in the system. On the basis of the relevant research literature, the factors shown in
Table 1 are considered, and data are collected using a questionnaire and traffic conflict survey.
3.1.1. Questionnaire Survey
The questionnaire focused on three influencing factors: cyclists’ personality characteristics, traffic safety awareness and riding behavior, and external influences. In addition, risk perception is included in cyclists’ subjective feelings. The level of subjective risk perception during cycling can be measured according to the score of risk perception based on a questionnaire. Therefore, a risk perception questionnaire column is added to the questionnaire survey, and the data are used for modeling and analyzing the risk perception sensitivity.
In summary, this questionnaire involves six parts: personal basic situation, personality characteristics, external influences, traffic safety awareness, riding behavior and risk perception. See
Appendix A for details.
According to survey data from Yanliang District, Xi’an City, China, the total proportion of bicycles, walkers and electric vehicles in the residents’ travel structure is more than 50%, which represents a slow-moving oriented traffic structure [
36]. Moreover, the travel data of middle school students (1088 in total) indicated that 48% of middle school students rode bicycles to and from school, accounting for a high proportion of the total. Therefore, middle school cyclists in this area of Xi’an city were selected as the survey objects, and a total of 500 questionnaires was distributed.
3.1.2. Traffic Conflict Survey
On one hand, the traffic conflict survey focused on the middle school students’ traffic conflict in the process of cycling. On the other hand, the survey collected objective factors, such as traffic volume, speed, conflict type, separation status of motor vehicle and non-motor vehicle, and width of non-motorized lane, which affect the risk perception of cyclists. Due to the short time of risk perception, the survey time unit of traffic volume was limited to 5 min, and the data obtained were motor vehicle traffic volume (pcu/5 min), non-motor vehicle traffic volume (bicycle/5 min) and pedestrian traffic volume (person/5 min), and the speed is presented as the spot speeds of motor vehicles and non-motor vehicles.
Guo [
37] improved the definition of traffic conflict as follows. On the road, if two or more traffic participants perceive danger during motion and static conditions, if no measures are taken, accidents will occur. Once measures are taken, accidents can be completely avoided. This process, from the perception of danger by traffic participants to the effective prevention of an accident, is referred to as traffic conflict. The traffic conflict is short-lived. To effectively observe traffic conflicts, observers are required to discriminate traffic conflicts based on the signs of traffic conflicts during investigation. Signs of traffic conflicts can be determined based on risk aversion behavior. Aversion behavior generally involves avoidance measures taken by traffic participants to avoid collision with other vehicles during travel, including braking, deceleration, steering, acceleration, steering and braking, steering and deceleration, and steering and acceleration [
38]. The sensitivity of cyclists’ risk perception can be measured by their ability to take avoidance measures in a timely manner after the occurrence of a traffic conflict. Therefore, braking, deceleration, steering, and acceleration are employed as signs of bicycle traffic conflicts in this paper. In consideration of the correspondence between the sample data, bicycle ID cards were issued to 500 students simultaneously for the questionnaire survey. The ID card was installed on the bicycle basket or handlebars of each bicycle and was removed after one week. The number and location distribution of the observation points are shown in
Figure 1. The observation times were selected to coincide with the afternoon peak and evening peak on working days. We observed the traffic conflicts of the respondents (bicycles with ID) at five observation points during the six periods from 11:30–12:30 and from 17:30–18:30 from Monday to Wednesday respectively. Each ID was recorded only once during the same observation period. In total, 1932 groups of valid data were obtained.
3.2. Data Analysis and Processing
3.2.1. Data Analysis
Questionnaire Survey
A total of 479 questionnaires were collected, 440 of which were valid after incomplete questionnaires were excluded. To ensure the validity and credibility of the data, this paper performed basic statistical analysis. (1) Sample structure analysis: there were 440 valid questionnaires in total, of which 278 were male students, accounting for 63% of the valid samples; 162 were female students, accounting for 37% of the valid samples; 253 were high school students, accounting for 57%; and 187 were junior high school students, accounting for 43%. Most students rode bicycles four times a day or more, and a few had been punished for violating traffic rules. Approximately 24% have had traffic accidents while cycling. (2) Reliability test: Cronbach’s coefficient [
39] was used to measure the reliability of the questionnaire content. Generally,
indicates very good reliability,
indicates very high reliability,
indicates high reliability,
indicates barely credible,
indicates not ideal, and
indicates that the results are not credible. The reliability coefficients of the questionnaire all exceed 0.5, so the overall reliability of the questionnaire was high, and the results of the questionnaire can be used as the basic data for the factor analysis. (3) Validity test: The KMO statistic [
40] was used as the criterion for data validity. The KMO test is used to check the correlation and partial correlation between variables, with a value between 0 and 1. If a common factor exists in the original data, the partial correlation coefficient between the variables should be very small. At this time, the closer the KMO value is to 1, the stronger is the correlation between variables, and the better is the effect of factor analysis. Generally, 0.8 <KMO <0.9 is suitable, 0.7 <KMO <0.8 is normal, 0.6 <KMO <0.7 is low, and KMO <0.6 is very low. The KMO values of the questionnaires were greater than 0.7, and the approximate chi squared values of Bartlett’s test were all significant, indicating good validity of each scale in this questionnaire.
Traffic Conflict Survey
The data obtained from the traffic conflict survey include the ID number of the rider, whether there is traffic conflict (0 indicates no occurrence, 1 indicates occurrence), motor vehicle flow (pcu/5 min), motor vehicle speed (m/s), non-motor vehicle flow (bicycle/5 min), non-motor vehicle speed (m/s), pedestrian flow (person/5 min), non-motor vehicle lane width (m), separation status of motor vehicle and non-motor vehicle (0 indicates motor vehicles and non-motor vehicles are separated, 1 indicates motor vehicles and non-motor vehicles are mixed), and conflict type (1 for motor vehicles, 2 for non-motor vehicles, 3 for pedestrians). An example of the data obtained from the survey is shown in
Table 2.
According to the basic analysis of the survey data, the data collected from the traffic conflict survey can be directly used for modeling analysis. When we analyze the specific impact of the four factors on the risk perception, namely, personality characteristics, external influences, traffic safety awareness and riding behaviors through the questionnaire survey, conversion of the 24 question items in the questionnaire into quantifiable indexes must not result in a lack of information about the factors; that is, the quantification of the cyclist factors is the focus of the following discussion.
3.2.2. Data Processing
To use the results of the questionnaire scientifically in the model, the 24 items in the scales of personality characteristics, external influences, traffic safety awareness, and riding behaviors can be regarded as initial variables, which can be transformed into key factors via factor analysis to reduce the number of variables without a loss of information.
Correlation Analysis of Initial Variables
The correlation matrix of initial variables is obtained by correlation analysis. The correlation matrix indicated a linear relationship between the factors, which met the basic requirements of factor analysis. Bartlett’s test and KMO test can be used to determine whether to use factor analysis to extract common factors. Bartlett’s test is used to check the correlation between variables in the correlation matrix, that is, to determine whether the variables are independent. The test is based on the correlation coefficient matrix. The null hypothesis is that the correlation coefficient matrix is a unit matrix. The statistics of Bartlett’s test are obtained according to the determinant of the correlation coefficient matrix. If the statistic is large and the corresponding significance level is less than the given significance level, then the null hypothesis is rejected, which indicates that the correlation coefficient matrix is not a unit matrix and that a correlation between the original variables exists, which is suitable for the factor analysis. Otherwise, the null hypothesis is accepted, and no correlation exists between the original variables, which is not suitable for the factor analysis. The results of Bartlett’s test and the KMO test are shown in
Table 3.
Table 3 shows that the observed value of Bartlett’s test statistic was 16,648.675, and the corresponding probability was close to 0. A significance level less than 0.05 indicates that the null hypothesis should be rejected. Thus, the correlation coefficient matrix and unit matrix were considered to be significantly different. Furthermore, the KMO value was 0.893, which indicated suitability for factor analysis.
The common factors were extracted by principal component analysis according to the correlation coefficient matrix of the initial variables. The initial factor analysis solutions are shown in
Table 4.
Table 4 shows that the communalities of variables were relatively high, indicating that most of the information in the variables was extracted, that the factor analysis was effective.
Extraction and Interpretation of Key Factors
The total variance decomposition table is shown in
Table 5. The ‘total’ column shows the eigenvalues of the correlation coefficient matrix; ‘% of variance’ represents the proportion of variance contributed by each eigenvalue, and ‘cumulative%’ represents the cumulative contribution of the first n main factors. When the first six main factors were retained, the cumulative contribution rate was 76.955%; that is, 76.955% of the original information was extracted.
The core aim of factor analysis is to solve the factor loading matrix based on the sample data. In this paper, principal component analysis [
41,
42,
43,
44] is used to solve the factor loading matrix. As the key factors in the initial factor loading matrix have no significant effect on the interpretation of the original variables and the actual meaning of the factors is relatively fuzzy, the factor loading matrix must be rotated to make the factors interpretable. Here, variance maximization is adopted to perform orthogonal rotation of the factor loading matrix to make the factors interpretable, and the factor loading matrix after rotation is shown in
Table 6.
As shown in
Table 6, A
1–A
5 have a high load on the first factor, and the first factor mainly explains these initial variables, which represent the personality characteristics of middle school cyclists; A
6, C
1 and C
4 have a high load on the second factor, which represents the attitude towards traffic rules; B
1–B
3 have a high load on the third factor, which represents family education; B
4–B
6 have a high load on the fourth factor, which represents peer influence; B
7, C
2, C
3, D
4 and D
5 have a high load on the fifth factor, which represents cyclists' traffic safety awareness; and D
1–D
3 and D
6–D
7 have a high load on the sixth factor, which represents cyclists' riding behavior intention.
Calculation of Factor Score
The factor score coefficient was estimated via regression, and the factor score coefficient matrix is shown in
Table 7.
The factor score matrix can be used to determine the factor score function and establish a functional relationship between the factor and the original variable. Then, we can calculate the scores of each respondent corresponding to these six key factors, that is, the factor scores. The factor scores of the data from the questionnaire survey are calculated to obtain a group of data corresponding to each respondent. This group of data includes the score of the personality characteristics factor, the attitude towards traffic rules factor, the family education factor, the peer influence factor, the cyclists’ traffic safety awareness factor, and the cyclists’ riding behavior intention factor. Match the factor score data table of the same ID number with the traffic conflict survey data used to obtain the quantitative summary table of influencing factors for cyclist risk perception, which serves as the data basis for the model analysis.
4. Results and Discussion
The covariables in the model can be determined from the previously described analysis. The definitions and descriptions of each covariate are shown in
Table 8.
After the covariates were determined, three data tables of traffic conflict survey data, quantified results of cyclist influence factors, and risk perception scores were combined according to ID number to obtain basic data for Cox model analysis. Examples of the data are shown in
Table 9.
The ID in
Table 9 refers to the identity code of the respondents. The status column is used to indicate whether the cyclist experienced traffic conflict (occurrence is 1, while non-occurrence is 0). Each ID may be recorded multiple times in a traffic conflict survey. If the number of conflict occurrences is recorded more than two times, it is regarded as a conflict; otherwise it is regarded as no conflict. The conflict type is determined according to the type with a high probability of occurrence. If the probability of occurrence is the same, a random selection mode is selected for data screening. D represents the risk perception score (the score is the average score of five risk perception questions in the risk perception questionnaire), and X
1–X
14 are the values corresponding to each covariate.
Basic statistical analysis of the data is required when the Cox model is established. Generally, no obvious correlation is observed between covariates. If obvious correlations between some variables exists, this must be addressed by deleting the variables with high correlations or replacing them with new variables. The covariate correlation of the survey data is analyzed to obtain the correlation coefficients among the covariates, as shown in
Appendix B. The correlation coefficient matrix shows that the covariates of the model have a low correlation overall, so transforming or deleting the covariates is unnecessary. The covariates can be directly selected for use in the Cox model estimation.
The covariate estimation parameters of the Cox risk perception model discussed in this paper are shown in
Table 10.
In
Table 10, B represents the partial regression coefficient; SE is the standard error of the partial regression coefficient; the Wald statistic is used to test whether the overall partial regression coefficient is significantly different from 0 and obeys the
distribution; and Sig. reflects the level of significance. Generally, the results are compared at the 0.05 significance level. Exp (B) is referred to as the relative risk: a larger value indicates a stronger correlation between covariates and traffic conflict.
As shown in
Table 10, X
1 (personality characteristics), X
4 (peer influence), X
6 (riding behavior intention), X
9 (non-motor vehicle flow), X
10 (non-motor vehicle speed), and X
14 (separation status of motor vehicle and non-motor vehicle) have negative correlations with the model; that is, as their values increase, the cumulative survival function decreases, the sensitivity of risk perception decreases, and the probability of conflict risk increases. X
2 (attitude towards traffic rules), X
3 (family education), X
5 (traffic safety awareness), X
7 (motor vehicle flow), X
8 (motor vehicle speed), X
12 (pedestrian flow), and X
13 (non-motorized lane width) have positive correlations with the model, that is, as their values increase, the cumulative survival function increases, the sensitivity of risk perception increases, and the probability of conflict risk decreases. X
11 (conflict type) is a categorical variable with three levels; the Wald test statistic is 1.362; and the p value is 0.714, which indicates that this variable does not have a correlation with the model and can be disregarded in the final analysis of risk perception.
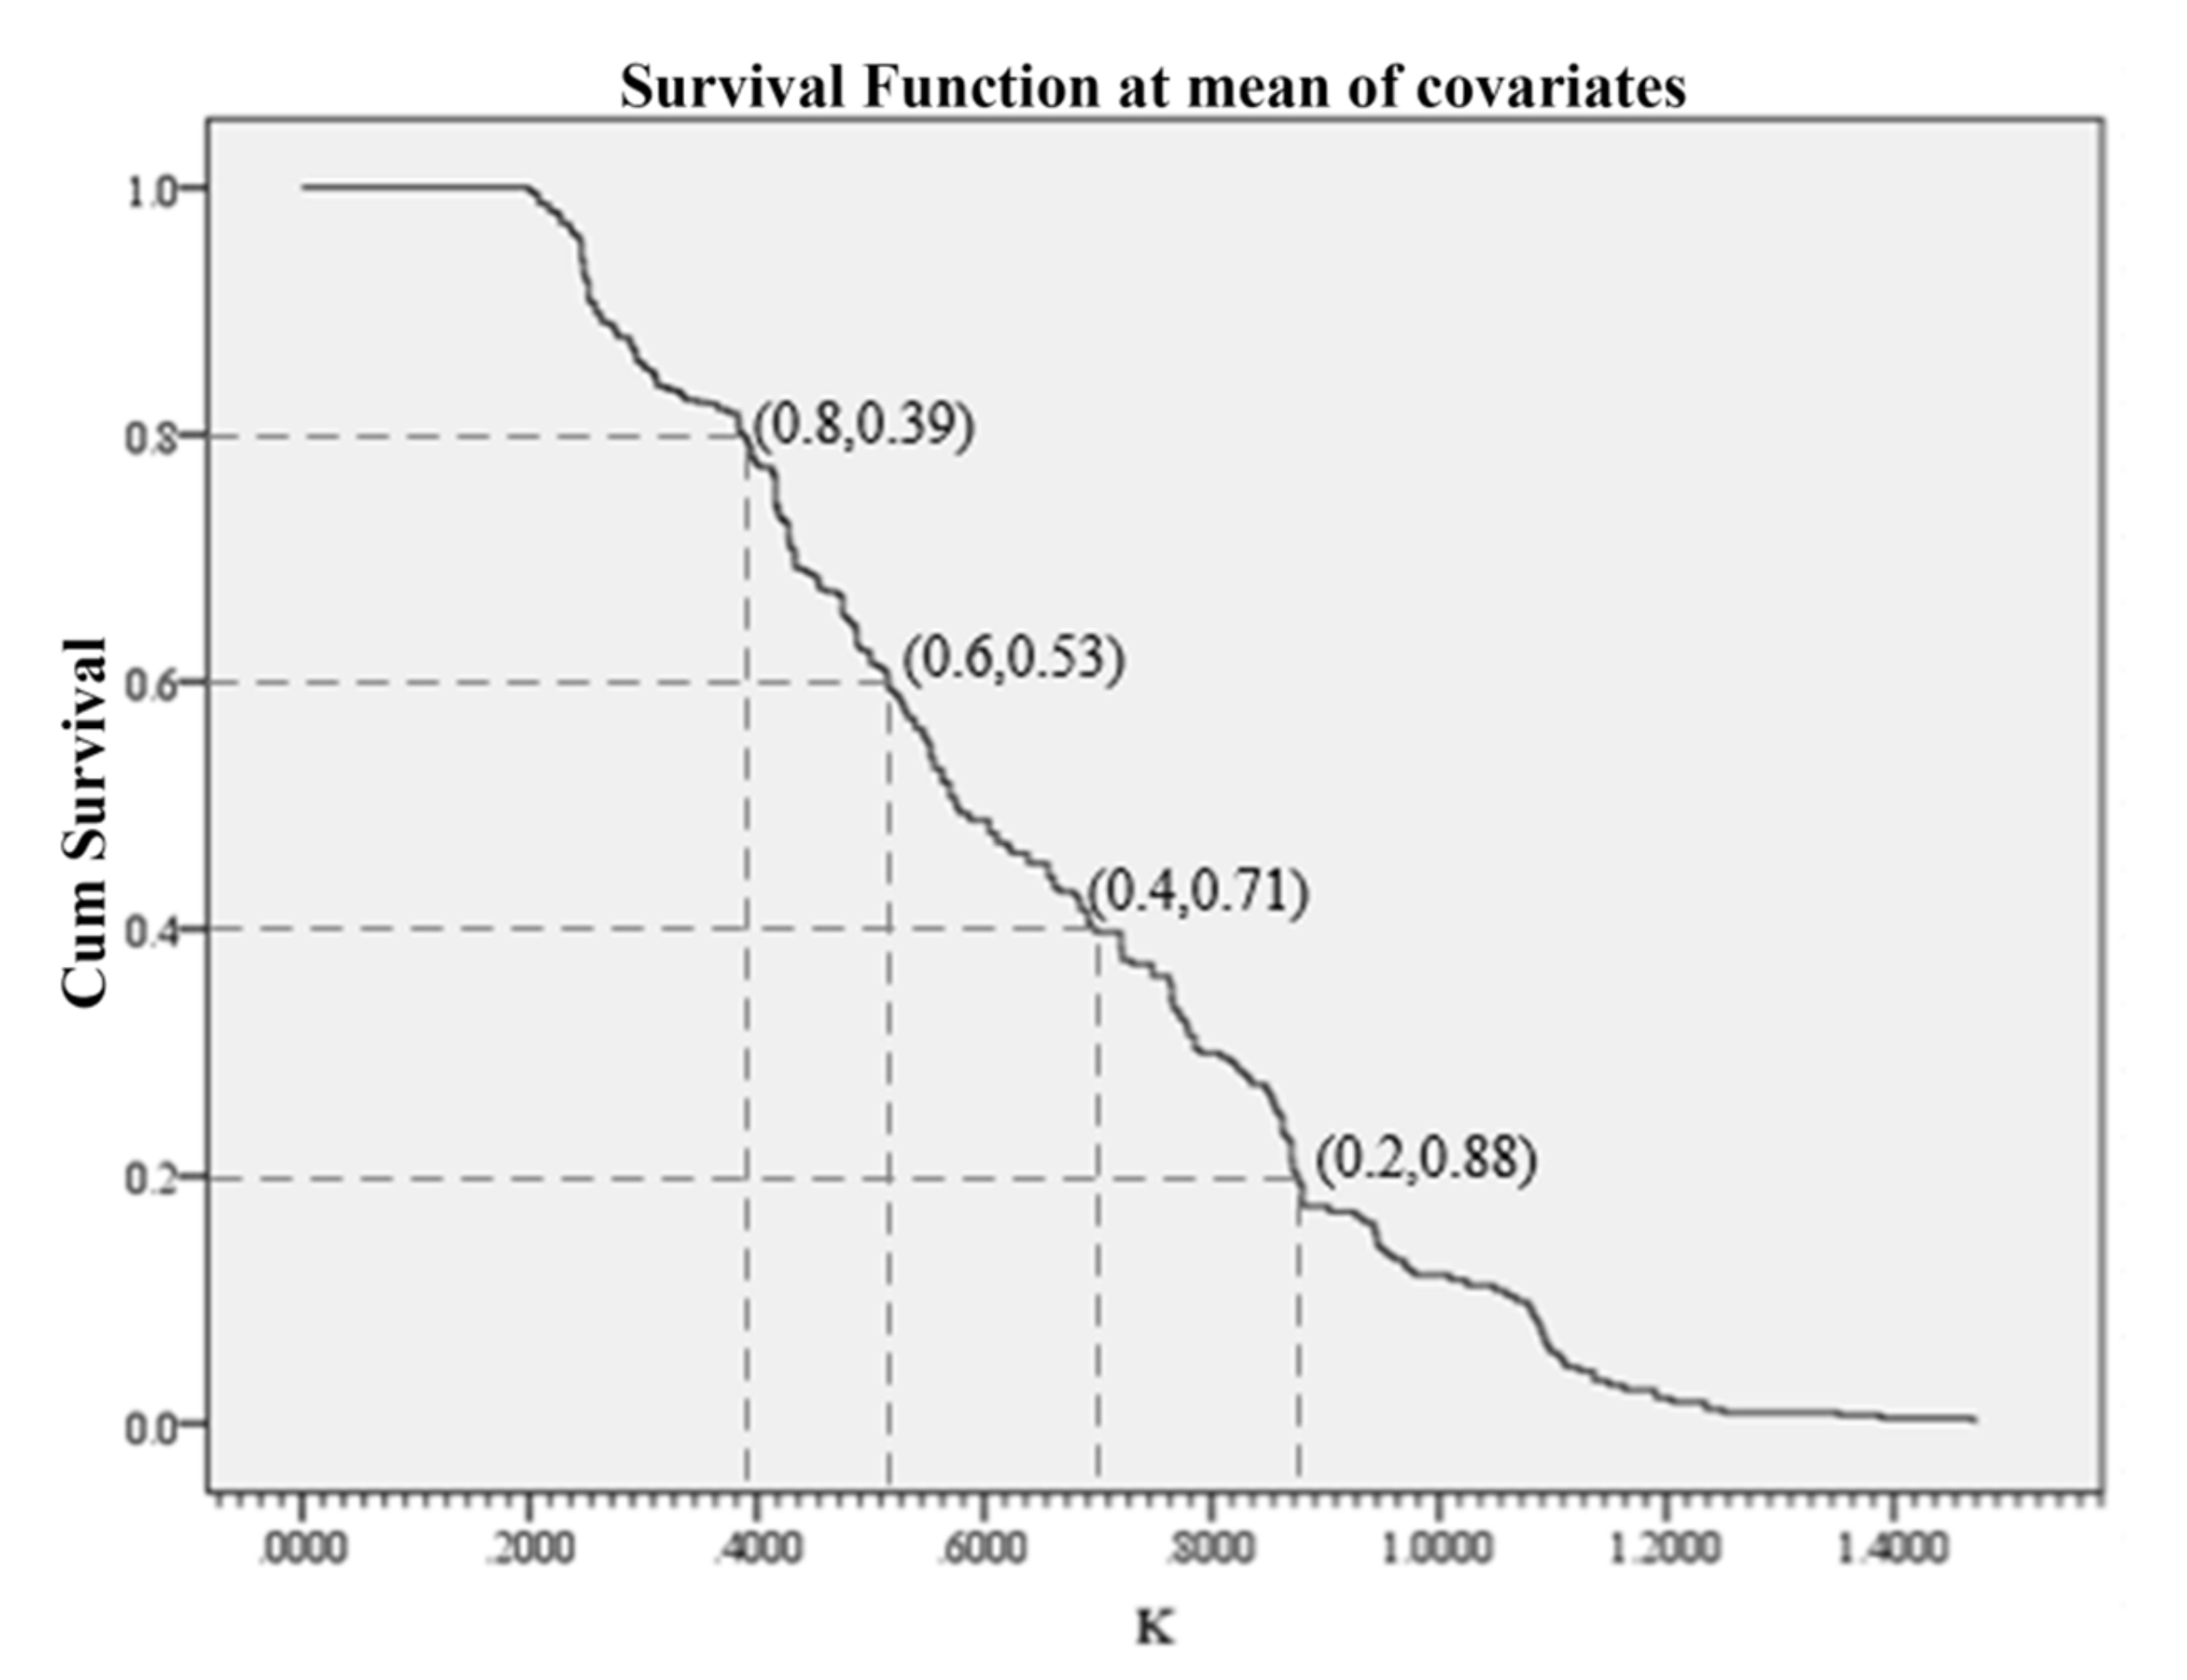
When the covariate means are taken, the survival function of middle school cyclists in traffic conflict can be obtained, which is the overall survival function, that is, the cumulative probability of survival function, as shown in Equation (4). The corresponding survival function curve, which is the cumulative probability of survival distribution of risk perception factors at the mean level, is shown in
Figure 2.
According to
Figure 2, the corresponding relationship among the cumulative probability of survival, K value and risk perception score can be obtained in the case of the covariate means. The classification of risk perception sensitivity is shown in
Table 11.
The data in
Table 11 show a strong positive correlation between the cumulative probability of survival and the risk perception score; however, dividing the risk perception score into 1–5 points on average is not simple. This is because the risk perception score reflects only the risk perception degree of the cyclists, while the cyclists themselves cannot take the road traffic condition and traffic facilities into comprehensive consideration. The scientific risk perception sensitivity measurement index should be integrated with the external influencing factors. Therefore, in practical applications, the cumulative probability of survival can be used to reflect the risk perception level of cyclists, and the classification criteria of risk perception sensitivity can be determined according to the distribution of the survival function as follows:
To ensure the safety of cyclists during a trip, when the cumulative probability of survival ranges from 60–80%, the adverse factors affecting risk perception should be analyzed and improved. When the cumulative probability of survival is less than 60%, the risk perception sensitivity of cyclists is below average. At this time, a detailed investigation should be performed to analyze the distribution of different factors, and timely measures should be taken to improve the conditions.
The estimation results of the model show the degree of influence on the traffic conflict of middle school cyclists when all the influencing factors are at their mean values. But the sensitivity of risk perception changes with the change in the covariates and affects the probability of conflict. Therefore, the value of any covariate can be changed while keeping the other covariates at their means to quantitatively analyze the survival function curve of the variable under different values, assess the change in risk perception sensitivity by analyzing the change in cumulative survival rate, and quantify the influence degrees of different covariates. According to the selection of covariates, the influencing factors of risk perception are summarized from three aspects: personal characteristics, road traffic flow conditions and road traffic facilities. When analyzing the influence of different covariates on the risk perception sensitivity, K is fixed at 0.53 (the observed value corresponds to the cumulative probability of survival of 60% in the case of the covariate means), and the value of the covariate is changed to assess the change in the survival function.
4.1. Impact of Personal Characteristics
The survival function curves of personal characteristics with different scores are shown in
Figure 3.
As shown in
Figure 3a–c, the cumulative probability of survival decreased with an increase in the covariate value while maintaining the same K value. When the score of the personality characteristics (X
1) factor increased from 1 to 4, the cumulative probability of survival decreased by 43.25%. When the score of the peer influence (X
4) factor increased from 1 to 5, the cumulative probability of survival decreased by 13.9%. When the score of the riding behavior intention (X
6) factor increased from 1 to 5, the cumulative probability of survival decreased by 20.9%. As the cumulative probability of survival decreases, the sensitivity of risk perception decreases, and the possibility of traffic conflict increases. Personality characteristics (X
1) have the greatest correlation with the risk perception sensitivity. This analysis showed that the active and extroverted personality, negative peer influence and unsafe riding behavior intention of middle school cyclists have negative correlations with their risk perception sensitivity. The reasons are detailed as follows. (1) Middle school students are in a special stage of personality development, which is characterized as having poor self-control, along with being impulsive and aggressive. These students are not calm enough during the process of cycling, and their speed of cycling is relatively fast. In addition, due to their lively and active character, the cycling behaviors of middle school students are not standardized. (2) Most middle school students have a serious herd mentality [
32]. The incorrect riding styles of friends will affect the riding behaviors of middle school students, especially running red signals, driving in the wrong direction and other violations of traffic rules. The more serious are the incorrect riding behaviors of friends, the lower is the risk perception sensitivity of middle school cyclists. (3) When cyclists are more prone to unsafe behaviors, their subjective risk perception sensitivity decreases, and unsafe riding behaviors such as chasing, arbitrarily changing lanes, and driving in the wrong direction often occur during cycling.
As shown in
Figure 3d–f, the cumulative probability of survival increased with an increase in the covariate value while maintaining the same K value. When the score of the attitude towards traffic rules (X
2) factor increased from 1 to 5, the cumulative probability of survival increased by 23.8%. When the score of the family education (X
3) factor increased from 1 to 4, the cumulative probability of survival increased by 14.8%. When the score of the traffic safety awareness (X
5) factor increased from 1 to 5, the cumulative probability of survival increased by 24.3%. As the cumulative survival rate increases, the sensitivity of risk perception increases, and the possibility of traffic conflict decreases. Cyclists’ traffic safety awareness (X
5) has the greatest correlation with risk perception sensitivity. This analysis showed that positive attitude towards traffic rules, good family education and heightened traffic safety awareness of middle school cyclists have positive correlations with their risk perception sensitivity. The reasons are detailed as follows. (1) Being able to follow traffic safety-related reports via media, such as newspapers, television, and the Internet, seriously participating in traffic safety education activities organized by the school, regularly checking whether their vehicle performance is normal, and obeying traffic rules can help improve the risk perception sensitivity of middle school cyclists. (2) Family education, especially concerning parents’ riding behaviors, can deeply affect middle school students. Parents’ standard riding behaviors and correct riding concepts can improve the risk perception sensitivity of middle school cyclists. (3) The attitude of recognizing and following traffic rules can cultivate the awareness of risk perception of middle school cyclists and improve their sensitivity of risk perception.
4.2. Impact of Road Traffic Flow Conditions
The survival function curves of road traffic flow with different scores are shown in
Figure 4.
The 5-minute motor vehicle flow (X
7) is divided into five levels: 20 vehicles/5 min, 60 vehicles/5 min, 90 vehicles/5 min, 110 vehicles/5 min and 140 vehicles/5 min. The motor vehicle speed (X
8) is divided into four levels: 6 m/s, 8 m/s, 10 m/s and 12 m/s. The 5-minute pedestrian flow (X
12) is divided into four levels: 5 person/5 min, 15 person/5 min, 30 person/5 min and 45 person/5 min. As shown in
Figure 4a–c, the cumulative probability of survival increased with an increase in the covariate value while maintaining the same K value. As the 5-minute motor vehicle flow (X
7) increased, the cumulative probability of survival increased by 32.8%. The cumulative probability of survival of the group (X
8) with the highest motor vehicle speed (12 m/s) was 21.0% higher than that of the group with the lowest speed (6 m/s). The cumulative probability of survival of the highest 5-minute pedestrian flow (X
12) group (45 person/5 min) was 21.7% higher than that of the lowest group (5 person/5 min). As the cumulative probability of survival increases, the sensitivity of risk perception increases, and the possibility of traffic conflict decreases. This analysis showed that motor vehicle flow, motor vehicle speed and pedestrian flow have positive correlations with their risk perception sensitivity. The reasons are detailed as follows. (1) When the motor vehicle flow or the motor vehicle speed is high, the fear of middle school cyclists makes their risk perception sensitivity increase. Cyclists will reduce their speeds or maintain enough safety distance from motor vehicles to decrease the possibility of a traffic conflict. (2) When the pedestrian flow is high, middle school cyclists regard pedestrians as a vulnerable traffic group with a high sensitivity of risk perception. They will reduce their speeds or maintain enough safety distance from pedestrians. In contrast, when the pedestrian flow is low, they will increase their speeds because most middle school cyclists are impulsive and adventurous, which renders them prone to traffic conflict.
The 5-minute non-motor vehicle flow (X
9) is divided into five levels: 80 vehicles/5 min, 100 vehicles/5 min, 120 vehicles/5 min, 140 vehicles/5 min and 160 vehicles/5 min. The non-motor vehicle speed (X
10) is divided into four levels: 3 m/s, 5 m/s, 7 m/s and 9 m/s. As shown in
Figure 4d–e, the cumulative probability of survival decreased with an increase of the covariate value while maintaining the same K value. The cumulative probability of survival of the highest 5-minute non-motor vehicle flow (X
9) group (160 vehicles/5 min) was 24.6% lower than that of the lowest group (80 vehicles/5 min). The cumulative probability of survival of the highest non-motor vehicle speed (X
10) group (9 m/s) was 25% lower than that of the lowest group (3 m/s). As the cumulative probability of survival decreases, the sensitivity of risk perception decreases, and the possibility of traffic conflict increases. This analysis showed that non-motor vehicle flow and non-motor vehicle speed have negative correlations with the risk perception sensitivity. The reasons are listed as follows. (1) When the non-motor vehicle flow is high, cyclists ride slowly and easily relax their vigilance, which reduces the risk perception sensitivity and increases the risk of traffic conflicts. (2) When non-motor vehicle speeds are fast, cyclists do not have enough time for risk perception and lack observations of the surrounding environment, which contributes to traffic conflicts.
4.3. Impact of Road Traffic Facilities
The survival function curves of road traffic facilities with different scores are shown in
Figure 5.
The non-motorized lane width (X13) includes 1.0 m, 2.0 m, 2.8 m and 5.0 m. The separation of motor vehicle and non-motor vehicle (X14) factor is set to 0 when motor vehicles and non-motor vehicles are separated, and set to 1 when motor vehicles and non-motor vehicles are mixed. As shown in
Figure 5a–b, when the non-motorized lane width (X13) increased from 1.0 m to 5.0 m, the cumulative probability of survival increased by 12.4%. When motor vehicles and non-motor vehicles were separated, the cumulative probability of survival was 14.6% higher than that when motor vehicles and non-motor vehicles were mixed. As the non-motorized lane width and use of isolation facilities increases, the cumulative probability of survival increases, sensitivity of risk perception increases, and possibility of traffic conflict increases. These analyses showed that non-motorized lane width and separation facilities have positive correlations with their risk perception sensitivity. The reasons are listed as follows. (1) With a decrease in the width of a non-motor vehicle lane, traffic conflicts such as friction and rear end collisions with non-motor vehicles in the same direction become possible. (2) After separation facilities are installed, the conflict between motor vehicles and non-motor vehicles is reduced.
5. Conclusions
This paper proposes that survival analysis can be used to study cyclists’ risk perception due to a certain commonality between survival analysis and risk perception analysis. The cumulative probability of survival is employed as an index to reflect the risk perception sensitivity, and a Cox regression model is established. The proposed method is applied to a group of middle school cyclists, and the factors affecting their risk perception are analyzed. Data are collected by questionnaires and traffic conflict surveys. As the cyclist factors are personal subjective factors, the questionnaire contains many question items. To ensure the integrity of the questionnaire information and reduce the number of factors, a factor analysis method is applied to quantify the cyclist factors, which are categorized into six key factors: personality characteristics, attitude towards traffic rules, family education, peer influence, traffic safety awareness and riding behavior intention.
Three types of covariates—personal characteristics, condition of road traffic and condition of road facilities—were determined in combination with the risk perception influencing factors. Correlation analysis of the covariates was performed. After satisfying the correlation verification, parameters in the model were estimated based on the processed data. The cumulative survival probability distribution of the risk perception factors at the mean level was obtained, and the sensitivity level of risk perception was classified according to the cumulative survival rate. The model results showed that active and extroverted personality, negative peer influence, unsafe riding behavior intention, non-motor vehicle flow, non-motor vehicle speed, and a lack of separation facilities have negative correlations with risk perception sensitivity. With an increase in the covariate value, the cumulative probability of survival decreased. Meanwhile, the sensitivity of risk perception decreased, and the possibility of traffic conflict increased. Positive attitude towards traffic rules, good family education, heightened traffic safety awareness, motor vehicle flow, motor vehicle speed, pedestrian flow, and non-motorized lane width have positive correlations with the risk perception sensitivity. With an increase in the covariate value, the cumulative probability of survival increases. Meanwhile, the sensitivity of risk perception increased, and the possibility of traffic conflict decreased. The conflict type has no correlation with the risk perception sensitivity. In addition, the value of a single factor was changed while maintaining the remaining factors at their means to quantitatively analyze the single factor impact on risk perception sensitivity. The findings of this study can be employed as a basis to improve the sensitivity of risk perception, prevent traffic conflicts and provide a theoretical basis for risk perception research on vulnerable traffic participants.
According to the method proposed in this paper, risk perception research for other groups, such as commuter cyclists, sharing cyclists, and electric cyclists, can be considered in the future. The method can be employed to analyze their risk perception factors and propose improvement measures and suggestions to promote the sustainable development of bicycle traffic.
Author Contributions
Conceptualization, D.Z. and S.Z.; Data curation, D.Z.; Formal analysis, L.Y.; Investigation, D.Z. and L.Y.; Methodology, D.Z.; Project administration, S.Z. and B.Z.; Resources, S.Z. and B.Z.; Software, D.Z. and S.J.; Supervision, S.Z.; Validation, D.Z.; Visualization, S.J.; Writing—original draft, D.Z.; Writing—review and editing, S.Z., B.Z. and S.J. All authors have read and agree to the published version of the manuscript.
Funding
This research was funded by the China Postdoctoral Science Foundation, grant number 2015M582593; the Natural Science Basic Research Plan in Shaanxi Province of China, grant number 2018JQ5147; the National Natural Science Foundation of China, grant number 71871029; and the Fundamental Research Funds for the Central Universities, CHD, grant numbers 300102218401, 300102219306, and 300102218404.
Acknowledgments
The authors would like to thank the staff and students of the School of Highway who helped in dissemination and data collection.
Conflicts of Interest
The authors declare no conflicts of interest.
Appendix A
Table A1.
Questionnaire on the risk perception of cyclists.
Table A1.
Questionnaire on the risk perception of cyclists.
| Personal Information |
| Gender: □man □woman | Education: □junior high school
□high school |
| Age: □11–13 □14–16 □17–19 □20–22 |
| Do you go to school by bike: □Y □N |
| Average cycling times per day: □1 □2 □3 □4 □≥5 |
| Have you been punished for violating traffic rules: □Y □N |
| Have you ever had a traffic accident while cycling: □Y □N |
| Personality characteristics |
| Code | Questions | Strongly disagree | Disagree | Unsure | Agree | Strongly agree |
| 1 score | 2 score | 3 score | 4 score | 5 score |
| A1 | 1. Sometimes do something just for adventure and excitement | | | | | |
| A2 | 2. Like to watch shocking and scary movies | | | | | |
| A3 | 3. Like the thrill of roller coasters | | | | | |
| A4 | 4. Like to sit in the audience and watch a game | | | | | |
| A5 | 5. Gorgeous colors and exaggerated things can attract me | | | | | |
| A6 | 6. To improve efficiency, the correctness of the method can be ignored | | | | | |
| External influences |
| Code | Questions | Strongly disagree | Disagree | Unsure | Agree | Strongly agree |
| 1 score | 2 score | 3 score | 4 score | 5 score |
| B1 | 1. My parents obey the traffic rules | | | | | |
| B2 | 2. My parents taught me to obey the traffic rules and ride safely | | | | | |
| B3 | 3. My parents’ attitude towards traffic rules affects me | | | | | |
| B4 | 4. To gain the attention of my peers, I will make myself conspicuous | | | | | |
| B5 | 5. Our classmates never discuss the experience of safe cycling | | | | | |
| B6 | 6. The cycling habits of my classmates and friends will affect me | | | | | |
| B7 | 7. Pay more attention to safe cycling after seeing traffic accident reports | | | | | |
| Traffic safety awareness |
| Code | Questions | Strongly disagree | Disagree | Unsure | Agree | Strongly agree |
| 1 score | 2 score | 3 score | 4 score | 5 score |
| C1 | 1. Need to obey the traffic rules when cycling | | | | | |
| C2 | 2. Carrying a companion when cycling affects traffic safety | | | | | |
| C3 | 3. Regular traffic safety education held by the school is necessary | | | | | |
| C4 | 4. Even if I am skilled in cycling, I cannot ride fast on roads with heavy traffic | | | | | |
| Riding behaviors |
| Code | Questions | Strongly disagree | Disagree | Unsure | Agree | Strongly agree |
| 1 score | 2 score | 3 score | 4 score | 5 score |
| D1 | 1. When I cycle through the intersection and the signal light turns yellow, I will not slow down but will speed up | | | | | |
| D2 | 2. I change lanes at will when cycling | | | | | |
| D3 | 3. I often chase with my companions when cycling | | | | | |
| D4 | 4. When the bicycle brake breaks, I will repair it in time | | | | | |
| D5 | 5. I don’t ride my bike while listening to music after school | | | | | |
| D6 | 6. To save time, I often ride in the reverse direction | | | | | |
| D7 | 7. When passing the crosswalk at an intersection, it is considered that there is no safety threat for pedestrians, so it is allowed to ride through without having to stop | | | | | |
| Risk perception |
| Code | Questions | Extremely dangerous | Not dangerous | Unsure | Dangerous | Very dangerous |
| 1 score | 2 score | 3 score | 4 score | 5 score |
| E1 | 1. When I ride my bike, large vehicles (turning, accelerating, or changing lanes) don’t keep a safe distance from me | | | | | |
| E2 | 2. I don’t slow down my bike when I turn on rainy days | | | | | |
| E3 | 3. When a car occupies the lane ahead, I will not slow down to prevent a car door from suddenly opening | | | | | |
| E4 | 4. When I am carried by a bicycle, I will not pay attention to the surrounding traffic conditions at any time because I am not a cyclist | | | | | |
| E5 | 5. When I was riding side by side with my partner, the non-motorized lane was almost used up, and other bicycles barely passed by | | | | | |
Appendix B
Table A2.
Correlation coefficient matrix between covariates.
Table A2.
Correlation coefficient matrix between covariates.
| | X1 | X2 | X3 | X4 | X5 | X6 | X7 | X8 | X9 | X10 | X11 | X12 | X13 | X14 |
|---|
| X1 | 1.000 | 0.012 | 0.023 | −0.220 | 0.093 | 0.171 | 0.014 | 0.020 | 0.020 | 0.019 | 0.066 | −0.030 | 0.012 | −0.013 |
| X2 | 0.012 | 1.000 | −0.002 | 0.003 | 0.034 | −0.099 | −0.521 | −0.290 | −0.057 | −0.187 | 0.097 | 0.102 | −0.161 | 0.135 |
| X3 | 0.023 | −0.002 | 1.000 | 0.035 | −0.006 | 0.010 | −0.041 | 0.044 | 0.012 | −0.026 | 0.017 | 0.017 | −0.027 | 0.051 |
| X4 | −0.220 | 0.003 | 0.035 | 1.000 | −0.009 | −0.165 | 0.045 | 0.064 | 0.100 | 0.074 | −0.265 | −0.130 | 0.044 | −0.026 |
| X5 | 0.093 | 0.034 | −0.006 | −0.009 | 1.000 | 0.254 | 0.039 | 0.054 | −0.003 | 0.030 | 0.070 | −0.050 | 0.022 | −0.051 |
| X6 | 0.171 | −0.099 | 0.010 | −0.165 | 0.054 | 1.000 | −0.008 | −0.002 | 0.001 | 0.000 | 0.094 | −0.048 | −0.018 | 0.020 |
| X7 | 0.014 | −0.221 | −0.041 | −0.045 | 0.039 | −0.008 | 1.000 | 0.014 | 0.188 | 0.077 | −0.002 | −0.590 | 0.166 | −0.088 |
| X8 | 0.020 | −0.290 | −0.044 | 0.064 | 0.054 | −0.002 | 0.014 | 1.000 | 0.059 | 0.016 | 0.031 | −0.012 | 0.051 | −0.166 |
| X9 | 0.020 | −0.057 | 0.012 | 0.100 | −0.003 | 0.001 | 0.188 | 0.059 | 1.000 | 0.091 | −0.062 | −0.083 | 0.087 | −0.078 |
| X10 | 0.019 | −0.187 | −0.026 | 0.074 | 0.030 | 0.000 | 0.077 | 0.016 | 0.091 | 1.000 | −0.025 | −0.045 | 0.067 | −0.102 |
| X11 | 0.066 | 0.097 | 0.017 | −0.256 | 0.070 | 0.094 | −0.002 | 0.031 | −0.062 | −0.025 | 1.000 | 0.027 | −0.009 | −0.056 |
| X12 | −0.030 | 0.102 | 0.017 | −0.130 | −0.050 | −0.048 | −0.090 | −0.012 | −0.083 | −0.045 | 0.027 | 1.000 | −0.044 | 0.026 |
| X13 | 0.012 | −0.161 | −0.027 | 0.044 | 0.022 | −0.018 | 0.166 | 0.051 | 0.087 | 0.067 | −0.009 | −0.044 | 1.000 | −0.049 |
| X14 | −0.013 | 0.135 | 0.051 | −0.026 | −0.051 | 0.020 | −0.088 | −0.166 | −0.078 | −0.102 | −0.056 | 0.026 | −0.049 | 1.000 |
References
- OECD. National policies to promote cycling. Organization for economic cooperation and development. In Proceedings of the European Conference of the Ministers of Transport, Paris, France, 23–29 October 2004. [Google Scholar]
- Shaw, C.; Hales, S.; Howden-Chapman, P.; Edwards, R. Health co-benefits of climate change mitigation policies in the transport sector. Nat. Clim. Chang. 2014, 4, 427–433. [Google Scholar] [CrossRef]
- Barnes, E.; Schlossberg, M. Improving Cyclist and Pedestrian Environment While Maintaining Vehicle Throughput. Transp. Res. Rec. J. Transp. Res. Board. 2013, 2393, 85–94. [Google Scholar] [CrossRef]
- Mueller, N.; Rojas-Rueda, D.; Cole-Hunter, T.; de Nazelle, A.; Dons, E.; Gerike, R.; Götschi, T.; Int Panis, L.; Kahlmeier, S.; Nieuwenhuijsen, M. Health impact assessment of active transportation: A systematic review. Prev. Med. 2015, 76, 103–114. [Google Scholar] [CrossRef]
- DiGioia, J.; Watkins, K.E.; Xu, Y.; Rodgers, M.; Guensler, R. Safety impacts of bicycle infrastructure: A critical review. J. Saf. Res. 2017, 61, 105–119. [Google Scholar] [CrossRef]
- Pucher, J.; Buehler, R. Cycling towards a more sustainable transport future. Transp. Rev. 2017, 1647, 1–6. [Google Scholar] [CrossRef]
- Traffic Management Bureau of Ministry of Public Security. Road Traffic Accident Statistics’ Annual Report of PRC (2017); Traffic Management Bureau of Ministry of Public Security: Beijing, China, 2018.
- Heesch, K.C.; Garrard, J.; Sahlqvist, S. Incidence, severity and correlates of bicycling injuries in a sample of cyclists in Queensland, Australia. Accid. Anal. Prev. 2011, 43, 2085–2092. [Google Scholar] [CrossRef]
- De Geus, B.; Vandenbulcke, G.; Panis, L.I.; Thomas, I.; Degraeuwe, B.; Cumps, E.; Meeusen, R. A prospective cohort study on minor accidents involving commuter cyclists in Belgium. Accid. Anal. Prev. 2012, 45, 683–693. [Google Scholar] [CrossRef]
- Pucher, J.; Buehler, R. Making cycling irresistible: Lessons from the Netherlands, Denmark and Germany. Urban Plan. Int. 2012, 27, 26–27. [Google Scholar]
- Li, Z.; Yang, C.; Wang, W.; Jiang, G. Bicycle commuting market segmentation analysis using attitudinal factor. J. Southeast Univ. 2012, 42, 785–786. [Google Scholar]
- Liying, W.; Kai, L.V. Bicycle following behavior at signalized intersection. J. Jilin Univ. 2008, 38, 53–54. [Google Scholar]
- Pei, W.; Peiluen, R.; Salvendy, G. Bicycle Riders’ Regulation Violation and Safety Strategy. Ind. Eng. J. 2012, 3, 136–147. [Google Scholar]
- Wang, Y.; Nihan, N.L. Estimating the risk of collisions between bicycles and motor vehicles at signalized intersections. Accid. Anal. Prev. 2004, 36, 313–321. [Google Scholar] [CrossRef]
- Zhang, R.; Chang, Y.; Zhang, P. Conflict probability of motorized and non-motorized vehicle at the access of road section. Highway 2018, 6, 40. [Google Scholar]
- Broughton, J.; Keigan, M.; Yannis, G.; Evgenikos, P.; Chaziris, A.; Papadimitriou, E.; Holló, P. Estimation of the real number of road casualties in Europe. Saf. Sci. 2010, 48, 365–371. [Google Scholar] [CrossRef]
- Wang, X. Containing traffic accidents with risk perception technology—Professor Yanyan Chen of Beijing University of Technology on avoiding accident risks. Transp. Bus. China 2011, 10, 67–68. [Google Scholar]
- Hughes, J.M.; Michel, P.J.; Rumson, W.S. The Concise Oxford Dictionary; Oxford University Press: Melbourne, Australia, 1997. [Google Scholar]
- Horswill, M.S.; Waylen, A.E.; Tofield, M.I. Drivers’ Ratings of Different Components of Their Own Driving Skill: A Greater Illusion of Superiority for Skills That Relate to Accident Involvement 1. J. Appl. Soc. Psychol. 2004, 34, 177–195. [Google Scholar] [CrossRef]
- Møller, M.; Hels, T. Cyclists’ perception of risk in roundabouts. Accid. Anal. Prev. 2008, 40, 1055–1062. [Google Scholar] [CrossRef]
- Fernández-Heredia, A.; Monzón, A.; Jara-Díaz, S. Understanding cyclists’ perceptions, keys for a successful bicycle promotion. Transp. Res. Part A Policy Pract. 2014, 63, 1–11. [Google Scholar] [CrossRef]
- Sanders, R.L. Perceived traffic risk for cyclists: The impact of near miss and collision experiences. Accid. Anal. Prev. 2015, 75, 26–34. [Google Scholar] [CrossRef]
- Kummeneje, A.M.; Ryeng, E.O.; Rundmo, T. Seasonal variation in risk perception and travel behaviour among cyclists in a Norwegian urban area. Accid. Anal. Prev. 2019, 124, 40–49. [Google Scholar] [CrossRef]
- Manton, R.; Rau, H.; Fahy, F.; Sheahan, J.; Clifford, E. Using mental mapping to unpack perceived cycling risk. Accid. Anal. Prev. 2016, 88, 138–149. [Google Scholar] [CrossRef]
- Bösehans, G.; Massola, G.M. Commuter cyclists’ risk perceptions and behaviour in the city of São Paulo. Transp. Res. Part F Traffic Psychol. Behav. 2018, 58, 414–430. [Google Scholar] [CrossRef]
- Branion-Calles, M.; Nelson, T.; Fuller, D.; Gauvin, L.; Winters, M. Associations between individual characteristics, availability of bicycle infrastructure, and city-wide safety perceptions of bicycling: A cross-sectional survey of bicyclists in 6 Canadian and US cities. Transp. Res. Part A Policy Pract. 2019, 123, 229–239. [Google Scholar] [CrossRef]
- Wang, K.; Akar, G. The perceptions of bicycling intersection safety by four types of bicyclists. Transp. Res. Part F Traffic Psychol. Behav. 2018, 59, 67–80. [Google Scholar] [CrossRef]
- Dong, L. Risk Perception of Non-Motorized Vehicles’ Unsafe Behavior. Master’s Thesis, Beijing Jiaotong University, Beijing, China, 2014. [Google Scholar]
- Rosenbloom, T.; Perlman, A.; Pereg, A. Hazard perception of motorcyclists and car drivers. Accid. Anal. Prev. 2011, 43, 601–604. [Google Scholar] [CrossRef]
- Lawson, A.R.; Pakrashi, V.; Ghosh, B.; Szeto, W.Y. Perception of safety of cyclists in Dublin City. Accid. Anal. Prev. 2013, 50, 499–511. [Google Scholar] [CrossRef]
- Li, W.; Yin, B.; Wang, H.; Guo, B. Analysis on characteristic of the traffic trip of general junior and primary school in Tianjin. In New Urbanization and Transportation Development: Proceedings of the 2013 China Urban Transportation Planning Conference and the 27th Academic Symposium; China Architecture & Building Press: Beijing, China, 2015. [Google Scholar]
- Yang, L. Study on Risk Perception of Middle School Students Cyclists. Master’s Thesis, Chang’an University, Xi’an, China, 2016. [Google Scholar]
- Paton, D.; Smith, L.; Johnston, D.M. Volcanic hazards: Risk perception and preparedness. N. Z. J. Psychol. 2000, 29, 86. [Google Scholar]
- Miller, R.G., Jr. Survival Analysis; John Wiley & Sons: Hoboken, NJ, USA, 2011; Volume 66. [Google Scholar]
- McGregor, D.E.; Palarea-Albaladejo, J.; Dall, P.M.; Hron, K.; Chastin, S.F.M. Cox regression survival analysis with compositional covariates: Application to modelling mortality risk from 24-h physical activity patterns. Stat. Methods Med. Res. 2019. [Google Scholar] [CrossRef]
- Chang’an University. Transportation Planning of Yanliang District Urban Center (2015–2020); Chang‘an University: Xi’an, China, 2014. [Google Scholar]
- Guo, W. Research on Methods of Traffic Conflict Discrimination. Master’s Thesis, Jilin University, Changchun, China, 2008. [Google Scholar]
- Essa, M.; Sayed, T. Traffic conflict models to evaluate the safety of signalized intersections at the cycle level. Transp. Res. Part C Emerg. Technol. 2018, 89, 289–302. [Google Scholar] [CrossRef]
- Peterson, R.A. A meta-analysis of Cronbach’s coefficient alpha. J. Consum. Res. 1994, 21, 381–391. [Google Scholar] [CrossRef]
- Kaiser, H.F.; Rice, J. Little Jiffy, mark IV. Educ. Psychol. Meas. 1974, 34, 111–117. [Google Scholar] [CrossRef]
- Wold, S.; Esbensen, K.; Geladi, P. Principal component analysis. Chemom. Intell. Lab. Syst. 1987, 2, 37–52. [Google Scholar] [CrossRef]
- Luo, Z.; Zhang, E. Application of principal component analysis method in calculating the weights of the indexes of the highway nodes’ importance. J. Transp. Syst. Eng. Inf. Technol. 2005, 5, 78–81. [Google Scholar]
- Jolliffe, I.T.; Cadima, J. Principal component analysis: A review and recent developments. Philos. Trans. R. Soc. A Math. Phys. Eng. Sci. 2016, 374, 20150202. [Google Scholar] [CrossRef]
- Kherif, F.; Latypova, A. Principal component analysis. In Machine Learning; Academic Press: Cambridge, MA, USA, 2020; pp. 209–225. [Google Scholar]
© 2020 by the authors. Licensee MDPI, Basel, Switzerland. This article is an open access article distributed under the terms and conditions of the Creative Commons Attribution (CC BY) license (http://creativecommons.org/licenses/by/4.0/).


